Qualitative and quantitative analysis of the pollutant ...
13
Vol. 14(11), pp. 361-373, November 2020 DOI: 10.5897/AJEST2020.2903 Article Number: F14654F65171 ISSN: 1996-0786 Copyright ©2020 Author(s) retain the copyright of this article http://www.academicjournals.org/AJEST African Journal of Environmental Science and Technology Full Length Research Paper Qualitative and quantitative analysis of the pollutant load of effluents discharged Northwestern of Lake Tanganyika, in the Democratic Republic of Congo Lumami Kapepula 1,2 , Théophile Ndikumana 2 , Musibono Dieu-Donné 3 , Patricia Luis Alconero 4 , Njoyim Estella Buleng Tamungang 5,6* , Irene Tarimo 7 and Bart Van der Bruggen 8 1 Department of Hydrology, Hydrobiology Research Center/Uvira, DR Congo. 2 Department of Chemistry, Faculty of Science, University of Burundi, Burundi. 3 Department of Environment, Faculty of Science, University of Kinshasa, DR Congo. 4 Department of Chemistry, School of Chemistry, Catholic University of Louvain, Belgium. 5 Department of Chemistry, Faculty of Science, University of Dschang, Cameroon. 6 Department of Chemistry, Higher Teachers Training College, The University of Bamenda, Cameroon. 7 The Open University of Tanzania, Tanzania. 8 Department of Chemical Engineering, Faculty of Engineering Science, KU Leuven, Belgium. Received 10 August, 2020; Accepted 12 October, 2020 The qualitative and quantitative analysis of pollutant loads from effluents discharged into Lake Tanganyika has been studied, with a view to evaluate remediation strategies. The discharge of effluents into Lake Tanganyika calls for concern as it poses serious threats to the biological wealth of the lake. Physico-chemical and microbiological parameters were evaluated for pollution from the effluent source to Lake Tanganyika (discharged point) using standard procedures. Results revealed significant pollution of the lake from prisons, the general hospital of Uvira and household channels. The prison of Uvira was the highest emitter of organic loads with a 42% chemical oxygen demand (COD), followed by the general hospital (30%) and finally households (28%). The absence of faecal coliforms, Escherichia coli and Salmonella sp. could be explained by the high concentration of chloride (varied from 1174 to 1388 mg/L) in this wastewater. The identification of latrines near the said collector reveals that 64% of septic tanks are connected directly or indirectly to the collector and 36% of indigenous latrines. The population is called upon to carry out individual sanitation, by building septic tanks that meets established standards and local authority’s requirement to assist in establishing a waste station which can mitigate the problem. Key words: Uvira, collector, Belgian technical cooperation, pollution, individual sanitation, self-purification. INTRODUCTION Lake Tanganyika is of international importance and constitutes a vital resource shared between Burundi, the Democratic Republic of Congo, Tanzania and Zambia. However, the governments of the four bordering countries and the international community are increasingly recognizing that threats to the biological wealth of the lake and the sustainable use of its resources are increasing rapidly (Cohen, 1991; West, 2001). This
Transcript of Qualitative and quantitative analysis of the pollutant ...
Vol. 14(11), pp. 361-373, November 2020
DOI: 10.5897/AJEST2020.2903
Article Number: F14654F65171
ISSN: 1996-0786
Copyright ©2020
Author(s) retain the copyright of this article
http://www.academicjournals.org/AJEST
African Journal of Environmental Science and
Technology
Full Length Research Paper
Qualitative and quantitative analysis of the pollutant load of effluents discharged Northwestern of
Lake Tanganyika, in the Democratic Republic of Congo
Lumami Kapepula1,2, Théophile Ndikumana2, Musibono Dieu-Donné3, Patricia Luis Alconero4, Njoyim Estella Buleng Tamungang5,6*, Irene Tarimo7 and Bart Van der Bruggen8
1Department of Hydrology, Hydrobiology Research Center/Uvira, DR Congo.
2Department of Chemistry, Faculty of Science, University of Burundi, Burundi.
3Department of Environment, Faculty of Science, University of Kinshasa, DR Congo.
4Department of Chemistry, School of Chemistry, Catholic University of Louvain, Belgium.
5Department of Chemistry, Faculty of Science, University of Dschang, Cameroon.
6Department of Chemistry, Higher Teachers Training College, The University of Bamenda, Cameroon.
7The Open University of Tanzania, Tanzania.
8Department of Chemical Engineering, Faculty of Engineering Science, KU Leuven, Belgium.
Received 10 August, 2020; Accepted 12 October, 2020
The qualitative and quantitative analysis of pollutant loads from effluents discharged into Lake Tanganyika has been studied, with a view to evaluate remediation strategies. The discharge of effluents into Lake Tanganyika calls for concern as it poses serious threats to the biological wealth of the lake. Physico-chemical and microbiological parameters were evaluated for pollution from the effluent source to Lake Tanganyika (discharged point) using standard procedures. Results revealed significant pollution of the lake from prisons, the general hospital of Uvira and household channels. The prison of Uvira was the highest emitter of organic loads with a 42% chemical oxygen demand (COD), followed by the general hospital (30%) and finally households (28%). The absence of faecal coliforms, Escherichia coli and Salmonella sp. could be explained by the high concentration of chloride (varied from 1174 to 1388 mg/L) in this wastewater. The identification of latrines near the said collector reveals that 64% of septic tanks are connected directly or indirectly to the collector and 36% of indigenous latrines. The population is called upon to carry out individual sanitation, by building septic tanks that meets established standards and local authority’s requirement to assist in establishing a waste station which can mitigate the problem. Key words: Uvira, collector, Belgian technical cooperation, pollution, individual sanitation, self-purification.
INTRODUCTION Lake Tanganyika is of international importance and constitutes a vital resource shared between Burundi, the Democratic Republic of Congo, Tanzania and Zambia. However, the governments of the four bordering countries
and the international community are increasingly recognizing that threats to the biological wealth of the lake and the sustainable use of its resources are increasing rapidly (Cohen, 1991; West, 2001). This
362 Afr. J. Environ. Sci. Technol. obvious and substantial increase in human activities around the lake, associated with increasing industrialization and urbanization poses environmental problems since the city of Uvira and its factories (the port and its oil depot, the Kiliba sugar refinery) and its general referral hospital have no wastewater treatment facilities, all of which, end up in Lake Tanganyika directly or indirectly via its tributary rivers (Bailey et al., 2001).
Since the beginning of the 21st century, the environment (atmospheric, terrestrial and aquatic) has been subjected to the increasing pressure of industrial and human activities, the effects of which were quickly felt. Any substance of anthropogenic or natural origin released into the environment with unfavourable biological effects is a pollutant (Moriarty, 1990) or a xenobiotic. The latter term refers to any substance which does not exist in its natural state and which is characterized by high toxicity at low concentrations (Ramade, 2000). Contaminants released into the environment end up more or less quickly in aquatic environments, especially estuarine and coastal areas, where they can have short and long-term effects (Burton, 1992).
The collector built by the Belgian Technical Cooperation (BTC) takes its source just at the foot of Mount Mitumba that is threatened by very advanced anarchic constructions due to the high population density at the base of the mountain which presents harmful effects to the environment. The population growth in the area puts the lives of inhabitants at risk as the passage of the collector exposes the area to multiple natural disasters. This collector receives a large part of the solid and liquid household waste from the inhabitants of Kakungwe quarter (Shishi avenue), the General Reference Hospital of Uvira (HGR) and the waste water from the central prison which contributes to the pollution of the environment and imbalance of the ecosystems of the lake, following the lack of an appropriate hygiene and sanitation practices (Figures 1 and 2).
The large collector built by BTC is connected to four outfalls, namely: rainwater from roof channels coming from the main entrance of Shishi Avenue which flows into the collector from upstream, Mitumba chain covering the Institut la Belle, the HGR outfall and finally the wastewater outfall of the central prison that is sufficiently loaded. Wastewater and water from collectors is channel into Lake Tanganyika, which constitutes pollution that can contribute to imbalances in ecosystems. It should be noted that the city of Uvira has no sewage system, nor a liquid and solid waste treatment station. Consequently, all the waste produced by households, both solid and liquid, is discharged into the drains of several avenues in the town to be channelled to the lake (Lumami et al., 2016).
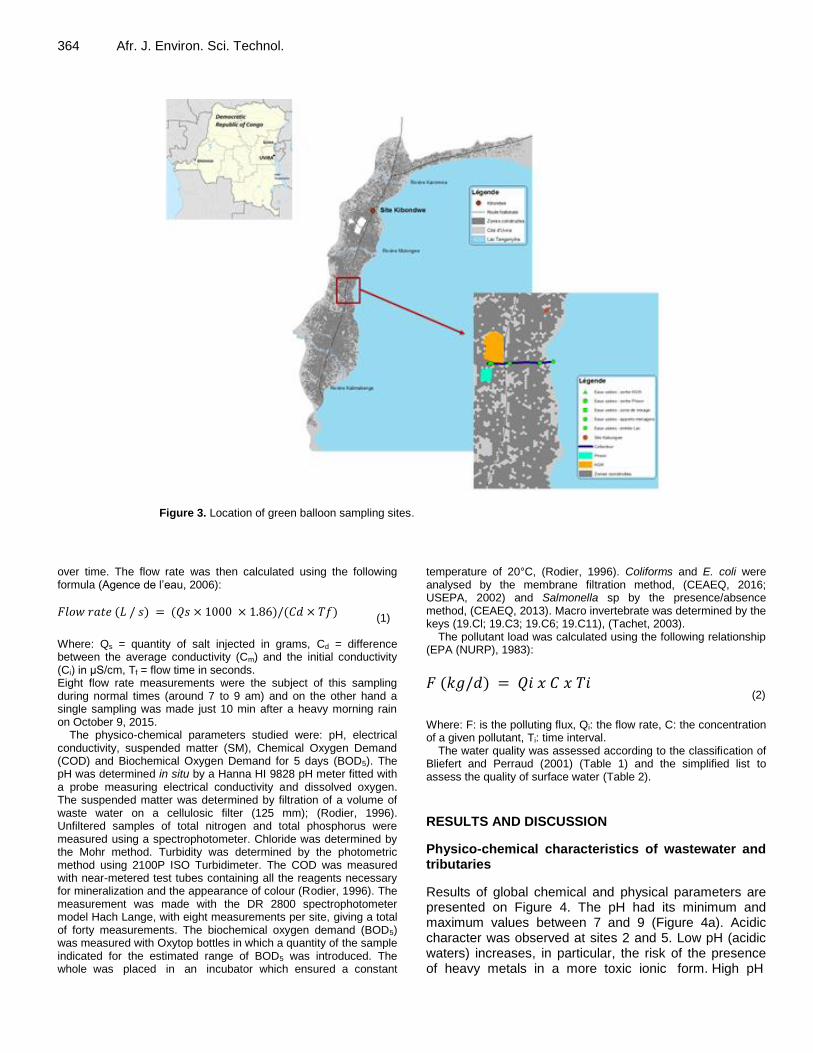
Lake Tanganyika is home to several endemic species, most of which are found nowhere else in the world (Fermon, 2007). Fishermen at Lake Tanganyika operate near the coast, in small canoes, using "lusenga" (large conical landing nets), dormant gillnets, beach seines, nets and hand lines between 0 and 5 m deep (West, 2001). It is possible that this artisanal fishery captures fish contaminated by pollutants and to be sold to the population. This constitutes a danger in the food chain by bio-accumulation and this phenomenon could badly regenerate to humans by the phenomenon of bio-magnification. The current strong demographics in the city of Uvira cause enormous challenges in the provision of drinking water, drainage and the management and treatment of both solid and liquid wastes which are discharged directly and indirectly into Lake Tanganyika without any prior treatment, faced with the above problems, aim of this research was to assess, qualitatively and quantitatively, the pollutant load conveyed by the collector into Lake Tanganyika and identify the emitters of pollutants in order to establish the eco-toxicological risk and propose strategies for remedying pollution in the future. MATERIALS AND METHODS Presentation of the study site The study site was located by Google Earth and then Arc GIS version 9.3 software was used to design the map (Figure 3). The study took place in the City of Uvira, located at the end of the northwest basin of Lake Tanganyika in the East of the Democratic Republic of Congo in the Province of Sud-Kivu (West, 2001). It is located between 03°20' and 04°20' south latitude, 29° and 29°30' east longitude. The City of Uvira is bounded to the North by the Ruzizi plain, to the South by the Fizi Territory, to the West by the Mitumba Mountains and finally to the East by Lake Tanganyika which gives it an opening towards the Burundi, Tanzania and Zambia from the port of Kalundu. A global positioning system (GPS) was used to take the geographic coordinates of the sampling sites with coordinates 29°08’32.7” East, 03°23’31.2” South and 29°08’39.0” East, 03°24’ 26.3’’ South. Sampling and analytical methods Samples were taken from four sites along the BTC collector and the fifth site was from Lake Tanganyika in the direction of effluents, in order to determine the dilution of pollutants in the Lake (see the dotted lines on the map). Eleven samples were taken from each site from February 2015 to October 2018. The analyses were done immediately after sampling in the Water Chemistry Laboratory of the Higher Pedagogic Institute/Bukavu, the Laboratory of Analytical Chemistry of the Environment at the University of Burundi/ Bujumbura, the Microbiology Laboratory of the University of Dar Es Salaam and the Chemistry Laboratory of the Hydrobiology Research Center/Uvira.
*Corresponding author. E-mail :[email protected].
Author(s) agree that this article remain permanently open access under the terms of the Creative Commons Attribution
License 4.0 International License
Kapepula et al. 363
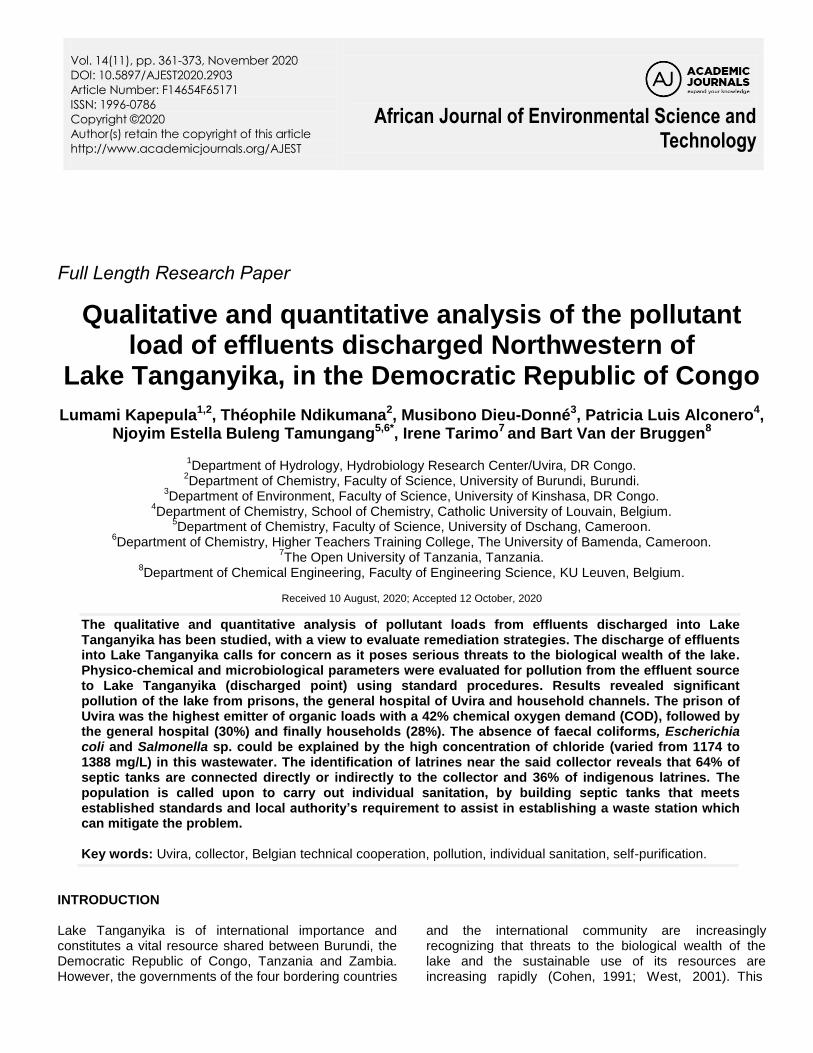
Figure 1. Obstruction of water channel by solid and liquids waste.
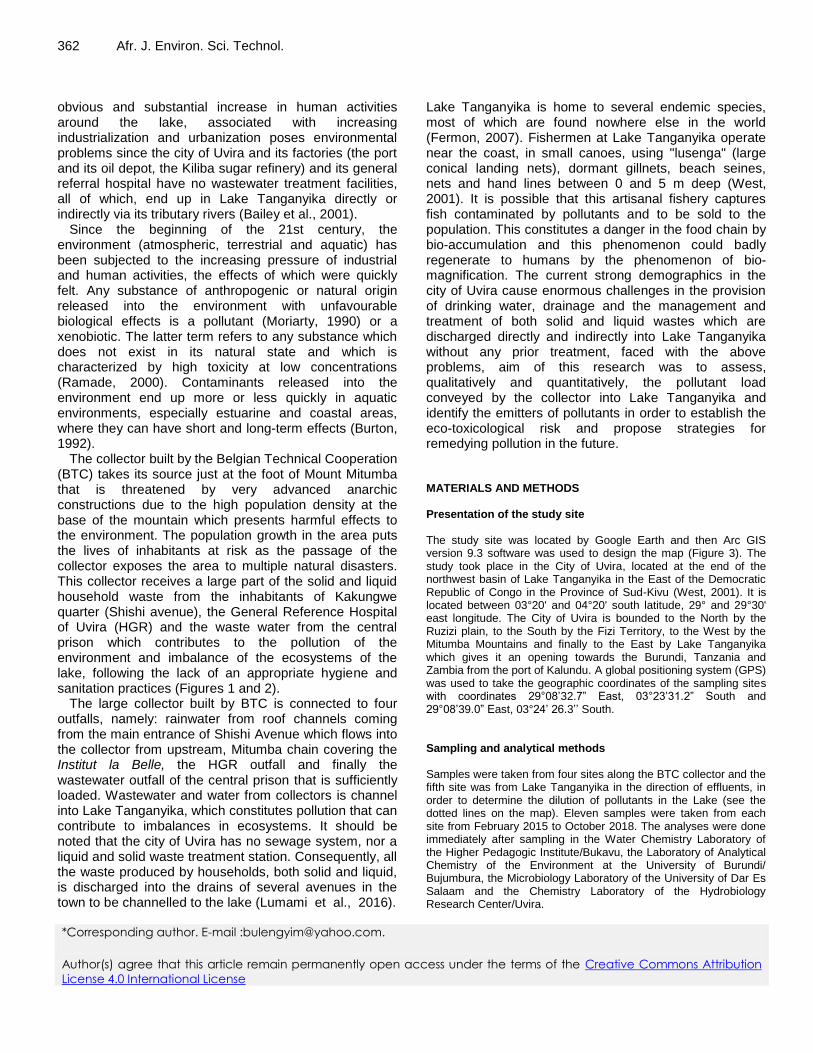
Figure 2. Discharge system of domestic collectors and hospital worn water towards the Lake.
The measurement of the flow rate was carried out by a chemical or dilution method, which consists in injecting a miscible substance
(sodium chloride) of known concentration in water, and measuring the concentration at a certain distance downstream (good mixture)
364 Afr. J. Environ. Sci. Technol.
Figure 3. Location of green balloon sampling sites.
over time. The flow rate was then calculated using the following formula (Agence de l’eau, 2006):
(1) Where: Qs = quantity of salt injected in grams, Cd = difference between the average conductivity (Cm) and the initial conductivity (Ci) in μS/cm, Tf = flow time in seconds. Eight flow rate measurements were the subject of this sampling during normal times (around 7 to 9 am) and on the other hand a single sampling was made just 10 min after a heavy morning rain on October 9, 2015.
The physico-chemical parameters studied were: pH, electrical conductivity, suspended matter (SM), Chemical Oxygen Demand (COD) and Biochemical Oxygen Demand for 5 days (BOD5). The pH was determined in situ by a Hanna HI 9828 pH meter fitted with a probe measuring electrical conductivity and dissolved oxygen. The suspended matter was determined by filtration of a volume of waste water on a cellulosic filter (125 mm); (Rodier, 1996). Unfiltered samples of total nitrogen and total phosphorus were measured using a spectrophotometer. Chloride was determined by the Mohr method. Turbidity was determined by the photometric method using 2100P ISO Turbidimeter. The COD was measured with near-metered test tubes containing all the reagents necessary for mineralization and the appearance of colour (Rodier, 1996). The measurement was made with the DR 2800 spectrophotometer model Hach Lange, with eight measurements per site, giving a total of forty measurements. The biochemical oxygen demand (BOD5) was measured with Oxytop bottles in which a quantity of the sample indicated for the estimated range of BOD5 was introduced. The whole was placed in an incubator which ensured a constant
temperature of 20°C, (Rodier, 1996). Coliforms and E. coli were analysed by the membrane filtration method, (CEAEQ, 2016; USEPA, 2002) and Salmonella sp by the presence/absence method, (CEAEQ, 2013). Macro invertebrate was determined by the keys (19.Cl; 19.C3; 19.C6; 19.C11), (Tachet, 2003).
The pollutant load was calculated using the following relationship (EPA (NURP), 1983):
(2)
Where: F: is the polluting flux, Qi: the flow rate, C: the concentration of a given pollutant, Ti: time interval.
The water quality was assessed according to the classification of Bliefert and Perraud (2001) (Table 1) and the simplified list to assess the quality of surface water (Table 2). RESULTS AND DISCUSSION
Physico-chemical characteristics of wastewater and tributaries
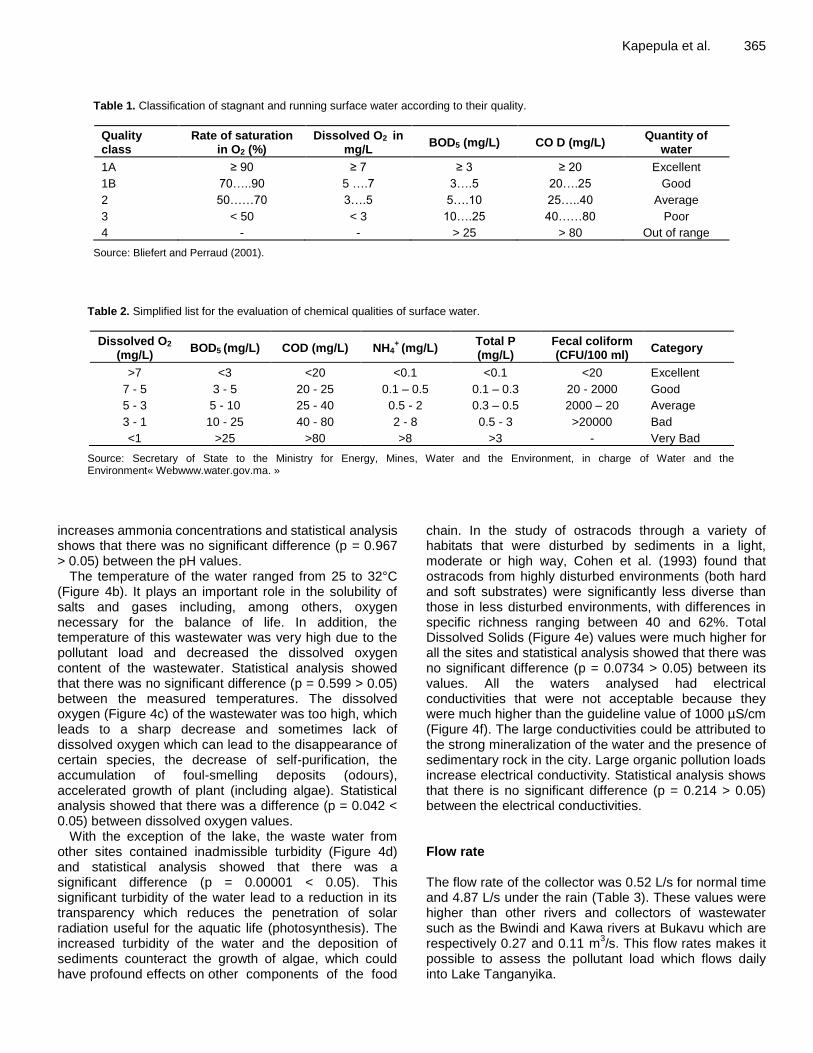
Results of global chemical and physical parameters are presented on Figure 4. The pH had its minimum and maximum values between 7 and 9 (Figure 4a). Acidic character was observed at sites 2 and 5. Low pH (acidic waters) increases, in particular, the risk of the presence of heavy metals in a more toxic ionic form. High pH
𝐹𝑙𝑜𝑤 𝑟𝑎𝑡𝑒 (𝐿 / 𝑠) = (𝑄𝑠 × 1000 × 1.86)/(𝐶𝑑 × 𝑇𝑓)
𝐹 (𝑘𝑔/𝑑) = 𝑄𝑖 𝑥 𝐶 𝑥 𝑇𝑖
Kapepula et al. 365
Table 1. Classification of stagnant and running surface water according to their quality.
Quality class
Rate of saturation in O2 (%)
Dissolved O2 in mg/L
BOD5 (mg/L) CO D (mg/L) Quantity of
water
1A ≥ 90 ≥ 7 ≥ 3 ≥ 20 Excellent
1B 70…..90 5 ….7 3….5 20….25 Good
2 50……70 3….5 5….10 25…..40 Average
3 < 50 < 3 10….25 40……80 Poor
4 - - > 25 > 80 Out of range
Source: Bliefert and Perraud (2001).
Table 2. Simplified list for the evaluation of chemical qualities of surface water.
Dissolved O2 (mg/L)
BOD5 (mg/L) COD (mg/L) NH4+
(mg/L) Total P (mg/L)
Fecal coliform (CFU/100 ml)
Category
>7 <3 <20 <0.1 <0.1 <20 Excellent
7 - 5 3 - 5 20 - 25 0.1 – 0.5 0.1 – 0.3 20 - 2000 Good
5 - 3 5 - 10 25 - 40 0.5 - 2 0.3 – 0.5 2000 – 20 Average
3 - 1 10 - 25 40 - 80 2 - 8 0.5 - 3 >20000 Bad
<1 >25 >80 >8 >3 - Very Bad
Source: Secretary of State to the Ministry for Energy, Mines, Water and the Environment, in charge of Water and the Environment« Webwww.water.gov.ma. »
increases ammonia concentrations and statistical analysis shows that there was no significant difference (p = 0.967 > 0.05) between the pH values.
The temperature of the water ranged from 25 to 32°C (Figure 4b). It plays an important role in the solubility of salts and gases including, among others, oxygen necessary for the balance of life. In addition, the temperature of this wastewater was very high due to the pollutant load and decreased the dissolved oxygen content of the wastewater. Statistical analysis showed that there was no significant difference (p = 0.599 > 0.05) between the measured temperatures. The dissolved oxygen (Figure 4c) of the wastewater was too high, which leads to a sharp decrease and sometimes lack of dissolved oxygen which can lead to the disappearance of certain species, the decrease of self-purification, the accumulation of foul-smelling deposits (odours), accelerated growth of plant (including algae). Statistical analysis showed that there was a difference (p = 0.042 < 0.05) between dissolved oxygen values.
With the exception of the lake, the waste water from other sites contained inadmissible turbidity (Figure 4d) and statistical analysis showed that there was a significant difference (p = 0.00001 < 0.05). This significant turbidity of the water lead to a reduction in its transparency which reduces the penetration of solar radiation useful for the aquatic life (photosynthesis). The increased turbidity of the water and the deposition of sediments counteract the growth of algae, which could have profound effects on other components of the food
chain. In the study of ostracods through a variety of habitats that were disturbed by sediments in a light, moderate or high way, Cohen et al. (1993) found that ostracods from highly disturbed environments (both hard and soft substrates) were significantly less diverse than those in less disturbed environments, with differences in specific richness ranging between 40 and 62%. Total Dissolved Solids (Figure 4e) values were much higher for all the sites and statistical analysis showed that there was no significant difference (p = 0.0734 > 0.05) between its values. All the waters analysed had electrical conductivities that were not acceptable because they were much higher than the guideline value of 1000 µS/cm (Figure 4f). The large conductivities could be attributed to the strong mineralization of the water and the presence of sedimentary rock in the city. Large organic pollution loads increase electrical conductivity. Statistical analysis shows that there is no significant difference (p = 0.214 > 0.05) between the electrical conductivities. Flow rate The flow rate of the collector was 0.52 L/s for normal time and 4.87 L/s under the rain (Table 3). These values were higher than other rivers and collectors of wastewater such as the Bwindi and Kawa rivers at Bukavu which are respectively 0.27 and 0.11 m
3/s. This flow rates makes it
possible to assess the pollutant load which flows daily into Lake Tanganyika.
366 Afr. J. Environ. Sci. Technol.
Figure 4. (a) pH, (b) temperature, (c) dissolved oxygen, (d) turbidity, (e) total dissolved solids, (f) electrical conductivity. *** - significant.
Table 3. Liquid flow rate measurement.
N° Sampling time Flow rate L/s
01 Normal time 0.52
02 Under the rain 4.87
F value Pr (>F) F value Pr(>F)
0.139 0.967 0.696 0.599
(a) pH (b) Temperature
F value p (>F) F value p (>F)
2.75 0.0425 10.21 1.39e-05 ***
(c) Dissolved Oxygen (d) Turbidity
F value p (>F) F value p (>F)
2.385 0.0734 1.513 0.214
(e) Total Dissolved Solids (f) Electrical Conductivity
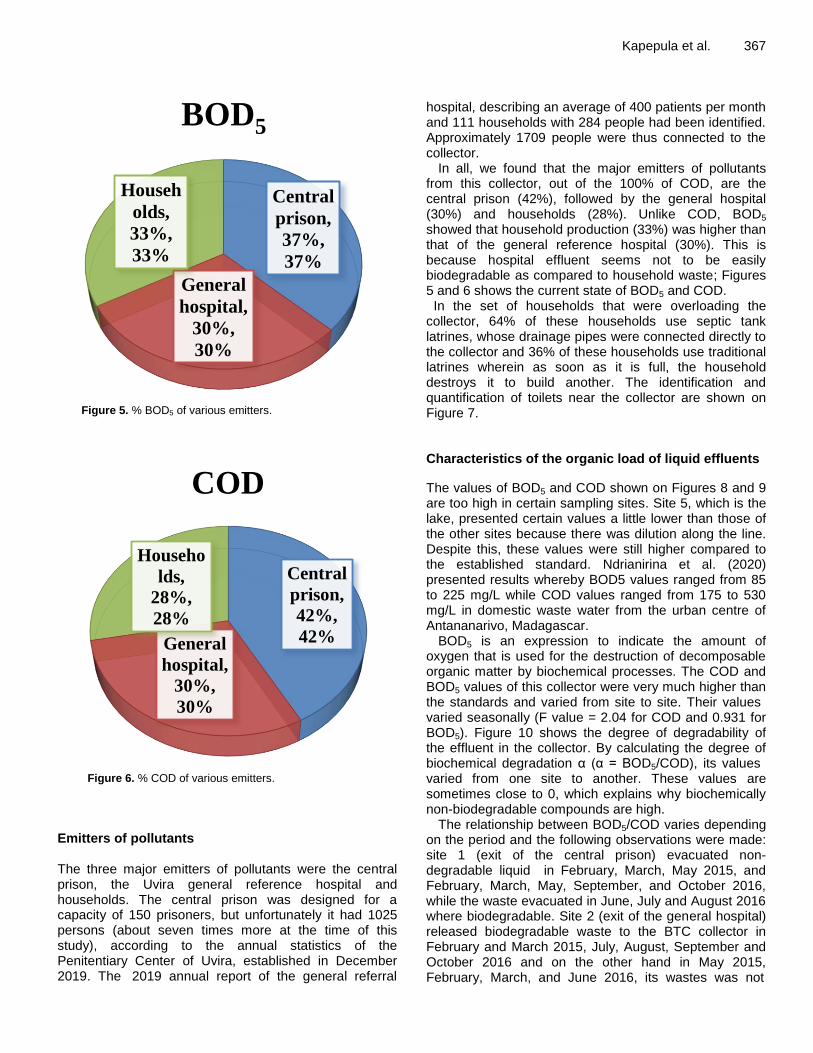
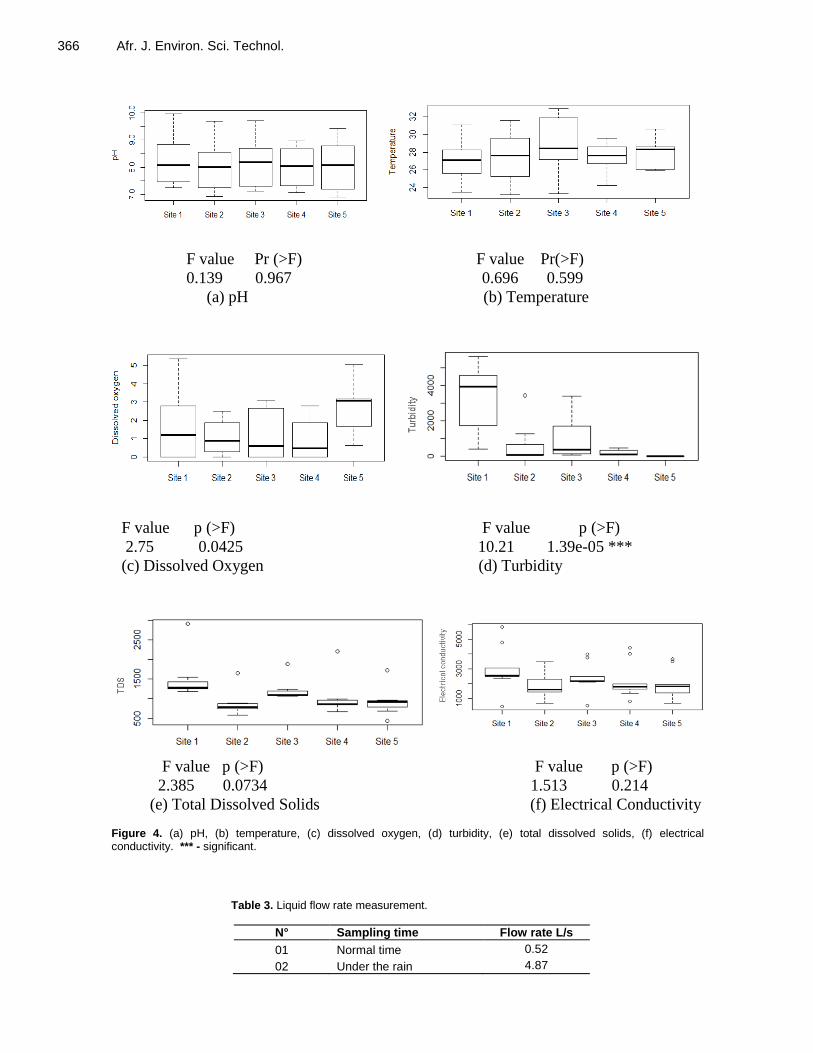
Figure 5. % BOD5 of various emitters.
Figure 6. % COD of various emitters.
Emitters of pollutants The three major emitters of pollutants were the central prison, the Uvira general reference hospital and households. The central prison was designed for a capacity of 150 prisoners, but unfortunately it had 1025 persons (about seven times more at the time of this study), according to the annual statistics of the Penitentiary Center of Uvira, established in December 2019. The 2019 annual report of the general referral
Kapepula et al. 367 hospital, describing an average of 400 patients per month and 111 households with 284 people had been identified. Approximately 1709 people were thus connected to the collector.
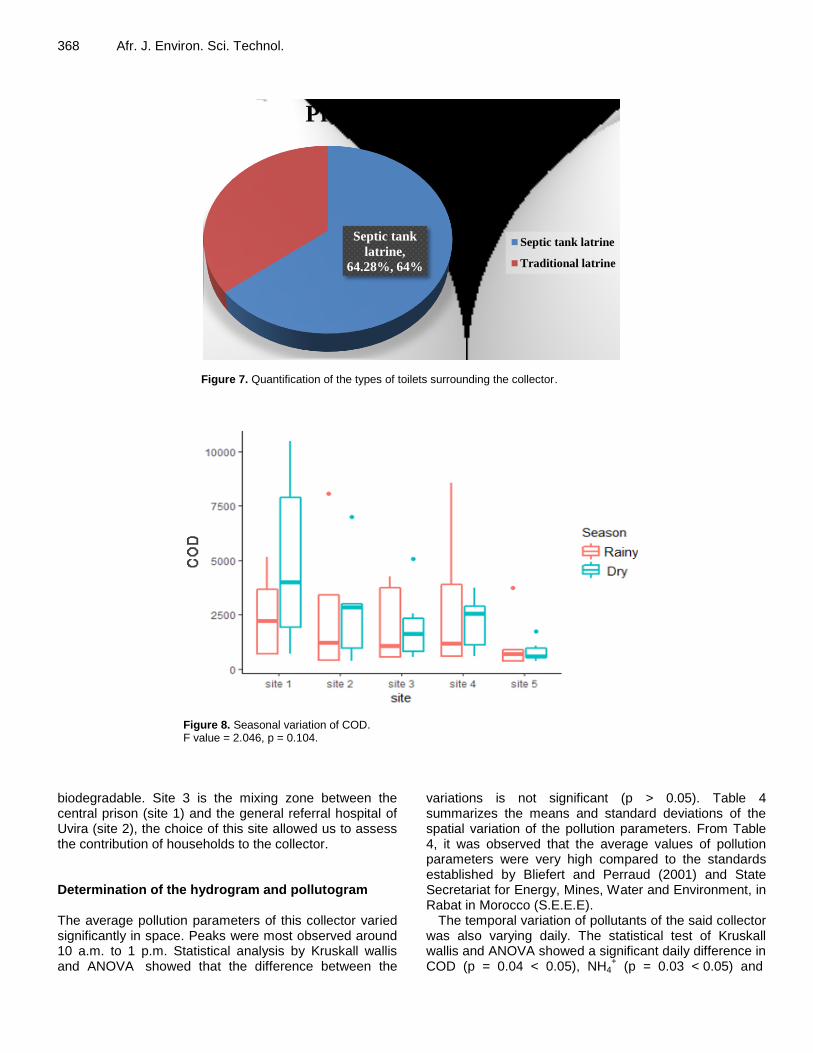
In all, we found that the major emitters of pollutants from this collector, out of the 100% of COD, are the central prison (42%), followed by the general hospital (30%) and households (28%). Unlike COD, BOD5 showed that household production (33%) was higher than that of the general reference hospital (30%). This is because hospital effluent seems not to be easily biodegradable as compared to household waste; Figures 5 and 6 shows the current state of BOD5 and COD. In the set of households that were overloading the collector, 64% of these households use septic tank latrines, whose drainage pipes were connected directly to the collector and 36% of these households use traditional latrines wherein as soon as it is full, the household destroys it to build another. The identification and quantification of toilets near the collector are shown on Figure 7. Characteristics of the organic load of liquid effluents
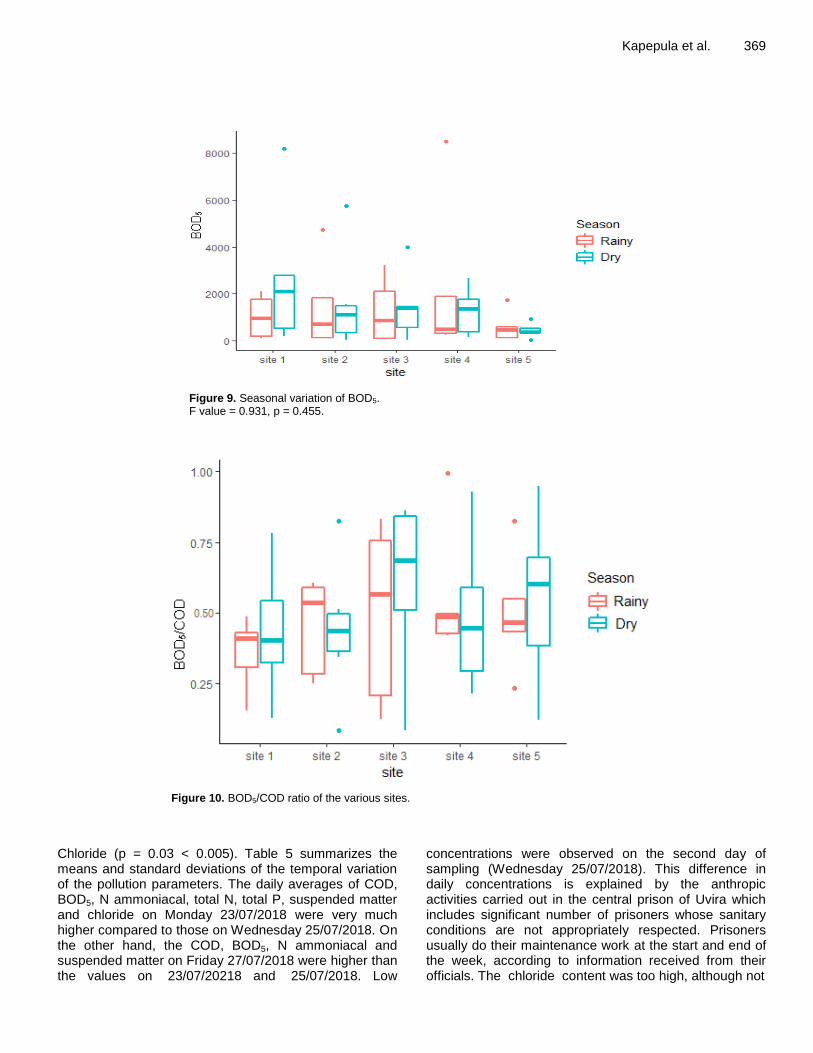
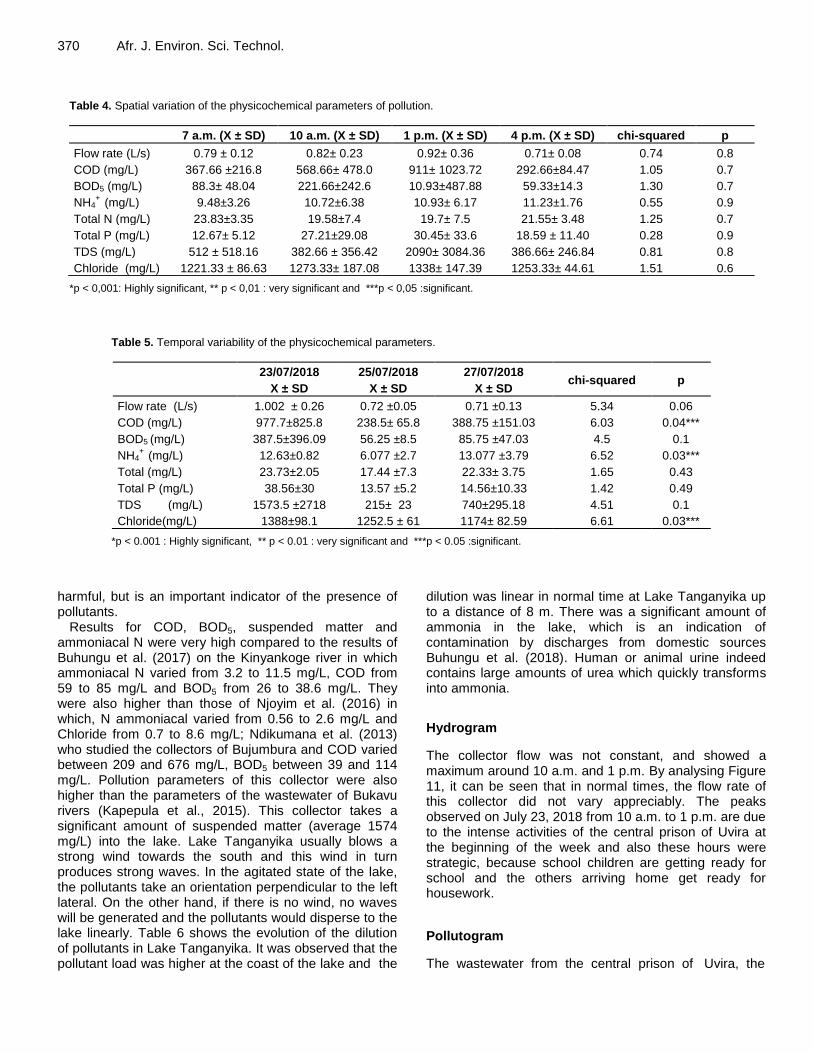
The values of BOD5 and COD shown on Figures 8 and 9 are too high in certain sampling sites. Site 5, which is the lake, presented certain values a little lower than those of the other sites because there was dilution along the line. Despite this, these values were still higher compared to the established standard. Ndrianirina et al. (2020) presented results whereby BOD5 values ranged from 85 to 225 mg/L while COD values ranged from 175 to 530 mg/L in domestic waste water from the urban centre of Antananarivo, Madagascar.
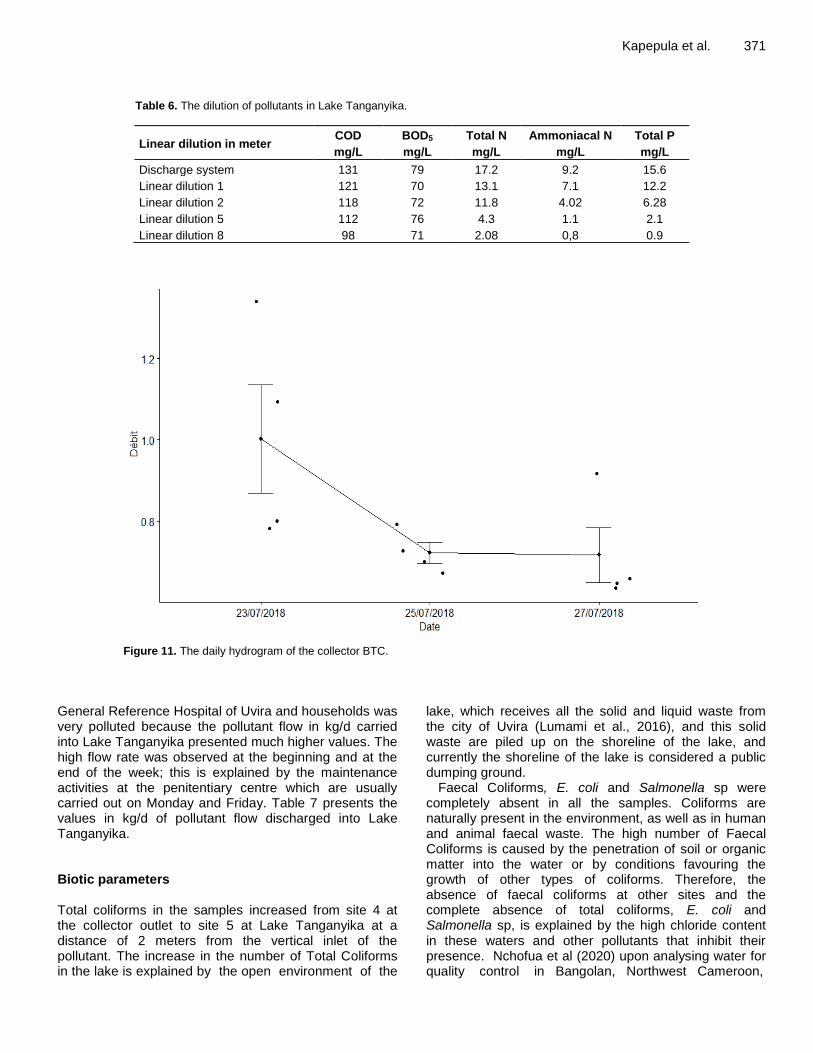
BOD5 is an expression to indicate the amount of oxygen that is used for the destruction of decomposable organic matter by biochemical processes. The COD and BOD5 values of this collector were very much higher than the standards and varied from site to site. Their values varied seasonally (F value = 2.04 for COD and 0.931 for BOD5). Figure 10 shows the degree of degradability of the effluent in the collector. By calculating the degree of biochemical degradation α (α = BOD5/COD), its values varied from one site to another. These values are sometimes close to 0, which explains why biochemically non-biodegradable compounds are high.
The relationship between BOD5/COD varies depending on the period and the following observations were made: site 1 (exit of the central prison) evacuated non-degradable liquid in February, March, May 2015, and February, March, May, September, and October 2016, while the waste evacuated in June, July and August 2016 where biodegradable. Site 2 (exit of the general hospital) released biodegradable waste to the BTC collector in February and March 2015, July, August, September and October 2016 and on the other hand in May 2015, February, March, and June 2016, its wastes was not
Central
prison,
37%,
37%
General
hospital,
30%,
30%
Househ
olds,
33%,
33%
BOD5
Central
prison,
42%,
42% General
hospital,
30%,
30%
Househo
lds,
28%,
28%
COD
368 Afr. J. Environ. Sci. Technol.
Figure 7. Quantification of the types of toilets surrounding the collector.
Figure 8. Seasonal variation of COD. F value = 2.046, p = 0.104.
biodegradable. Site 3 is the mixing zone between the central prison (site 1) and the general referral hospital of Uvira (site 2), the choice of this site allowed us to assess the contribution of households to the collector. Determination of the hydrogram and pollutogram The average pollution parameters of this collector varied significantly in space. Peaks were most observed around 10 a.m. to 1 p.m. Statistical analysis by Kruskall wallis and ANOVA showed that the difference between the
variations is not significant (p > 0.05). Table 4 summarizes the means and standard deviations of the spatial variation of the pollution parameters. From Table 4, it was observed that the average values of pollution parameters were very high compared to the standards established by Bliefert and Perraud (2001) and State Secretariat for Energy, Mines, Water and Environment, in Rabat in Morocco (S.E.E.E).
The temporal variation of pollutants of the said collector was also varying daily. The statistical test of Kruskall wallis and ANOVA showed a significant daily difference in COD (p = 0.04 < 0.05), NH4
+ (p = 0.03 < 0.05) and
Septic tank
latrine,
64.28%, 64%
Proportion in %
Septic tank latrine
Traditional latrine
Kapepula et al. 369
Figure 9. Seasonal variation of BOD5. F value = 0.931, p = 0.455.
Figure 10. BOD5/COD ratio of the various sites.
Chloride (p = 0.03 < 0.005). Table 5 summarizes the means and standard deviations of the temporal variation of the pollution parameters. The daily averages of COD, BOD5, N ammoniacal, total N, total P, suspended matter and chloride on Monday 23/07/2018 were very much higher compared to those on Wednesday 25/07/2018. On the other hand, the COD, BOD5, N ammoniacal and suspended matter on Friday 27/07/2018 were higher than the values on 23/07/20218 and 25/07/2018. Low
concentrations were observed on the second day of sampling (Wednesday 25/07/2018). This difference in daily concentrations is explained by the anthropic activities carried out in the central prison of Uvira which includes significant number of prisoners whose sanitary conditions are not appropriately respected. Prisoners usually do their maintenance work at the start and end of the week, according to information received from their officials. The chloride content was too high, although not
370 Afr. J. Environ. Sci. Technol.
Table 4. Spatial variation of the physicochemical parameters of pollution.
7 a.m. (X ± SD) 10 a.m. (X ± SD) 1 p.m. (X ± SD) 4 p.m. (X ± SD) chi-squared p
Flow rate (L/s) 0.79 ± 0.12 0.82± 0.23 0.92± 0.36 0.71± 0.08 0.74 0.8
COD (mg/L) 367.66 ±216.8 568.66± 478.0 911± 1023.72 292.66±84.47 1.05 0.7
BOD5 (mg/L) 88.3± 48.04 221.66±242.6 10.93±487.88 59.33±14.3 1.30 0.7
NH4+
(mg/L) 9.48±3.26 10.72±6.38 10.93± 6.17 11.23±1.76 0.55 0.9
Total N (mg/L) 23.83±3.35 19.58±7.4 19.7± 7.5 21.55± 3.48 1.25 0.7
Total P (mg/L) 12.67± 5.12 27.21±29.08 30.45± 33.6 18.59 ± 11.40 0.28 0.9
TDS (mg/L) 512 ± 518.16 382.66 ± 356.42 2090± 3084.36 386.66± 246.84 0.81 0.8
Chloride (mg/L) 1221.33 ± 86.63 1273.33± 187.08 1338± 147.39 1253.33± 44.61 1.51 0.6
*p < 0,001: Highly significant, ** p < 0,01 : very significant and ***p < 0,05 :significant.
Table 5. Temporal variability of the physicochemical parameters.
23/07/2018
X ± SD
25/07/2018
X ± SD
27/07/2018
X ± SD chi-squared p
Flow rate (L/s) 1.002 ± 0.26 0.72 ±0.05 0.71 ±0.13 5.34 0.06
COD (mg/L) 977.7±825.8 238.5± 65.8 388.75 ±151.03 6.03 0.04***
BOD5 (mg/L) 387.5±396.09 56.25 ±8.5 85.75 ±47.03 4.5 0.1
NH4+
(mg/L) 12.63±0.82 6.077 ±2.7 13.077 ±3.79 6.52 0.03***
Total (mg/L) 23.73±2.05 17.44 ±7.3 22.33± 3.75 1.65 0.43
Total P (mg/L) 38.56±30 13.57 ±5.2 14.56±10.33 1.42 0.49
TDS (mg/L) 1573.5 ±2718 215± 23 740±295.18 4.51 0.1
Chloride(mg/L) 1388±98.1 1252.5 ± 61 1174± 82.59 6.61 0.03***
*p < 0.001 : Highly significant, ** p < 0.01 : very significant and ***p < 0.05 :significant.
harmful, but is an important indicator of the presence of pollutants.
Results for COD, BOD5, suspended matter and ammoniacal N were very high compared to the results of Buhungu et al. (2017) on the Kinyankoge river in which ammoniacal N varied from 3.2 to 11.5 mg/L, COD from 59 to 85 mg/L and BOD5 from 26 to 38.6 mg/L. They were also higher than those of Njoyim et al. (2016) in which, N ammoniacal varied from 0.56 to 2.6 mg/L and Chloride from 0.7 to 8.6 mg/L; Ndikumana et al. (2013) who studied the collectors of Bujumbura and COD varied between 209 and 676 mg/L, BOD5 between 39 and 114 mg/L. Pollution parameters of this collector were also higher than the parameters of the wastewater of Bukavu rivers (Kapepula et al., 2015). This collector takes a significant amount of suspended matter (average 1574 mg/L) into the lake. Lake Tanganyika usually blows a strong wind towards the south and this wind in turn produces strong waves. In the agitated state of the lake, the pollutants take an orientation perpendicular to the left lateral. On the other hand, if there is no wind, no waves will be generated and the pollutants would disperse to the lake linearly. Table 6 shows the evolution of the dilution of pollutants in Lake Tanganyika. It was observed that the pollutant load was higher at the coast of the lake and the
dilution was linear in normal time at Lake Tanganyika up to a distance of 8 m. There was a significant amount of ammonia in the lake, which is an indication of contamination by discharges from domestic sources Buhungu et al. (2018). Human or animal urine indeed contains large amounts of urea which quickly transforms into ammonia.
Hydrogram
The collector flow was not constant, and showed a maximum around 10 a.m. and 1 p.m. By analysing Figure 11, it can be seen that in normal times, the flow rate of this collector did not vary appreciably. The peaks observed on July 23, 2018 from 10 a.m. to 1 p.m. are due to the intense activities of the central prison of Uvira at the beginning of the week and also these hours were strategic, because school children are getting ready for school and the others arriving home get ready for housework.
Pollutogram
The wastewater from the central prison of Uvira, the
Kapepula et al. 371
Table 6. The dilution of pollutants in Lake Tanganyika.
Linear dilution in meter COD
mg/L
BOD5
mg/L
Total N
mg/L
Ammoniacal N
mg/L
Total P
mg/L
Discharge system 131 79 17.2 9.2 15.6
Linear dilution 1 121 70 13.1 7.1 12.2
Linear dilution 2 118 72 11.8 4.02 6.28
Linear dilution 5 112 76 4.3 1.1 2.1
Linear dilution 8 98 71 2.08 0,8 0.9
Figure 11. The daily hydrogram of the collector BTC.
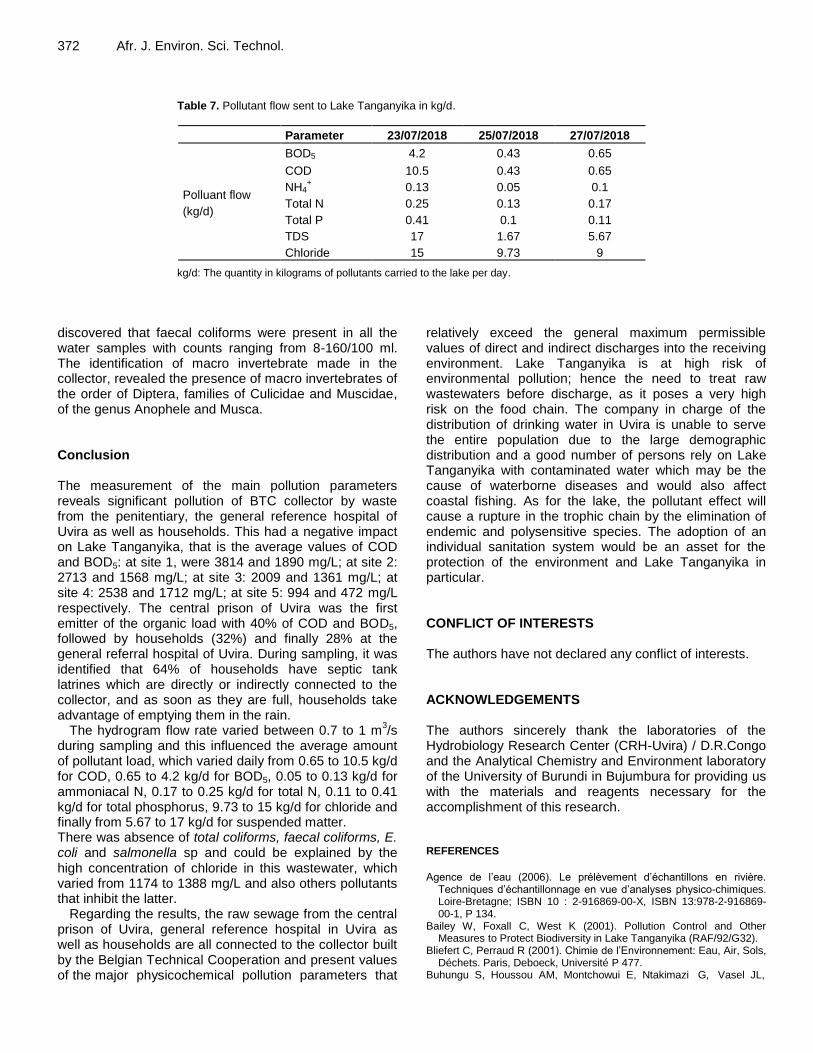
General Reference Hospital of Uvira and households was very polluted because the pollutant flow in kg/d carried into Lake Tanganyika presented much higher values. The high flow rate was observed at the beginning and at the end of the week; this is explained by the maintenance activities at the penitentiary centre which are usually carried out on Monday and Friday. Table 7 presents the values in kg/d of pollutant flow discharged into Lake Tanganyika. Biotic parameters Total coliforms in the samples increased from site 4 at the collector outlet to site 5 at Lake Tanganyika at a distance of 2 meters from the vertical inlet of the pollutant. The increase in the number of Total Coliforms in the lake is explained by the open environment of the
lake, which receives all the solid and liquid waste from the city of Uvira (Lumami et al., 2016), and this solid waste are piled up on the shoreline of the lake, and currently the shoreline of the lake is considered a public dumping ground.
Faecal Coliforms, E. coli and Salmonella sp were completely absent in all the samples. Coliforms are naturally present in the environment, as well as in human and animal faecal waste. The high number of Faecal Coliforms is caused by the penetration of soil or organic matter into the water or by conditions favouring the growth of other types of coliforms. Therefore, the absence of faecal coliforms at other sites and the complete absence of total coliforms, E. coli and Salmonella sp, is explained by the high chloride content in these waters and other pollutants that inhibit their presence. Nchofua et al (2020) upon analysing water for quality control in Bangolan, Northwest Cameroon,
372 Afr. J. Environ. Sci. Technol.
Table 7. Pollutant flow sent to Lake Tanganyika in kg/d.
Parameter 23/07/2018 25/07/2018 27/07/2018
Polluant flow
(kg/d)
BOD5 4.2 0.43 0.65
COD 10.5 0.43 0.65
NH4+ 0.13 0.05 0.1
Total N 0.25 0.13 0.17
Total P 0.41 0.1 0.11
TDS 17 1.67 5.67
Chloride 15 9.73 9
kg/d: The quantity in kilograms of pollutants carried to the lake per day.
discovered that faecal coliforms were present in all the water samples with counts ranging from 8-160/100 ml. The identification of macro invertebrate made in the collector, revealed the presence of macro invertebrates of the order of Diptera, families of Culicidae and Muscidae, of the genus Anophele and Musca. Conclusion The measurement of the main pollution parameters reveals significant pollution of BTC collector by waste from the penitentiary, the general reference hospital of Uvira as well as households. This had a negative impact on Lake Tanganyika, that is the average values of COD and BOD5: at site 1, were 3814 and 1890 mg/L; at site 2: 2713 and 1568 mg/L; at site 3: 2009 and 1361 mg/L; at site 4: 2538 and 1712 mg/L; at site 5: 994 and 472 mg/L respectively. The central prison of Uvira was the first emitter of the organic load with 40% of COD and BOD5, followed by households (32%) and finally 28% at the general referral hospital of Uvira. During sampling, it was identified that 64% of households have septic tank latrines which are directly or indirectly connected to the collector, and as soon as they are full, households take advantage of emptying them in the rain.
The hydrogram flow rate varied between 0.7 to 1 m3/s
during sampling and this influenced the average amount of pollutant load, which varied daily from 0.65 to 10.5 kg/d for COD, 0.65 to 4.2 kg/d for BOD5, 0.05 to 0.13 kg/d for ammoniacal N, 0.17 to 0.25 kg/d for total N, 0.11 to 0.41 kg/d for total phosphorus, 9.73 to 15 kg/d for chloride and finally from 5.67 to 17 kg/d for suspended matter. There was absence of total coliforms, faecal coliforms, E. coli and salmonella sp and could be explained by the high concentration of chloride in this wastewater, which varied from 1174 to 1388 mg/L and also others pollutants that inhibit the latter.
Regarding the results, the raw sewage from the central prison of Uvira, general reference hospital in Uvira as well as households are all connected to the collector built by the Belgian Technical Cooperation and present values of the major physicochemical pollution parameters that
relatively exceed the general maximum permissible values of direct and indirect discharges into the receiving environment. Lake Tanganyika is at high risk of environmental pollution; hence the need to treat raw wastewaters before discharge, as it poses a very high risk on the food chain. The company in charge of the distribution of drinking water in Uvira is unable to serve the entire population due to the large demographic distribution and a good number of persons rely on Lake Tanganyika with contaminated water which may be the cause of waterborne diseases and would also affect coastal fishing. As for the lake, the pollutant effect will cause a rupture in the trophic chain by the elimination of endemic and polysensitive species. The adoption of an individual sanitation system would be an asset for the protection of the environment and Lake Tanganyika in particular. CONFLICT OF INTERESTS The authors have not declared any conflict of interests. ACKNOWLEDGEMENTS The authors sincerely thank the laboratories of the Hydrobiology Research Center (CRH-Uvira) / D.R.Congo and the Analytical Chemistry and Environment laboratory of the University of Burundi in Bujumbura for providing us with the materials and reagents necessary for the accomplishment of this research. REFERENCES
Agence de l’eau (2006). Le prélèvement d’échantillons en rivière.
Techniques d’échantillonnage en vue d’analyses physico-chimiques. Loire-Bretagne; ISBN 10 : 2-916869-00-X, ISBN 13:978-2-916869-00-1, P 134.
Bailey W, Foxall C, West K (2001). Pollution Control and Other Measures to Protect Biodiversity in Lake Tanganyika (RAF/92/G32).
Bliefert C, Perraud R (2001). Chimie de l’Environnement: Eau, Air, Sols, Déchets. Paris, Deboeck, Université P 477.
Buhungu S, Houssou AM, Montchowui E, Ntakimazi G, Vasel JL,
Ndikumana T (2017). Etablissement du pollutogramme et de l’hydrogramme de la rivière Kinyankonge, Burundi. International Journal of Biological and Chemical Sciences 11(3):1386-1399.
Buhungu S, Montchowui E, Barankanira E, Sibomana E, Ntakimazi G, Bonou CA (2018). Caractérisation spatio-temporelle de la qualité de l’eau de la rivière Kinyankonge, affluent du Lac Tanganyika, Burundi. International Journal of Biological and Chemical Sciences 12(1):576-595.
Burton GA (1992). Sediment Collection and processing: factors affecting realism, in Sediment Toxicology Bioassessment. Jr., Ed., Lewis Publishers, Boca Raton, FL, P 37.
CEAEQ (2013). Recherche des salmonelles: méthode présence/ absence, MA. 700 – Sal-PA 1.0, Rév. 3, Ministère du Développement durable, de l’Environnement, de la Faune et des Parcs du Québec P 25.
CEAEQ (2016). Recherche et dénombrement d’Escherichia coli thermotolérants dans l’eau : méthode par filtration sur membrane utilisant le milieu de culture mFC-BCIG, rév. 1, MA. 700 – Ec.BCIG 1.0, Rév. 1, Ministère du Développement durable, de l’Environnement et de la Lutte contre les changements climatiques. P 17.
Cohen AS (1991). Report on the First International Conference on the Conservation and Biodiversity of Lake Tanganyika. March, 1991. Bujumbura. Biodiversity Support Program.
Cohen AS, Bills, Cocquyt RCZ, Caljon AG (1993). The impact of sediment pollution on biodiversity in Lake Tanganyika. Conservation Biology 7:667-677.
Environmental Protection Agency (EPA) (1983). Environmental Protection Agency des États-Unis. Results of Nationwide Urban Runoff Program (NURP). EPAPB/84-185552. Available on http://www.theses.fr/2016BORD0381/abes
Fermon Y (2007). Etude de l’état des lieux de la partie Nord du Lac Tanganyika dans le cadre du programme Pêche d’action contre fin en R.D.C." http://www.humeau.com/ /fr/MAT 153-FR.php.
Lumami K, Muyisa S, Jung GC (2016). Contribution à l’état des lieux de déchets solides ménagers dans la ville D’Uvira, Sud-Kivu, République Démocratique du Congo. International Journal of Biological and Chemical Sciences 10(3):1413-1421.
Kapepula L, Lutili M, Amundala S, Muyisa S, Ndikumana T, Bart VDB (2015). Evaluation de la charge polluante des rivières des eaux usées ménagères et pluviales dans la ville de Bukavu, République démocratique du Congo. Afrique Science 11:2. http://www.afriquescience.info/document.php?id=4603. ISSN 1813-548X.
Moriarty C (1990). European catches of elver of 1928-1988. Internationale Revue der gesamten Hydrobiologie und Hydrographie 75:701-706.
Kapepula et al. 373 Nchofua FB, Njoyim EBT, Mofor NA, Mvondo-ze AD (2020). Analysis
and Water Quality Control of Alternative Sources in Bangolan, Northwest Cameroon. Hindawi Journal of Chemistry Article ID 5480762. P 13.
Ndikumana T, Bizindavyi E, Kisoholo A, Vasel JL (2013). Impact des collecteurs d’eaux pluviales sur la baie Nord-Est du lac Tanganyika. Bulletin scientifique de l'Institut national pour l'environnement et la conservation de la nature. 12:55-60.
Ndrianirina S, Razanamparany B, Ramanantsizehena G (2020). Évolution spatio-temporelle de la pollution des eaux cressonnières et des eaux usées domestiques dans la commune urbaine d’Antananarivo, Madagascar. Afrique Science 16(2):217-228.
Njoyim EBT, Mofor NA, Mary LFN, Sunjo J (2016). Physicochemical and bacteriological quality assessment of the Bambui community drinking water in the North West Region of Cameroon. African Journal of Environmental Science and Technology 10(6):181-191.
Ramade F (2000). Dictionnaire encyclopédique des pollutions - Les polluants: de l'environnement à l'homme. Paris : Ediscience international. p.690.
Rodier J (1996). L'analyse de l'eau : eaux naturelles, eaux résiduaires, eau de mer chimie, physico-chimie, microbiologie, biologie, interprétation des résultats / Jean Rodier ; avec la collaboration de C Bazin, J-P Broutin, P Chambon... [et al.]. Paris Dunod, ISBN: 2-10-002416-7, Édition 8e edition.
Tachet H (2003). Invertébrés d’eau douce. Systématique, biologie, écologie. CNRES Edition, Paris, 2000, 2002, 2003. ISBN : 2-271-05745-0. pp. 507, 526.
United States Environmental Protection Agency (USEPA) (2002). Method 1604: Total Coliforms and Escherichia coli in Water by Membrane Filtration Using a Simultaneous Detection Technique (MI Medium), USEPA, 821-R02-024.
West K (2001). Lac Tanganyika: résultats et constats tires de l’initiative de conservation du PNUD/GEF (RAF/92/G32) qui a eu lieu au Burundi, en République Démocratique du Congo, en Tanzanie et en Zambie. Projet sur la Biodiversité du Lac Tanganyika P 155.
.