Putnam S&P 500 Index Fund is responsible for the preparation and fair presentation of the financial...
25
Putnam S&P 500 Index Fund Annual report 12 | 31 | 17
Transcript of Putnam S&P 500 Index Fund is responsible for the preparation and fair presentation of the financial...

Putnam S&P 500 Index Fund Annual report 12 | 31 | 17
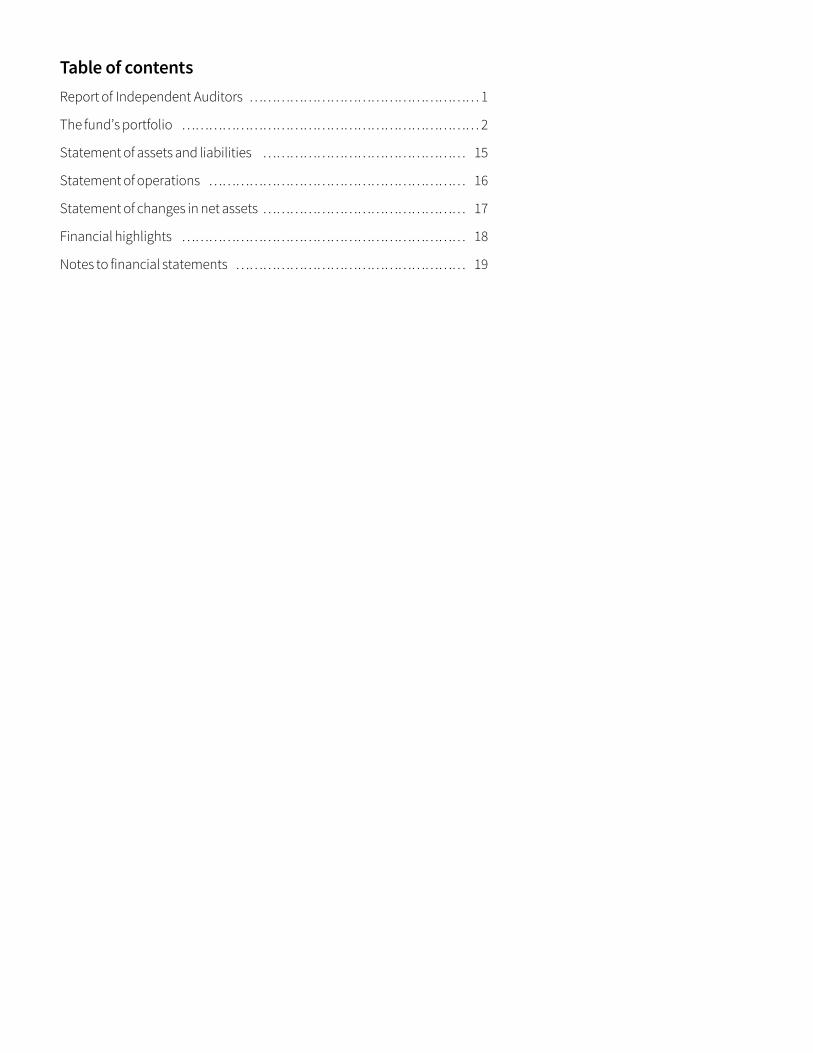
Table of contentsReport of Independent Auditors ����������������� 1
The fund’s portfolio ���������������������� 2
Statement of assets and liabilities ��������������� 15
Statement of operations ������������������� 16
Statement of changes in net assets ��������������� 17
Financial highlights ��������������������� 18
Notes to financial statements ����������������� 19
Putnam S&P 500 Index Fund 1
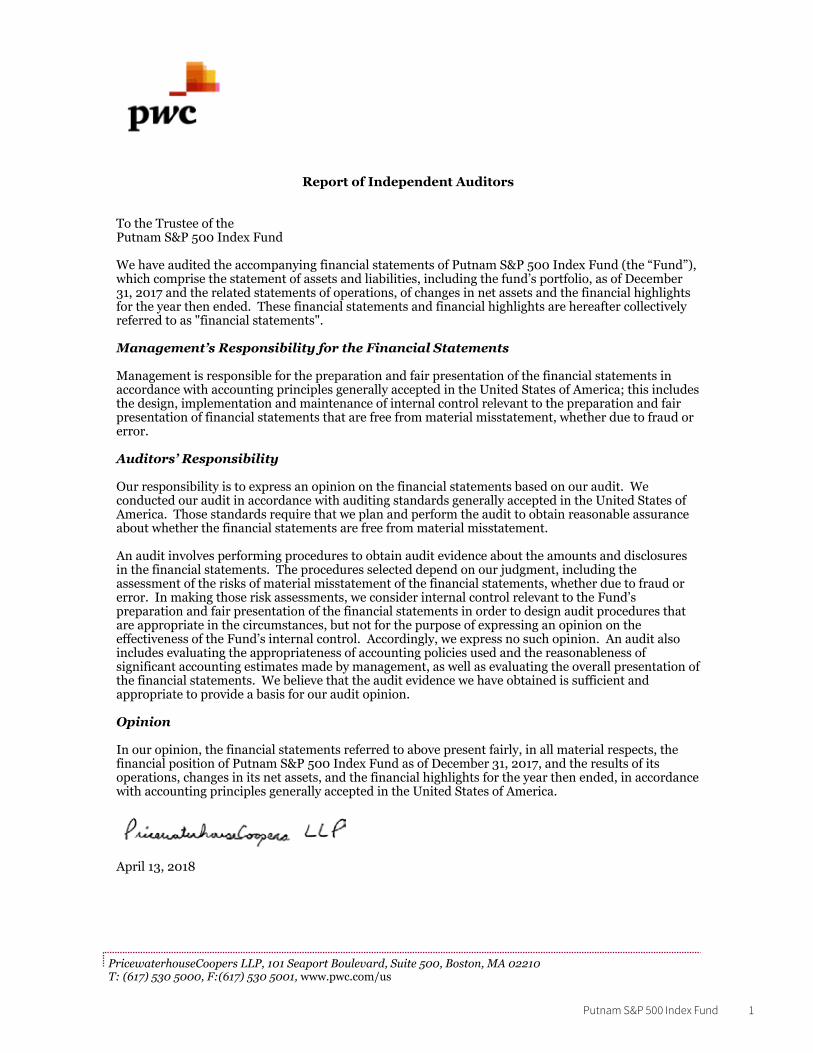
Report of Independent Auditors
To the Trustee of the Putnam S&P 500 Index Fund We have audited the accompanying financial statements of Putnam S&P 500 Index Fund (the “Fund”), which comprise the statement of assets and liabilities, including the fund’s portfolio, as of December 31, 2017 and the related statements of operations, of changes in net assets and the financial highlights for the year then ended. These financial statements and financial highlights are hereafter collectively referred to as "financial statements". Management’s Responsibility for the Financial Statements Management is responsible for the preparation and fair presentation of the financial statements in accordance with accounting principles generally accepted in the United States of America; this includes the design, implementation and maintenance of internal control relevant to the preparation and fair presentation of financial statements that are free from material misstatement, whether due to fraud or error. Auditors’ Responsibility Our responsibility is to express an opinion on the financial statements based on our audit. We conducted our audit in accordance with auditing standards generally accepted in the United States of America. Those standards require that we plan and perform the audit to obtain reasonable assurance about whether the financial statements are free from material misstatement. An audit involves performing procedures to obtain audit evidence about the amounts and disclosures in the financial statements. The procedures selected depend on our judgment, including the assessment of the risks of material misstatement of the financial statements, whether due to fraud or error. In making those risk assessments, we consider internal control relevant to the Fund’s preparation and fair presentation of the financial statements in order to design audit procedures that are appropriate in the circumstances, but not for the purpose of expressing an opinion on the effectiveness of the Fund’s internal control. Accordingly, we express no such opinion. An audit also includes evaluating the appropriateness of accounting policies used and the reasonableness of significant accounting estimates made by management, as well as evaluating the overall presentation of the financial statements. We believe that the audit evidence we have obtained is sufficient and appropriate to provide a basis for our audit opinion. Opinion In our opinion, the financial statements referred to above present fairly, in all material respects, the financial position of Putnam S&P 500 Index Fund as of December 31, 2017, and the results of its operations, changes in its net assets, and the financial highlights for the year then ended, in accordance with accounting principles generally accepted in the United States of America. April 13, 2018
PricewaterhouseCoopers LLP, 101 Seaport Boulevard, Suite 500, Boston, MA 02210 T: (617) 530 5000, F:(617) 530 5001, www.pwc.com/us
Putnam S&P 500 Index Fund 2
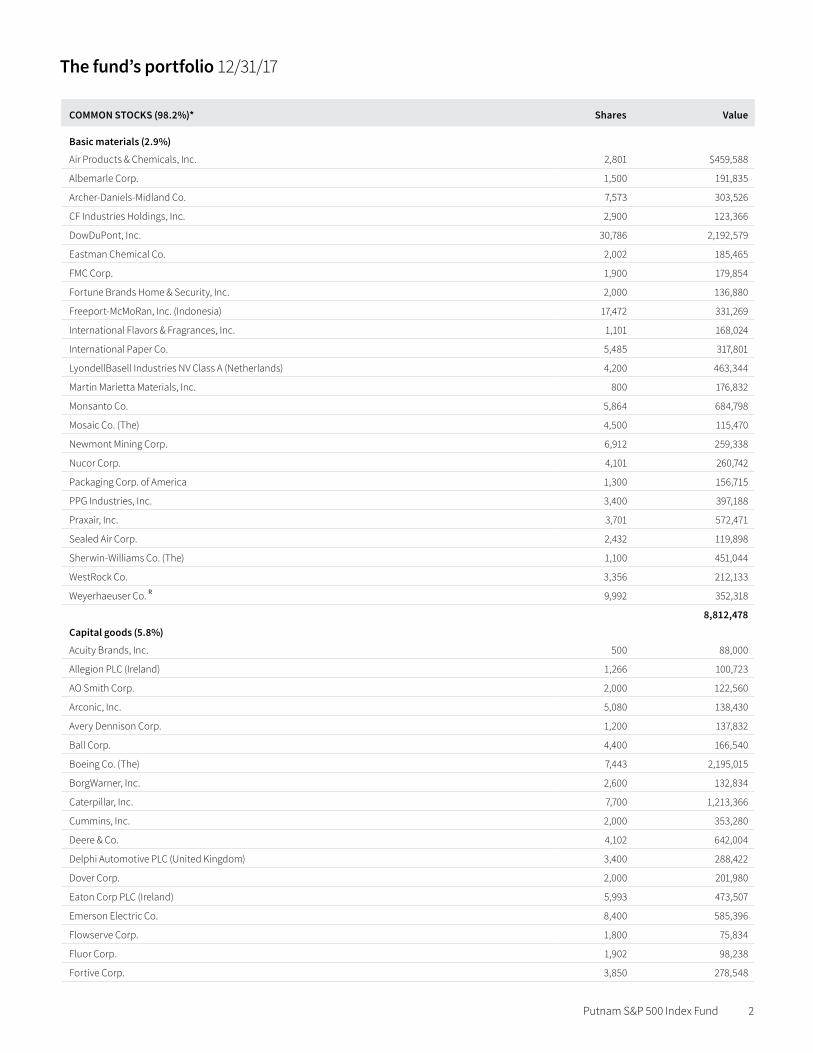
The fund’s portfolio 12/31/17
COMMON STOCKS (98.2%)* Shares Value
Basic materials (2.9%)
Air Products & Chemicals, Inc. 2,801 $459,588
Albemarle Corp. 1,500 191,835
Archer-Daniels-Midland Co. 7,573 303,526
CF Industries Holdings, Inc. 2,900 123,366
DowDuPont, Inc. 30,786 2,192,579
Eastman Chemical Co. 2,002 185,465
FMC Corp. 1,900 179,854
Fortune Brands Home & Security, Inc. 2,000 136,880
Freeport-McMoRan, Inc. (Indonesia) 17,472 331,269
International Flavors & Fragrances, Inc. 1,101 168,024
International Paper Co. 5,485 317,801
LyondellBasell Industries NV Class A (Netherlands) 4,200 463,344
Martin Marietta Materials, Inc. 800 176,832
Monsanto Co. 5,864 684,798
Mosaic Co. (The) 4,500 115,470
Newmont Mining Corp. 6,912 259,338
Nucor Corp. 4,101 260,742
Packaging Corp. of America 1,300 156,715
PPG Industries, Inc. 3,400 397,188
Praxair, Inc. 3,701 572,471
Sealed Air Corp. 2,432 119,898
Sherwin-Williams Co. (The) 1,100 451,044
WestRock Co. 3,356 212,133
Weyerhaeuser Co. R 9,992 352,318
8,812,478
Capital goods (5.8%)
Acuity Brands, Inc. 500 88,000
Allegion PLC (Ireland) 1,266 100,723
AO Smith Corp. 2,000 122,560
Arconic, Inc. 5,080 138,430
Avery Dennison Corp. 1,200 137,832
Ball Corp. 4,400 166,540
Boeing Co. (The) 7,443 2,195,015
BorgWarner, Inc. 2,600 132,834
Caterpillar, Inc. 7,700 1,213,366
Cummins, Inc. 2,000 353,280
Deere & Co. 4,102 642,004
Delphi Automotive PLC (United Kingdom) 3,400 288,422
Dover Corp. 2,000 201,980
Eaton Corp PLC (Ireland) 5,993 473,507
Emerson Electric Co. 8,400 585,396
Flowserve Corp. 1,800 75,834
Fluor Corp. 1,902 98,238
Fortive Corp. 3,850 278,548

Putnam S&P 500 Index Fund 3
COMMON STOCKS (98.2%)* cont. Shares Value
Capital goods cont.
General Dynamics Corp. 3,601 $732,623
Honeywell International, Inc. 10,125 1,552,770
Illinois Tool Works, Inc. 4,101 684,252
Ingersoll-Rand PLC (Ireland) 3,400 303,246
Jacobs Engineering Group, Inc. 1,700 112,132
Johnson Controls International PLC (Ireland) 12,574 479,195
L3 Technologies, Inc. 1,101 217,833
Leggett & Platt, Inc. 2,001 95,508
Lockheed Martin Corp. 3,301 1,059,786
Northrop Grumman Corp. 2,349 720,932
Parker Hannifin Corp. 1,863 371,818
Pentair PLC (Ireland) 2,059 145,407
Quanta Services, Inc. 1,900 74,309
Raytheon Co. 3,700 695,045
Republic Services, Inc. 3,015 203,844
Rockwell Collins, Inc. 2,101 284,938
Roper Technologies, Inc. 1,400 362,600
Stericycle, Inc. 1,100 74,789
Textron, Inc. 3,500 198,065
TransDigm Group, Inc. 600 164,772
United Technologies Corp. 9,900 1,262,943
Waste Management, Inc. 5,256 453,593
Xylem, Inc. 2,301 156,928
17,699,837
Communication services (3.9%)
American Tower Corp. R 5,701 813,362
AT&T, Inc. 81,022 3,150,135
CenturyLink, Inc. 12,471 208,016
Charter Communications, Inc. Class A 2,600 873,496
Comcast Corp. Class A 61,980 2,482,299
Crown Castle International Corp. R 5,400 599,454
DISH Network Corp. Class A 2,900 138,475
Equinix, Inc. R 1,032 467,723
Juniper Networks, Inc. 5,000 142,500
SBA Communications Corp. R 1,600 261,376
Verizon Communications, Inc. 53,708 2,842,764
11,979,600
Conglomerates (1.6%)
3M Co. 7,801 1,836,121
AMETEK, Inc. 2,900 210,163
Danaher Corp. 8,000 742,560
General Electric Co. 114,101 1,991,062
4,779,906
Consumer cyclicals (12.5%)
Advance Auto Parts, Inc. 1,000 99,690
Amazon.com, Inc. 5,300 6,198,191
Automatic Data Processing, Inc. 5,900 691,421

Putnam S&P 500 Index Fund 4
COMMON STOCKS (98.2%)* cont. Shares Value
Consumer cyclicals cont.
AutoZone, Inc. 400 $284,548
Best Buy Co., Inc. 3,300 225,951
CarMax, Inc. 2,300 147,499
Carnival Corp. (Panama) 5,500 365,035
CBS Corp. Class B (non-voting shares) 4,739 279,601
Cintas Corp. 1,100 171,413
Clorox Co. (The) 1,801 267,881
D.R. Horton, Inc. 4,301 219,652
Discovery Communications, Inc. Class A 2,100 46,998
Discovery Communications, Inc. Class C 2,900 61,393
Dollar General Corp. 3,300 306,933
Dollar Tree, Inc. 3,146 337,597
Ecolab, Inc. 3,301 442,928
Equifax, Inc. 1,601 188,790
Expedia, Inc. 1,650 197,621
Foot Locker, Inc. 1,900 89,072
Ford Motor Co. 50,860 635,241
Gap, Inc. (The) 3,187 108,549
Gartner, Inc. 1,200 147,780
General Motors Co. 17,300 709,127
Genuine Parts Co. 2,051 194,866
Global Payments, Inc. 1,900 190,456
Goodyear Tire & Rubber Co. (The) 3,201 103,424
H&R Block, Inc. 2,701 70,820
Hanesbrands, Inc. 4,800 100,368
Harley-Davidson, Inc. 2,300 117,024
Hasbro, Inc. 1,625 147,696
Hilton Worldwide Holdings, Inc. 2,700 215,622
Home Depot, Inc. (The) 15,401 2,918,952
Host Hotels & Resorts, Inc. R 9,814 194,808
IHS Markit, Ltd. (Bermuda) 4,800 216,720
Interpublic Group of Cos., Inc. (The) 5,489 110,658
Kimberly-Clark Corp. 4,625 558,053
Kohl’s Corp. 2,301 124,783
L Brands, Inc. 3,035 182,768
Lennar Corp. Class A 2,601 164,487
Lowe’s Cos., Inc. 11,201 1,041,021
Macy’s, Inc. 3,863 97,309
Marriott International, Inc./MD Class A 4,085 554,457
Masco Corp. 4,101 180,198
MasterCard, Inc. Class A 12,400 1,876,864
Mattel, Inc. 4,276 65,765
MGM Resorts International 6,700 223,713
Michael Kors Holdings, Ltd. (British Virgin Islands) 2,100 132,195
Mohawk Industries, Inc. 900 248,310
Moody’s Corp. 2,201 324,890

Putnam S&P 500 Index Fund 5
COMMON STOCKS (98.2%)* cont. Shares Value
Consumer cyclicals cont.
News Corp. Class A 4,650 $75,377
News Corp. Class B 1,300 21,580
Nielsen Holdings PLC (United Kingdom) 4,300 156,520
NIKE, Inc. Class B 17,304 1,082,365
Nordstrom, Inc. 1,600 75,808
Norwegian Cruise Line Holdings, Ltd. (Bermuda) 2,400 127,800
O’Reilly Automotive, Inc. 1,200 288,648
Omnicom Group, Inc. 3,101 225,846
PACCAR, Inc. 4,531 322,063
PayPal Holdings, Inc. 14,900 1,096,938
Priceline Group, Inc. (The) 600 1,042,644
PulteGroup, Inc. 3,587 119,268
PVH Corp. 1,100 150,931
Ralph Lauren Corp. 701 72,687
Ross Stores, Inc. 5,200 417,300
Royal Caribbean Cruises, Ltd. (Liberia) 2,300 274,344
S&P Global, Inc. 3,401 576,129
Scripps Networks Interactive Class A 1,300 110,994
Signet Jewelers, Ltd. (Bermuda) 800 45,240
Snap-On, Inc. 750 130,725
Stanley Black & Decker, Inc. 1,937 328,690
Tapestry, Inc. 3,401 150,426
Target Corp. 7,200 469,800
Tiffany & Co. 1,401 145,634
Time Warner, Inc. 10,333 945,160
TJX Cos., Inc. (The) 8,500 649,910
Total System Services, Inc. 2,221 175,659
Tractor Supply Co. 1,700 127,075
Twenty-First Century Fox, Inc. 14,100 486,873
Twenty-First Century Fox, Inc. 5,800 197,896
Under Armour, Inc. 2,200 31,746
Under Armour, Inc. Class C 2,226 29,650
United Rentals, Inc. 1,100 189,101
Verisk Analytics, Inc. Class A 2,100 201,600
VF Corp. 4,100 303,400
Viacom, Inc. Class B 4,485 138,183
Vulcan Materials Co. 1,800 231,066
Wal-Mart Stores, Inc. 19,300 1,905,875
Walt Disney Co. (The) 20,000 2,150,200
Whirlpool Corp. 1,052 177,409
Wyndham Worldwide Corp. 1,451 168,127
Wynn Resorts, Ltd. 1,100 185,449
38,381,274
Consumer staples (8.9%)
Altria Group, Inc. 25,300 1,806,673
Brown-Forman Corp. Class B 2,574 176,757

Putnam S&P 500 Index Fund 6
COMMON STOCKS (98.2%)* cont. Shares Value
Consumer staples cont.
Campbell Soup Co. 2,500 $120,275
Chipotle Mexican Grill, Inc. 300 86,709
Church & Dwight Co., Inc. 3,300 165,561
Coca-Cola Co. (The) 50,702 2,326,208
Colgate-Palmolive Co. 11,700 882,765
ConAgra Foods, Inc. 5,200 195,884
Constellation Brands, Inc. Class A 2,301 525,940
Costco Wholesale Corp. 5,801 1,079,682
Coty, Inc. Class A 6,300 125,307
CVS Health Corp. 13,340 967,150
Darden Restaurants, Inc. 1,650 158,433
Dr. Pepper Snapple Group, Inc. 2,400 232,944
Estee Lauder Cos., Inc. (The) 2,902 369,250
Fastenal Co. 3,700 202,353
General Mills, Inc. 7,702 456,652
Hershey Co. (The) 1,901 215,783
Hormel Foods Corp. 3,500 127,365
J.M. Smucker Co. (The) 1,631 202,635
Kellogg Co. 3,301 224,402
Kraft Heinz Co. (The) 7,889 613,449
Kroger Co. (The) 12,100 332,145
LKQ Corp. 3,800 154,546
McCormick & Co., Inc. (non-voting shares) 1,601 163,158
McDonald’s Corp. 10,501 1,807,432
Molson Coors Brewing Co. Class B 2,301 188,843
Mondelez International, Inc. Class A 20,168 863,190
Monster Beverage Corp. 5,500 348,095
Netflix, Inc. 5,700 1,094,172
Newell Brands, Inc. 6,226 192,383
PepsiCo, Inc. 18,902 2,266,728
Philip Morris International, Inc. 20,500 2,165,825
Procter & Gamble Co. (The) 33,550 3,082,574
Robert Half International, Inc. 1,701 94,474
Starbucks Corp. 19,202 1,102,771
Sysco Corp. 6,400 388,672
TripAdvisor, Inc. 1,550 53,413
Tyson Foods, Inc. Class A 3,701 300,040
Ulta Beauty, Inc. 800 178,928
Walgreens Boots Alliance, Inc. 11,500 835,130
WW Grainger, Inc. 700 165,375
Yum! Brands, Inc. 4,521 368,959
27,409,030
Energy (5.7%)
Anadarko Petroleum Corp. 7,303 391,733
Andeavor 1,900 217,246
Apache Corp. 5,081 214,520

Putnam S&P 500 Index Fund 7
COMMON STOCKS (98.2%)* cont. Shares Value
Energy cont.
Baker Hughes a GE Co. 5,637 $178,355
Cabot Oil & Gas Corp. 5,900 168,740
Chesapeake Energy Corp. 11,701 46,336
Chevron Corp. 24,977 3,126,871
Cimarex Energy Co. 1,300 158,613
Concho Resources, Inc. 2,000 300,440
ConocoPhillips 15,959 875,990
Devon Energy Corp. 6,801 281,561
EOG Resources, Inc. 7,600 820,116
EQT Corp. 3,200 182,144
Exxon Mobil Corp. 55,871 4,673,050
Halliburton Co. 11,379 556,092
Helmerich & Payne, Inc. 1,600 103,424
Hess Corp. 3,301 156,698
Marathon Oil Corp. 11,037 186,856
Marathon Petroleum Corp. 6,636 437,843
National Oilwell Varco, Inc. 4,901 176,534
Newfield Exploration Co. 2,500 78,825
Noble Energy, Inc. 6,402 186,554
Occidental Petroleum Corp. 10,201 751,406
ONEOK, Inc. 5,000 267,250
Phillips 66 5,729 579,488
Pioneer Natural Resources Co. 2,200 380,270
Range Resources Corp. 3,000 51,180
Schlumberger, Ltd. (Curacao) 18,364 1,237,550
TechnipFMC PLC (United Kingdom) 5,800 181,598
Valero Energy Corp. 5,900 542,269
Williams Cos., Inc. (The) 10,900 332,341
17,841,893
Financials (17.1%)
Affiliated Managers Group, Inc. 700 143,675
Aflac, Inc. 5,201 456,544
Alexandria Real Estate Equities, Inc. R 1,300 169,767
Alliance Data Systems Corp. 600 152,088
Allstate Corp. (The) 4,679 489,938
American Express Co. 9,701 963,406
American International Group, Inc. 11,988 714,245
Ameriprise Financial, Inc. 1,881 318,773
Aon PLC (United Kingdom) 3,325 445,550
Apartment Investment & Management Co. Class A R 1,851 80,907
Arthur J. Gallagher & Co. 2,300 145,544
Assurant, Inc. 700 70,588
AvalonBay Communities, Inc. R 1,881 335,589
Bank of America Corp. 129,313 3,817,320
Bank of New York Mellon Corp. (The) 13,752 740,683
BB&T Corp. 10,600 527,032
Putnam S&P 500 Index Fund 8
COMMON STOCKS (98.2%)* cont. Shares Value
Financials cont.
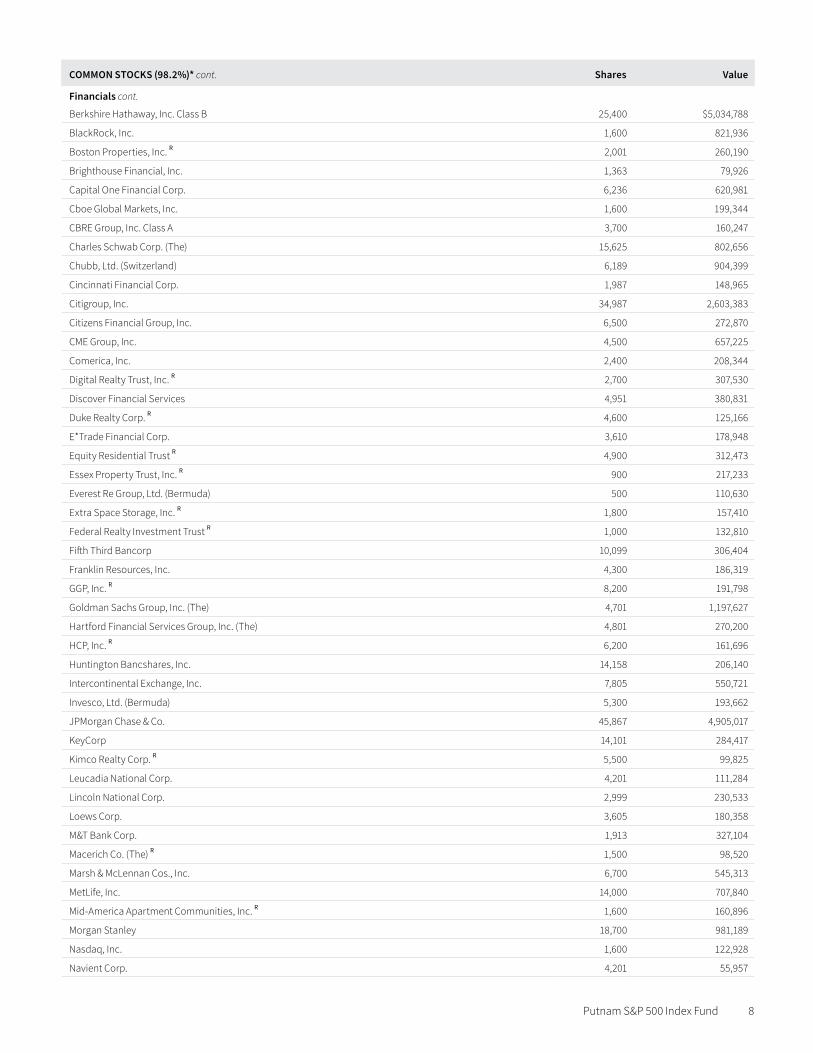
Berkshire Hathaway, Inc. Class B 25,400 $5,034,788
BlackRock, Inc. 1,600 821,936
Boston Properties, Inc. R 2,001 260,190
Brighthouse Financial, Inc. 1,363 79,926
Capital One Financial Corp. 6,236 620,981
Cboe Global Markets, Inc. 1,600 199,344
CBRE Group, Inc. Class A 3,700 160,247
Charles Schwab Corp. (The) 15,625 802,656
Chubb, Ltd. (Switzerland) 6,189 904,399
Cincinnati Financial Corp. 1,987 148,965
Citigroup, Inc. 34,987 2,603,383
Citizens Financial Group, Inc. 6,500 272,870
CME Group, Inc. 4,500 657,225
Comerica, Inc. 2,400 208,344
Digital Realty Trust, Inc. R 2,700 307,530
Discover Financial Services 4,951 380,831
Duke Realty Corp. R 4,600 125,166
E*Trade Financial Corp. 3,610 178,948
Equity Residential Trust R 4,900 312,473
Essex Property Trust, Inc. R 900 217,233
Everest Re Group, Ltd. (Bermuda) 500 110,630
Extra Space Storage, Inc. R 1,800 157,410
Federal Realty Investment Trust R 1,000 132,810
Fifth Third Bancorp 10,099 306,404
Franklin Resources, Inc. 4,300 186,319
GGP, Inc. R 8,200 191,798
Goldman Sachs Group, Inc. (The) 4,701 1,197,627
Hartford Financial Services Group, Inc. (The) 4,801 270,200
HCP, Inc. R 6,200 161,696
Huntington Bancshares, Inc. 14,158 206,140
Intercontinental Exchange, Inc. 7,805 550,721
Invesco, Ltd. (Bermuda) 5,300 193,662
JPMorgan Chase & Co. 45,867 4,905,017
KeyCorp 14,101 284,417
Kimco Realty Corp. R 5,500 99,825
Leucadia National Corp. 4,201 111,284
Lincoln National Corp. 2,999 230,533
Loews Corp. 3,605 180,358
M&T Bank Corp. 1,913 327,104
Macerich Co. (The) R 1,500 98,520
Marsh & McLennan Cos., Inc. 6,700 545,313
MetLife, Inc. 14,000 707,840
Mid-America Apartment Communities, Inc. R 1,600 160,896
Morgan Stanley 18,700 981,189
Nasdaq, Inc. 1,600 122,928
Navient Corp. 4,201 55,957

Putnam S&P 500 Index Fund 9
COMMON STOCKS (98.2%)* cont. Shares Value
Financials cont.
Northern Trust Corp. 2,900 $289,681
People’s United Financial, Inc. 4,600 86,020
PNC Financial Services Group, Inc. (The) 6,343 915,231
Principal Financial Group, Inc. 3,501 247,031
Progressive Corp. (The) 7,501 422,456
Prologis, Inc. R 6,852 442,023
Prudential Financial, Inc. 5,601 644,003
Public Storage R 1,901 397,309
Raymond James Financial, Inc. 1,800 160,740
Realty Income Corp. R 3,500 199,570
Regency Centers Corp. R 2,000 138,360
Regions Financial Corp. 15,901 274,769
Simon Property Group, Inc. R 4,065 698,123
SL Green Realty Corp. R 1,300 131,209
State Street Corp. 4,901 478,387
SunTrust Banks, Inc. 6,500 419,835
Synchrony Financial 9,900 382,239
T Rowe Price Group, Inc. 3,300 346,269
Torchmark Corp. 1,500 136,065
Travelers Cos., Inc. (The) 3,637 493,323
U.S. Bancorp 20,841 1,116,661
UDR, Inc. R 3,500 134,820
Unum Group 3,004 164,890
Visa, Inc. Class A 24,100 2,747,882
Vornado Realty Trust R 2,251 175,983
Wells Fargo & Co. 58,831 3,569,277
Welltower, Inc. R 4,800 306,096
Willis Towers Watson PLC (Ireland) 1,800 271,242
XL Group, Ltd. (Bermuda) 3,401 119,579
Zions Bancorporation 2,700 137,241
52,391,996
Health care (13.3%)
Abbott Laboratories 22,951 1,309,814
AbbVie, Inc. 21,101 2,040,678
Aetna, Inc. 4,320 779,285
Alexion Pharmaceuticals, Inc. 2,900 346,811
Align Technology, Inc. 1,000 222,190
Allergan PLC (Ireland) 4,411 721,551
AmerisourceBergen Corp. 2,202 202,188
Amgen, Inc. 9,711 1,688,743
Anthem, Inc. 3,400 765,034
Baxter International, Inc. 6,588 425,848
Becton Dickinson and Co. 3,514 752,143
Biogen, Inc. 2,811 895,500
Boston Scientific Corp. 18,191 450,955
Bristol-Myers Squibb Co. 21,601 1,323,709

Putnam S&P 500 Index Fund 10
COMMON STOCKS (98.2%)* cont. Shares Value
Health care cont.
Cardinal Health, Inc. 3,951 $242,078
Celgene Corp. 10,302 1,075,117
Centene Corp. 2,300 232,024
Cerner Corp. 4,100 276,299
Cigna Corp. 3,301 670,400
Cooper Cos., Inc. (The) 600 130,728
DaVita Inc. 1,900 137,275
DENTSPLY Sirona, Inc. 3,100 204,073
Edwards Lifesciences Corp. 2,800 315,588
Eli Lilly & Co. 12,801 1,081,172
Envision Healthcare Corp. 1,700 58,752
Express Scripts Holding Co. 7,766 579,654
Gilead Sciences, Inc. 17,402 1,246,679
HCA Healthcare, Inc. 3,600 316,224
Henry Schein, Inc. 2,000 139,760
Hologic, Inc. 3,500 149,625
Humana, Inc. 1,901 471,581
IDEXX Laboratories, Inc. 1,200 187,656
Illumina, Inc. 1,900 415,131
Incyte Corp. 2,200 208,362
Intuitive Surgical, Inc. 1,500 547,410
IQVIA Holdings, Inc. 1,900 186,010
Johnson & Johnson 35,402 4,946,367
Laboratory Corp. of America Holdings 1,401 223,474
McKesson Corp. 2,808 437,908
Medtronic PLC (Ireland) 17,903 1,445,667
Merck & Co., Inc. 36,323 2,043,895
Mettler-Toledo International, Inc. 300 185,856
Mylan NV (Netherlands) 7,000 296,170
Patterson Cos., Inc. 900 32,517
PerkinElmer, Inc. 1,501 109,753
Perrigo Co. PLC (Ireland) 1,800 156,888
Pfizer, Inc. 78,478 2,842,473
Quest Diagnostics, Inc. 1,900 187,131
Regeneron Pharmaceuticals, Inc. 1,000 375,960
ResMed, Inc. 1,900 160,911
Stryker Corp. 4,201 650,483
Thermo Fisher Scientific, Inc. 5,301 1,006,554
UnitedHealth Group, Inc. 12,701 2,800,062
Universal Health Services, Inc. Class B 1,200 136,020
Varian Medical Systems, Inc. 1,201 133,491
Ventas, Inc. R 4,600 276,046
Vertex Pharmaceuticals, Inc. 3,300 494,538
Waters Corp. 1,100 212,509
Zimmer Biomet Holdings, Inc. 2,711 327,136
Zoetis, Inc. 6,400 461,056
40,738,912
Putnam S&P 500 Index Fund 11
COMMON STOCKS (98.2%)* cont. Shares Value
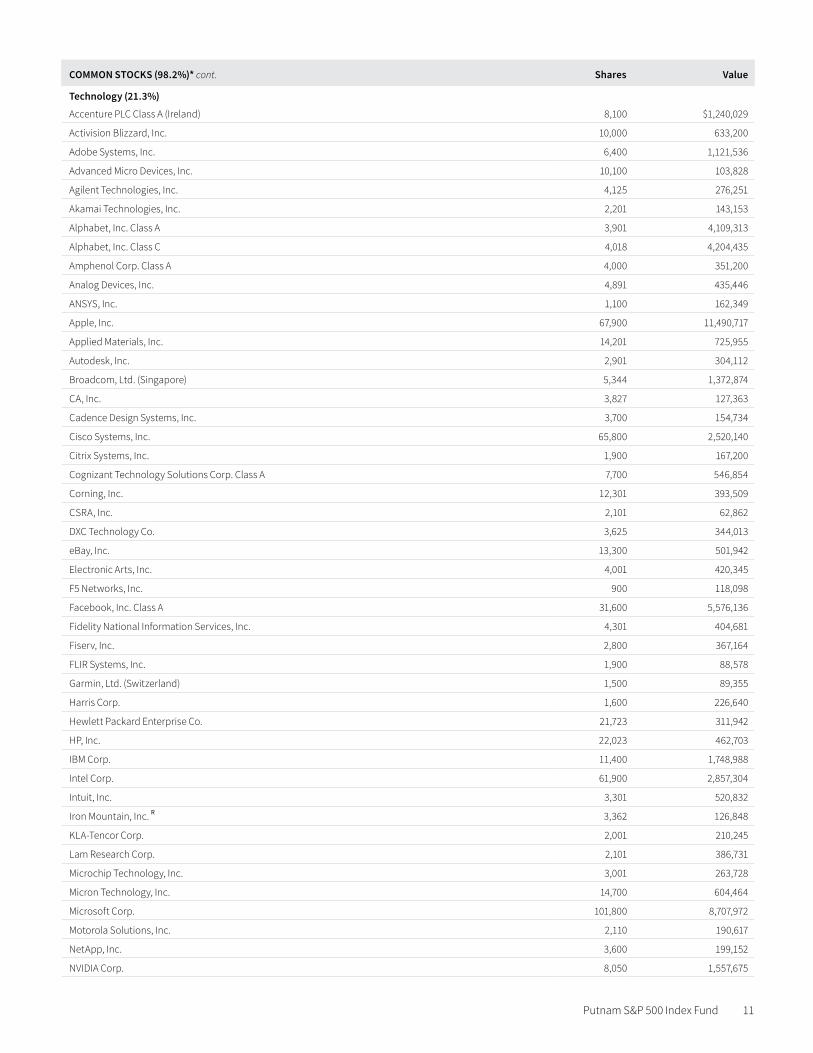
Technology (21.3%)
Accenture PLC Class A (Ireland) 8,100 $1,240,029
Activision Blizzard, Inc. 10,000 633,200
Adobe Systems, Inc. 6,400 1,121,536
Advanced Micro Devices, Inc. 10,100 103,828
Agilent Technologies, Inc. 4,125 276,251
Akamai Technologies, Inc. 2,201 143,153
Alphabet, Inc. Class A 3,901 4,109,313
Alphabet, Inc. Class C 4,018 4,204,435
Amphenol Corp. Class A 4,000 351,200
Analog Devices, Inc. 4,891 435,446
ANSYS, Inc. 1,100 162,349
Apple, Inc. 67,900 11,490,717
Applied Materials, Inc. 14,201 725,955
Autodesk, Inc. 2,901 304,112
Broadcom, Ltd. (Singapore) 5,344 1,372,874
CA, Inc. 3,827 127,363
Cadence Design Systems, Inc. 3,700 154,734
Cisco Systems, Inc. 65,800 2,520,140
Citrix Systems, Inc. 1,900 167,200
Cognizant Technology Solutions Corp. Class A 7,700 546,854
Corning, Inc. 12,301 393,509
CSRA, Inc. 2,101 62,862
DXC Technology Co. 3,625 344,013
eBay, Inc. 13,300 501,942
Electronic Arts, Inc. 4,001 420,345
F5 Networks, Inc. 900 118,098
Facebook, Inc. Class A 31,600 5,576,136
Fidelity National Information Services, Inc. 4,301 404,681
Fiserv, Inc. 2,800 367,164
FLIR Systems, Inc. 1,900 88,578
Garmin, Ltd. (Switzerland) 1,500 89,355
Harris Corp. 1,600 226,640
Hewlett Packard Enterprise Co. 21,723 311,942
HP, Inc. 22,023 462,703
IBM Corp. 11,400 1,748,988
Intel Corp. 61,900 2,857,304
Intuit, Inc. 3,301 520,832
Iron Mountain, Inc. R 3,362 126,848
KLA-Tencor Corp. 2,001 210,245
Lam Research Corp. 2,101 386,731
Microchip Technology, Inc. 3,001 263,728
Micron Technology, Inc. 14,700 604,464
Microsoft Corp. 101,800 8,707,972
Motorola Solutions, Inc. 2,110 190,617
NetApp, Inc. 3,600 199,152
NVIDIA Corp. 8,050 1,557,675
Putnam S&P 500 Index Fund 12
COMMON STOCKS (98.2%)* cont. Shares Value
Technology cont.
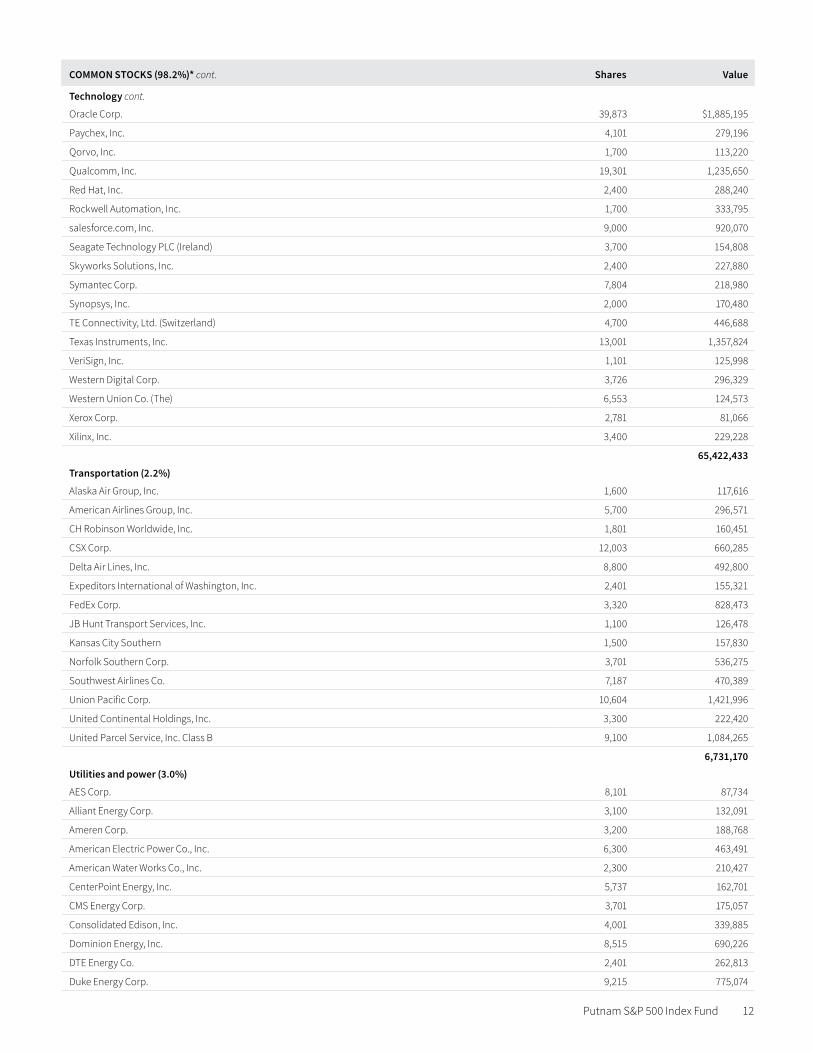
Oracle Corp. 39,873 $1,885,195
Paychex, Inc. 4,101 279,196
Qorvo, Inc. 1,700 113,220
Qualcomm, Inc. 19,301 1,235,650
Red Hat, Inc. 2,400 288,240
Rockwell Automation, Inc. 1,700 333,795
salesforce.com, Inc. 9,000 920,070
Seagate Technology PLC (Ireland) 3,700 154,808
Skyworks Solutions, Inc. 2,400 227,880
Symantec Corp. 7,804 218,980
Synopsys, Inc. 2,000 170,480
TE Connectivity, Ltd. (Switzerland) 4,700 446,688
Texas Instruments, Inc. 13,001 1,357,824
VeriSign, Inc. 1,101 125,998
Western Digital Corp. 3,726 296,329
Western Union Co. (The) 6,553 124,573
Xerox Corp. 2,781 81,066
Xilinx, Inc. 3,400 229,228
65,422,433
Transportation (2.2%)
Alaska Air Group, Inc. 1,600 117,616
American Airlines Group, Inc. 5,700 296,571
CH Robinson Worldwide, Inc. 1,801 160,451
CSX Corp. 12,003 660,285
Delta Air Lines, Inc. 8,800 492,800
Expeditors International of Washington, Inc. 2,401 155,321
FedEx Corp. 3,320 828,473
JB Hunt Transport Services, Inc. 1,100 126,478
Kansas City Southern 1,500 157,830
Norfolk Southern Corp. 3,701 536,275
Southwest Airlines Co. 7,187 470,389
Union Pacific Corp. 10,604 1,421,996
United Continental Holdings, Inc. 3,300 222,420
United Parcel Service, Inc. Class B 9,100 1,084,265
6,731,170
Utilities and power (3.0%)
AES Corp. 8,101 87,734
Alliant Energy Corp. 3,100 132,091
Ameren Corp. 3,200 188,768
American Electric Power Co., Inc. 6,300 463,491
American Water Works Co., Inc. 2,300 210,427
CenterPoint Energy, Inc. 5,737 162,701
CMS Energy Corp. 3,701 175,057
Consolidated Edison, Inc. 4,001 339,885
Dominion Energy, Inc. 8,515 690,226
DTE Energy Co. 2,401 262,813
Duke Energy Corp. 9,215 775,074

Putnam S&P 500 Index Fund 13
COMMON STOCKS (98.2%)* cont. Shares Value
Utilities and power cont.
Edison International 4,201 $265,671
Entergy Corp. 2,300 187,197
Eversource Energy 4,100 259,038
Exelon Corp. 12,626 497,591
FirstEnergy Corp. 5,936 181,760
Kinder Morgan, Inc. 25,159 454,623
NextEra Energy, Inc. 6,200 968,378
NiSource, Inc. 4,205 107,942
NRG Energy, Inc. 3,900 111,072
PG&E Corp. 6,600 295,878
Pinnacle West Capital Corp. 1,500 127,770
PPL Corp. 8,801 272,391
Public Service Enterprise Group, Inc. 6,400 329,600
SCANA Corp. 2,000 79,560
Sempra Energy 3,311 354,012
Southern Co. (The) 13,100 629,979
WEC Energy Group, Inc. 4,086 271,433
Xcel Energy, Inc. 6,646 319,739
9,201,901
Total common stocks (cost $183,916,872) $301,390,430
SHORT-TERM INVESTMENTS (0.9%)* Shares Value
EB Temporary Investment Fund 2,631,777 $2,631,777
Total short-term investments (cost $2,631,777) $2,631,777
TOTAL INVESTMENTS
Total investments (cost $186,548,649) $304,022,207
Notes to the fund’s portfolioUnless noted otherwise, the notes to the fund’s portfolio are for the close of the fund’s reporting period, which ran from January 1, 2017 through December 31, 2017 (the reporting period). Within the following notes to the portfolio, references to “ASC 820” represent Accounting Standards Codification 820 Fair Value Measurements and Disclosures.
* Percentages indicated are based on net assets of $306,809,932. R Real Estate Investment Trust.
FUTURES CONTRACTS OUTSTANDING at 12/31/17
Number of contracts
Notional amount/
ValueExpiration date
Unrealized appreciation
S&P 500 Index Fund (CME) 8 $5,352,000 Mar-18 $39,187
Total $39,187
Putnam S&P 500 Index Fund 14
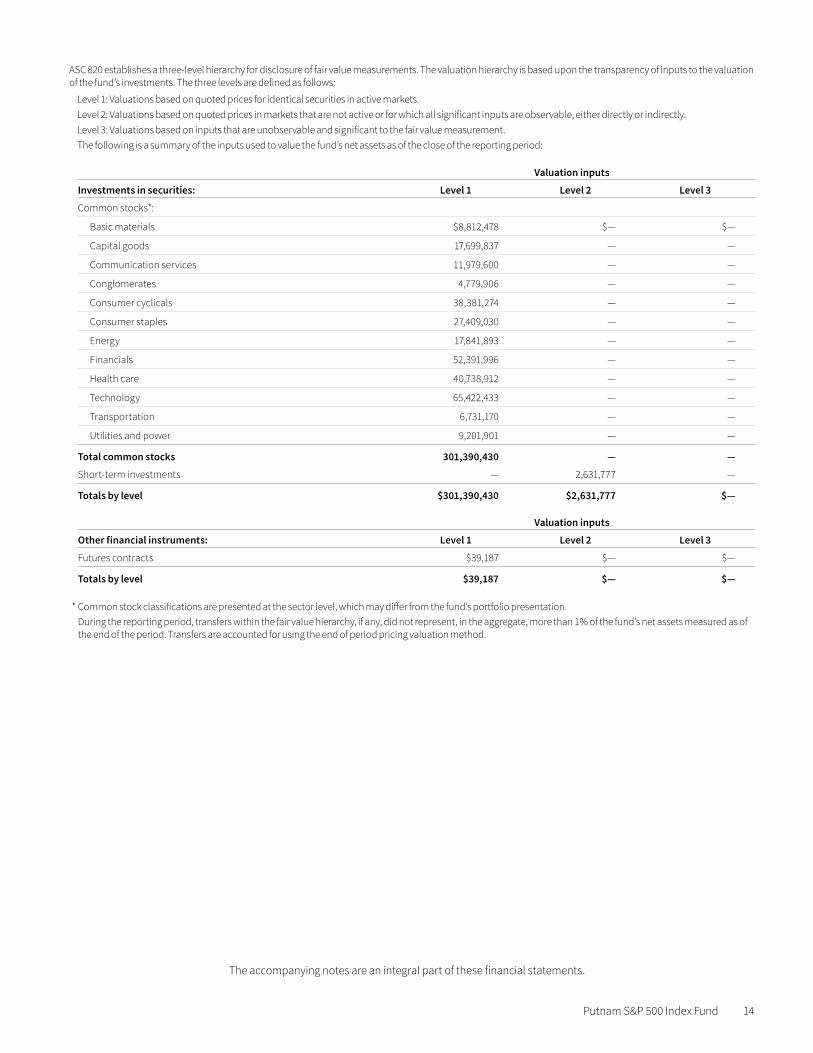
ASC 820 establishes a three-level hierarchy for disclosure of fair value measurements. The valuation hierarchy is based upon the transparency of inputs to the valuation of the fund’s investments. The three levels are defined as follows:
Level 1: Valuations based on quoted prices for identical securities in active markets.Level 2: Valuations based on quoted prices in markets that are not active or for which all significant inputs are observable, either directly or indirectly.Level 3: Valuations based on inputs that are unobservable and significant to the fair value measurement.The following is a summary of the inputs used to value the fund’s net assets as of the close of the reporting period:
Valuation inputs
Investments in securities: Level 1 Level 2 Level 3
Common stocks*:
Basic materials $8,812,478 $— $—
Capital goods 17,699,837 — —
Communication services 11,979,600 — —
Conglomerates 4,779,906 — —
Consumer cyclicals 38,381,274 — —
Consumer staples 27,409,030 — —
Energy 17,841,893 — —
Financials 52,391,996 — —
Health care 40,738,912 — —
Technology 65,422,433 — —
Transportation 6,731,170 — —
Utilities and power 9,201,901 — —
Total common stocks 301,390,430 — —
Short-term investments — 2,631,777 —
Totals by level $301,390,430 $2,631,777 $—
Valuation inputs
Other financial instruments: Level 1 Level 2 Level 3
Futures contracts $39,187 $— $—
Totals by level $39,187 $— $—
* Common stock classifications are presented at the sector level, which may differ from the fund’s portfolio presentation.During the reporting period, transfers within the fair value hierarchy, if any, did not represent, in the aggregate, more than 1% of the fund’s net assets measured as of the end of the period. Transfers are accounted for using the end of period pricing valuation method.
The accompanying notes are an integral part of these financial statements.

Putnam S&P 500 Index Fund 15
The accompanying notes are an integral part of these financial statements.
Statement of assets and liabilities 12/31/17
ASSETS
Investment in securities, at value (Note 2):
Unaffiliated issuers (identified cost $186,548,649) $304,022,207
Cash 11,610
Broker cash held for futures contracts (Note 2) 2,058,699
Receivable for fund units sold 298,509
Dividends, interest and other receivables 532,260
Receivable for variation margin (Note 2) 13,946
Total assets 306,937,231
LIABILITIES
Payable for fund units redeemed 49,312
Payable for compensation of Trustee (Note 3) 57,687
Payable for audit fees (Note 3) 20,300
Total liabilities 127,299
Net assets $306,809,932
COMPUTATION OF NET ASSET VALUE
Net assets per class A unit $72,502,482
Units outstanding 847,199
Net asset value per unit $85.58
Net assets per class M unit $96,996,638
Units outstanding 1,100,743
Net asset value per unit $88.12
Net asset per original class units $137,310,812
Units outstanding 1,580,321
Net asset value per unit $86.89
Putnam S&P 500 Index Fund 16
The accompanying notes are an integral part of these financial statements.
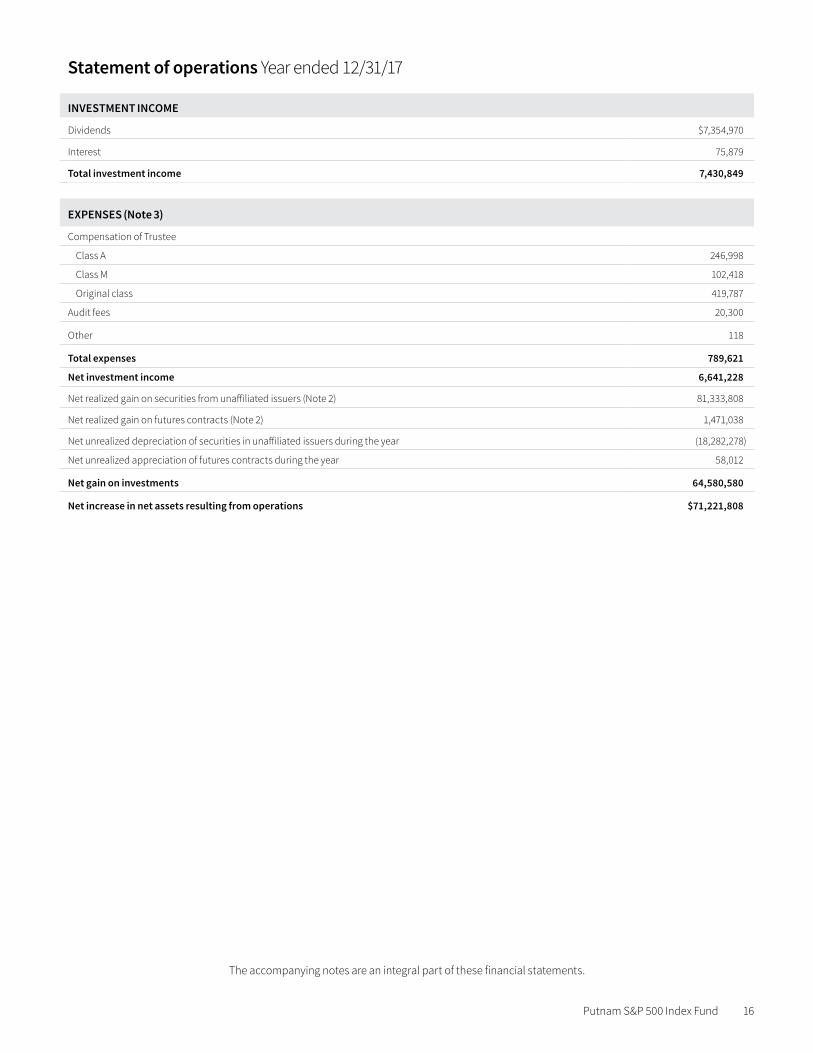
Statement of operations Year ended 12/31/17
INVESTMENT INCOME
Dividends $7,354,970
Interest 75,879
Total investment income 7,430,849
EXPENSES (Note 3)
Compensation of Trustee
Class A 246,998
Class M 102,418
Original class 419,787
Audit fees 20,300
Other 118
Total expenses 789,621
Net investment income 6,641,228
Net realized gain on securities from unaffiliated issuers (Note 2) 81,333,808
Net realized gain on futures contracts (Note 2) 1,471,038
Net unrealized depreciation of securities in unaffiliated issuers during the year (18,282,278)
Net unrealized appreciation of futures contracts during the year 58,012
Net gain on investments 64,580,580
Net increase in net assets resulting from operations $71,221,808

Putnam S&P 500 Index Fund 17
The accompanying notes are an integral part of these financial statements.
Statement of changes in net assets
DECREASE IN NET ASSETSYear ended
12/31/17
Operations:
Net investment income $6,641,228
Net realized gain on investments 82,804,845
Net unrealized depreciation of investments (18,224,265)
Net increase in net assets resulting from operations 71,221,808
Principal transactions
Class A
Proceeds from sale of units 13,150,293
Value of units redeemed (21,675,174)
Class M
Proceeds from sale of units 80,915,730
Value of units redeemed (98,587,342)
Original class
Proceeds from sale of units 23,966,927
Value of units redeemed (153,909,243)
Total decrease in principal transactions (156,138,809)
Total decrease in net assets (84,917,001)
NET ASSETS
Beginning of year 391,726,933
End of year $306,809,932
NUMBER OF UNITS OF THE FUND
Class A
Units outstanding at beginning of year 955,811
Sold 172,172
Redeemed (280,784)
Units outstanding at end of year 847,199
Class M
Units outstanding at beginning of year 1,251,727
Sold 1,052,304
Redeemed (1,203,288)
Units outstanding at end of year 1,100,743
Original class
Units outstanding at beginning of year 3,266,350
Sold 309,266
Redeemed (1,995,295)
Units outstanding at end of year 1,580,321

Putnam S&P 500 Index Fund 18
Financial highlights (For a unit outstanding throughout the year)
CLASS A PER-UNIT OPERATING PERFORMANCEYear ended
12/31/17Net asset value, beginning of year $70.53
Investment operations:
Net investment income (a) 1.30
Net realized and unrealized gain (loss) on investments 13.75
Total from investment operations 15.05
Net asset value, end of year $85.58
Total return at net asset value (%) 21.34
RATIOS AND SUPPLEMENTAL DATA
Net assets, end of year (in thousands) $72,502
Ratio of expenses to average net assets (%) 0.36
Ratio of net investment income to average net assets (%) 1.67
CLASS M PER-UNIT OPERATING PERFORMANCENet asset value, beginning of year $72.43
Investment operations:
Net investment income (a) 1.54
Net realized and unrealized gain (loss) on investments 14.15
Total from investment operations 15.69
Net asset value, end of year $88.12
Total return at net asset value (%) 21.66
RATIOS AND SUPPLEMENTAL DATANet assets, end of year (in thousands) $96,997
Ratio of expenses to average net assets (%) 0.09
Ratio of net investment income to average net assets (%) 1.94
ORIGINAL CLASS PER-UNIT OPERATING PERFORMANCENet asset value, beginning of year $71.53
Investment operations:
Net investment income (a) 1.38
Net realized and unrealized gain (loss) on investments 13.98
Total from investment operations 15.36
Net asset value, end of year $86.89
Total return at net asset value (%) 21.47
RATIOS AND SUPPLEMENTAL DATANet assets, end of year (in thousands) $137,311
Ratio of expenses to average net assets (%) 0.26
Ratio of net investment income to average net assets (%) 1.77
(a) Per unit net investment income has been determined on the basis of the average number of units outstanding during the year.
The accompanying notes are an integral part of these financial statements.

Putnam S&P 500 Index Fund 19
1. Description of the fundWithin the following Notes to financial statements, references to “State Street”, if any, represent State Street Bank and Trust Company and refer-ences to “OTC”, if any, represent over-the-counter. Unless otherwise noted, the “reporting period” represents the period from January 1, 2017 through December 31, 2017.
Putnam S&P 500 Index Fund (the “fund”) is a fund established and maintained by Putnam Fiduciary Trust Company (“PFTC”) as Trustee (the “Trustee” and “Manager”) pursuant to the Declaration of Trust for the Putnam Fiduciary Trust Company Investment Funds for Pension and Profit Sharing Trusts (the “Trust”), as amended and restated March 31, 2008. PFTC has hired its affiliate, PanAgora Asset Management, Inc., to provide certain non-discretionary investment advisory and administrative services to Putnam in connection with the fund. The fund’s objective is to achieve a return, before the assessment of fees, that closely approximates the return of the Standard & Poor’s 500 Composite Stock Price Index (S&P 500 Index), a common measure of U.S. market performance.
The fund currently offers three classes of units, class A, class M and original class of units.
In the normal course of business, the fund enters into contracts that may include agreements to indemnify another party under given circum-stances. The fund’s maximum exposure under these arrangements is unknown as this would involve future claims that may be, but have not yet been, made against the fund. However, the fund’s management team expects the risk of material loss to be remote.
Investment Policies The fund will invest primarily in the securities that constitute the S&P 500 Index, either directly or through the purchase of shares of collective investment trusts having investment objectives similar to that of the fund.
For liquidity and hedging purposes, the fund may invest in high-quality, money market instruments and in money market funds that invest exclu-sively in high-quality, money market instruments. The fund also uses stock index futures contracts in order to manage transaction costs and minimize tracking errors between the fund and the S&P 500 Index.
2. Summary of Significant Accounting PoliciesThe following is a summary of significant accounting policies consistently followed by the fund in the preparation of its financial statements. The preparation of financial statements is in conformity with accounting principles generally accepted in the United States of America and requires management to make estimates and assumptions that affect the reported amounts of assets and liabilities in the financial statements and the reported amounts of increases and decreases in net assets from operations. Actual results could differ from those estimates. Subsequent events after the Statement of assets and liabilities date through the date that the financial statements were issued, April 13, 2018, have been evaluated in the preparation of the financial statements. The fund is an investment company and follows accounting and reporting guidance under Financial Accounting Standards Board (“FASB”) Accounting Standards Codification Topic 946, Financial Services – Investment Companies.
Investment income, realized and unrealized gains and losses and expenses of the fund are borne pro-rata based on the relative net assets of each class to the total net assets of the fund, except that each class bears expenses unique to that class (including the distribution fees applicable to such classes). Each class votes as a class only with respect to its own distribution plan or other matters on which a class vote is required by law or determined by the Trustee. If the fund were liquidated, units of each class would receive their pro-rata unit of the net assets of the fund. In addition, the Trustee declares separate dividends on each class of units, if any.
Security Valuation Investments for which market quotations are readily available are valued at the last reported sales price on their principal exchange, or official closing price for certain markets, and are classified as Level 1 securities under Accounting Standards Codification 820 Fair Value Measurements and Disclosures (ASC 820). If no sales are reported, as in the case of some securities that are traded OTC, a security is valued at its last reported bid price and is generally categorized as a Level 2 security. Securities quoted in foreign currencies, if any, are translated into U.S. dollars at the current exchange rate. Short-term securities with remaining maturities of 60 days or less are valued using an independent pricing service approved by the Trustee, and are classified as Level 2 securities.
To the extent a pricing service or dealer is unable to value a security or provides a valuation that the Trustee does not believe accurately reflects the security’s fair value, the security will be valued at fair value by the Trustee in accordance with policies and procedures approved by the Trustee. Certain investments, including certain restricted and illiquid securities and derivatives, are also valued at fair value following procedures approved by the Trustee. These valuations consider such factors as significant market or specific security events such as interest rate or credit quality changes, various relationships with other securities, discount rates, U.S. Treasury, U.S. swap and credit yields, index levels, convexity expo-sures, recovery rates, sales and other multiples and resale restrictions. These securities are classified as Level 2 or as Level 3 depending on the priority of the significant inputs.
Such valuations and procedures are reviewed periodically by the Trustee. The fair value of securities is generally determined as the amount that the fund could reasonably expect to realize from an orderly disposition of such securities over a reasonable period of time. By its nature, a fair value price is a good faith estimate of the value of a security in a current sale and does not reflect an actual market price, which may be different by a material amount.
Notes to financial statements 12/31/17

Putnam S&P 500 Index Fund 20
The fund’s investment in the EB Temporary Investment Fund is valued at its most recent net asset value; the value of the investments held by the EB Temporary Investment Fund is determined using amortized cost method, which approximates market value. The EB Temporary Investment Fund invests primarily in a diversified portfolio of investment grade money market instruments including, but not limited to, commercial paper, notes, repurchase agreements or other short term securities which have a maturity date not exceeding thirteen (13) months from the date of purchase. These securities are classified as Level 1 or as Level 2 depending on the priority of the significant inputs. The fund may request redemption of its units in accordance with the governing documents of the fund from time to time at the discretion of the Trustee.
Security Transactions and Related Investment Income Security transactions are recorded on the trade date (the date the order to buy or sell is executed). Gains or losses on securities sold are determined on the identified cost basis.
Interest income, net of any applicable withholding taxes, is recorded on the accrual basis. Dividend income, net of any applicable withholding taxes, is recognized on the ex-dividend date except that certain dividends from foreign securities, if any, are recognized as soon as the fund is informed of the ex-dividend date. Non-cash dividends, if any, are recorded at the fair value of the securities received. Dividends representing a return of capital or capital gains, if any, are reflected as a reduction of cost and/or as a realized gain.
Distributions received from other investment funds, if any, are recorded on the ex-dividend date and retain the character of income as earned by the other investment funds.
All income and capital gains earned by the fund will be reinvested by the fund and included in the calculation of net asset value. There are no distributions made by the fund to participating unitholders.
Futures Contracts The potential risk to the fund is that the change in value of futures contracts may not correspond to the change in value of the hedged instru-ments. In addition, losses may arise from changes in the value of the underlying instruments, if there is an illiquid secondary market for the contracts, if interest or exchange rates move unexpectedly or if the counterparty to the contract is unable to perform. With futures, there is minimal counterparty credit risk to the fund since futures are exchange traded and the exchange’s clearinghouse, as counterparty to all exchange traded futures, guarantees the futures against default. Risks may exceed amounts recognized on the Statement of assets and liabilities. When the contract is closed, the fund records a realized gain or loss equal to the difference between the value of the contract at the time it was opened and the value at the time it was closed.
Futures contracts are valued at the quoted daily settlement prices established by the exchange on which they trade. The fund and the broker agree to exchange an amount of cash equal to the daily fluctuation in the value of the futures contract. Such receipts or payments are known as “variation margin.”
Futures contracts outstanding at period end, if any, are listed after the fund’s portfolio.
At close of the reporting period, the fund has deposited cash valued at $2,058,699 in a segregated account to cover margin requirements on open futures contracts.
Sales and Redemptions of Units of Participation Subscriptions to the fund will be accepted on a daily basis. Units will be credited based upon the net asset value per unit as of the close of the business on the date the subscription is received by the Trustee. All net income and capital gains of the fund will be reinvested. Withdrawals generally will be permitted daily at a redemption price equal to the net asset value per unit redeemed as determined by the Trustee. Withdrawal requests must be received by the Trustee prior to the closing of the New York Stock Exchange on the date on which the withdrawal is desired in order to receive the net asset value per unit for such date. One unitholder held 20.78% and 17.09% of the fund’s total Class A and original class units outstanding at the end of the reporting period, respectively. An affiliate of the Trustee held 27.69%, 85.13% and 51.34% of Class A, Class M and original class units at the end of the reporting period, respectively.
Federal Income Taxes It is the fund’s policy to comply with the requirements of Section 501(a) of the Internal Revenue Code relating to collective investment of employee benefit funds. Accordingly, the fund is exempt from federal income taxes and no federal income tax provision is required.
The fund is subject to the provisions of Accounting Standards Codification 740 Income Taxes (ASC 740). ASC 740 sets forth a minimum threshold for financial statement recognition of the benefit of a tax position taken or expected to be taken in a tax return. The fund did not have a liability to record for any unrecognized tax benefits in the accompanying financial statements. No provision has been made for federal taxes on income, capital gains or unrealized appreciation on securities held nor for excise tax on income and capital gains, if any. The fund’s prior fiscal years remain subject to examination by the Internal Revenue Service.
Putnam S&P 500 Index Fund 21
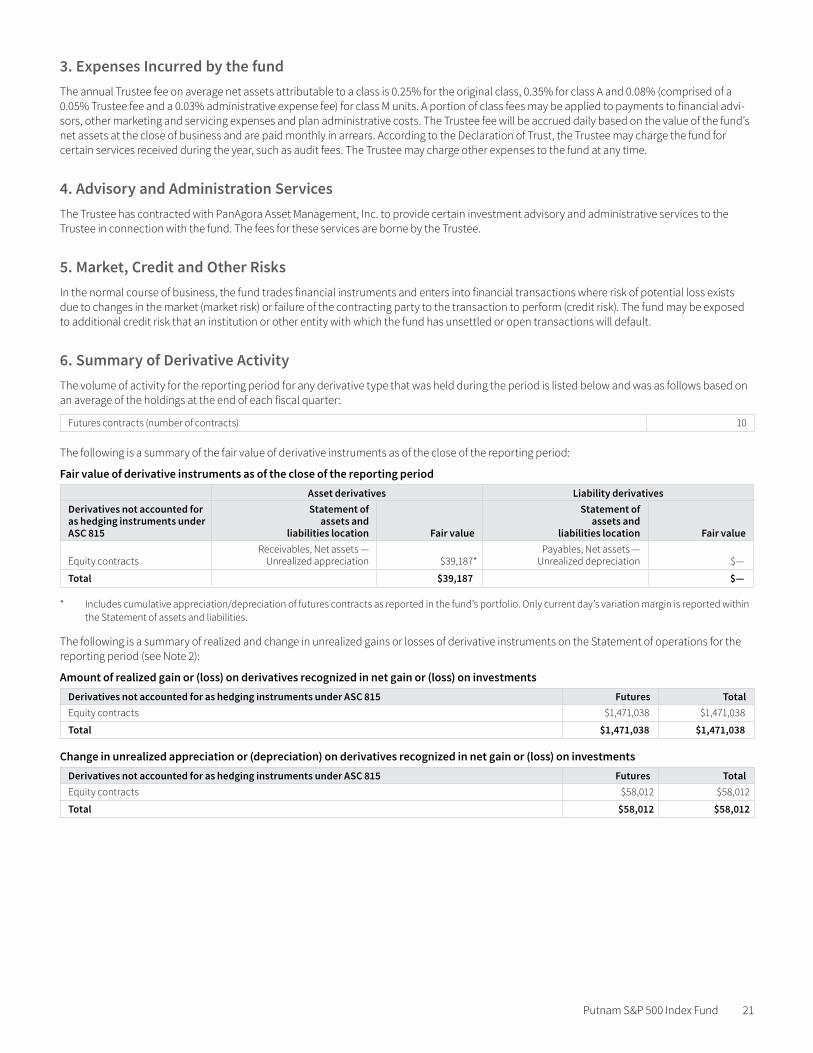
3. Expenses Incurred by the fundThe annual Trustee fee on average net assets attributable to a class is 0.25% for the original class, 0.35% for class A and 0.08% (comprised of a 0.05% Trustee fee and a 0.03% administrative expense fee) for class M units. A portion of class fees may be applied to payments to financial advi-sors, other marketing and servicing expenses and plan administrative costs. The Trustee fee will be accrued daily based on the value of the fund’s net assets at the close of business and are paid monthly in arrears. According to the Declaration of Trust, the Trustee may charge the fund for certain services received during the year, such as audit fees. The Trustee may charge other expenses to the fund at any time.
4. Advisory and Administration ServicesThe Trustee has contracted with PanAgora Asset Management, Inc. to provide certain investment advisory and administrative services to the Trustee in connection with the fund. The fees for these services are borne by the Trustee.
5. Market, Credit and Other RisksIn the normal course of business, the fund trades financial instruments and enters into financial transactions where risk of potential loss exists due to changes in the market (market risk) or failure of the contracting party to the transaction to perform (credit risk). The fund may be exposed to additional credit risk that an institution or other entity with which the fund has unsettled or open transactions will default.
6. Summary of Derivative Activity The volume of activity for the reporting period for any derivative type that was held during the period is listed below and was as follows based on an average of the holdings at the end of each fiscal quarter:
Futures contracts (number of contracts) 10
The following is a summary of the fair value of derivative instruments as of the close of the reporting period:
Fair value of derivative instruments as of the close of the reporting periodAsset derivatives Liability derivatives
Derivatives not accounted for as hedging instruments under ASC 815
Statement of assets and
liabilities location Fair value
Statement of assets and
liabilities location Fair value
Equity contractsReceivables, Net assets —
Unrealized appreciation $39,187 *Payables, Net assets —
Unrealized depreciation $—
Total $39,187 $—
* Includes cumulative appreciation/depreciation of futures contracts as reported in the fund’s portfolio. Only current day’s variation margin is reported within the Statement of assets and liabilities.
The following is a summary of realized and change in unrealized gains or losses of derivative instruments on the Statement of operations for the reporting period (see Note 2):
Amount of realized gain or (loss) on derivatives recognized in net gain or (loss) on investmentsDerivatives not accounted for as hedging instruments under ASC 815 Futures TotalEquity contracts $1,471,038 $1,471,038
Total $1,471,038 $1,471,038
Change in unrealized appreciation or (depreciation) on derivatives recognized in net gain or (loss) on investmentsDerivatives not accounted for as hedging instruments under ASC 815 Futures TotalEquity contracts $58,012 $58,012
Total $58,012 $58,012

Putnam S&P 500 Index Fund 22
7. Offsetting of Financial and Derivative Assets and Liabilities The following table summarizes any derivatives, repurchase agreements and reverse repurchase agreements, at the end of the reporting period, that are subject to an enforceable master netting agreement or similar agreement. For securities lending transactions or borrowing transactions associated with securities sold short, if any, see Note 2. For financial reporting purposes, the fund does not offset financial assets and financial liabilities that are subject to the master netting agreements in the Statement of assets and liabilities.
UBS Securities LLC Total
Assets:
Futures contracts§ $13,946 $13,946
Total Assets $13,946 $13,946
Liabilities:
Futures contracts§ — —
Total Liabilities $— $—
Total Financial and Derivative Net Assets $13,946 $13,946
Total collateral received (pledged)##† $—
Net amount $13,946
Controlled collateral received (including TBA commitments)** $— $—
Uncontrolled collateral received $— $—
Collateral (pledged) (including TBA commitments)** $— $—
† Additional collateral may be required from certain brokers based on individual agreements.
## Any over-collateralization of total financial and derivative net assets is not shown. Collateral may include amounts related to unsettled agreements.
§ Includes current day’s variation margin only as reported on the Statement of assets and liabilities, which is not collateralized. Cumulative appreciation/(depreciation) for futures contracts is represented in the tables listed after the fund’s portfolio. Collateral pledged for initial margin on futures contracts, which is not included in the table above, amounted to $2,058,699.
** Included with Investments in securities on the Statement of assets and liabilities.

4JZ-DC 4/2018
One Post Office Square Boston, MA 02109
1-800-225-1581
putnam.com