Prezentacija PB Nis
38
“Towards more sustainable heating system in the City of Niš, Serbia" Bojan Gajić Marija Živković
-
Upload
bojan-gaji -
Category
Documents
-
view
196 -
download
2
Transcript of Prezentacija PB Nis
“Towards more sustainable heating system in the City of Niš, Serbia"
Bojan GajićMarija Živković
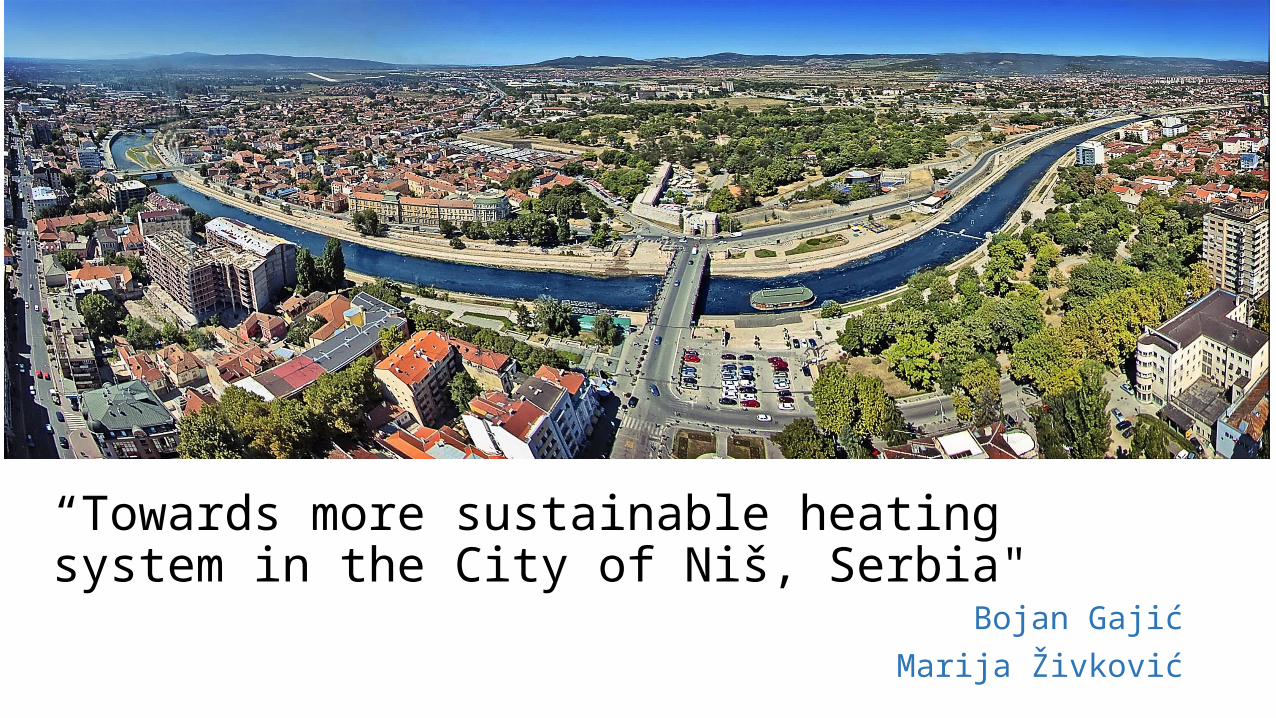
The goal of "participatory backcasting 'project in Nis was to develop a long-term strategy aimed to ensure the thermal comfort (heating and cooling) for the citizens of Nis up to 2030.
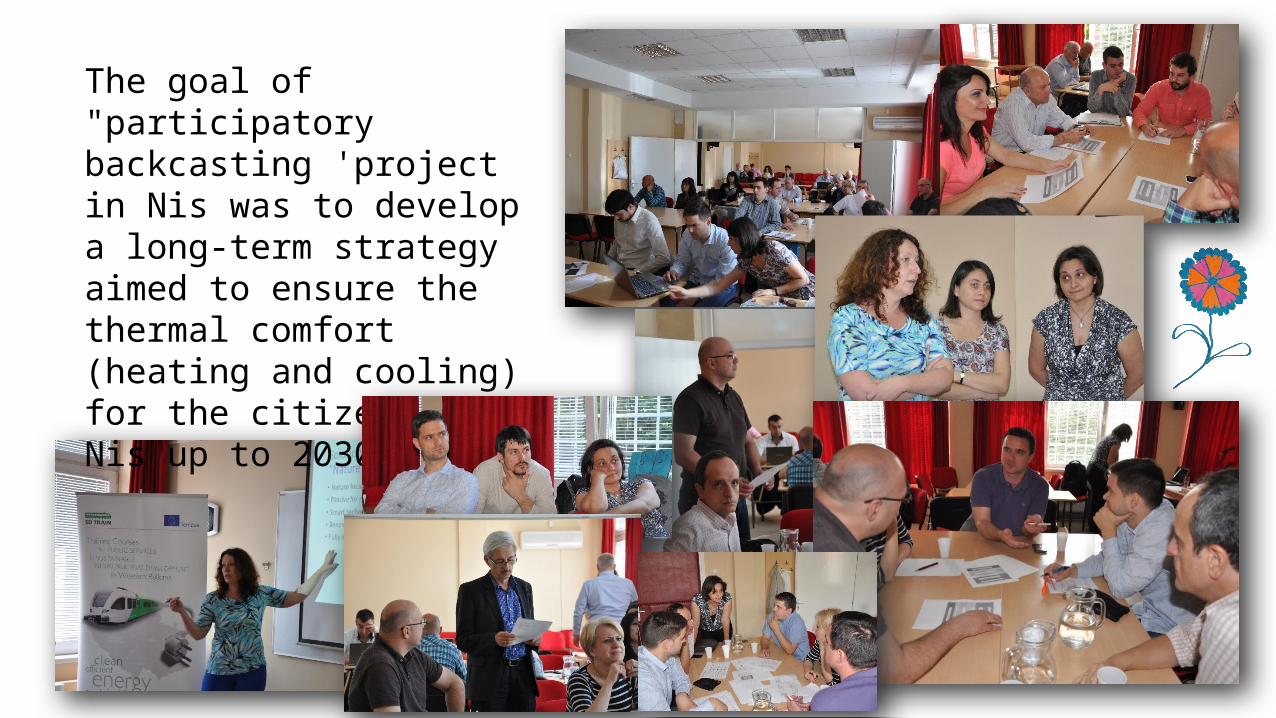
Why the city needs long-term planning of energy consumption?
• energy insecurity (import dependency)
• negative impact on the environment;
• low efficiency (direct usage of electricity for heating)
2010 2030
+40%
BAU (‘business-as-usual’) scenario
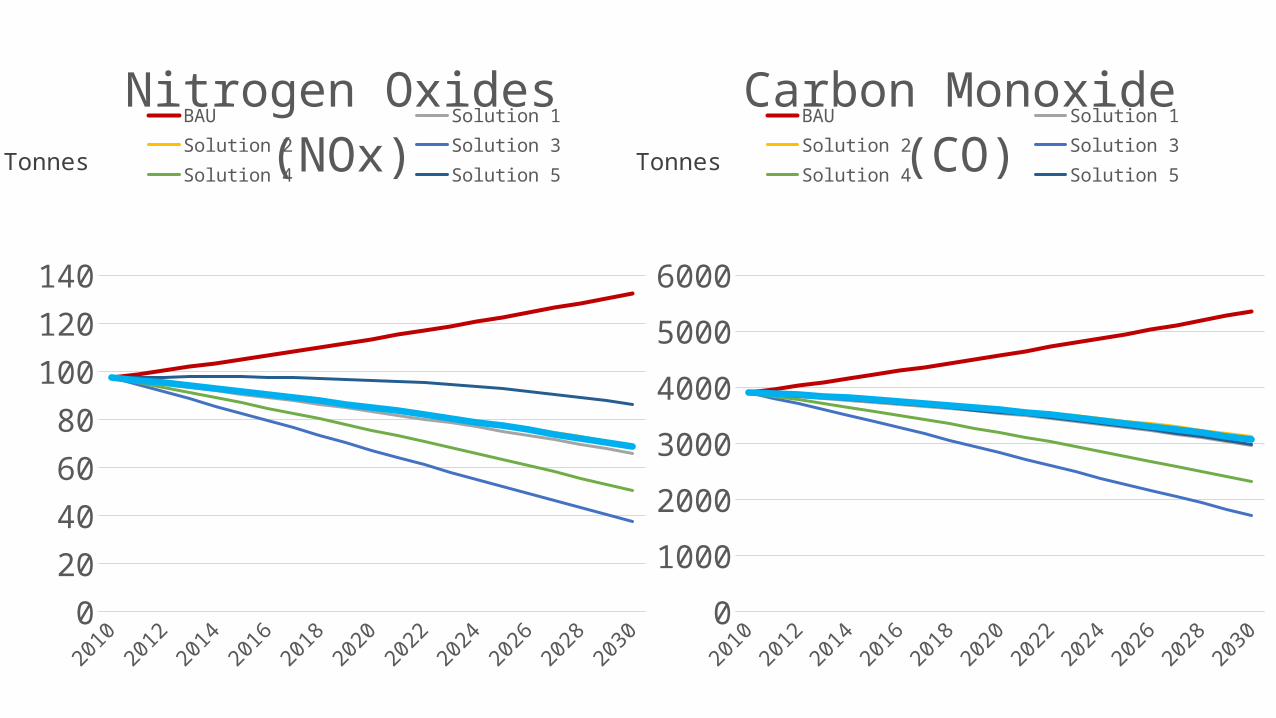
Increased energy demandIncrease of C02, CO, Nox emissions
Increased electricity consumption for heating
The reason for the project s realization was dissatisfaction with the possible development of heating systems, which would led to continuation of existing practices (presented BAU scenario), which is characterized by:
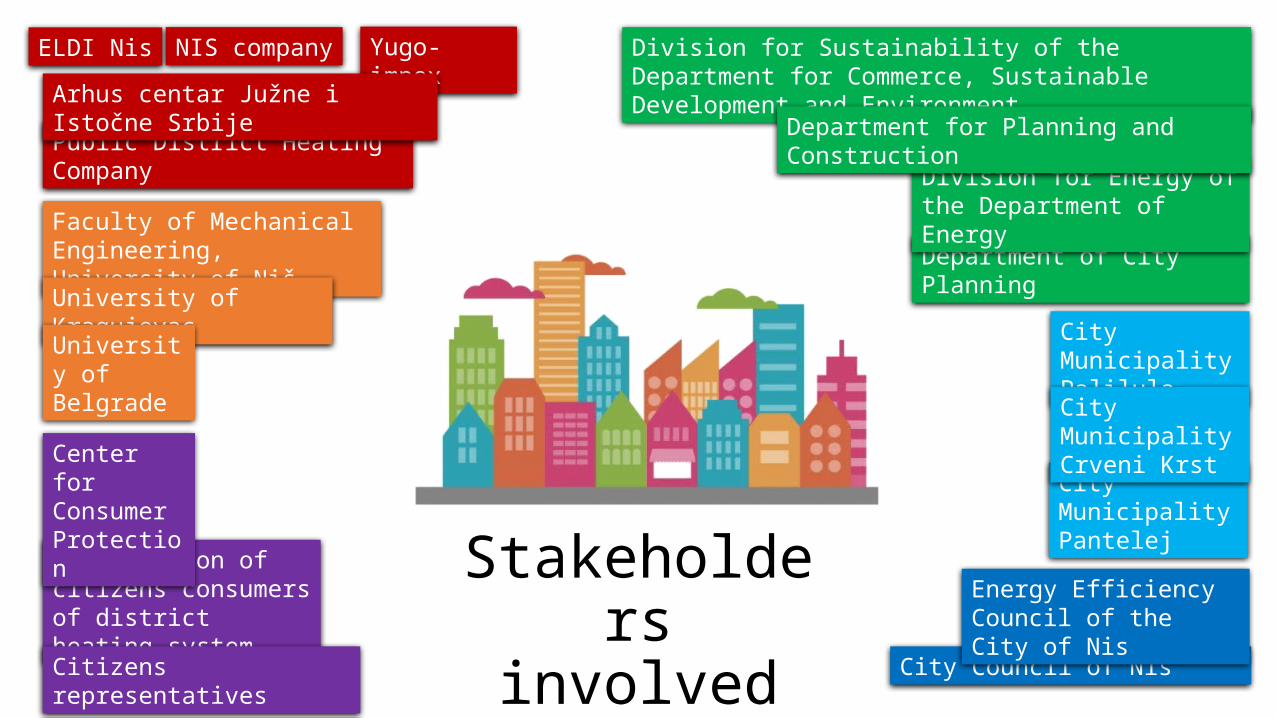
Stakeholders
involved City Council of Nis
Division for Sustainability of the Department for Commerce, Sustainable Development and Environment
Department of City Planning
Division for Energy of the Department of Energy
Department for Planning and Construction
Energy Efficiency Council of the City of Nis
City Municipality Palilula
City Municipality Pantelej
City Municipality Crveni Krst
Faculty of Mechanical Engineering, University of NišUniversity of KragujevacUniversity of Belgrade
Organization of citizens consumers of district heating system
Center for Consumer Protection
Citizens representatives
Yugo-impex
NIS company
Public District Heating Company
Arhus centar Južne i Istočne Srbije
ELDI Nis
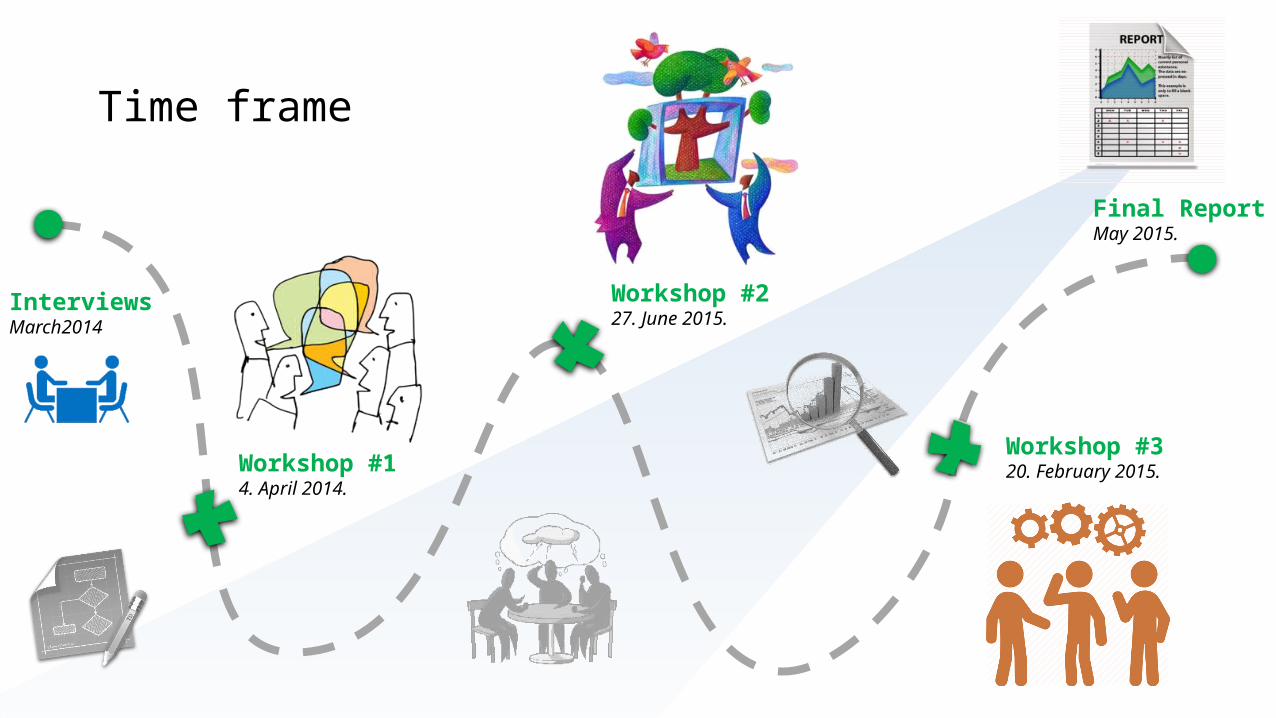
Workshop #320. February 2015.
Workshop #227. June 2015.
Workshop #14. April 2014.
Final ReportMay 2015.
Interviews March2014
Time frame
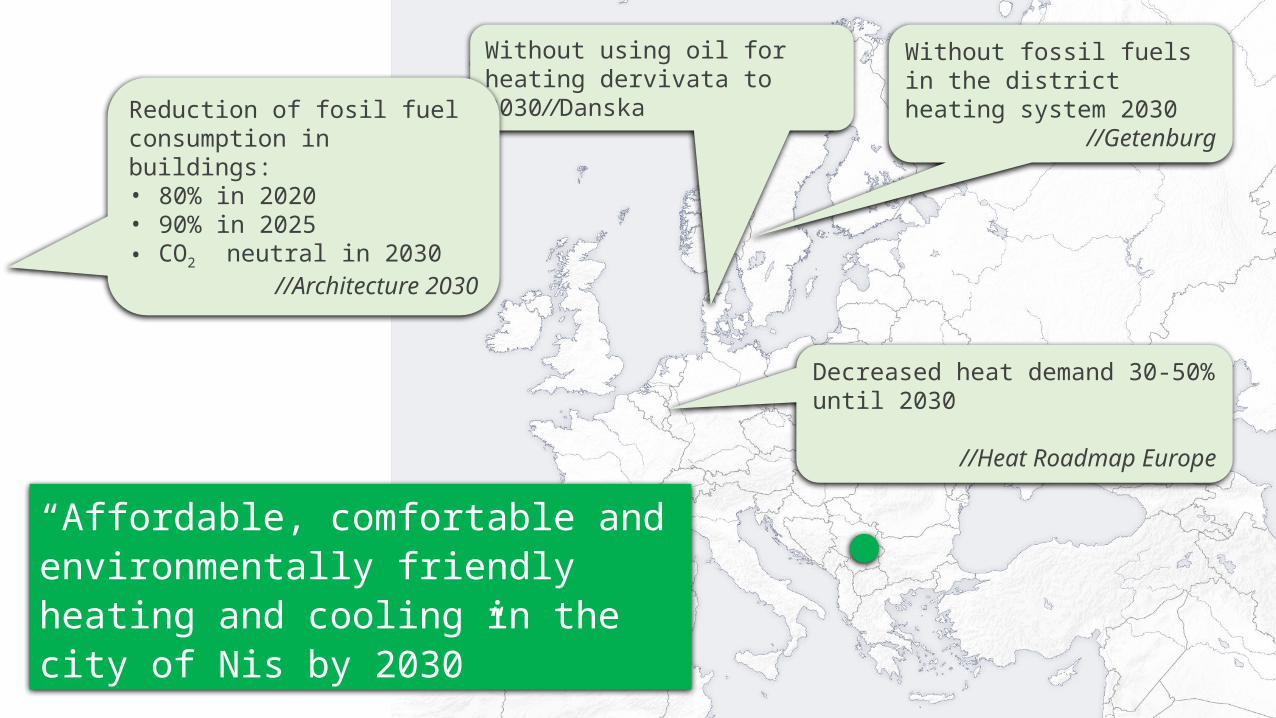
Without fossil fuels in the district heating system 2030
//Getenburg
Without using oil for heating dervivata to 2030//Danska
Decreased heat demand 30-50% until 2030
//Heat Roadmap Europe
Reduction of fosil fuel consumption in buildings:• 80% in 2020• 90% in 2025• CO2 neutral in 2030
//Architecture 2030
“Affordable, comfortable and environmentally friendly heating and cooling in the city of Nis by 2030”
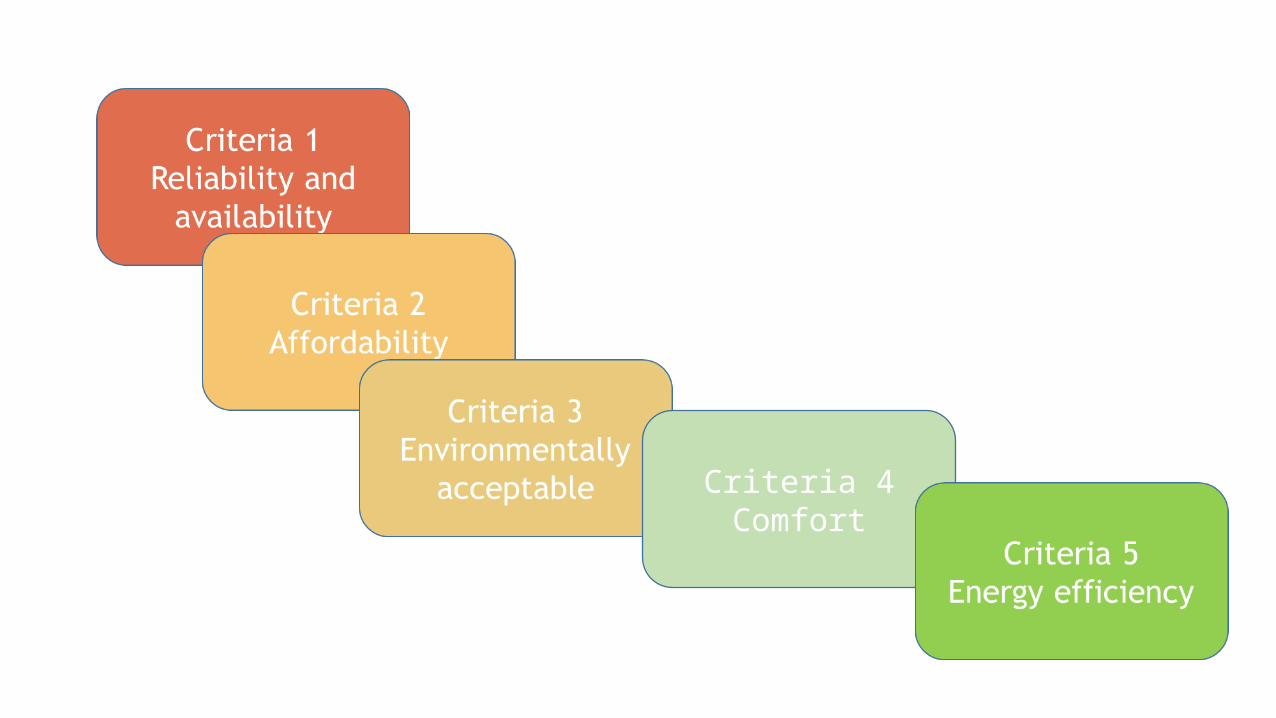
Criteria 4Comfort
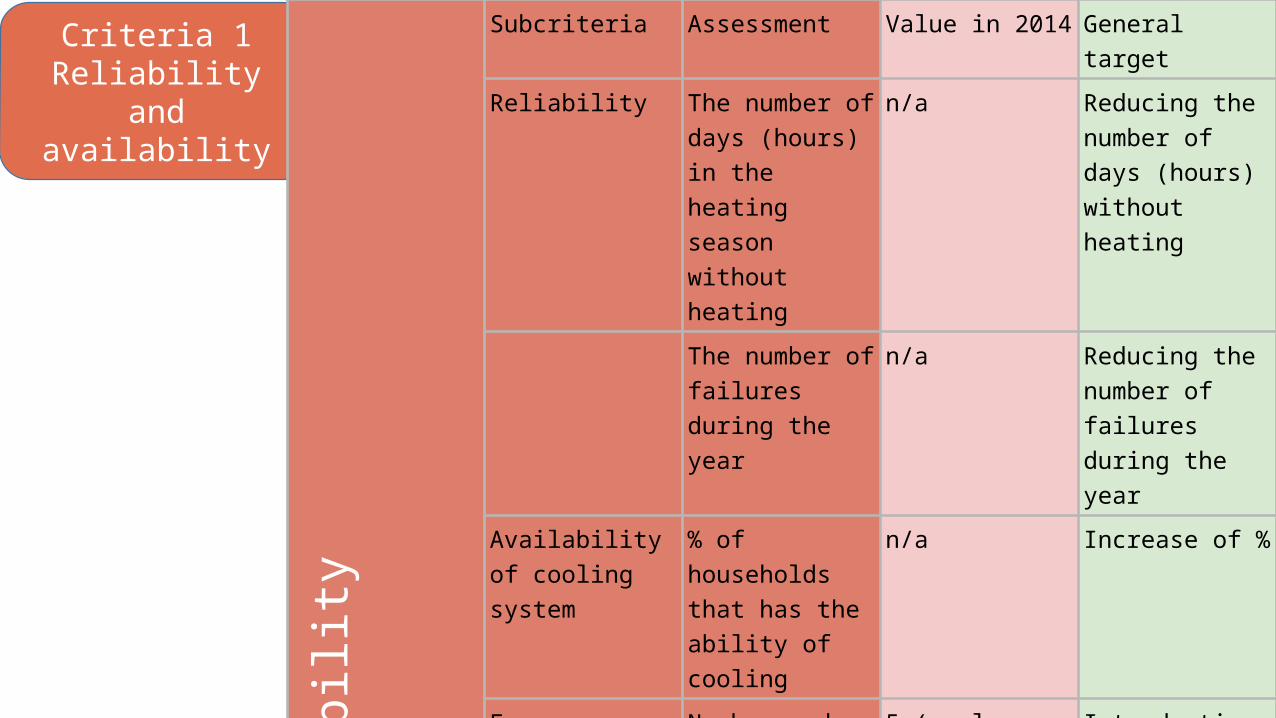
Criteria 1Reliability and
availability
Reliability and
availability
Subcriteria Assessment Value in 2014 General target
Reliability The number of days (hours) in the heating season without heating
n/a Reducing the number of days (hours) without heating
The number of failures during the year
n/a Reducing the number of failures during the year
Availability of cooling system
% of households that has the ability of cooling
n/a Increase of %
Energy security Number and structure of fuel used
5 (coal, wood, oil, natural gas, electricity)
Introduction of new energy sources for heating
Energy security The percentage of fuel from domestic sources in the energy mix
63.6% Decrease of import dependency
Energy security The percentage of locally available energy sources in the energy mix
26.3% Increased use of locally available energy sources
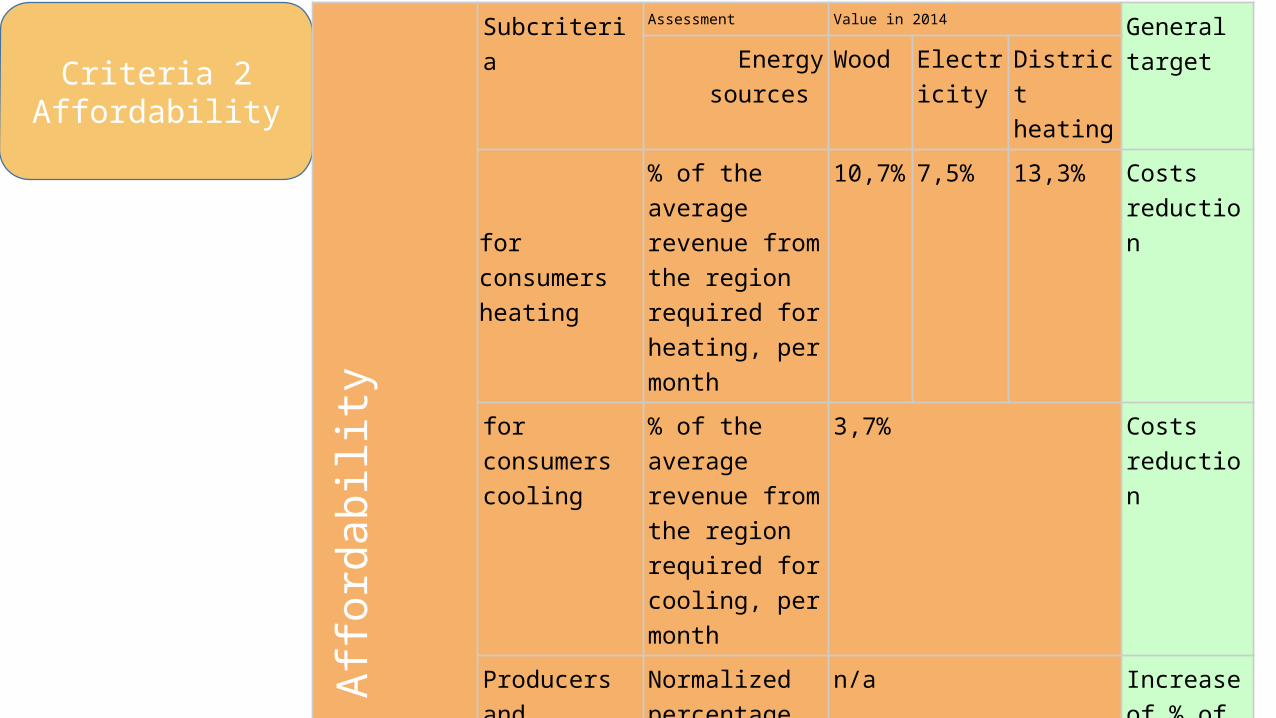
Criteria 2Affordability
Affordability
Subcriteria Assessment Value in 2014 General targetEnergy sources Wood Electricit
yDistrict heating
for consumersheating
% of the average revenue from the region required for heating, per month
10,7% 7,5% 13,3% Costs reduction
for consumerscooling
% of the average revenue from the region required for cooling, per month
3,7% Costs reduction
Producers and distributors
Normalized percentage of profitable companies
n/a Increase of % of profitable companies
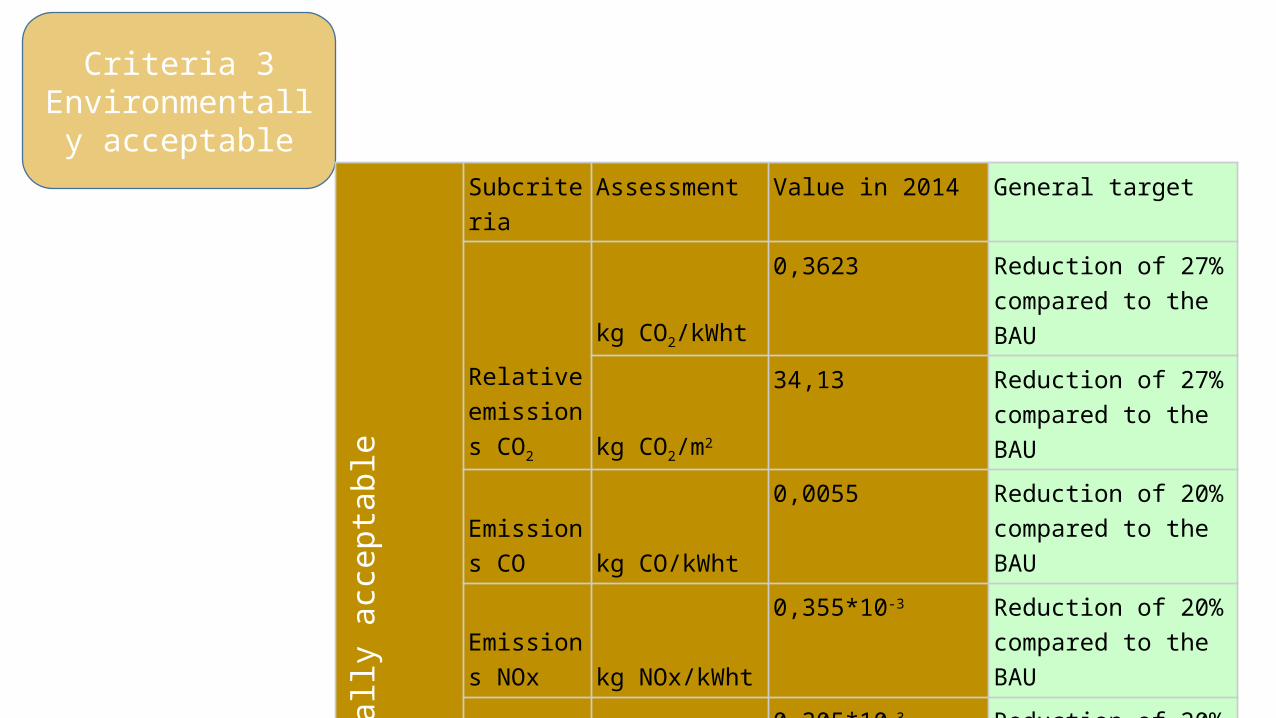
Criteria 3Environmentally
acceptable
Environment
ally acceptable
Subcriteria Assessment Value in 2014 General target
Relative emissions CО2
kg CO2/kWht
0,3623 Reduction of 27% compared to the BAU
kg CO2/m2
34,13 Reduction of 27% compared to the BAU
Emissions CO kg CO/kWht
0,0055 Reduction of 20% compared to the BAU
Emissions NOx kg NOx/kWht
0,355*10-3 Reduction of 20% compared to the BAU
Emissions SOx kg SOx/ kWht
0,305*10-3 Reduction of 20% compared to the BAU
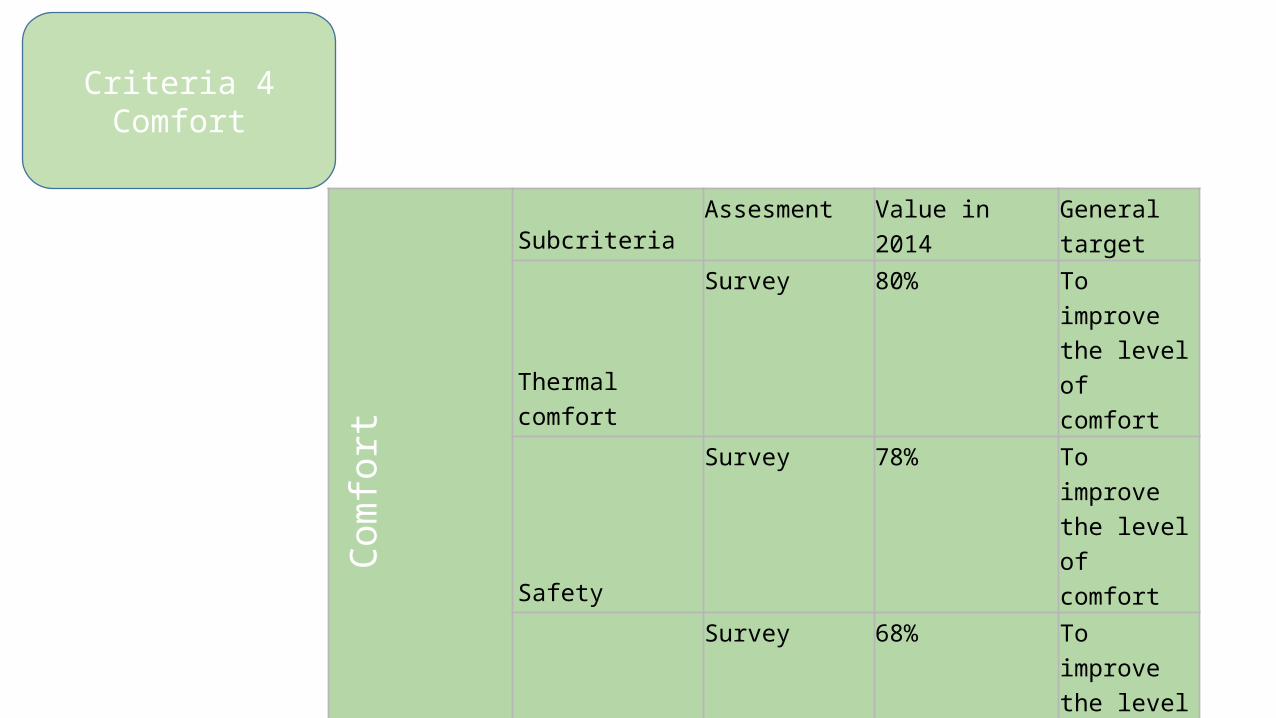
Comfort SubcriteriaAssesment Value in 2014 General
target
Thermal comfort
Survey 80% To improve the level of comfort
Safety
Survey 78% To improve the level of comfort
Easy to operate
Survey 68% To improve the level of comfort
Criteria 4Comfort
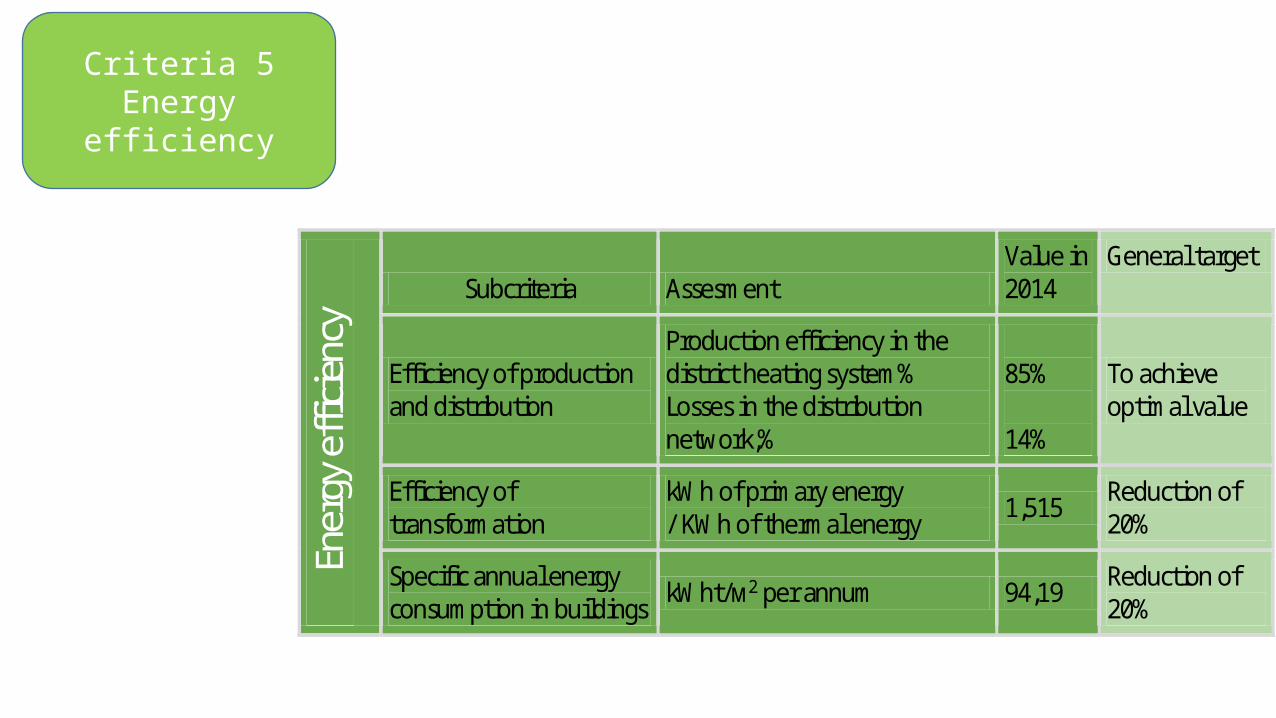
Ener
gy e
ffici
ency
Subcriteria Assesment Value in 2014
General target
Efficiency of production and distribution
Production efficiency in the district heating system% Losses in the distribution network,%
85% 14%
To achieve optimal value
Efficiency of transformation
kWh of primary energy / KWh of thermal energy 1,515 Reduction of
20%
Specific annual energy consumption in buildings kWht/м2 per annum 94,19 Reduction of
20%
Criteria 5Energy efficiency
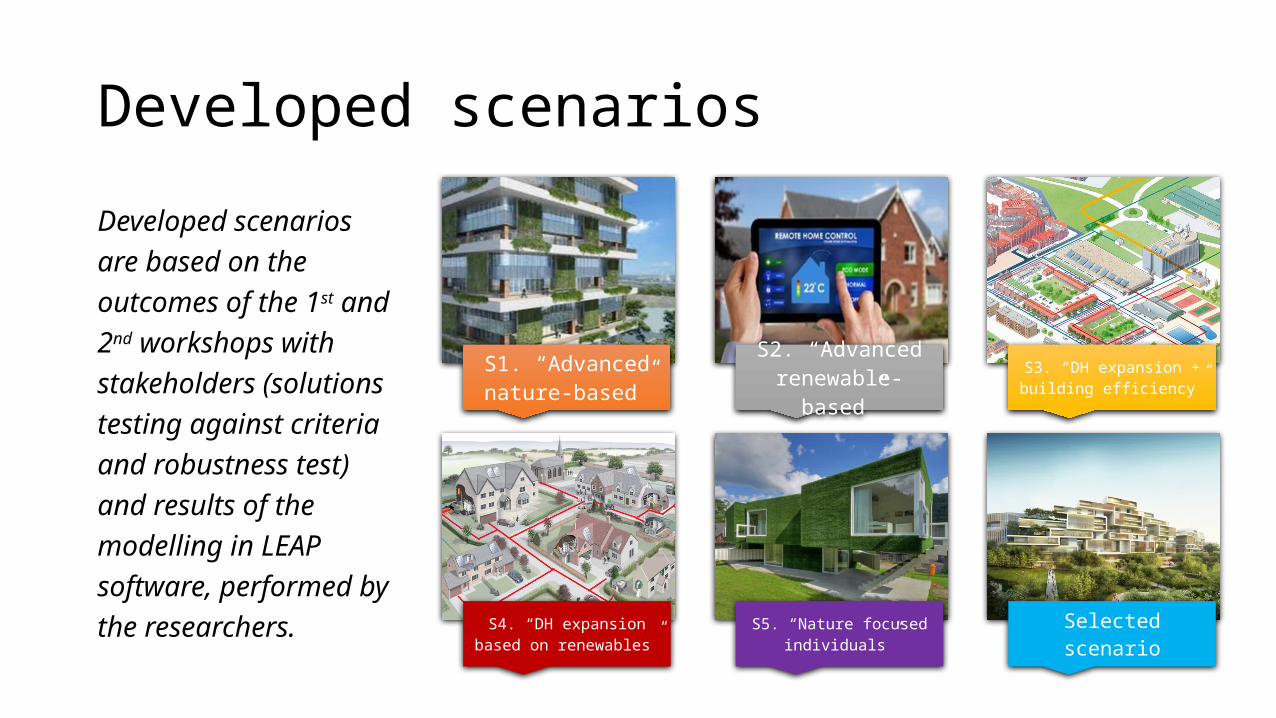
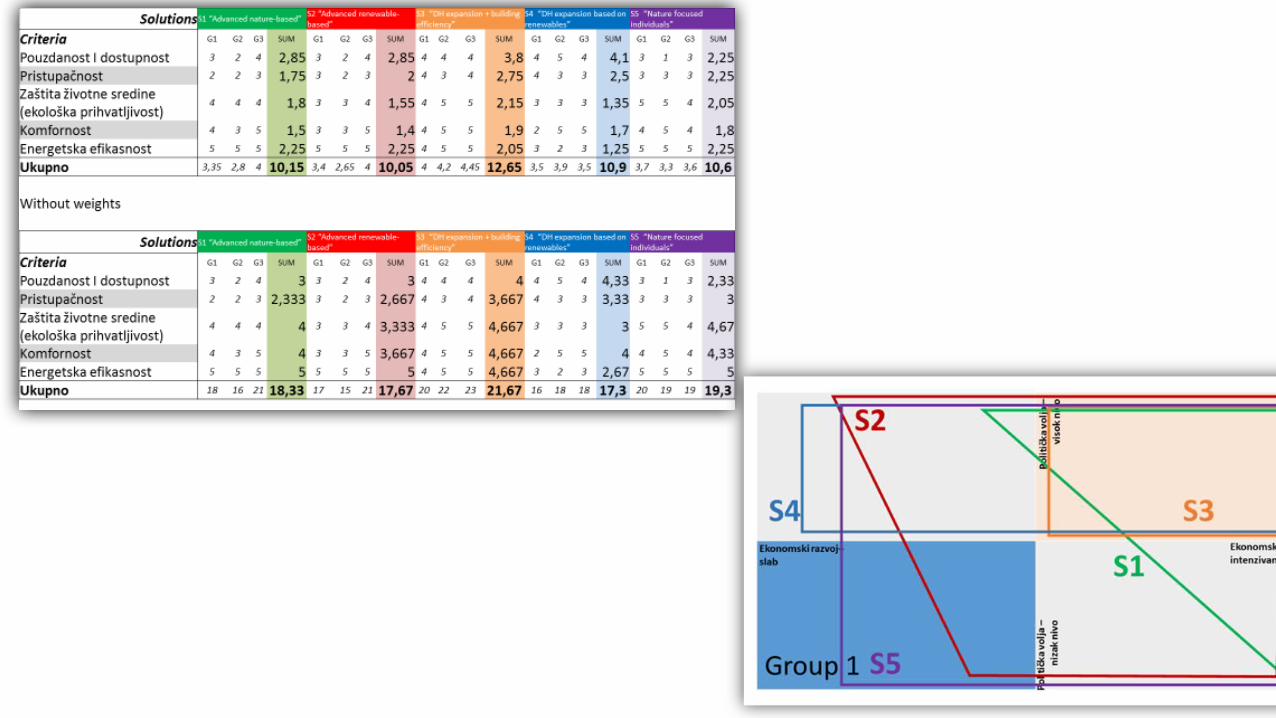
S1. “Advanced nature-based”
S2. “Advanced renewable-
based”S3. “DH expansion + building efficiency”
S4. “DH expansion based on renewables”
S5. “Nature focused individuals”
Selected scenario
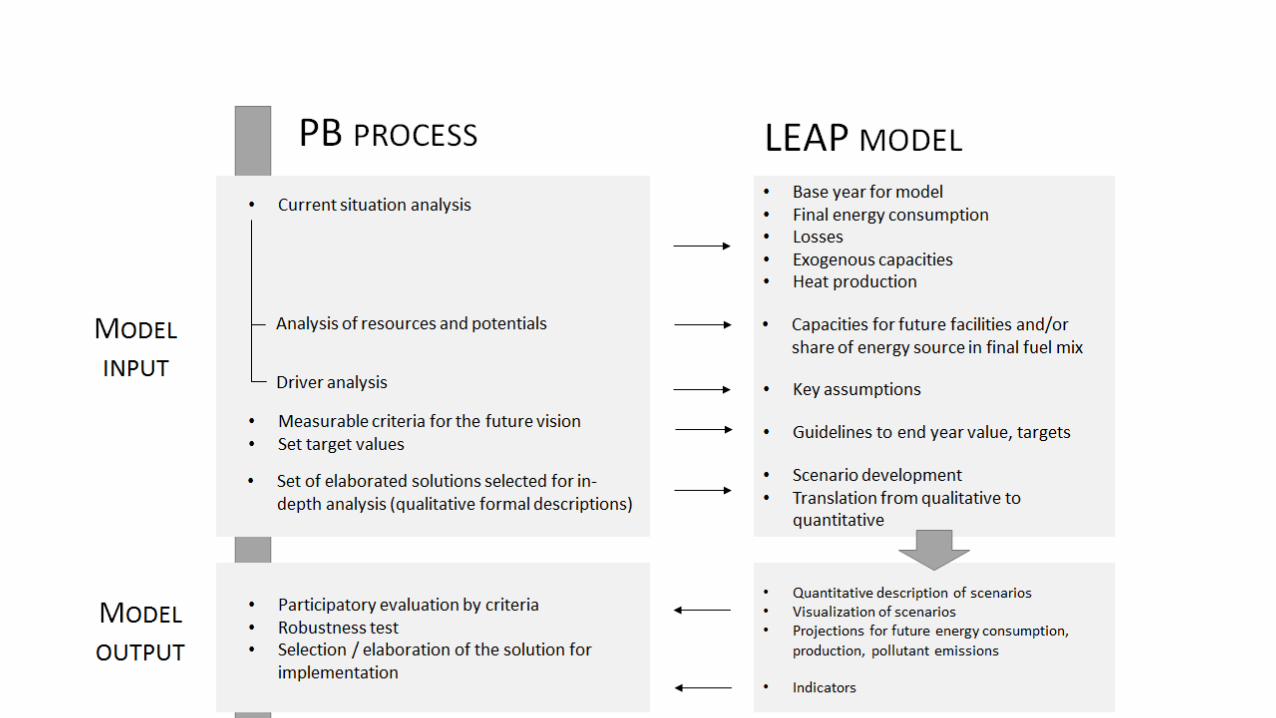
Developed scenariosDeveloped scenarios are based on the outcomes of the 1st and 2nd workshops with stakeholders (solutions testing against criteria and robustness test) and results of the modelling in LEAP software, performed by the researchers.
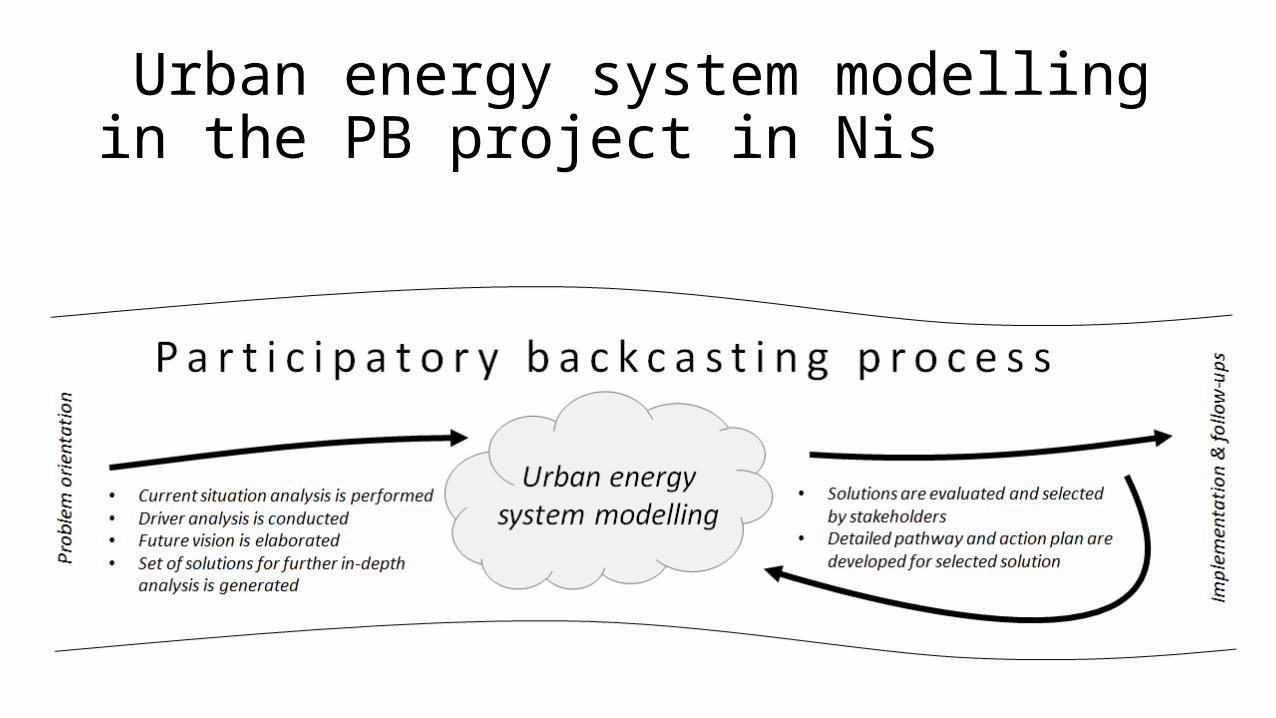
Urban energy system modelling in the PB project in Nis
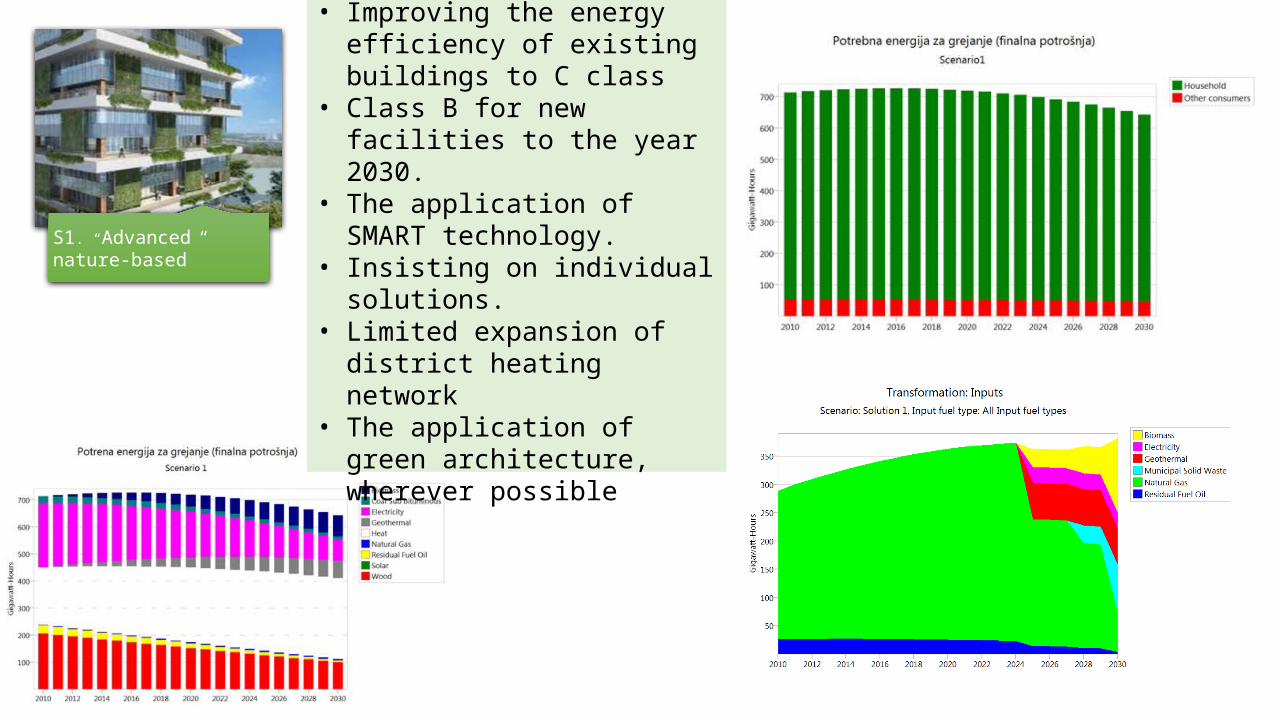
S1. “Advanced nature-based”
• Improving the energy efficiency of existing buildings to C class
• Class B for new facilities to the year 2030.
• The application of SMART technology.
• Insisting on individual solutions.
• Limited expansion of district heating network
• The application of green architecture, wherever possible
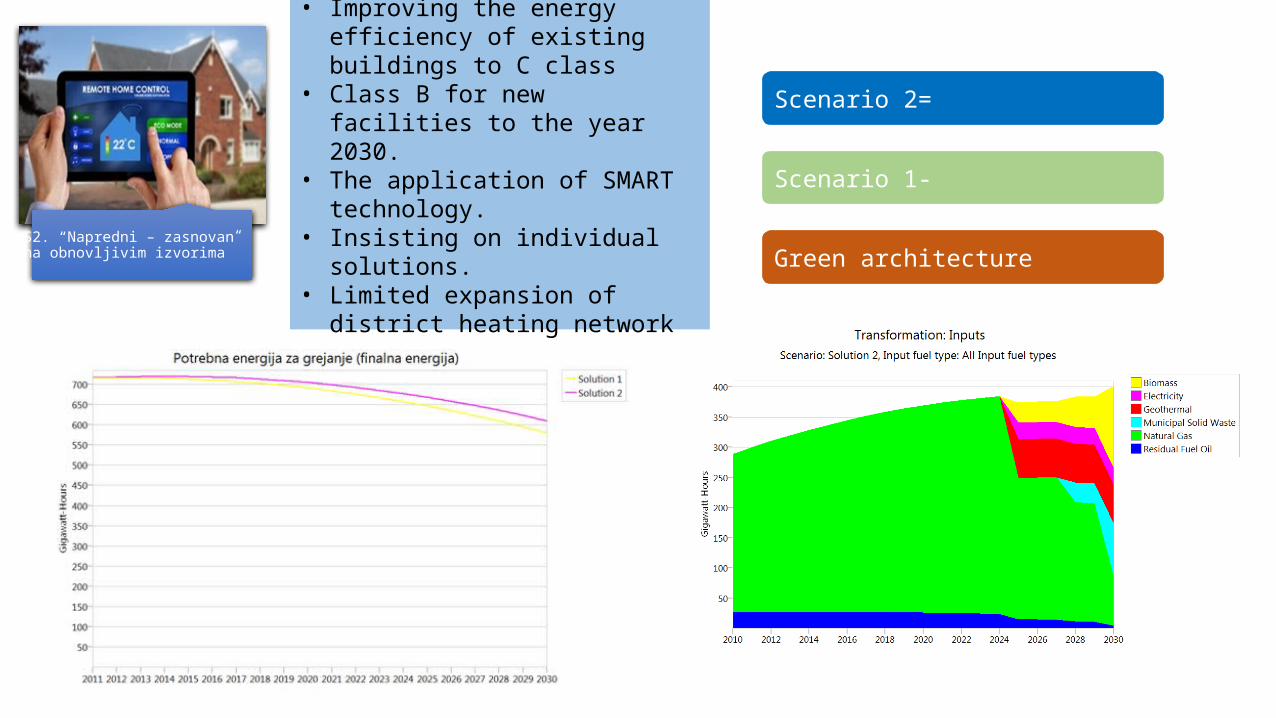
S2. “Napredni – zasnovan na obnovljivim izvorima”
• Improving the energy efficiency of existing buildings to C class
• Class B for new facilities to the year 2030.
• The application of SMART technology.
• Insisting on individual solutions.
• Limited expansion of district heating network
Scenario 2=
Scenario 1-
Green architecture
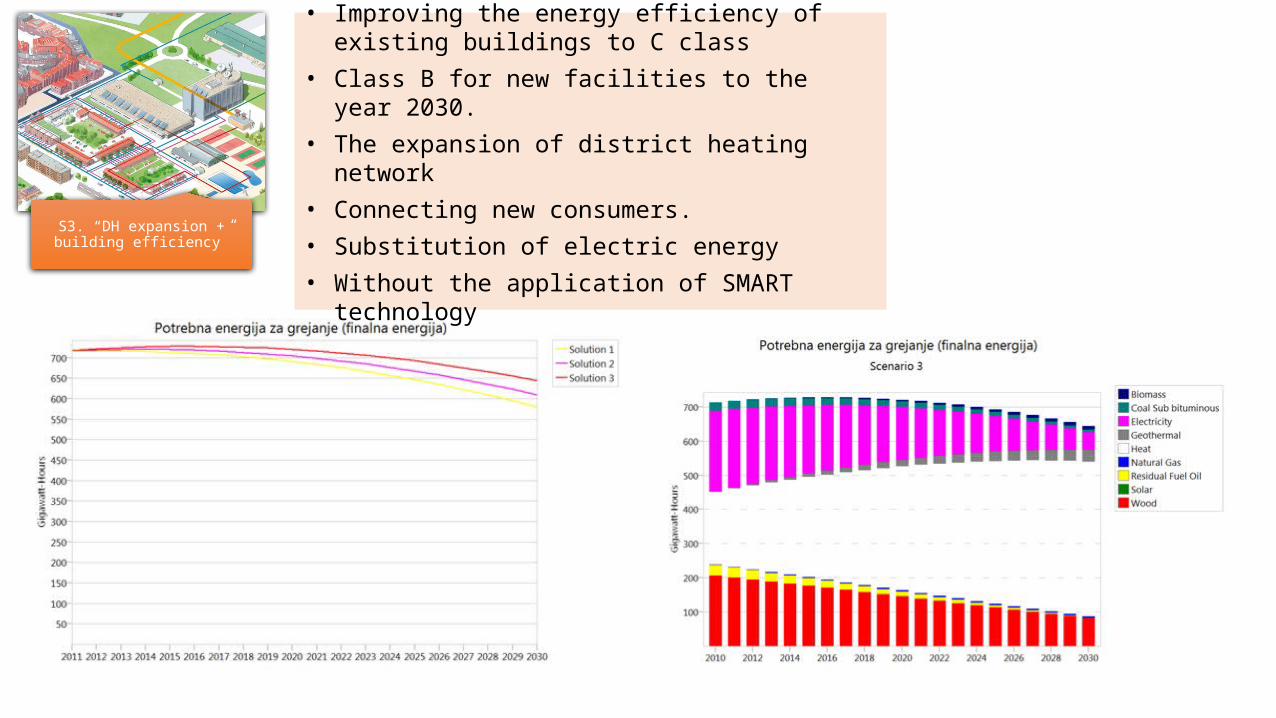
S3. “DH expansion + building efficiency”
• Improving the energy efficiency of existing buildings to C class
• Class B for new facilities to the year 2030.• The expansion of district heating network• Connecting new consumers.• Substitution of electric energy• Without the application of SMART technology
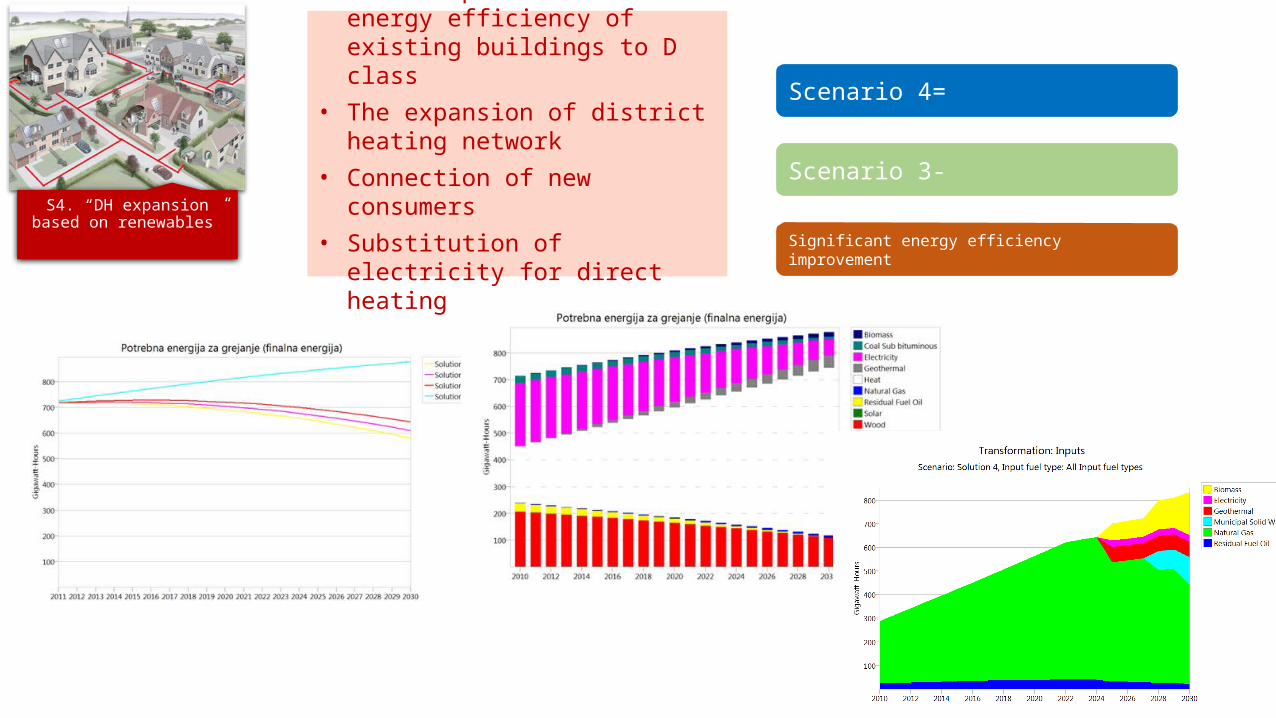
S4. “DH expansion based on renewables”
• Minor improvement of energy efficiency of existing buildings to D class
• The expansion of district heating network
• Connection of new consumers• Substitution of electricity for
direct heating
Scenario 4=
Scenario 3-
Significant energy efficiency improvement
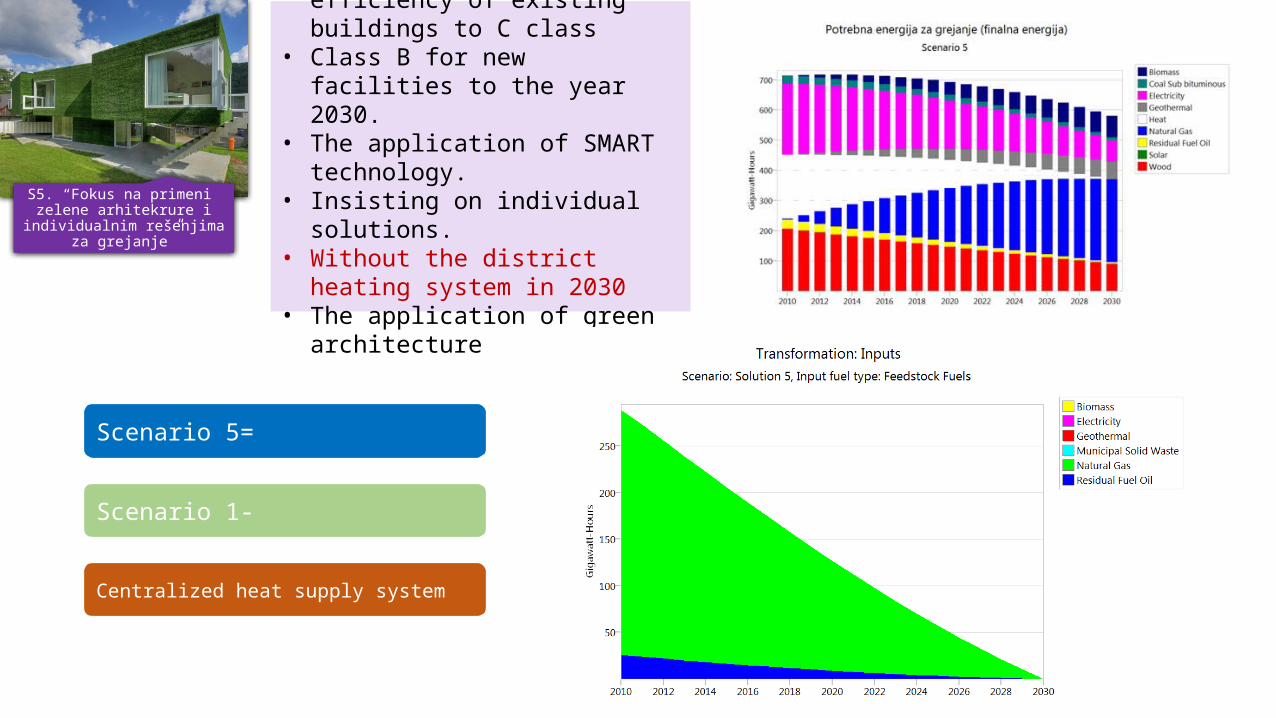
S5. “Fokus na primeni zelene arhitekrure i
individualnim rešenjima za grejanje”
• Improving the energy efficiency of existing buildings to C class
• Class B for new facilities to the year 2030.
• The application of SMART technology.
• Insisting on individual solutions.
• Without the district heating system in 2030
• The application of green architecture
Scenario 5=
Scenario 1-
Centralized heat supply system
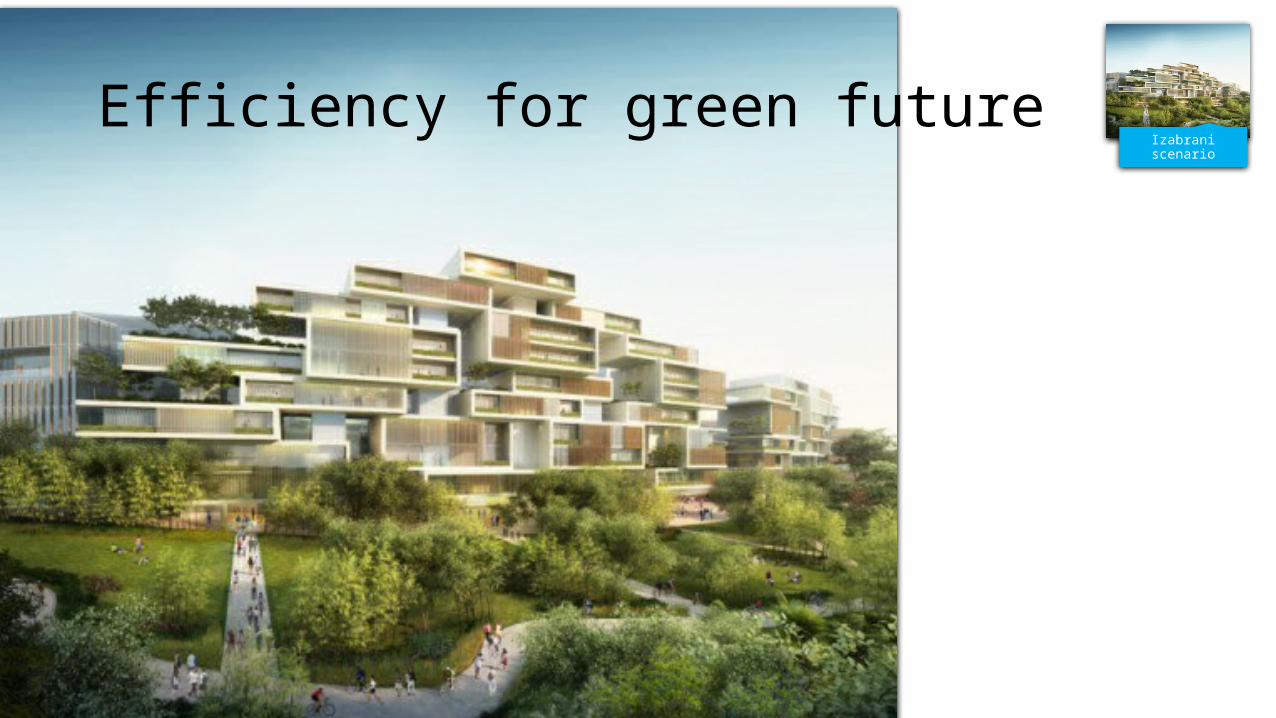
Izabrani scenarioEfficiency for green future
Selected scenario
20102012
20142016
20182020
20222024
20262028
20300
100
200
300
400
500
600
700
800
Wood
#REF!
Heavy oil
Natural gas
Heat
Geothermal
Electricity
Biomass
Izabrani scenario
GWh/annumi
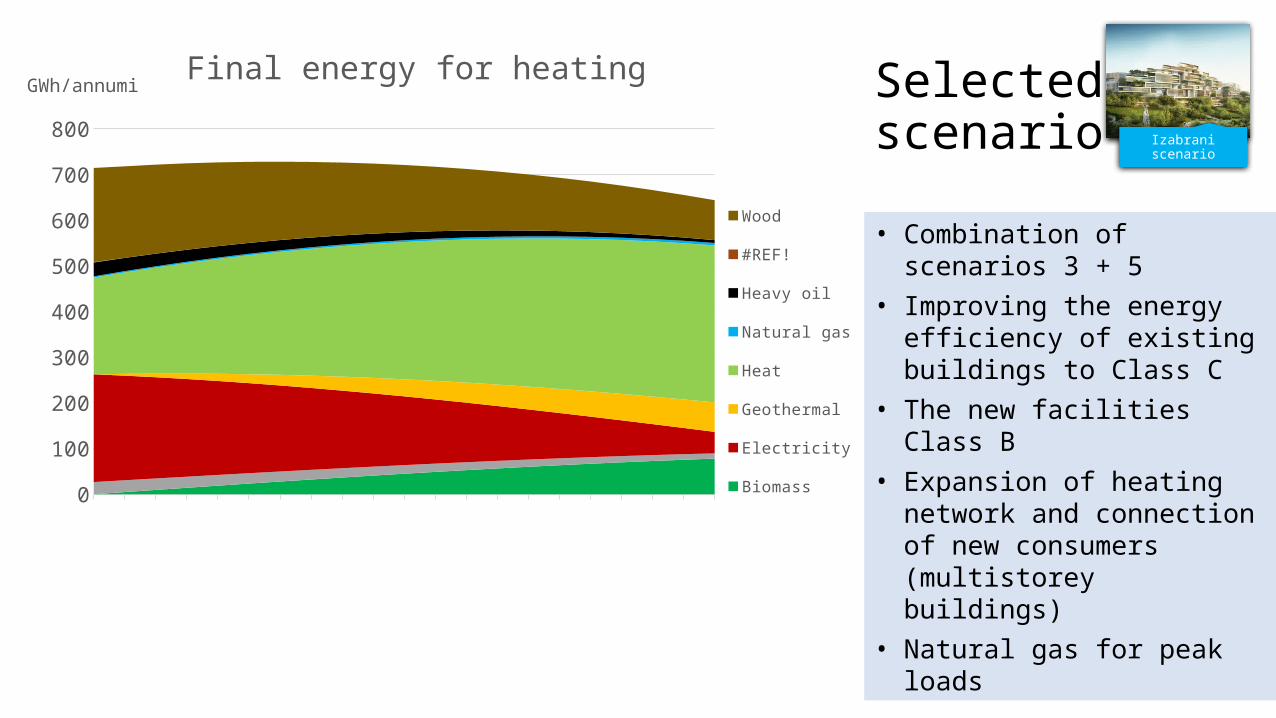
Final energy for heating
• Combination of scenarios 3 + 5
• Improving the energy efficiency of existing buildings to Class C
• The new facilities Class B• Expansion of heating
network and connection of new consumers (multistorey buildings)
• Natural gas for peak loads
20102012
20142016
20182020
20222024
20262028
20300
50
100
150
200
250
300
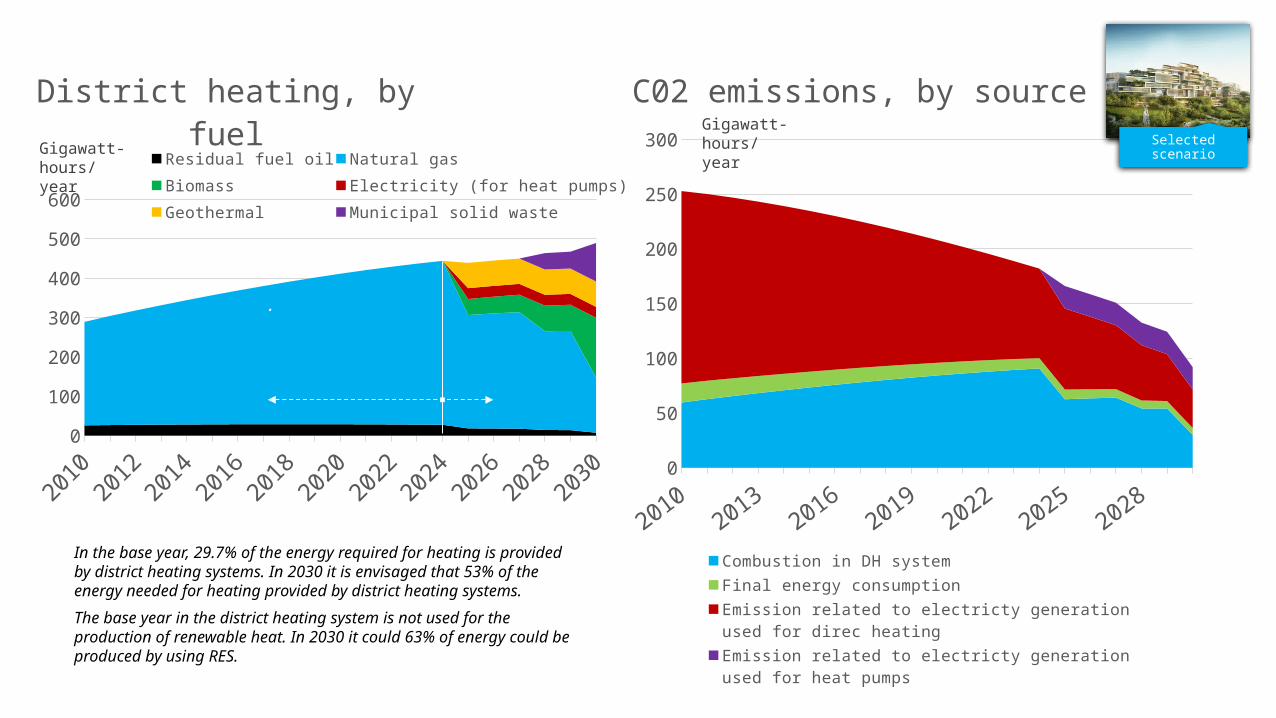
C02 emissions, by source
Combustion in DH systemFinal energy consumptionEmission related to electricty generation used for direc heatingEmission related to electricty generation used for heat pumps
2010
2012
2014
2016
2018
2020
2022
2024
2026
2028
2030
0100200300400500600
District heating, by fuelResidual fuel oil Natural gasBiomass Electricity (for heat pumps)Geothermal Municipal solid waste
Gigawatt-hours/year
In the base year, 29.7% of the energy required for heating is provided by district heating systems. In 2030 it is envisaged that 53% of the energy needed for heating provided by district heating systems.The base year in the district heating system is not used for the production of renewable heat. In 2030 it could 63% of energy could be produced by using RES.
Gigawatt-hours/year Selected
scenario
.
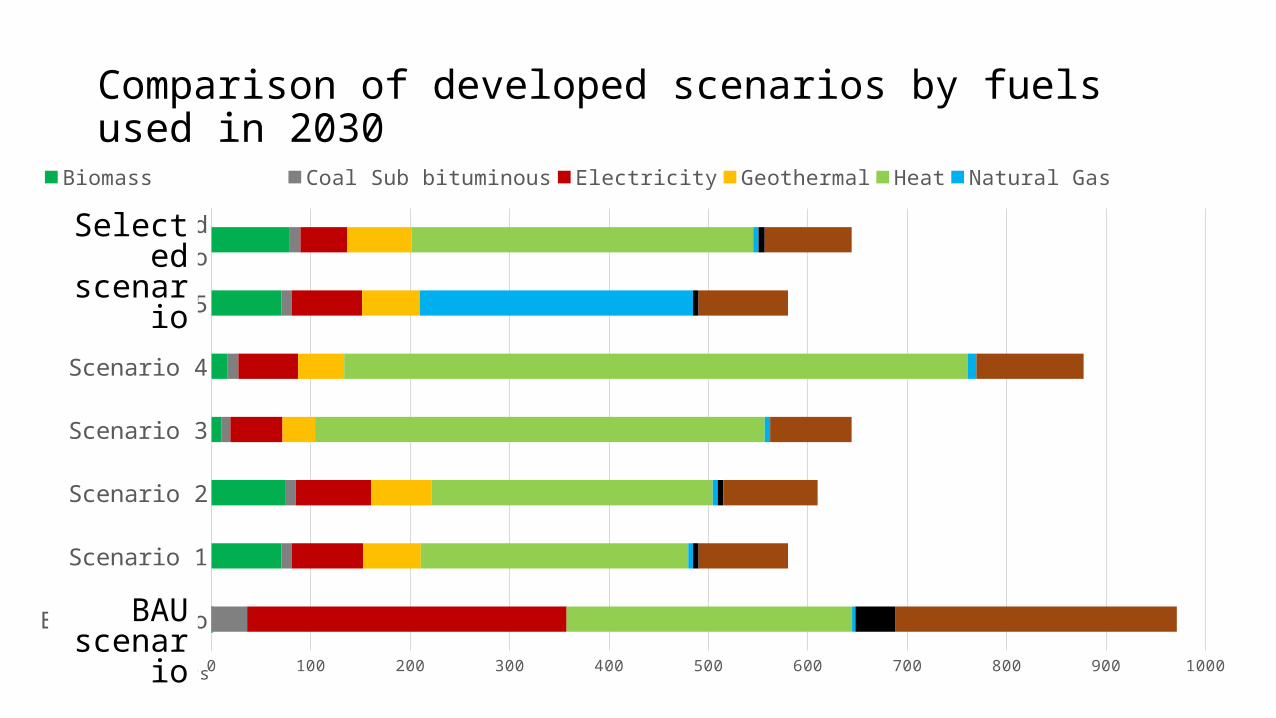
Comparison of developed scenarios by fuels used in 2030
BAU scenario
Scenario 1
Scenario 2
Scenario 3
Scenario 4
Scenario 5
Selected scenario
0 100 200 300 400 500 600 700 800 900 1000
Biomass Coal Sub bituminous Electricity Geothermal Heat Natural Gas Residual Fuel Oil
Gigawatt-Hours
Selected
scenario
BAU scenari
o
Biomass
Coal Sub bitumi...
Electricity
GeothermalHeat
Natural Gas
Residual Fuel OilWood
0
100
200
300
400
500
600
700BAU scenario Scenario 1Scenario 2 Scenario 3Scenario 4 Scenario 5Selected scenario
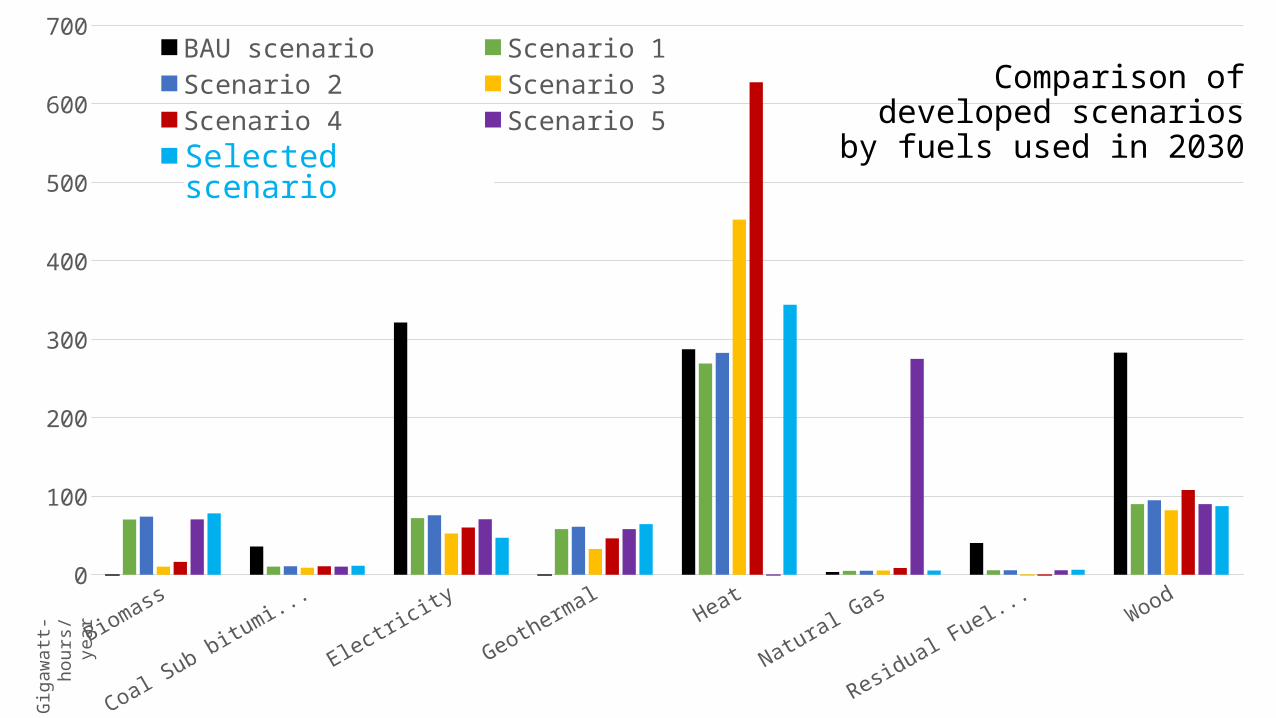
Comparison of developed scenarios
by fuels used in 2030Selected scenario
Giga
watt-
hour
s/ye
ar
2010
2012
2014
2016
2018
2020
2022
2024
2026
2028
2030
020406080
100120140
Nitrogen Oxides (NOx)BAU Solution 1 Solution 2
Solution 3 Solution 4 Solution 5Izabrani scenario
2010
2012
2014
2016
2018
2020
2022
2024
2026
2028
2030
0100020003000400050006000
Carbon Monoxide (CO)BAU Solution 1 Solution 2
Solution 3 Solution 4 Solution 5Izabrani scenarioTonnes Tonnes
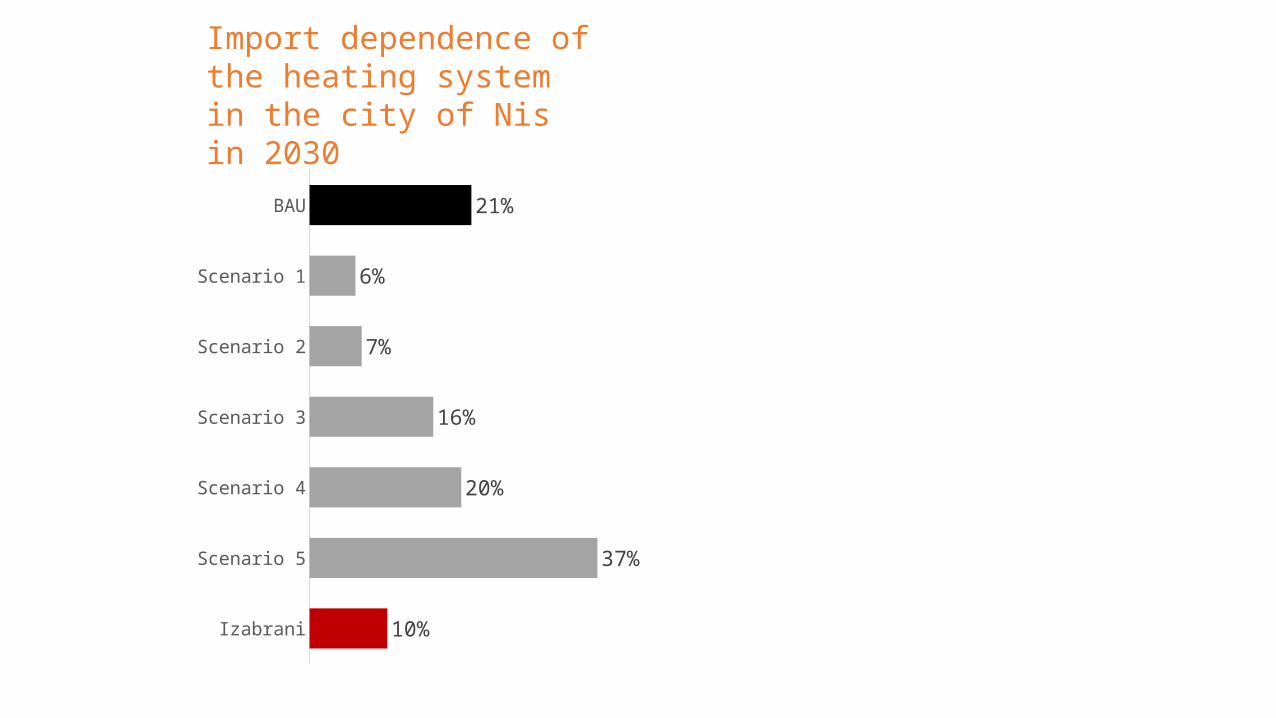
BAU
Scenario 1
Scenario 2
Scenario 3
Scenario 4
Scenario 5
Izabrani
21%
6%
7%
16%
20%
37%
10%
Import dependence of the heating system in the city of Nis in 2030
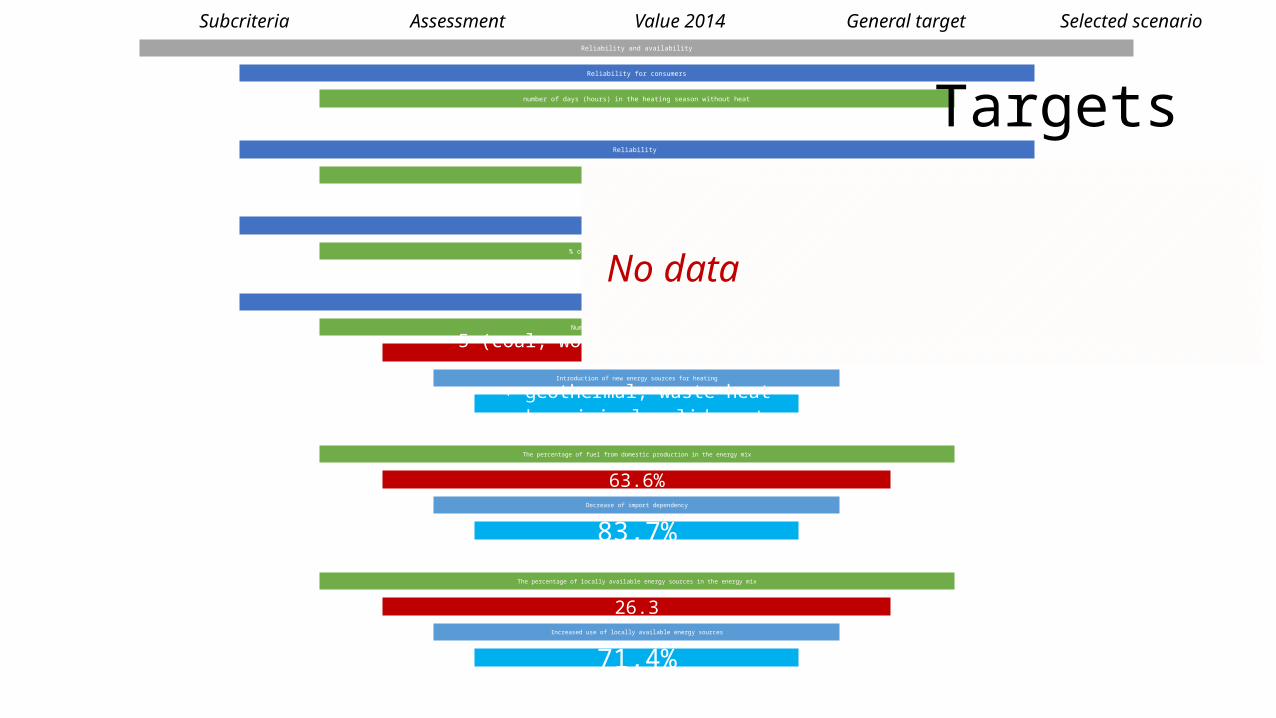
Reliability and availability
Reliability for consumers
number of days (hours) in the heating season without heat
Reliability
Number of failures per year
Availability of cooling
% of households that have cooling
Energy security
Number and structure of fuel used
5 (coal, wood, oil, natural gas, electricity)Introduction of new energy sources for heating
+ geothermal, waste heat and municipal solid waste
The percentage of fuel from domestic production in the energy mix
63.6%Decrease of import dependency
83,7%The percentage of locally available energy sources in the energy mix
26.3Increased use of locally available energy sources
71,4%
TargetsSubcriteria Assessment Value 2014 General target Selected scenario
No data
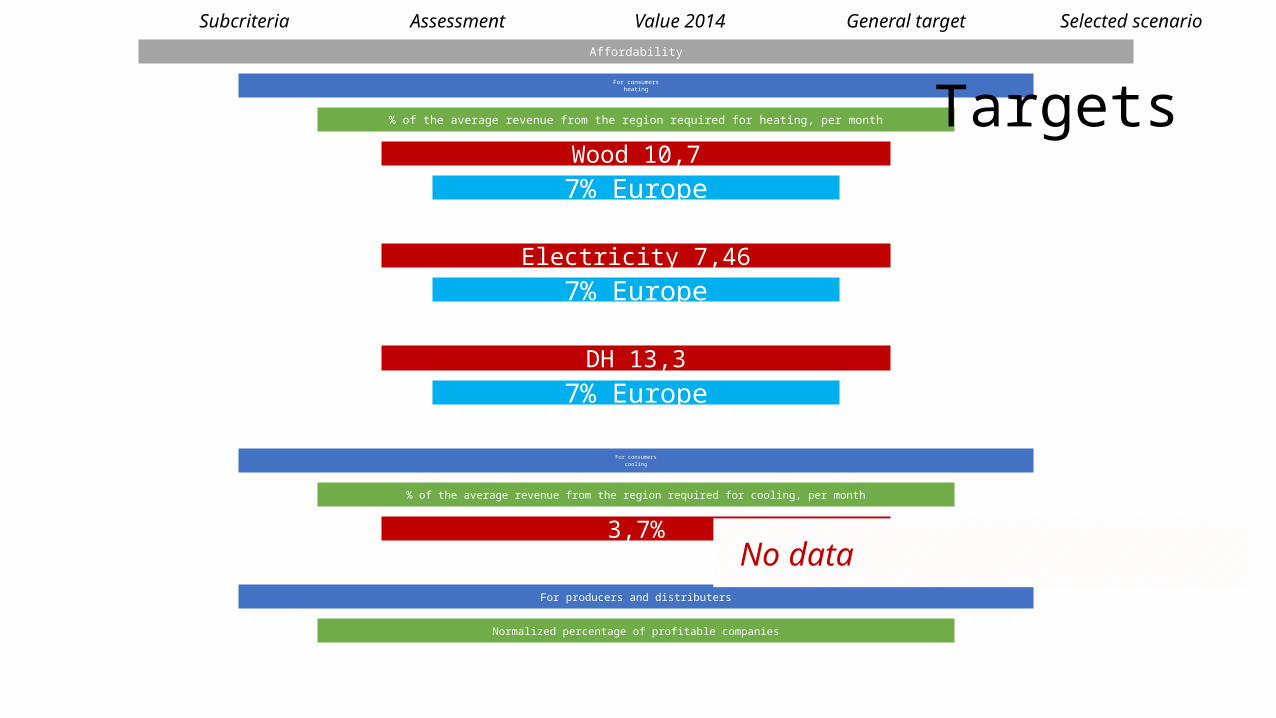
Affordability
For consumersheating
% of the average revenue from the region required for heating, per month
Wood 10,77% Europe
Electricity 7,467% Europe
DH 13,37% Europe
For consumerscooling
% of the average revenue from the region required for cooling, per month
3,7%
For producers and distributers
Normalized percentage of profitable companies
Targets
No data
Subcriteria Assessment Value 2014 General target Selected scenario
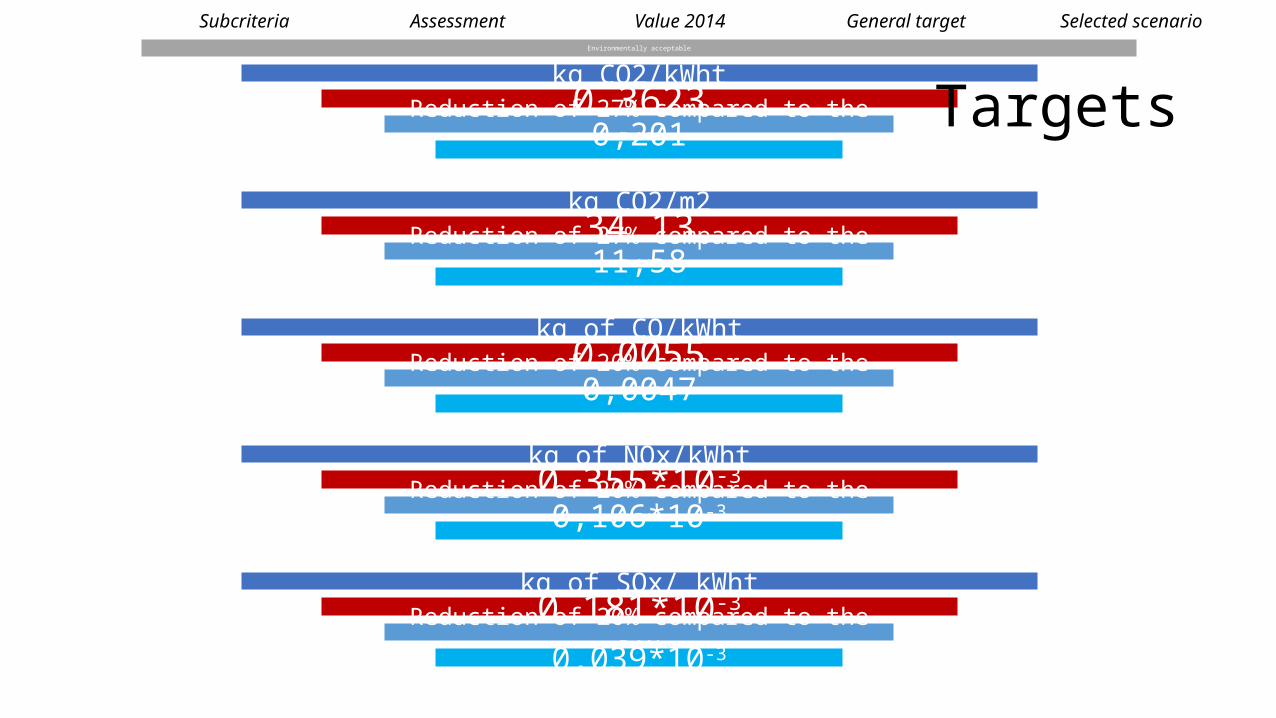
Environmentally acceptable
kg CO2/kWht0,3623Reduction of 27% compared to the BAU0,201
Reduction 45%kg CO2/m234,13
Reduction of 27% compared to the BAU11,58Reduction 66%kg of CO/kWht0,0055
Reduction of 20% compared to the BAU0,0047kg of NOx/kWht0,355*10-3
Reduction of 20% compared to the BAU0,106*10-3
kg of SOx/ kWht0,181*10-3Reduction of 20% compared to the BAU
0,039*10-3
TargetsSubcriteria Assessment Value 2014 General target Selected scenario
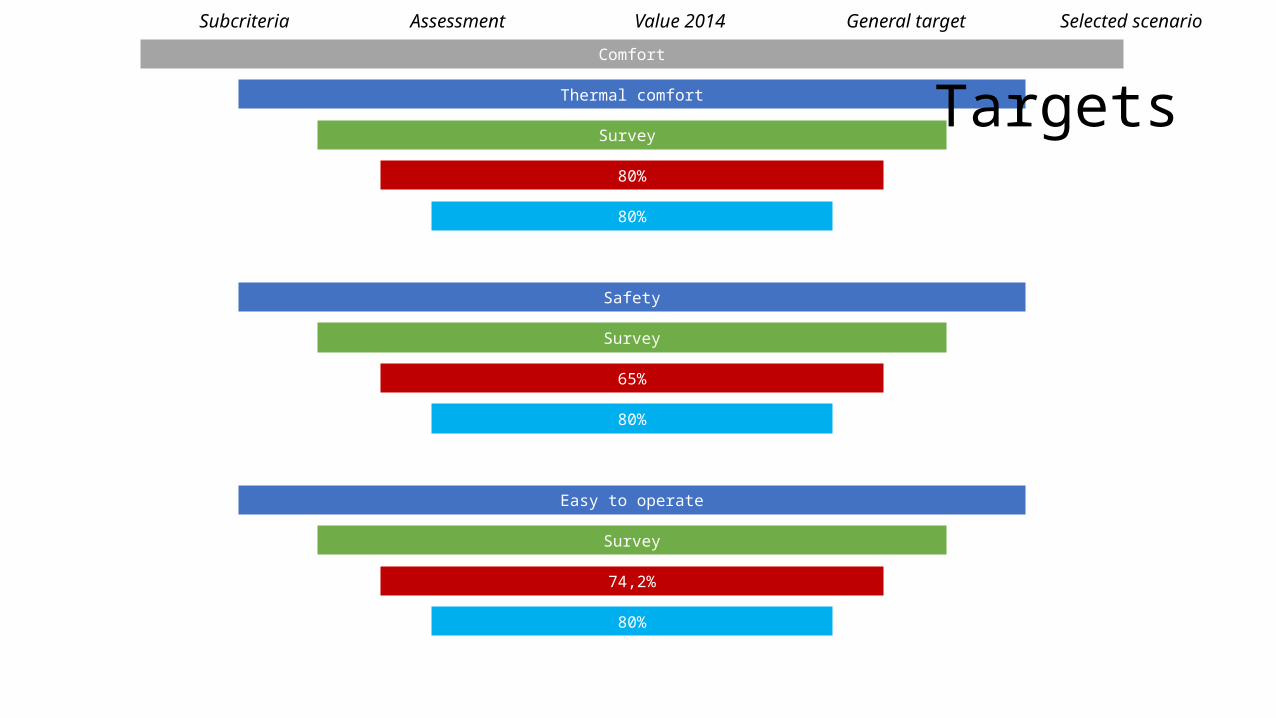
Comfort
Thermal comfort
Survey
80%
80%
Safety
Survey
65%
80%
Easy to operate
Survey
74,2%
80%
TargetsSubcriteria Assessment Value 2014 General target Selected scenario
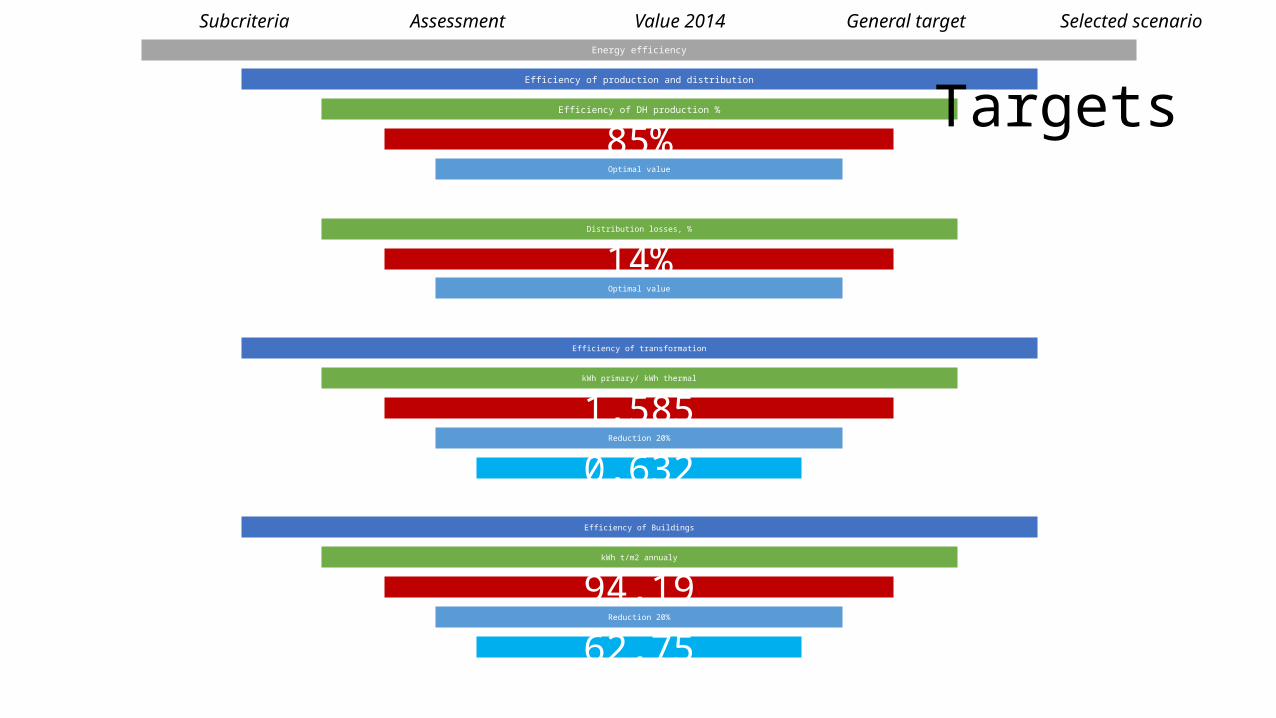
Energy efficiency
Efficiency of production and distribution
Efficiency of DH production %
85%Optimal value
Distribution losses, %
14%Optimal value
Efficiency of transformation
kWh primary/ kWh thermal
1,585Reduction 20%
0,632Efficiency of Buildings
kWh t/m2 annualy
94,19Reduction 20%
62,75
TargetsSubcriteria Assessment Value 2014 General target Selected scenario
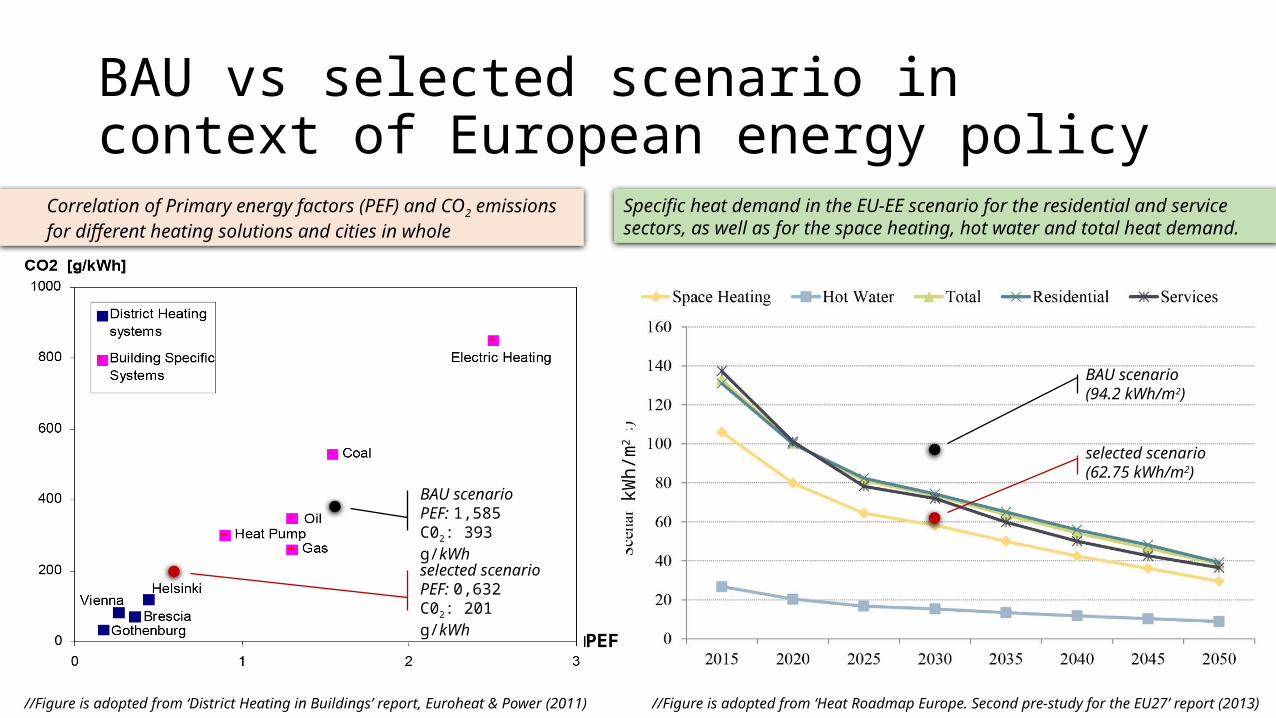
BAU vs selected scenario in context of European energy policy
Specific heat demand in the EU-EE scenario for the residential and service sectors, as well as for the space heating, hot water and total heat demand.
selected scenario(62.75 kWh/m2)
BAU scenario(94.2 kWh/m2)
//Figure is adopted from ‘Heat Roadmap Europe. Second pre-study for the EU27’ report (2013)
selected scenarioPEF: 0,632C02: 201 g/kWh
BAU scenarioPEF: 1,585C02: 393 g/kWh
//Figure is adopted from ‘District Heating in Buildings’ report, Euroheat & Power (2011)
Correlation of Primary energy factors (PEF) and CO2 emissions for different heating solutions and cities in whole
PEFkW
h/m
2
Thank you!
Dr Marija A. Živković, assistant professor
University of Belgrade-Faculty of Mining and Geology