
Pitchbook US template - Bloomberg Professional Services | … · · 2016-06-142015. 年. 11. 月....
15
2015年11月 米 利 上 げ な ら E M 通 貨 は 反 発 JPモルガン・チェース銀行 市場調査本部長 佐々木 融 Bloomberg 為替フォーラム S T R I C T L Y P R I V A T E A N D C O N F I D E N T I A L
Transcript of Pitchbook US template - Bloomberg Professional Services | … · · 2016-06-142015. 年. 11. 月....
2015年11月
米 利 上 げ な ら E M 通 貨 は 反 発
JPモルガン・チェース銀行
市場調査本部長
佐々木 融
Bloomberg 為替フォーラム
S T
R I
C T
L Y
P
R I
V A
T E
A
N D
C
O N
F I
D E
N T
I A
L

米 利
上 げ
な ら
E M
通 貨
は 反
発
各国成長率見通し (GDP 成長率、%、前期比年率) (前年比)
各国成長率見通し
15/1-3月 15/4-6月 15/7-9月 15/10-12月 16/1-3月 16/4-6月 2014 2015 2016
日本 4.6 -0.7 -0.8 1.5 1.0 1.0 -0.1 0.6 0.9
米国 0.6 3.9 1.5 2.5 2.3 2.3 2.4 2.4 2.3
ユーロ圏 2.1 1.4 1.2 1.8 2.0 2.0 0.9 1.5 1.8
英国 1.5 2.6 2.0 2.3 2.3 2.0 2.9 2.4 2.1
オーストラリア 3.6 0.7 2.9 3.1 2.1 2.4 2.7 2.3 2.6
ニュージーランド 0.9 1.7 1.3 3.5 2.5 0.7 3.3 2.2 2.1
カナダ -0.8 -0.5 2.3 2.3 2.3 2.3 2.4 1.2 2.2
中国 5.8 7.3 7.1 6.3 6.6 6.4 7.3 6.9 6.6
世界全体 2.3 2.6 2.6 2.4 3.0 2.8 2.8 2.6 2.8
先進国 1.7 2.2 1.3 2.1 2.0 2.0 1.7 1.9 2.0
エマージング 3.4 3.1 4.8 2.7 4.5 4.0 4.6 3.8 4.0出所:J.P.モルガン
世界全体の2015年前半の成長率は潜在成長率(+2.7%)を大幅に下回る。主因はEM諸国の低成長。
EM諸国の成長率は2015/Q1(3.4%)、2015/Q2(3.1%)と、リーマンショック以降の低水準記録を更新し続けた。因みに、EM諸国の2011~
2013年の平均成長率は5.1%。
日本の2015年Q1~Q3の平均成長率は年率+1.0%と潜在成長率よりも高い成長を遂げている(2011年以降昨年までの4年間の平均成
長率は+0.7%)。Q3のマイナス成長は在庫減が-2.1%も寄与。民間最終需要は前期比年率+2.1%、民間住宅投資も同+8.0%。Q4は2期
連続でマイナスが続いている民間設備投資の増加が期待される。
米国の2015年Q1~Q3の平均成長率は年率+2.0%。2011~2014年の平均成長率(+1.9%)とほぼ同水準。
ユーロ圏の2015年Q1~Q3の平均成長率は年率+1.6%。 2011~2014年の平均成長率(+0.9%)をやや上回る。堅調さを維持する企業
調査は1.7%前後の成長率が続くことを示唆している。
中国は、8月の景気対策執行から足許弱めの生産は11月以降回復と予想。内需は既に反転の兆しを見せている。
足許の世界経済:
グローバル小売売上は9月までの3カ月間に年率4%のペースで増加→今年最も高い伸び
一方、グローバル製造業生産は9月に前月比+0.1%と低水準
1

米 利
上 げ
な ら
E M
通 貨
は 反
発
Source:J.P.モルガン, Bloomberg
Source:J.P.モルガン, Bloomberg
アベノミクス開始以降の主要通貨対円騰落率 2014年中の主要通貨対円騰落率 - JPYは北欧通貨に次いで弱い通貨に
2015年初来(11/23日まで)の主要通貨対円騰落率 -JPYは強い通貨に
2012年中の主要通貨対円騰落率 - JPYは最弱通貨に
Source:J.P.モルガン, Bloomberg
Source:J.P.モルガン, Bloomberg
2013年中の主要通貨対円騰落率 - JPYは引続き主要通貨内では最弱
0
5
10
15
20
25
PLN HUF MXNKRW NOK NZD SEK RUB GBP MYR THB CAD CHF AUD EUR CNY USD TRY INR ZAR IDR BRL
% 2012年主要通貨対円騰落率
-10
-5
0
5
10
15
20
25
30
EUR CNY CHF PLN HUF GBPKRW SEK USD NZD MXN CAD MYR THB RUB NOK INR BRL AUD TRY ZAR IDR
%2013年主要通貨対円騰落率
-40
-30
-20
-10
0
10
20
USD THB IDR INR CNY KRW NZD GBP MYR TRY AUD CAD ZAR CHF BRL MXN EUR PLN HUF SEK NOK RUB
%2014年主要通貨対円騰落率
-30
-25
-20
-15
-10
-5
0
5
USD CHF CNY GBPKRW INR THB IDR SEK HUF MXN RUB PLN AUD EUR CAD NOK NZD ZAR TRY MYR BRL
% 2015年11月23日までの主要通貨対円騰落率
2
Presenter
Presentation Notes
Object titles are difficult to line up exactly to the table width, due to removal of sliver of space. On these examples, the border on the object title has been taken off.
米 利
上 げ
な ら
E M
通 貨
は 反
発
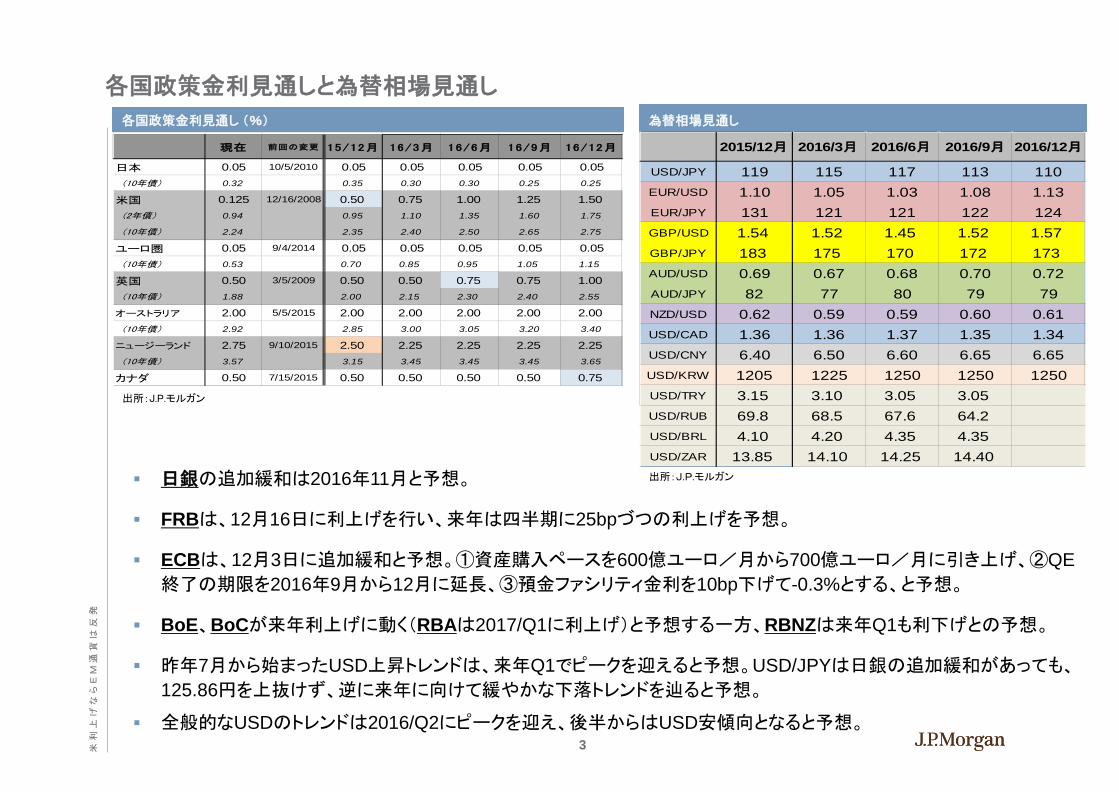
各国政策金利見通しと為替相場見通し 各国政策金利見通し (%) 為替相場見通し
2015/12月 2016/3月 2016/6月 2016/9月 2016/12月
USD/JPY 119 115 117 113 110EUR/USD 1.10 1.05 1.03 1.08 1.13EUR/JPY 131 121 121 122 124GBP/USD 1.54 1.52 1.45 1.52 1.57GBP/JPY 183 175 170 172 173AUD/USD 0.69 0.67 0.68 0.70 0.72AUD/JPY 82 77 80 79 79NZD/USD 0.62 0.59 0.59 0.60 0.61USD/CAD 1.36 1.36 1.37 1.35 1.34USD/CNY 6.40 6.50 6.60 6.65 6.65USD/KRW 1205 1225 1250 1250 1250USD/TRY 3.15 3.10 3.05 3.05USD/RUB 69.8 68.5 67.6 64.2USD/BRL 4.10 4.20 4.35 4.35USD/ZAR 13.85 14.10 14.25 14.40
出所:J.P.モルガン
出所:J.P.モルガン
現在 前回の変更 15/12月 16/3月 16/6月 16/9月 16/12月
日本 0.05 10/5/2010 0.05 0.05 0.05 0.05 0.05 (10年債) 0.32 0.35 0.30 0.30 0.25 0.25
米国 0.125 12/16/2008 0.50 0.75 1.00 1.25 1.50 (2年債) 0.94 0.95 1.10 1.35 1.60 1.75
(10年債) 2.24 2.35 2.40 2.50 2.65 2.75
ユーロ圏 0.05 9/4/2014 0.05 0.05 0.05 0.05 0.05 (10年債) 0.53 0.70 0.85 0.95 1.05 1.15
英国 0.50 3/5/2009 0.50 0.50 0.75 0.75 1.00 (10年債) 1.88 2.00 2.15 2.30 2.40 2.55
オーストラリア 2.00 5/5/2015 2.00 2.00 2.00 2.00 2.00 (10年債) 2.92 2.85 3.00 3.05 3.20 3.40
ニュージーランド 2.75 9/10/2015 2.50 2.25 2.25 2.25 2.25 (10年債) 3.57 3.15 3.45 3.45 3.45 3.65
カナダ 0.50 7/15/2015 0.50 0.50 0.50 0.50 0.75
日銀の追加緩和は2016年11月と予想。
FRBは、12月16日に利上げを行い、来年は四半期に25bpづつの利上げを予想。
ECBは、12月3日に追加緩和と予想。①資産購入ペースを600億ユーロ/月から700億ユーロ/月に引き上げ、②QE終了の期限を2016年9月から12月に延長、③預金ファシリティ金利を10bp下げて-0.3%とする、と予想。
BoE、BoCが来年利上げに動く(RBAは2017/Q1に利上げ)と予想する一方、RBNZは来年Q1も利下げとの予想。
昨年7月から始まったUSD上昇トレンドは、来年Q1でピークを迎えると予想。USD/JPYは日銀の追加緩和があっても、
125.86円を上抜けず、逆に来年に向けて緩やかな下落トレンドを辿ると予想。
全般的なUSDのトレンドは2016/Q2にピークを迎え、後半からはUSD安傾向となると予想。 3

米 利
上 げ
な ら
E M
通 貨
は 反
発
USD高はいつまで続くか?
USD名目実効レート
USDの実質実効レートは2015年8月に、2001年1月の
ピークにあと数%のところまで上昇。
現状、1990年以降の平均から10%程度割高となってい
る。
ここから更に上昇すると、プラザ合意以来の水準となる。
TPPに関して議会での承認が必要な中、USD高がどこ
まで受け入れられるか?
USD名目実効レートは昨年7月以降上昇基調が続いて
いる(直近では7/17日が最高値)。昨年7月以降の上昇
率は21%。
1990年以降の利上げ前の上昇率としては最大。
USD実質実効レート
出所:J.P.モルガン、Bloomberg
出所:J.P.モルガン
90
95
100
105
110
115
120
Jan 90 Jan 92 Jan 94 Jan 96 Jan 98 Jan 00 Jan 02 Jan 04 Jan 06 Jan 08 Jan 10 Jan 12 Jan 14
1990年以降の平均
83
85
87
89
91
93
95
97
99
101
103
Jun-14 Aug-14 Oct-14 Dec-14 Feb-15 Apr-15 Jun-15 Aug-15 Oct-15
4
Presenter
Presentation Notes
Object titles are difficult to line up exactly to the table width, due to removal of sliver of space. On these examples, the border on the object title has been taken off.

米 利
上 げ
な ら
E M
通 貨
は 反
発
1997年3月利上げ時のUSD/JPY相場
USD/JPY: 1997年のケースを除いて、利上げ開始1カ月~1カ月半前にピークを迎え、利上げ開始半年後には比較的大幅に下落している。これまでの動きで最も似ているのは1997年のケース。
2004年6月利上げ時のUSD/JPY相場
出所:J.P.モルガン, Bloomberg 出所:J.P.モルガン, Bloomberg
1999年6月利上げ時のUSD/JPY相場
1994年2月利上げ時のUSD/JPY相場
出所:J.P.モルガン, Bloomberg 出所:J.P.モルガン, Bloomberg
95
97
99
101
103
105
107
109
111
113
115
2.5
3
3.5
4
4.5
5
Jun-93 Sep-93 Dec-93 Mar-94 Jun-94 Sep-94
FF target(左軸)
USD/JPY(右軸)
1994年2月利上げ時%
USD/JPYのピークは利上げ開始1カ月前。
利上げ開始半年後は、利上げ開始前比-8.1%
100
105
110
115
120
125
130
135
5
5.25
5.5
5.75
Jul-96 Oct-96 Jan-97 Apr-97 Jul-97 Oct-97
FF target(左軸)
USD/JPY(右軸)
1997年3月利上げ時%
USD/JPYのピークは利上げ開始1カ月後。USD/JPY=123円台で利上げ。約1カ月後に127.50円まで上昇するが、その後約1カ月で110.65円まで急落。但し、
利上げ開始半年後は、利上げ開始前比-2.0%のところまで反発。
100
105
110
115
120
125
130
135
140
145
150
4.5
4.75
5
5.25
5.5
5.75
6
Feb-98 May-98 Aug-98 Nov-98 Feb-99 May-99 Aug-99 Nov-99 Feb-00
FF target(左軸)
USD/JPY(右軸)
1999年6月利上げ時%
USD/JPYのピークは利上げ開始1カ月前。
利上げ開始半年後は、利上げ開始前比-15.4%100
102
104
106
108
110
112
114
116
0.5
1
1.5
2
2.5
Oct-03 Jan-04 Apr-04 Jul-04 Oct-04
FF target(左軸)
USD/JPY(右軸)
% 2004年6月利上げ時
USD/JPYのピークは利上げ開始1カ月半前。
利上げ開始半年後は、利上げ開始前比-5.2%
5
Presenter
Presentation Notes
Object titles are difficult to line up exactly to the table width, due to removal of sliver of space. On these examples, the border on the object title has been taken off.

米 利
上 げ
な ら
E M
通 貨
は 反
発
1997年3月利上げ時の名目USD実効レート
USD名目実効レートもほぼUSD/JPYと同様の動き
2004年6月利上げ時の名目USD実効レート
出所:J.P.モルガン, Bloomberg 出所:J.P.モルガン, Bloomberg
1999年6月利上げ時の名目USD実効レート
1994年2月利上げ時の名目USD実効レート
出所:J.P.モルガン, Bloomberg 出所:J.P.モルガン, Bloomberg
73
74
75
76
77
78
79
80
81
2.5
3
3.5
4
4.5
5
Jun-93 Sep-93 Dec-93 Mar-94 Jun-94 Sep-94
FF target(左軸)
USD名目実効レート
(右軸)
1994年2月利上げ時%
USD実効レートは利上げ開始1カ月前に一旦ピークを付けたが、その後暫く横這い。利上
げ開始2カ月後に高値をわずかに更新。 利上げ開始半年後は、利上げ開始前比-1.4%85
87
89
91
93
95
97
99
5
5.25
5.5
5.75
Jul-96 Oct-96 Jan-97 Apr-97 Jul-97 Oct-97
FF target(左軸)
USD名目実効レート
(右軸)
1997年3月利上げ時%
USD実効レートは利上げ開始1カ月半後に一旦ピークを付け
下落したが、その後反発。利上げ開始4カ月半後に高値更
新。利上げ開始半年後は、利上げ開始前比+0.7%
94
95
96
97
98
99
100
101
102
103
104
4.5
4.75
5
5.25
5.5
5.75
6
Feb-98 May-98 Aug-98 Nov-98 Feb-99 May-99 Aug-99 Nov-99 Feb-00
FF target(左軸)
USD名目実効レート
(右軸)
1999年6月利上げ時%
USD実効レートのピークは利上げとほぼ同時期。
利上げ開始半年後は、利上げ開始前比-2.7%86
88
90
92
94
96
98
0.5
1
1.5
2
2.5
Oct-03 Jan-04 Apr-04 Jul-04 Oct-04
FF target(左軸)
USD名目実効レート
(右軸)
% 2004年6月利上げ時
USD実効レートのピークは利上げ1カ月半前。
利上げ開始半年後は、利上げ開始前比-6.9%
6
Presenter
Presentation Notes
Object titles are difficult to line up exactly to the table width, due to removal of sliver of space. On these examples, the border on the object title has been taken off.

米 利
上 げ
な ら
E M
通 貨
は 反
発
Fedの利上げとEM資産①
1997年3月の利上げとADXY 1997年3月の利上げとLACI
出所:ブルームバーグ、J.P.モルガン
116
118
120
122
124
126
128
5.2
5.3
5.3
5.4
5.4
5.5
5.5
5.6
Jul-96 Oct-96 Jan-97 Apr-97 Jul-97
FF金利ターゲット(左目盛)
ADXY(右目盛)
%
178
180
182
184
186
188
190
192
5.2
5.3
5.4
5.5
5.6
Jul-96 Oct-96 Jan-97 Apr-97 Jul-97
FF金利ターゲット(左目盛)
LACI (右目盛)
%
出所:ブルームバーグ、J.P.モルガン
440
460
480
500
520
540
560
580
5.2
5.3
5.3
5.4
5.4
5.5
5.5
5.6
Jul-96 Oct-96 Jan-97 Apr-97 Jul-97
FF金利ターゲット(左目盛)
MSCI EM指数(右目盛)
%
1997年3月の利上げとMSCI EM株価指数
出所:ブルームバーグ、J.P.モルガン 7

米 利
上 げ
な ら
E M
通 貨
は 反
発
Fedの利上げとEM資産②
1999年6月の利上げとADXY 1999年6月の利上げとLACI
1999年6月の利上げとMSCI EM株価指数 1999年6月の利上げとEMBIG平均金利
出所:ブルームバーグ、J.P.モルガン
出所:ブルームバーグ、J.P.モルガン
出所:ブルームバーグ、J.P.モルガン
出所:ブルームバーグ、J.P.モルガン
100
101
102
103
104
105
106
4.6
4.8
5.0
5.2
5.4
5.6
5.8
6.0
6.2
Jan-98 May-98 Sep-98 Jan-99 May-99 Sep-99 Jan-00
FF金利ターゲット(左目盛)
ADXY(右目盛)
%
200
250
300
350
400
450
500
550
4.6
4.8
5.0
5.2
5.4
5.6
5.8
6.0
6.2
Jan-98 May-98 Sep-98 Jan-99 May-99 Sep-99 Jan-00
FF金利ターゲット(左目盛)
MSCI EM指数(右目盛)
%
120
130
140
150
160
170
180
4.6
4.8
5.0
5.2
5.4
5.6
5.8
6.0
6.2
Jan-98 May-98 Sep-98 Jan-99 May-99 Sep-99 Jan-00
FF金利ターゲット(左目盛)
LACI(右目盛)
%
7
9
11
13
15
17
19
21
23
4.6
4.8
5.0
5.2
5.4
5.6
5.8
6.0
6.2
Jan-98 May-98 Sep-98 Jan-99 May-99 Sep-99 Jan-00
FF金利ターゲット(左目盛)
EMBIG平均金利(右目盛)
% (両軸共)
8

米 利
上 げ
な ら
E M
通 貨
は 反
発
Fedの利上げとEM資産③
2004年6月の利上げとADXY 2004年6月の利上げとLACI
出所:ブルームバーグ、J.P.モルガン 出所:ブルームバーグ、J.P.モルガン
2004年6月の利上げとMSCI EM株価指数 2004年6月の利上げとEMBIG平均金利
出所:ブルームバーグ、J.P.モルガン 出所:ブルームバーグ、J.P.モルガン
2004年6月の利上げとEMCI
出所:ブルームバーグ、J.P.モルガン
98
99
100
101
102
103
104
105
0.50.70.91.11.31.51.71.92.12.32.5
Jan-04 Mar-04 May-04 Jul-04 Sep-04 Nov-04
FF金利ターゲット(左目盛)
ADXY (右目盛)
%
90
92
94
96
98
100
102
0.50.70.91.11.31.51.71.92.12.32.5
Jan-04 Mar-04 May-04 Jul-04 Sep-04 Nov-04
FF金利ターゲット(左目盛)
LACI(右目盛)
%
86
88
90
92
94
96
98
0.50.70.91.11.31.51.71.92.12.32.5
Jan-04 Mar-04 May-04 Jul-04 Sep-04 Nov-04
FF金利ターゲット(左目盛)
EMCI (右目盛)
%
350
400
450
500
550
600
0.50.70.91.11.31.51.71.92.12.32.5
Jan-04 Mar-04 May-04 Jul-04 Sep-04 Nov-04
FF金利ターゲット(左目盛)
MSCI EM指数(右目盛)
%
66.577.588.599.51010.511
0.50.70.91.11.31.51.71.92.12.32.5
Jan-04 Mar-04 May-04 Jul-04 Sep-04 Nov-04
FF金利ターゲット(左目盛)
EMBIG (右目盛)
GBI-EM(右目盛)
% (両軸共)
9

米 利
上 げ
な ら
E M
通 貨
は 反
発
2004年か2013年か?
米2年債金利 EM通貨のボラティリティ・インデックス(JPMNXYEM)
米10年債金利
出所:J.P.モルガン
出所:J.P.モルガン
出所:J.P.モルガン
2004年は実際の利上げにもかかわらずEM資産は買われ、2013
年はテーパリングを示唆しただけでEM資産が売られた。両者の
違いはなんだったのであろうか? また、今回はどちらに近いの
か?
鍵は、実際のイベントの前にどれだけ市場が織り込んでいる
か。2004年6月の利上げは完全に織り込み済みだったため、利
上げ後金利、市場のボラティリティは低下した。一方2013年は、
米金利が急上昇し、市場のボラティリティも急騰した。
1
1.5
2
2.5
3
3.5
3.4
3.6
3.8
4
4.2
4.4
4.6
4.8
5
-200 -150 -100 -50 0 50 100
2004年(左目盛)
2013年(右目盛)
%両軸共
営業日:0=2004年6月30日(利上げ)、2013年5月22日(バーナ
ンキ発言)
0.1
0.2
0.3
0.4
0.5
0.6
0.7
0.8
0.9
1
1.5
2
2.5
3
3.5
-200 -150 -100 -50 0 50 100
2004年(左目盛)
2013年(右目盛)
%両軸共
営業日:0=2004年6月30日(利上げ)、2013年5月22日
(バーナンキ発言)
6
7
8
9
10
11
12
13
-200 -150 -100 -50 0 50 100
2004年
2013年
営業日:0=2004年6月30日(利上げ)、2013年5月22日(バーナ
ンキ発言)
10

米 利
上 げ
な ら
E M
通 貨
は 反
発
Fed利上げに対する反応は国によって区々に
経常収支(2015年見通し) 経常収支と海外投資家債券保有比率
海外投資家の債券保有比率
出所:J.P.モルガン
出所:J.P.モルガン 出所:J.P.モルガン
-10
-5
0
5
10
15
20TW
DSG
DKR
WRU
BTH
BPH
PHU
FCN
YMY
RCZ
KIN
RMX
NID
RBR
LTR
YPL
NZA
RCO
P
%対GDP
05
101520253035404550
MYR
HUF
IDR PLN
MXN
ZAR
SGD
TRY
BRL
THB
RUB
COP
CZK
KRW
TWD
CNY
PHP INR
% Fedの利上げに対して相対的に脆弱なのは、①経常収支
赤字国と、②海外から大規模な資金流入がある国。
この二つに当てはまるのは、メキシコ、インドネシア、ポー
ランド、南アフリカなど。
-10
-5
0
5
10
15
20
0 10 20 30 40 50
(縦軸)%:経常収支対GDP比 2015年予想
(横軸)%:海外投資家債券保有比率
SGD
RUB
COPBRL
TRYMXN
PLN
IDR
HUFMYR
TWD
ZAR
THBCNY
PHP
INR
KRW
CZK
11

米 利
上 げ
な ら
E M
通 貨
は 反
発
信用格付のご利用にあたっての留意事項
本書に信用格付が記載されている場合、日本格付研究所(JCR)及び格付投資情報センター(R&I)による格付は、登録信用格付業者が付与した格付です。JCR及
びR&I以外の付与した格付で登録信用格付業者による旨の記載がない場合は、無登録格付を意味します。無登録格付のうち、無登録格付業者であるスタンダー
ド&プアーズ・レーティング・サービシズ(S&P)、ムーディーズ・インベスターズ・サービス・インク(Moody’s)又はフィッチ・レーティングス(Ficth)が付与した格付につ
いては、投資判断を行われる前に、別途お送りしている又はお送りする、対応する格付会社の「無登録格付に関する説明書」を十分にお読み下さい。
金融商品取引法に基づく表示事項
(Below statement explains possible risks of financial instruments in Japanese language. This is to follow “The Financial Instruments and Exchange Law”of
Japan.)
通貨オプション取引、キャップ・フロアー取引、スワップション取引、金利スワップ取引、通貨スワップ取引(「店頭デリバティブ取引」)にあたっては、原則として契約
対価の他に手数料その他の費用は頂戴いたしません。
当行において行う店頭デリバティブ取引は、金利指標、通貨の価格等を直接の原因として損失が生ずることとなるおそれがある取引です。また、ISDAマスター契
約におけるクレジット・サポート・アネックス(Credit Support Annex)等の担保契約の適用がある場合、上記の各種の参照指標が大きく変動することで 、発生する
損失の額が差し入れていただく担保の額を上回る恐れがあります。店頭デリバティブ取引の契約金額は、当該デリバティブ取引等についてお客様に差し入れて
いただく担保の額を上回る可能性があります。店頭デリバティブ取引にあたり差し入れていただく担保の額は担保契約の内容により異なるため、契約金額の担
保額に対する比率上限を算出することはできません。
店頭デリバティブ取引では通常、反対取引(本店頭デリバティブ取引における各当事者が互いにその立場を入れ替えて行う取引)を行おうとする場合は価格に差
があり、原則として同じ価格での反対売買を行うことは出来ません。
権利行使期間がある場合は権利を行使できる期間に制限があります。期限前解約条項、自動消滅条項等の早期終了条項が付されている場合は、予定された
終了日の前に取引が終了する可能性があります。
債券を相対で取引いただく場合及び募集・売出しによりお買付いただく場合は、購入対価のみお支払いただくことになります。債券の価格は、市場の金利水準の
変化に対応して変動しますので、償還前に換金する場合には、損失が生じるおそれがあります。また、外国債券の場合、為替相場の変動によっても損失が生じ
るおそれがあります。
取引毎に契約条件及びリスクは異なりますので、実際に取引を行っていただく前には契約締結前交付書面やお客様向け資料の内容をよくお読みください。
JPモルガン・チェース銀行 東京支店
登録金融機関 関東財務局長(登金)第91号
加入協会:日本証券業協会、社団法人金融先物取引業協会
12

米 利
上 げ
な ら
E M
通 貨
は 反
発
その他のディスクロージャー J.P.モルガン (“JPM”)は、JP Morgan Securities, LLC. (JPMS)および全世界における米国以外の関連会社のブランドネームです。J.P. Morgan Cazenove は JPMorgan Chase & Coおよびその関連会社の英国におけるインベストメント・バンキング・ビジネス、EMEAの株式および株式調査ビジネスのマーケティングネームです。 お客様にご利用頂ける全てのリサーチレポートは、発行と同時に当社の顧客用ウェブサイトである J.P. Morgan Markets においてご覧いただけます。全てのリサーチの内容が、 第三者によるコンテンツ・サイト等に再配信・送信されている、または同サイト等で入手可能となっているとは限りません。個別銘柄について入手可能なレポートは、当社の担 当セールスにお問い合わせ下さい。 オプションに関する調査資料:本資料で提供する情報がオプションに関する調査資料である場合、当該情報は適切なオプションリスクディスクロージャー資料を受領した場合 に限り、入手が可能となります。Option Clearing Corporation's Characteristics and Risks of Standardized Options の資料入手に関しては、J.P.モルガンの担当者にご連絡いた だくか、もしくは Option Clearing Corporation (OCC)のウェブサイト http://www.optionsclearing.com/publications/risks/riskstoc.pdf をご覧ください。 法人:米国: JPMS は NYSE、FINRA、SIPC ならびに NFA の会員です。JPMorgan Chase Bank, N.A.は FDIC の会員です。英国: JPMorgan Chase N.A., London Branch は Prudential Regulation Authority の認可を受け、Financial Conduct Authority と Prudential Regulation Authority(一部)の監督下にあります。Prudential Regulation Authority に よる監督範囲の詳細については、J.P. Morgan までお問い合わせください。J.P. Morgan Securities plc. (JPMS plc) はロンドン証券取引所の会員であり、Prudential Regulation Authority の認可を受け、Financial Conduct Authority と the Prudential Regulation Authority の監督下にあります。イギリスおよびウェールズで登録されています:No. 2711006. Registered Office 25 Bank Street, London, E14 5JP。南アフリカ: J.P. Morgan Equities South Africa Proprietary Limited はヨハネスブルグ証券取引所の会員で Financial Services Board の監督下にあります。香港:J.P. Morgan Securities (Asia Pacific) Limited (CE 番号は AAJ321)は香港の Hong Kong Monetary Authority および Securities and Futures Commission の監督下にあります。 J.P. Morgan Broking (Hong Kong) Limited (CE 番号は AAB027)は香港の Securities and Futures Commission の監督下にあります。 韓国:韓国内における当調査資料の発行・配布は、韓国取引所(KRX)の会員であり、かつ Financial Services Commission (FSC)および Financial Supervisory Service (FSS)の 監督下にある J.P. Morgan Securities (Far East) Limited, Seoul Branch によって、または通じて行っております。オーストラリア:J.P. Morgan Australia Limited (JPMAL) (ABN 52 002 888 011/AFS Licence No:238188)は ASIC の監督下にあり、J.P. Morgan Securities Australia Limited (JPMSAL) (ABN 61 003 245 234/AFS Licence No:238066)はASX および CHI-X から証券・清算・決済業務の認可を受けており、ASIC の監督下にあります。台湾:J.P. Morgan Securities (Taiwan) Limited は台湾証券取引所(会社型)および台湾金融監督委員会(Taiwan Securities and Futures Bureau)の監督下にあります。インド:J.P. Morgan India Private Limited (Corporate Identity NumberはU67120MH1992FTC068724, J.P. Morgan Tower, Off. C.S.T. Road, Kalina, Santacruz East, Mumbai – 400098) は、Securities and Exchange Board of India (SEBI)にRegistration number INH000001873 として‘Research Analyst’登録されております。J.P. Morgan India Private Limitedはインド証券取引所 (National Stock Exchange of the India Limited; SEBI Registration Number - INB 230675231/INF 230675231/INE 230675231)とボンベイ証券取引所 (SEBI Registration Number - INB010675237/INF010675237) に会員登録されています。(電話番号: 91-22-6157 3000, ファックス: 91-22-6157 3990, ウェブサイト: www.jpmipl.com )インド国外で発行された調査資料は、J.P. Morgan India Private Limitedがインド国内に配布したものではありません。タイ:当調査資料は、タイ証券取引所の会員で Ministry of Finance and the Securities and Exchange Commission の監督下にある JPMorgan Securities (Thailand) Limited によ り発行・配布されています。登録住所: 3rd Floor, 20 North Sathorn Road, Silom, Bangrak, Bangkok 10500。インドネシア: PT J.P. Morgan Securities Indonesia は、インドネシア 証券取引所の会員であり、the OJK a.k.a BAPEPAM LK の監督下にあります。フィリピン: J.P. Morgan Securities Philippines Inc.はフィリピン証券取引所の取引参加者、Securities Clearing Corporation of the Philippines および Securities Investor Protection Fund の会員で、フィリピン証券取引委員会(SEC)の監督下にあります。ブラジル:Banco J.P. Morgan S.A.はブラジル証券取引委員会 (CVM)およびブラジル中央銀行(BCB)の監督下にあります。メキシコ: J.P. Morgan Casa de Bolsa, S.A. de C.V., J.P. Morgan Grupo Financiero はメキシコ証券取引所の会員であり、National Banking and Securities Exchange Commission からブローカーディーラーとして認可を受けております。 シンガポール: シンガポール内における当調査資料の発行・配布はシンガポール証券取引所の会員で Monetary Authority of Singapore (MAS)監督下の J.P. Morgan Securities Singapore Private Limited (JPMSS)[MCI (P) 100/03/2015 and Co. Reg. No.:199405335R]および/もしくは, MAS 監督下の JPMorgan Chase Bank, N.A., Singapore branch (JPMCB Singapore)によって、または通じて行っております。当調査資料はシンガポール内においては Section 4A of the Securities and Futures Act, Cap. 289.にて定義された accredited investors、expert investor 及び institutional investors のみに配信されます。本資料を受領した者は、本資料により発生した/もしくは本資料に関連する問い合わせについて、JPMSS もしくは JPMCB Singapore にご連絡下さい。日本:JP モルガン証券株式会社及び、JP モルガン・チェース銀行 東京支店は金融庁の監督下にあります。マレーシア: 当調査資料の発行・配布は J.P. Morgan Securities (Malaysia) Sdn Bhd (18146-X)が行っており、Bursa Malaysia Berhad の会員かつマレーシア証券委員 会が認可する資本市場サービスライセンス(Capital Markets Services License)の取得者です。パキスタン: J. P. Morgan Pakistan Broking (Pvt.) Ltd はカラチ証券取引所の会員で、Securities and Exchange Commission of Pakistan の監督下にあります。サウジアラビア:J.P. Morgan Saudi Arabia Ltd.は、サウジアラビア王国のサウジ資本市場庁 (Capital Market Authority)より、エージェントとして取引の遂行、証券業務に関するアレンジ、助言および保管に携わる認可(35-07079、8th Floor, Al-Faisaliyah Tower, King Fahad Road, P.O. Box 51907, Riyadh 11553, Kingdom of Saudi Arabia)を受けております。ドバイ: JPMorgan Chase Bank, N.A., Dubai Branch は、Dubai Financial Services Authority (DFSA) の監督下にあります。登録住所: Dubai International Financial Centre - Building 3, Level 7, PO Box 506551, Dubai, UAE.
13
米 利
上 げ
な ら
E M
通 貨
は 反
発
Country and Region Specific Disclosures U.K. and European Economic Area (EEA): Unless specified to the contrary, issued and approved for distribution in the U.K. and the EEA by JPMS plc. Investment research issued by JPMS plc has been prepared in accordance with JPMS plc's policies for managing conflicts of interest arising as a result of publication and distribution of investment research. Many European regulators require a firm to establish, implement and maintain such a policy. This report has been issued in the U.K. only to persons of a kind described in Article 19 (5), 38, 47 and 49 of the Financial Services and Markets Act 2000 (Financial Promotion) Order 2005 (all such persons being referred to as "relevant persons"). This document must not be acted on or relied on by persons who are not relevant persons. Any investment or investment activity to which this document relates is only available to relevant persons and will be engaged in only with relevant persons. In other EEA countries, the report has been issued to persons regarded as professional investors (or equivalent) in their home jurisdiction. Australia: This material is issued and distributed by JPMSAL in Australia to "wholesale clients" only. This material does not take into account the specific investment objectives, financial situation or particular needs of the recipient. The recipient of this material must not distribute it to any third party or outside Australia without the prior written consent of JPMSAL. For the purposes of this paragraph the term "wholesale client" has the meaning given in section 761G of the Corporations Act 2001. Germany: This material is distributed in Germany by J.P. Morgan Securities plc, Frankfurt Branch and J.P.Morgan Chase Bank, N.A., Frankfurt Branch which are regulated by the Bundesanstalt für Finanzdienstleistungsaufsicht. Hong Kong: The 1% ownership disclosure as of the previous month end satisfies the requirements under Paragraph 16.5(a) of the Hong Kong Code of Conduct for Persons Licensed by or Registered with the Securities and Futures Commission. (For research published within the first ten days of the month, the disclosure may be based on the month end data from two months prior.) J.P. Morgan Broking (Hong Kong) Limited is the liquidity provider/market maker for derivative warrants, callable bull bear contracts and stock options listed on the Stock Exchange of Hong Kong Limited. An updated list can be found on HKEx website: http://www.hkex.com.hk. Japan: There is a risk that a loss may occur due to a change in the price of the shares in the case of share trading, and that a loss may occur due to the exchange rate in the case of foreign share trading. In the case of share trading, JPMorgan Securities Japan Co., Ltd., will be receiving a brokerage fee and consumption tax (shouhizei) calculated by multiplying the executed price by the commission rate which was individually agreed between JPMorgan Securities Japan Co., Ltd., and the customer in advance. Financial Instruments Firms: JPMorgan Securities Japan Co., Ltd., Kanto Local Finance Bureau (kinsho) No. 82 Participating Association / Japan Securities Dealers Association, The Financial Futures Association of Japan, Type II Financial Instruments Firms Association and Japan Investment Advisers Association. Korea: This report may have been edited or contributed to from time to time by affiliates of J.P. Morgan Securities (Far East) Limited, Seoul Branch. Singapore: As at the date of this report, JPMSS is a designated market maker for certain structured warrants listed on the Singapore Exchange where the underlying securities may be the securities discussed in this report. Arising from its role as designated market maker for such structured warrants, JPMSS may conduct hedging activities in respect of such underlying securities and hold or have an interest in such underlying securities as a result. The updated list of structured warrants for which JPMSS acts as designated market maker may be found on the website of the Singapore Exchange Limited: http://www.sgx.com.sg. In addition, JPMSS and/or its affiliates may also have an interest or holding in any of the securities discussed in this report – please see the Important Disclosures section above. For securities where the holding is 1% or greater, the holding may be found in the Important Disclosures section above. For all other securities mentioned in this report, JPMSS and/or its affiliates may have a holding of less than 1% in such securities and may trade them in ways different from those discussed in this report. Employees of JPMSS and/or its affiliates not involved in the preparation of this report may have investments in the securities (or derivatives of such securities) mentioned in this report and may trade them in ways different from those discussed in this report. Taiwan: This material is issued and distributed in Taiwan by J.P. Morgan Securities (Taiwan) Limited. India: For private circulation only, not for sale. Pakistan: For private circulation only, not for sale. New Zealand: This material is issued and distributed by JPMSAL in New Zealand only to persons whose principal business is the investment of money or who, in the course of and for the purposes of their business, habitually invest money. JPMSAL does not issue or distribute this material to members of "the public" as determined in accordance with section 3 of the Securities Act 1978. The recipient of this material must not distribute it to any third party or outside New Zealand without the prior written consent of JPMSAL. Canada: The information contained herein is not, and under no circumstances is to be construed as, a prospectus, an advertisement, a public offering, an offer to sell securities described herein, or solicitation of an offer to buy securities described herein, in Canada or any province or territory thereof. Any offer or sale of the securities described herein in Canada will be made only under an exemption from the requirements to file a prospectus with the relevant Canadian securities regulators and only by a dealer properly registered under applicable securities laws or, alternatively, pursuant to an exemption from the dealer registration requirement in the relevant province or territory of Canada in which such offer or sale is made. The information contained herein is under no circumstances to be construed as investment advice in any province or territory of Canada and is not tailored to the needs of the recipient. To the extent that the information contained herein references securities of an issuer incorporated, formed or created under the laws of Canada or a province or territory of Canada, any trades in such securities must be conducted through a dealer registered in Canada. No securities commission or similar regulatory authority in Canada has reviewed or in any way passed judgment upon these materials, the information contained herein or the merits of the securities described herein, and any representation to the contrary is an offence. Dubai: This report has been issued to persons regarded as professional clients as defined under the DFSA rules. Brazil: Ombudsman J.P. Morgan: 0800- 7700847 / [email protected]. 一般:追加情報は御要望に応じてお渡しいたします。本資料で提供している情報は信頼できると考える筋から得たものですが、JPMorgan Chase & Co.、もしくは関連会社、および/もしくは子会社(総称してJ.P.モルガン)は、JPMSおよび/もしくはその関連会社に関するディスクロージャーおよびアナリストと有価証券の発行企業との関係を示すディ スクロージャー以外については、掲載された情報の完全性あるいは正確性を保証するものではありません。株価は、明記がない限り市場取引終了時点のものです。見解や評 価は記載時点での判断であり、予告なしに変更されることがあります。過去のパフォーマンスは、将来における結果を示唆するものではありません。本資料はいかなる金融商 品についても、その売買に関する申し出あるいは勧誘を意図したものではありません。本資料に掲載されている証券、金融商品、あるいは投資戦略は全ての投資家に適合するとは限りません。本資料に掲載されている見解や推奨は各投資家の状況、目標、あるいはニーズを考慮したものではなく、特定の投資家に対し、特定の証券、金融商品、 あるいは投資戦略を薦めるものではありません。本資料の受領にあたり、本資料に掲載されている証券または金融商品に関する判断は投資家ご自身でなさるようお願いいた します。米国以外の関連会社が発行した調査資料の米国内での配布、および内容に関する責任はJPMSが負っております。J.P.モルガンは企業の開発や発表事項、市場の 状況あるいは公表された情報に基づき、企業および業界に関して定期的に情報のアップデートを提供することができます。準拠法により認められている場合を除き、投資家 はアナリストとの連絡および取引の執行は現地の J.P.モルガン子会社、あるいは関連会社を通じて行ってください。 (「その他のディスクロージャー」2015 年 10 月 17 日改訂) Copyright 2015 JPMorgan Chase & Co. - All rights reserved. 本資料および本資料で提供している情報は、J.P.モルガンの文書による同意なしに再版、転載、販売および再配布することを禁じます。 14


![JP モルガン・チェースの戦略分析モルガン・スタンレー[“Morgan Stanley”, 2019]と続く。つま り、JPモルガン・チェースは、6行中4番目に古い銀行に](https://static.fdocument.pub/doc/165x107/5fa5e9efcc3adf22bf75cb46/jp-ffffffc-fffffffaoemorgan.jpg)


