PepsiCo, Inc. First Quarter 2011 · Please refer to the glossary appearing at the end of this slide...
14
Earnings Call PepsiCo, Inc. First Quarter 2011
Transcript of PepsiCo, Inc. First Quarter 2011 · Please refer to the glossary appearing at the end of this slide...
Earnings Call
PepsiCo, Inc. First Quarter 2011

Safe Harbor Statement, Glossary of Terms and Non‐GAAP InformationSafe Harbor StatementStatements in this communication that are "forward‐looking statements," including our 2011 guidance, are based on currently available information, operating plans and projections about future events and trends. They inherently involve risks and uncertainties that could cause actual results to differ materially from those predicted in such forward‐looking statements. Such risks and uncertainties include, but are not limited to: changes in demand for PepsiCo’s products, as a result of changes in consumer preferences and tastes or otherwise; damage to PepsiCo’s reputation; PepsiCo’s ability to grow its business in developing and emerging markets or unstable political conditions, civil unrest or other developments and risks in the countries where PepsiCo operates; trade consolidation or the loss of any key customer; changes in the legal and regulatory environment; PepsiCo’s ability to build and sustain proper information technology infrastructure, successfully implement its ongoing business transformation initiative or outsource certain functions effectively; unfavorable economic conditions in the countries in which PepsiCo operates; fluctuations in foreign exchange rates; PepsiCo’s ability to compete effectively; increased costs, disruption of supply or shortages of raw materials and other supplies; disruption of PepsiCo’s supply chain; climate change, or legal, regulatory or market measures to address climate change; PepsiCo’s ability to hire or retain key employees or a highly skilled and diverse workforce; failure to successfully renew collective bargaining agreements or strikes or work stoppages; and failure to successfully complete or integrate acquisitions and joint ventures into PepsiCo’s existing operations.For additional information on these and other factors that could cause PepsiCo’s actual results to materially differ from those set forth herein, please see PepsiCo’s filings with the SEC, including its most recent annual report on Form 10‐K and subsequent reports on Forms 10‐Q and 8‐K. Investors are cautioned not to place undue reliance on any such forward‐looking statements, which speak only as of the date they are made. PepsiCo undertakes no obligation to update any forward‐looking statements, whether as a result of new information, future events or otherwise.
Glossary of TermsPlease refer to the glossary appearing at the end of this slide presentation to find definitions for abbreviations and financial terms used herein.
Non‐GAAP InformationPlease refer to the “Investors” section of PepsiCo’s web site at www.pepsico.com under the heading “Investor Presentations” to find disclosure and a reconciliation of any Non‐GAAP financial measures contained herein.
2

Chairman and CEO,PepsiCo
Indra Nooyi
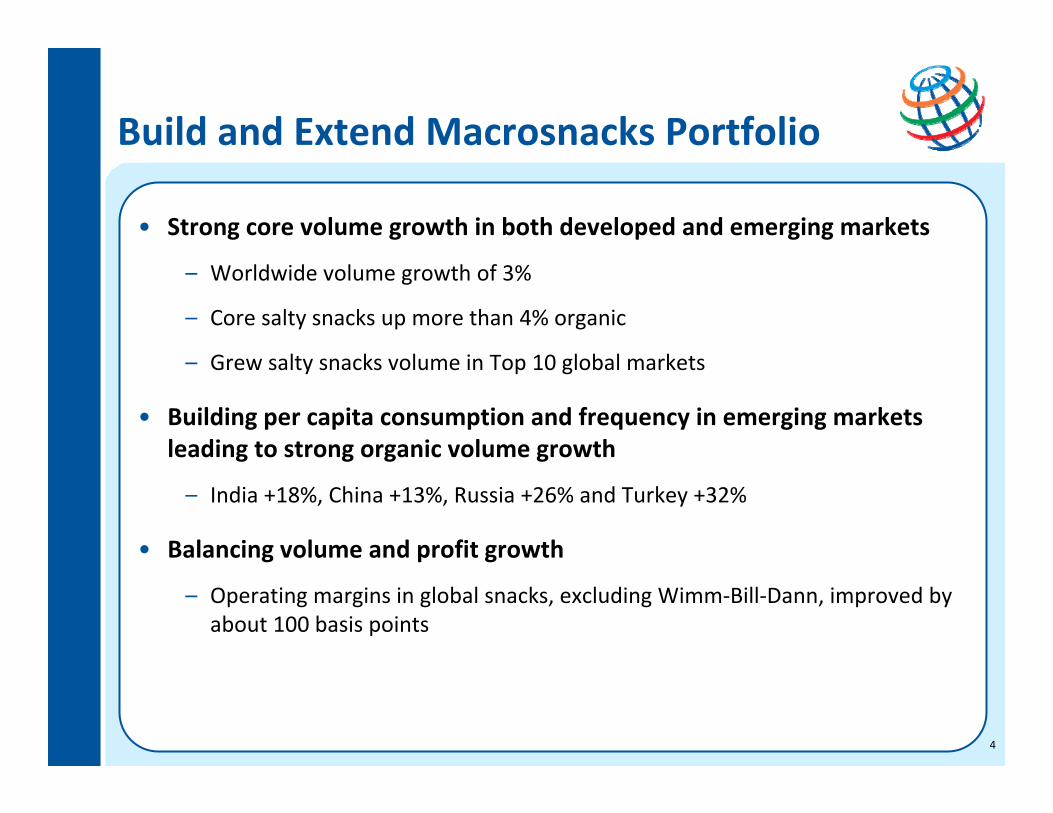
Build and Extend Macrosnacks Portfolio
• Strong core volume growth in both developed and emerging markets
– Worldwide volume growth of 3%
– Core salty snacks up more than 4% organic
– Grew salty snacks volume in Top 10 global markets
• Building per capita consumption and frequency in emerging markets leading to strong organic volume growth
– India +18%, China +13%, Russia +26% and Turkey +32%
• Balancing volume and profit growth
– Operating margins in global snacks, excluding Wimm‐Bill‐Dann, improved by about 100 basis points
4
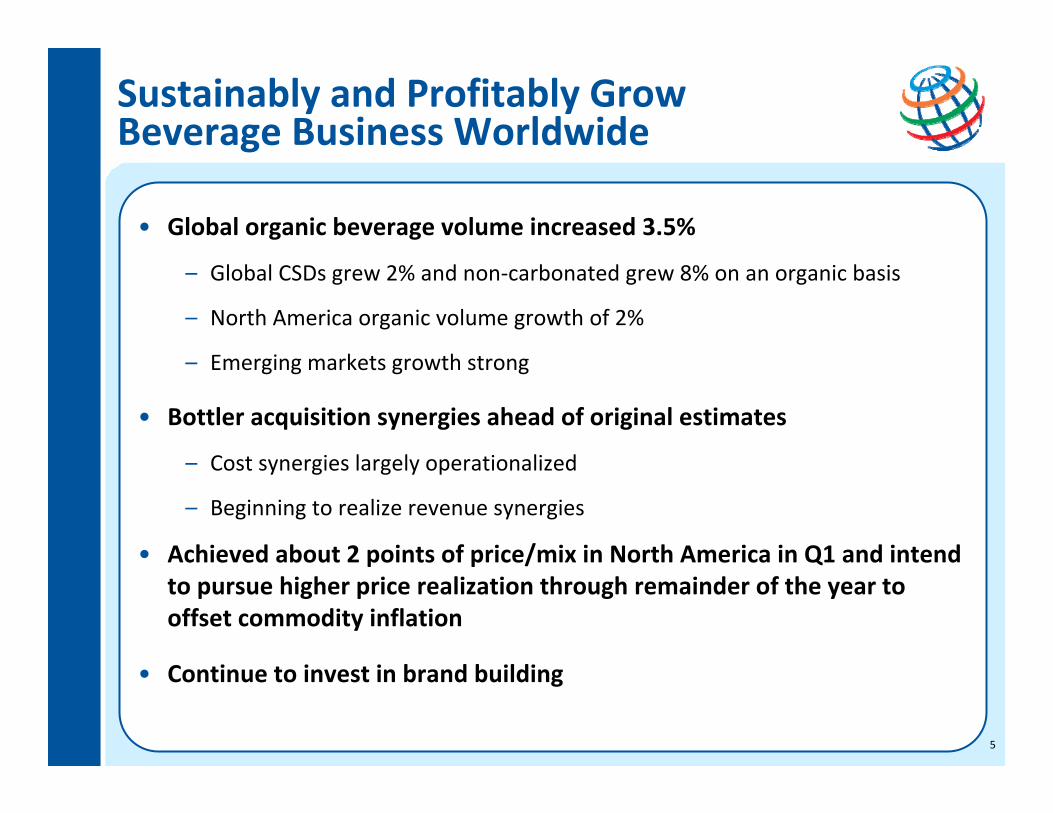
Sustainably and Profitably Grow Beverage Business Worldwide
• Global organic beverage volume increased 3.5%
– Global CSDs grew 2% and non‐carbonated grew 8% on an organic basis
– North America organic volume growth of 2%
– Emerging markets growth strong
• Bottler acquisition synergies ahead of original estimates
– Cost synergies largely operationalized
– Beginning to realize revenue synergies
• Achieved about 2 points of price/mix in North America in Q1 and intend to pursue higher price realization through remainder of the year to offset commodity inflation
• Continue to invest in brand building
5
Unleash the Power of Power‐of‐One
• Ramping up activity in North America
– Executed cross division basketball‐themed merchandising
– Accelerated local up‐and‐down‐the‐street (UDS) account promotional activity
– Continuing pilots in large format stores
– Introducing PepsiCo coupon insert this summer to jointly promote 20 brands across PepsiCo portfolio
• Continuing to drive initiatives in International
• Making progress but still in early stages of fully realizing potential of Power of One
6

Build and Expand Nutrition Business
• Focusing on innovation and brand architecture to accelerate growth of nutritional segments of snacks and beverage portfolio
– Quaker in Grains
– Tropicana in Fruits and Vegetables
– Gatorade in Sports Nutrition
– Wimm‐Bill‐Dann in Value‐added Dairy
• Nutrition group is approximately 100 R&D and marketing staff with $50 million budget
• Good growth in nutrition segments of snacks & beverage portfolio in Q1
7
Prudent, Responsible Financial Management
• Q1 results in‐line with expectations, with core division operating profit growth of 5%
• Core EPS declined due to higher year‐over‐year interest expense and a higher tax rate, as communicated on Q4 earnings call
• Good visibility into cost outlook for the balance of 2011
• Confidence in pricing and productivity plans and ability to deliver on commitments
8
Chief Financial Officer,PepsiCo
Hugh Johnston
Commodity Inflation & 2011 Outlook
• Inflation impacted beverages more dramatically than snacks in Q1
– Covered some, but not all, of beverage commodity cost inflation with pricing
– Generally able to cover commodity cost inflation in snacks
• Expect commodities to be a headwind for the remainder of the year
• Expect inflation of approximately $1.4 – $1.6 billion on a base of $18 billion of commodity‐based inputs
• Anticipate taking additional pricing on key packages in the second half of 2011 to offset commodity inflation
10
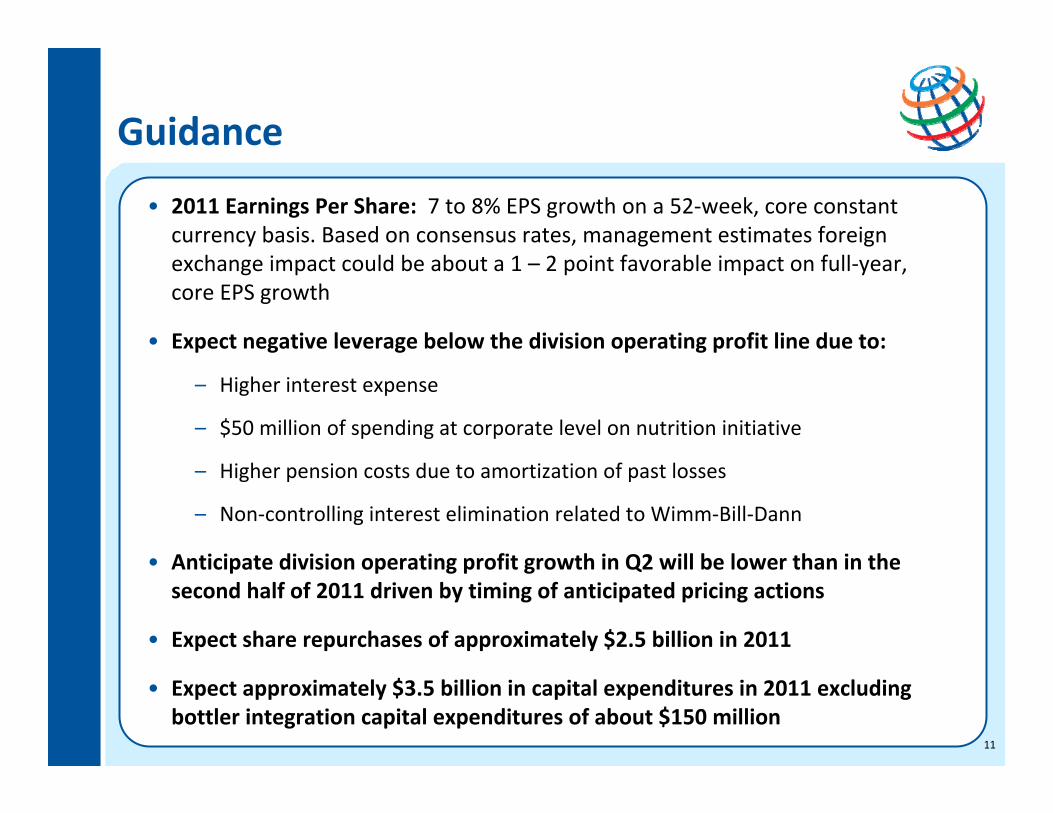
Guidance
• 2011 Earnings Per Share: 7 to 8% EPS growth on a 52‐week, core constant currency basis. Based on consensus rates, management estimates foreign exchange impact could be about a 1 – 2 point favorable impact on full‐year, core EPS growth
• Expect negative leverage below the division operating profit line due to:
– Higher interest expense
– $50 million of spending at corporate level on nutrition initiative
– Higher pension costs due to amortization of past losses
– Non‐controlling interest elimination related to Wimm‐Bill‐Dann
• Anticipate division operating profit growth in Q2 will be lower than in the second half of 2011 driven by timing of anticipated pricing actions
• Expect share repurchases of approximately $2.5 billion in 2011
• Expect approximately $3.5 billion in capital expenditures in 2011 excluding bottler integration capital expenditures of about $150 million
11
Glossary

Glossary of Terms
Financial Terms• Core: Core results are non‐GAAP financial measures which exclude certain non‐core items in all
periods presented. Please refer to the “Investors” section of PepsiCo’s web site at www.pepsico.com under the heading “Investor Presentations” to find disclosure and a reconciliation of any Non‐GAAP financial measures contained herein.
• Constant Currency: Financial results (historical and projected) assuming constant foreign currency exchange rates used for translation based on the rates in effect for the comparable prior‐year period. In addition, the impact on EPS growth is computed by adjusting core EPS growth by the after‐tax foreign currency translation impact on core operating profit growth using PepsiCo’s core effective tax rate.
• Division Operating Profit: The aggregation of the operating profit for each of our reportable segments, which excludes the impact of corporate unallocated expenses.
• Management Operating Cash Flow: Net cash provided by operating activities less capital spending plus sales of property, plant and equipment. This non‐GAAP financial measure is our primary measure used to monitor cash flow performance.
• Management Operating Cash Flow, Excluding Certain Items:Management operating cash flow, excluding certain items: Management operating cash flow, excluding: (1) discretionary pension contributions, (2) restructuring payments in connection with our Productivity for Growth initiative, (3) merger and integration payments in connection with our PBG, PAS and WBD acquisitions, (4) a contribution to The PepsiCo Foundation, (5) capital investments related to the bottling integration, and (6) the tax impacts associated with each of these items, as applicable. See the attached exhibits for a reconciliation of this non‐GAAP financial measure to the most directly comparable financialmeasure in accordance with GAAP (operating cash flow).
• Net Pricing: The combined impact of list price changes, weight changes per package, discounts and allowances.
• Organic: A measure that excludes the impact of acquisitions
13