Climate Change Vulnerability Assessment of Semporna Priority ...

Matsuzaki, S. et al.
Paper:
Evaluation of Seismic Vulnerability of Buildings Based onDamage Survey Data from the 2007 Pisco, Peru Earthquake
Shizuko Matsuzaki∗, Nelson Pulido∗∗, Yoshihisa Maruyama∗,Miguel Estrada∗∗∗, Carlos Zavala∗∗∗, and Fumio Yamazaki∗
∗Graduate School of Engineering, Chiba University1-33 Yayoi-cho, Inage-ku, Chiba 263-8522, Japan
E-mail: [email protected]∗∗National Research Institute for Earth Science and Disaster Prevention, Ibaraki, Japan∗∗∗Japan-Peru Center for Earthquake Engineering Research and Disaster Mitigation,
National University of Engineering, Lima, Peru[Received July 30, 2014; accepted September 9, 2014]
The seismic vulnerability of buildings located in Pisco,Peru, was studied using damage survey data and seis-mic ground motion simulation. Inventory and damageinformation for more than 10,000 buildings was reg-istered in survey data compiled by CISMID at Peru’sNational University of Engineering. The soil classesin the Pisco district were classified into three zonesbased on the predominant periods of microtremors at85 sites, and damage ratios were calculated for eachzone. Surface ground motions in each zone were es-timated on the basis of base-rock motion simulationand shallow soil-column response analysis. Finally,fragility curves for adobe and brick masonry buildingswere derived in terms of PGA and PGV. The resultswere compared with fragility functions developed inother studies.
Keywords: seismic vulnerability, the 2007 Pisco earth-quake, building damage, damage survey
1. Introduction
The Pacific coast of South America is a segment of thecircum-Pacific seismic belt along which a large numberof thrust earthquakes have occurred [1]. Peru is locatedin an area of very high seismic activity. Buildings in dif-ferent countries vary considerably in their materials andconstruction methods and thus in their seismic behavior.To assess earthquake-induced damage, it is necessary toconsider the regional characteristics of buildings. For ex-ample, most mid-rise and low-rise buildings in provincialcities in Peru are constructed of bricks or adobe (air-driedmud brick) [2]. The patterns of collapse of such build-ings are different from those of framed buildings. Res-idential buildings are built by local workers or by theinhabitants themselves, without sufficient knowledge ofengineering. Because of inadequate financial resources,people buy construction materials little by little and addon to the buildings in which they live over the course ofyears [3].
The 2007 Pisco, Peru earthquake occurred off the coastof central Peru on August 15, 2007, at 18:40 local time(23:40 UTC). According to the United States Geologi-cal Survey (USGS), the earthquake had a moment mag-nitude of 8.0. The earthquake caused extensive damage tocities in Ica Region, including Pisco, Chincha, and Ica.Approximately 500 people were killed, and more than90,000 buildings collapsed [4].
This study presents the results of an assessment of theseismic vulnerability of buildings located in Pisco, Peru,conducted using damage survey data and simulated seis-mic ground motions. Fragility curves for adobe and brickmasonry buildings were constructed based on the results.Fragility curves are widely used to predict building dam-age due to earthquakes. Fragility curves have been de-veloped in other studies from statistical analyses of actualdamage data [5–7] and analyses of the seismic capacityof buildings [8–11]. To reflect regional seismic character-istics appropriately in damage assessment, it is necessaryto confirm the validity of the damage evaluation method-ology used. Hence, the fragility curves developed in thisstudy were compared with curves developed in other stud-ies.
2. Damage to Buildings in Pisco, Peru as a Re-sult of the 2007 Earthquake
2.1. Breakdown of Building Types from DamageSurvey Results
The District of Pisco is the capital of Pisco Province,which belongs to the Ica Region of Peru. The district isapproximately 250 km south of Lima, the capital of Peru.The size of the main urban area of Pisco is about 2 km2.Pisco faces the Pacific Ocean and has a desert climate.According to Peru’s National Institute of Statistics and In-formation (INEI), the urban population was estimated tobe 55,000 in 2007 [12]. The district is located 10 to 30 mabove sea level and has a few topographic undulations.The Pisco River runs 2 km north of the town, and there
1050 Journal of Disaster Research Vol.9 No.6, 2014
Evaluation of Seismic Vulnerability of Buildings Based onDamage Survey Data from the 2007 Pisco, Peru Earthquake
Fig. 1. Slip distribution of the 2007 Pisco, Peru earthquakefrom source process by Sladen et al. [13].
are some marshes in the northern part of the town and nearthe coast. The Pisco district was the district most severelyaffected by the August 15, 2007 earthquake, which had aModified Mercalli Intensity (MMI) of IX (USGS).
Ground motion records were not obtained in Pisco andnearby Chincha during this earthquake. Ground motionswere recorded in Lima and Ica and at the Parcona station(PCN) in the Ica region. Fig. 1 shows a slip model ofthe seismic source, and Fig. 2 shows simulated bedrockaccelerations at the city center of Pisco [14]. The recordsfrom Lima and Ica both consist of two distinct sub-events.At PCN, a peak ground acceleration of 484 cm/s2 wasrecorded.
The present authors investigated the building damagesituation soon after the earthquake. A field survey wasconducted by the Japan–Peru Center for Earthquake En-gineering Research and Disaster Mitigation (CISMID) inthe National University of Engineering (UNI). A total of12,000 building lots in the Pisco district were surveyed.The occupancy category, number of stories, structuraltype, and damage level were recorded for 10,480 build-ing lots. Building damage was analyzed statistically byZavala et al. [15] and Matsuzaki et al. [16]. More than40 investigators were employed to conduct the field sur-vey, which took almost three months to complete.
According to the survey, most of the structures werelow-rise buildings; 72% were one-story buildings, and23% were two-story buildings. The tallest building, whichwas six stories, was used as a hotel. Of the brick ma-sonry buildings, 65% were one story, 29% were two sto-ries, 5.3% were three stories, and 0.4% were four or morestories. Of the adobe buildings, in contrast, 99% were onestory. Overall, the central part of Pisco district was foundto be densely built-up with low-rise buildings. Roofs weremostly flat; roof tile was not typically used because of thedesert climate of the region. In terms of building occu-
0 50 100 150 200−200
0
200
EW
, cm
/s2
Acceleration 003
162.4
0 50 100 150 200−200
0
200
NS
, cm
/s2
211
0 50 100 150 200−200
0
200
UD
, cm
/s2
sec
88.3
Fig. 2. Simulated bedrock accelerations at city center of Pisco.
pancy, 75% were residential, 7% were commercial, andthe others were schools, hospitals, factories, and buildingsused for other purposes.
Most of the buildings in Pisco were masonry: 16%were adobe masonry, and 71% were burned brick ma-sonry. The other 13% were reinforced concrete (RC),Quincha, or mixed structures. Adobe houses can be foundin almost every part of the world; however, their construc-tion methods and seismic performance vary from regionto region. In the rural areas of Peru, adobe blocks are typ-ically made by buildings’ inhabitants, and in urban areas,ready-made adobe blocks are sold at do-it-yourself homecenters. Quincha (a Kechua word pronounced “kincha”)is a type of construction that is traditional in South Amer-ica and employs panels supported by wooden frames andcane-and-mud walls [17]. A few of the RC buildingssurveyed were commercial buildings, such as banks andsmall hotels.
In Peru, the national building seismic code covers bothbrick masonry (under E.070) and adobe structures (un-der E.080) [18]. Most Peruvian brick masonry structuresare known as confined masonry. These structures haverelatively high horizontal stiffness because concrete slabsand RC columns and beams are often used. The cross-sectional areas of the RC columns are usually greater than25 cm2, unlike RC columns used for similar purposes inother countries, such as Indonesia [3]. On the other hand,adobe structures with mud-and-bamboo roofs are highlyvulnerable to earthquakes [2].
2.2. Extent of Building DamageDuring the survey, building damage levels were classi-
fied into four grades, namely, No damage, Slight damage,Moderate damage, and Severe damage. The definitions ofthe damage levels and their relationship to the EuropeanMacroseismic Scale (EMS) 1998 [19] damage categoriesare shown in Table 1. Slight damage is manifested as re-pairable small cracks on the finishing walls. Severe dam-
Journal of Disaster Research Vol.9 No.6, 2014 1051
Matsuzaki, S. et al.
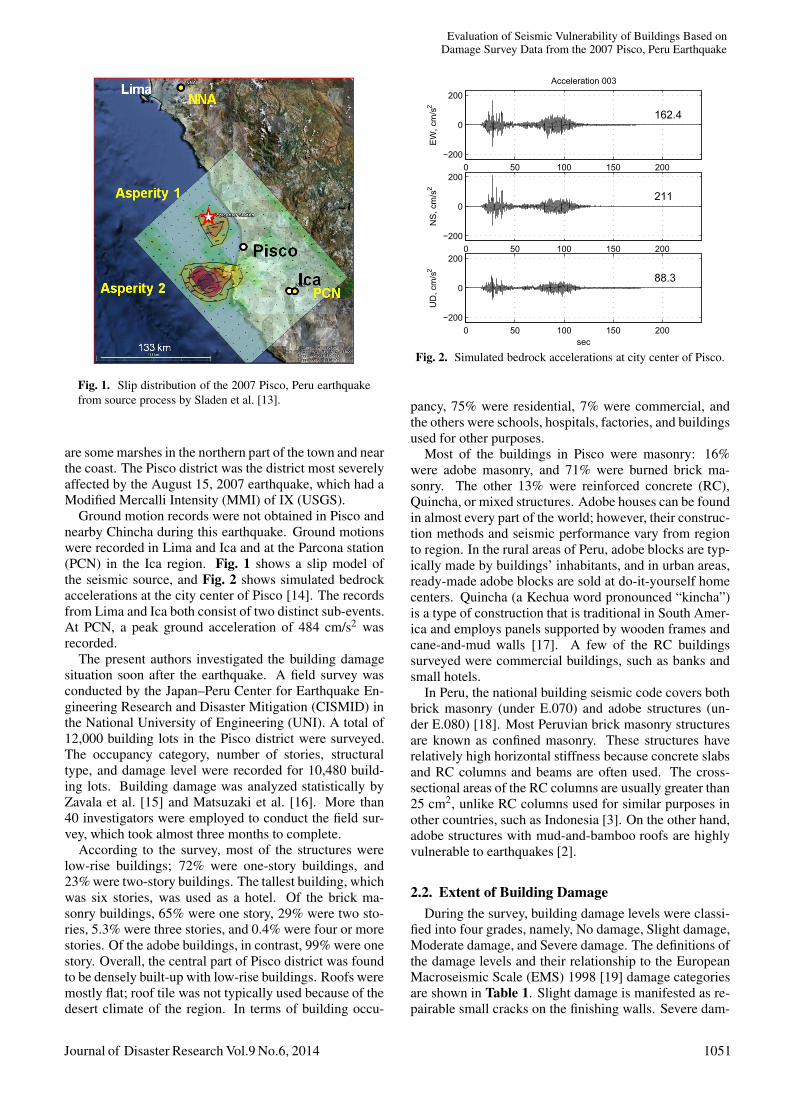
Table 1. Description of damage classifications used inthe survey by CISMID and corresponding damage levels inEMS 1998.
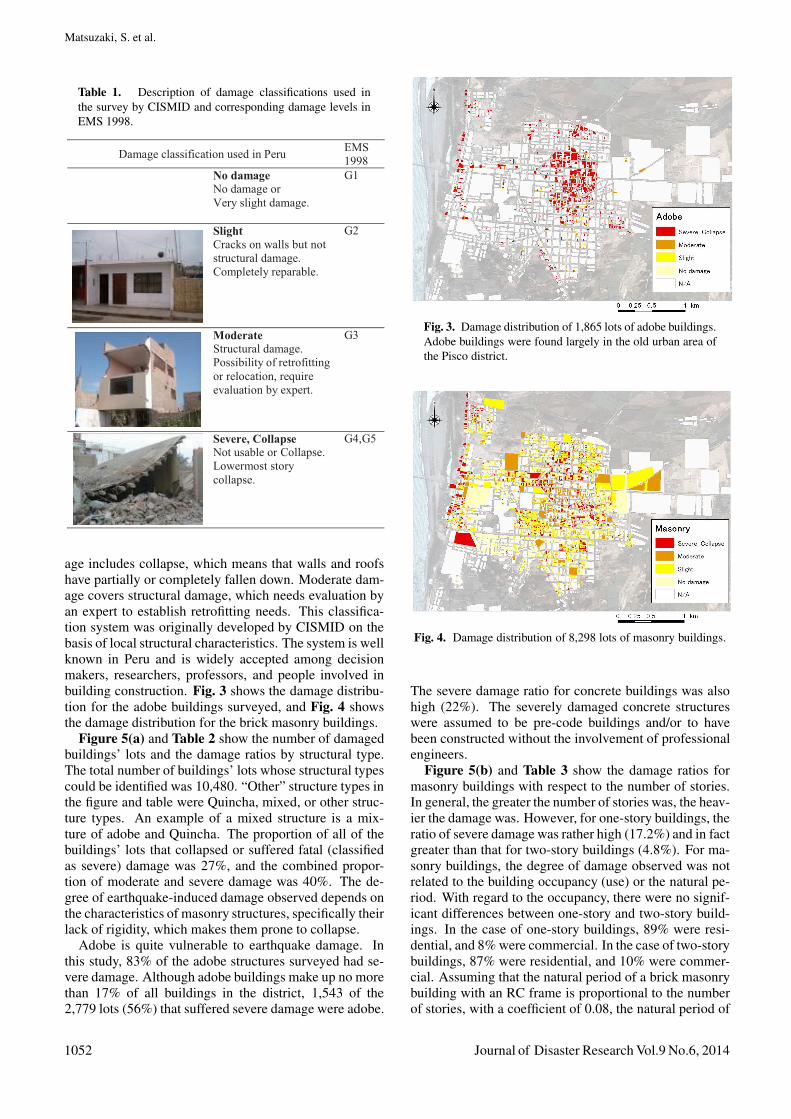
age includes collapse, which means that walls and roofshave partially or completely fallen down. Moderate dam-age covers structural damage, which needs evaluation byan expert to establish retrofitting needs. This classifica-tion system was originally developed by CISMID on thebasis of local structural characteristics. The system is wellknown in Peru and is widely accepted among decisionmakers, researchers, professors, and people involved inbuilding construction. Fig. 3 shows the damage distribu-tion for the adobe buildings surveyed, and Fig. 4 showsthe damage distribution for the brick masonry buildings.
Figure 5(a) and Table 2 show the number of damagedbuildings’ lots and the damage ratios by structural type.The total number of buildings’ lots whose structural typescould be identified was 10,480. “Other” structure types inthe figure and table were Quincha, mixed, or other struc-ture types. An example of a mixed structure is a mix-ture of adobe and Quincha. The proportion of all of thebuildings’ lots that collapsed or suffered fatal (classifiedas severe) damage was 27%, and the combined propor-tion of moderate and severe damage was 40%. The de-gree of earthquake-induced damage observed depends onthe characteristics of masonry structures, specifically theirlack of rigidity, which makes them prone to collapse.
Adobe is quite vulnerable to earthquake damage. Inthis study, 83% of the adobe structures surveyed had se-vere damage. Although adobe buildings make up no morethan 17% of all buildings in the district, 1,543 of the2,779 lots (56%) that suffered severe damage were adobe.
Fig. 3. Damage distribution of 1,865 lots of adobe buildings.Adobe buildings were found largely in the old urban area ofthe Pisco district.
Fig. 4. Damage distribution of 8,298 lots of masonry buildings.
The severe damage ratio for concrete buildings was alsohigh (22%). The severely damaged concrete structureswere assumed to be pre-code buildings and/or to havebeen constructed without the involvement of professionalengineers.
Figure 5(b) and Table 3 show the damage ratios formasonry buildings with respect to the number of stories.In general, the greater the number of stories was, the heav-ier the damage was. However, for one-story buildings, theratio of severe damage was rather high (17.2%) and in factgreater than that for two-story buildings (4.8%). For ma-sonry buildings, the degree of damage observed was notrelated to the building occupancy (use) or the natural pe-riod. With regard to the occupancy, there were no signif-icant differences between one-story and two-story build-ings. In the case of one-story buildings, 89% were resi-dential, and 8% were commercial. In the case of two-storybuildings, 87% were residential, and 10% were commer-cial. Assuming that the natural period of a brick masonrybuilding with an RC frame is proportional to the numberof stories, with a coefficient of 0.08, the natural period of
1052 Journal of Disaster Research Vol.9 No.6, 2014

Evaluation of Seismic Vulnerability of Buildings Based onDamage Survey Data from the 2007 Pisco, Peru Earthquake
82.7%
13.4%22.2%
40.3%26.5%
9.4%
15.5%
37.0%12.1%
14.4%
5.6%
31.2%
14.8% 27.9%
26.5%
2.2%
39.9%25.9% 19.7%
32.6%
Adobe Brick Masonry
Concrete Others All Type
Dam
age
Ratio
1865 8298 27 290 10480 Lots
Fig.2
Fig.5 (b)
Fig.10 (b)
17.2%4.8% 7.4%
24.2%
11.7%20.5%
30.3%
33.9%30.7% 33.2%29.0%
22.6%40.3% 41.5% 33.3%
19.4%
0%
20%
40%
60%
80%
100%
1-story 2-story 3-story 4 or more
Dam
age
Ratio
No Damage
Slight
Moderate
Severe, Collapse
5370 2391 435 62 Lots
(a) Damage by structural type (b) Masonry damage by number of stories
Fig. 5. (a) Building damage ratio by structure type and (b) damage ratio of masonry buildings by number of stories.
Table 2. Number of damaged building lots by structure type.
Adobe Brick masonry Concrete Others TotalNo damage 41 3,315 7 57 3,420Slight 105 2,586 4 81 2,776Moderate 176 1,284 10 35 1,505Severe, Collapse 1,543 1,113 6 117 2,779Total (Lots) 1,865 8,298 27 290 10,480
Table 3. Number of damaged building lots by number of stories for 8252 brick masonry buildings.
1-story 2-story 3-story 4 or more TotalNo damage 2,165 993 145 12 3,315Slight 1,651 794 126 14 2,585Moderate 631 490 132 21 1,274Severe, Collapse 923 114 32 15 1,084Total (Lots) 5,370 2,391 435 62 8,258
two-story buildings is around 0.16 s, and that of a one-story building is less than 0.10 s. Because the predom-inant periods of the acceleration response spectra of thesimulated bedrock motion were between 0.2 s and 1.0 s,resonance was not the cause of the damage observed inthe one-story buildings.
Other factors in the amount of damage seen may bethe structural specifications of masonry buildings. In gen-eral, two-story masonry buildings in Peru have reinforce-ment members, such as RC beams and columns, and con-crete slabs, and thus they have a certain amount of seis-mic resistance. On the other hand, some one-story ma-sonry buildings are not reinforced with RC members. Inthe construction of confined masonry buildings, walls areoften constructed prior to columns, and hence the bondstrength between brick walls and columns is great. Thus,RC column members can transmit their seismic resistanceto foundations [20].
Besides, RC slabs do increase floor rigidity, and henceall the walls of a given story bear the shear force on thatstory. Consequently, the seismic capacity of the build-ing as a whole is increased. Fig. 6(a) shows the exteriorof a reinforced masonry building in Peru for which somecolumns and an RC slab can be seen. Fig. 6(b) shows an
indoor view of an unreinforced masonry building withoutRC elements. The walls are made of bricks, but the roofis made of bamboo covered by mud.
Figure 7 shows the spatial distribution of damage ratiosfor masonry buildings with moderate or severe damage orcollapse, with respect to the city block. The Pisco districtwas divided into 183 blocks, each of which had at least30 masonry buildings. Regional differences are evident inthe damage ratios: significant damage occurred in the areaalong the coast and in the old urban area near the mainsquare, as also shown in [21]. The ages of the buildingsare unknown; however, masonry buildings do not sufferfrom degradation over time due to decay or ants, unlikewooden Japanese houses [22]. Differences in ground mo-tion intensity due to soil differences are believed to beamong the reasons for the differences observed in thedamage distribution.
3. Microzoning and Seismic Ground Motions
3.1. Seismic Microzoning Using Microtremors
According to the results of several standard penetrationtests (SPTs) conducted by CISMID, hard soil with gravel
Journal of Disaster Research Vol.9 No.6, 2014 1053

Matsuzaki, S. et al.
(a) Reinforced brick ma-sonry (RM)
(b) Unreinforced brick ma-sonry (URM)
Fig. 6. (a) Exterior view of reinforced masonry buildingwith RC frame in Peru and (b) indoor damage state of one-story unreinforced masonry (URM) building without RC el-ements. The URM building has a roof of bamboo coveredby mud.
Fig. 7. Spatial distribution of moderate or greater damageratio for masonry buildings by city block. Each block wasdivided to include at least 30 masonry buildings.
can be found around the Pisco district below the shallowsurface soil layer. Near the coast, the groundwater tableis high, and liquefaction due to the earthquake was ob-served. From 2007 to 2011, CISMID and Johansson et al.conducted microtremor measurements at 73 sites in thePisco area [23]. In 2012, 12 new sites, including three atwhich array measurements were conducted, were addedto the set of microtremor measurement sites.
Nakamura proposed that the H/V (horizontal-to- ver-tical) spectral ratio of microtremors could be consideredthe spectral amplification ratio of subsurface soil layersat a given site [24, 25]. Fig. 8 shows the locations ofthe 85 sites at which microtremor measurements weremade, along with peak periods of the H/V spectra andthe spatially interpolated H/V peak periods. Using the in-verse distance-weighted method [26], interpolation of thepeak periods was performed by averaging the data from12 nearby points. The target area was divided into threezones, 1 to 3. Darker colors indicate longer peak periodsof the sites.
Fig. 8. Location of three MASW/array measurements andresults of spatial interpolation of H/V ratio of single-pointmicrotremor for 85 peak periods, using the inverse distanceweighted method.
The ground was estimated to be firm if the peak pe-riod of the H/V ratio was less than 0.1 s. The peak periodof Zone 1 was between 0.04 and 0.07 s, that of Zone 2was between 0.07 and 0.10 s, and that of Zone 3 was be-tween 0.10 and 0.14 s. The northwestern part of the areais classified as relatively soft ground (Zone 3), and thesoutheastern part is firm ground (Zone 1).
Following the microzoning based on microtremors, thedamage ratios shown in Fig. 9 for adobe and brick ma-sonry buildings were obtained. For 8,298 lots of masonrybuildings, the damage ratios for both severe damage andmoderate or greater damage were higher for softer soils(from Zone 1 to Zone 3). Similarly, for 1,865 lots ofadobe buildings, firmer soils had lower damage ratios forall damage levels. The building damage ratio appears tobe related to the soil classification through the peak pe-riod of the H/V ratio of microtremors, for both adobe andmasonry structures in Pisco.
3.2. One-Dimensional Soil Response Analysis UsingSimulated Bedrock Motion
Using synthetic aperture radar (SAR) interferometrydata and teleseismic waveforms, the source model for thePisco earthquake was constructed to reproduce the near-source strong ground motion recordings measured at theNana (NNA) and PCN stations and shown in Fig. 1. Theearthquake motions at the depth of the seismic bedrock(Vs = 3,260 m/s) were obtained by numerical simula-tion [14].
To estimate the seismic ground motions during thePisco earthquake, the soil profiles at points P1, P2, andP3 in the three zones, shown in Fig. 8, were used. Multi-channel analysis of surface waves (MASW) of the P1 sitedata, measured in relatively firm soil, was carried out in2007. Array microtremor measurements were also carriedout in 2012 at the P2 and P3 sites, in moderately soft andsoft soils. The shear-wave velocity profiles at the threesites, up to GL-1,200 m, were estimated from an inver-sion between the phase velocity and the period, as shown
1054 Journal of Disaster Research Vol.9 No.6, 2014

Evaluation of Seismic Vulnerability of Buildings Based onDamage Survey Data from the 2007 Pisco, Peru Earthquake
(a) Adobe
(b) Brick masonry
Zone 1 Zone 2 Zone 3
Dam
age
Ratio
425 852 588 Lots
Zone 1 Zone 2 Zone 3
Dam
age
Ratio
1729 4025 2544 Lots
Fig. 9. Damage ratios by soil zone classification for(a) adobe buildings and (b) brick masonry buildings.
in Fig. 10. The soil profiles at the three sites were as-sumed to have a common soil structure at depths greaterthan GL-400 m.
The transfer functions and ground motions at the sur-face were derived from the results of a one-dimensionallayered soil response analysis conducted using EERA,which is a version of the SHAKE program for MicrosoftExcel developed by Bardet et al. [27]. Using as inputthe ground motion simulated by Pulido et al. (2013) atthe outcrop base rock, one-dimensional (1D) equivalentlinear seismic response analyses were performed. Strain-dependent nonlinearity of the soil was considered only forthe uppermost layer. The clay model in EERA was usedas the material type for the stress–strain and damping–strain curves. The default value for clay [28] was used forthe modulus of the top layer. The ratio of the effective tothe maximum shear strain was assumed to be 0.65.
The predominant periods of the transfer functions wereapproximately 0.07 s for P1 (Zone 1), 0.21 s for P2(Zone 2), and 0.23 s for P3 (Zone 3). The simulatedbedrock motions were available for these three points.The maximum ground surface acceleration and velocity(PGA and PGV) for each zone are summarized in Table 4.The resultant of the two horizontal components was alsoobtained for the three locations.
Zone 1
Zone 2
Zone 3
(a)
(b)
P1 (Zone 1) P2 (Zone 2) P3 (Zone 3)Depth(m)
Vs(m/s)
Depth(m)
Vs(m/s)
Depth(m)
Vs(m/s)
0 - 2 2300 - 7 164
0 - 4 952 - 7 520 4 - 12 3707 - 13 840 7 - 8 336 12 - 200 585
13 - 400 1020 8 - 400 981 200 - 400 700400 - 700 1500 400 - 700 1500 400 - 700 1500700 - 1200 2600 700 - 1200 2600 700 - 1200 26001200 - ∞ 3260 1200 - ∞ 3260 1200 - ∞ 3260
Fig. 10. (a) Comparison of shear-wave velocity profilesamong three measurement sites, P1 (Zone 1), P2 (Zone 2),and P3 (Zone 3), up to GL-30 m, and (b) up to GL-3,000 m.
Table 4. Maximum ground surface acceleration and veloc-ity from one-dimensional response analysis for three zones.
Site EW NSResultant
vector
PGA(cm/s2)
Zone 1 (Hard) 331.9 441.6 552.4Zone 2 523.0 365.8 554.4Zone 3 (Soft) 576.9 461.2 611.1
PGV(cm/s)
Zone 1 (Hard) 60.4 75.9 94.4Zone 2 64.1 81.0 99.5Zone 3 (Soft) 84.7 94.3 113.8
4. Development of Fragility Curves and Com-parison with Curves from Previous Studies
4.1. Development of Fragility CurvesFragility curves for adobe and masonry structures were
constructed from the relationship between the damage ra-tio and the peak ground motion values (PGA and PGV).Assuming a log-normal distribution for the probability ofdamage occurrence greater than or equal to rank R, the cu-mulative probability PR(x) for a peak ground motion valuex is expressed by the following equation:
PR(x) = Φ ((lnx−λ )/ζ ) . . . . . . . . . (1)
where Φ is the standard normal distribution and λ and ζare the logarithmic mean and logarithmic standard devia-tion of lnx, respectively. The values of these terms wereobtained by regression analysis using log-normal proba-bility paper.
Journal of Disaster Research Vol.9 No.6, 2014 1055

Matsuzaki, S. et al.
Table 5. Coefficients of fragility curves for adobe and masonry buildings in Pisco.
Damage GradePGA PGV
λ ζ R2 λ ζ R2
AdobeModerate or greater -0.785 0.171 0.559 4.280 0.242 0.787Severe, Collapse -0.710 0.184 0.490 4.393 0.253 0.727
MasonryModerate or greater -0.413 0.223 0.614 4.828 0.355 0.608Severe, Collapse -0.285 0.223 0.898 5.033 0.355 0.994
The results of the regression analysis are shown in Ta-ble 5. According to Fig. 9(b), the damage ratios associ-ated with slight or greater damage in Zone 1 were higherthan those in Zone 2, while the PGA and PGV in Zone 1were smaller than those in Zone 2. Therefore, a reason-able fragility function for slight or greater damage wasnot obtained in this study. As the regression for moder-ate or greater damage for masonry buildings had signifi-cant variation in the data around the regression line, the ζvalue obtained for the severe damage state was assumedfor this damage state as well.
4.2. Comparison of Fragility Curves for AdobeBuildings
The fragility curves obtained as described above werecompared with fragility curves obtained in previous stud-ies in terms of PGA using the capacity spectrum method.The curves developed in previous studies applied to typ-ical building types in a particular country or region. Inaddition, the demand spectrum for each case was the onefor an assumed earthquake scenario. In the previous de-velopment of fragility curves, the spectral displacement(Sd) or the spectral acceleration (Sa) was often used as anintensity measure, rather than the MMI seismic intensityor the PGA.
Tarque et al. derived fragility curves for one-storyadobe dwellings in Cusco, Peru [9] as a function of PGA,based on an acceleration response spectrum for a seismicmotion scenario. The fragility curves for conditions de-noted by LS4 (near collapse or collapse) and LS3 (life-safety) were considered to correspond to the severe dam-age and moderate or greater damage levels, respectively,in the present study.
Figure 11 shows a comparison between the curvesfor Cusco and Pisco. The comparison suggests that thefragility curves for adobe in Pisco are similar to those foradobe in Cuzco, especially for the severe damage level.The damage ratio for Pisco is slightly lower than that ofCuzco, but the slope of the curve is steep. For both curves,the damage ratios for moderate or greater damage exceed90% for PGA values of 0.6 g. The seismic performanceof adobe buildings in Cuzco, as evaluated by Tarque etal. [9], is similar to that observed in this study.
4.3. Comparison of Fragility Curves for MasonryBuildings
The fragility curves for brick masonry structures inPisco were compared with those for RM2L lifeline build-
Prob
abili
ty o
f Dam
age
(%)
PGA (g)
Adobe
Adobe, PiscoModerateor greaterSerious,Collapse
Tarque et al. (2012)Life-safetyNear or collapse
Fig. 11. Comparisonoffragilitycurvesobtainedinthisstudy-for buildings in Pisco with those obtained by Tarque et al. [9]for buildings in Cusco.
ings in HAZUS and URM (unreinforced masonry) inIstanbul (developed by Erberik [10, 11]), as shown inFig. 12. It is reasonable to assume that pre-code build-ings in HAZUS correspond to non-conforming buildingsunder the present Peruvian building code regulations.
HAZUS-MH MR3 [8] is a standard multi-hazard toolfor loss estimation due to seismic motion and ground fail-ure for buildings, transportation systems, and lifeline fa-cilities. The fragility curves of lifeline buildings are ex-pressed as a function of an equivalent PGA. From amongthe lifeline building types, the low-rise RM2L (one- tothree-story reinforced masonry bearing walls with precastconcrete diaphragms) was selected for comparison, basedon its similarity to the types of building structures found inPisco. However, it is not as clear whether masonry bear-ing walls in HAZUS are similar to certain types of struc-tures found in Peru, such as confined masonry buildings.“Masonry” refers broadly to a construction method basedon layers using stone, brick, concrete block (CB), etc. Thecategory of masonry includes various types of structures,such as brick masonry reinforced with a light-gauge steelframe [29]. The results of the comparison suggest thatthe brick masonry buildings in Pisco are much more vul-nerable than RM2L buildings in HAZUS. This may bebecause HAZUS deals with other structural specificationsthan those considered in this study. As described previ-ously, masonry buildings in HAZUS might include notonly brick masonry but also CB.
1056 Journal of Disaster Research Vol.9 No.6, 2014

Evaluation of Seismic Vulnerability of Buildings Based onDamage Survey Data from the 2007 Pisco, Peru Earthquake
0%
20%
40%
60%
80%
100%
Prob
abili
ty o
f Dam
age
(%)
PGA (g)
Masonry (Reinforced/Unreinforced)
RM, PiscoModerateor greater
URM, Erberik (2010)Moderate
RM, HAZUSPre-CodeExtensive
Serious,Collapse
Severe, Collapse Pre-CodeComplete
Fig. 12. Comparison of fragility curves (RM) for one- totwo-story reinforced brick masonry buildings in Pisco withthose (RM2L) for one- to three-story reinforced masonrybearing walls with precast concrete diaphragms in lifelinebuildings in HAZUS [8] and those (URM) for one-story un-reinforced regular buildings with solid brick walls in Istanbulobtained by Erberik [10, 11].
The study by Erberik [10, 11] addressed one-story un-reinforced brick buildings with well-formed plans in Is-tanbul, Turkey. The brick masonry buildings consideredin the present study were mainly one- to three-story build-ings, and the two structural types are different. With re-spect to materials, brick masonry buildings in Istanbul aremade of solid brick, whereas in Pisco, the walls on thesecond floor of a brick masonry building are made of per-forated brick, and those on the ground floor are made ofsolid brick. Compared to the fragility curves for brickmasonry in Istanbul, the fragility curves developed in thisstudy indicate that the damage that occurs in confined ma-sonry in Pisco (in one- and two-story buildings) starts tooccur at a larger PGA value than in one-story unreinforcedmasonry in Istanbul but exhibits higher damage ratios atlarger PGA values. The slopes of the fragility curves de-veloped in this study were steeper than those developedin previous studies. The damage ratios for masonry build-ings after the Pisco earthquake were smaller than thoseestimated using the fragility functions developed by Er-berik [10, 11].
The results of the comparison of the damage ratiosfor structural types in Pisco indicate that more than 80%of adobe buildings suffered severe damage at a PGA of0.6 g. The damage ratio for masonry buildings, for thesame seismic excitation level, was 15%. The two fragilitycurves exhibit a clear difference in performance by struc-tural type. The slopes of the adobe fragility curves aresteeper than those of the masonry fragility curves, whichsuggests that just a small increase in the ground motionwill result in serious damage in adobe. In other words, for
adobe, the difference between the ground motion that pro-duces moderate or greater damage and the ground motionthat produces severe damage is small. This observationis consistent with the fact that adobe buildings are likelyto exhibit significant damage suddenly and suffer brittlefailure.
5. Conclusions
In this study, relationships between peak ground mo-tion indices and building damage caused by the 2007Pisco, Peru earthquake were investigated using damagesurvey data collected in the Pisco district and simulatedground motion records. Approximately 80% of the adobebuildings in the survey area suffered from serious damage,such as collapse, as a result of the earthquake. In contrast,the ratio of serious damage for brick masonry buildingswas only approximately 13%. The extent of the damageobserved varied widely, depending on the structural prop-erties of the buildings surveyed, such as the presence orabsence of concrete reinforcing members.
The subsurface soils in the area of Pisco were dividedinto three zones based on the predominant periods of mi-crotremors measured at 85 sites. The relationship be-tween a site’s ground conditions and the damage ratio foreach zone was confirmed. Compared to fragility func-tions derived by analytical methods in previous studies,the means and standard deviations for adobe structures inPisco were quite similar to those for structures in Cusco.For brick masonry, the means in Istanbul and Pisco weresimilar, but within the range of ground motion of the Piscoearthquake (0.56 to 0.65 g), the damage ratio in Istanbulwas 20% larger than in Pisco.
The damage survey conducted in Pisco covered a smallarea of only 2 km2. The estimated ground motions exhib-ited no significant differences. It would be preferable toverify the reliability of the damage ratios determined us-ing data from lower-damage-ratio areas for adobe struc-tures and data from higher-damage-ratio areas for ma-sonry buildings. In this study, one-story brick masonrybuildings in Pisco were found to be a mixture of goodand poor structures in terms of their seismic performance.Through a detail survey of floor specifications and withinformation on the proportion of unreinforced buildings,it might be possible to further validate the relationship be-tween the structure type and degree of damage.
AcknowledgementsThe authors are grateful to Prof. Hiroaki Yamanaka and Dr. Ko-suke Chimoto of the Tokyo Institute of Technology and Mr. Fer-nando Lazares of UNI for their support during the array measure-ments in Pisco.
References:[1] F. Yamazaki and C. Zavala, “SATREPS project on enhancement
of earthquake and tsunami disaster mitigation technology in Peru,”Journal of Disaster Research, Vol.8, No.2, pp. 224-234, 2013.
Journal of Disaster Research Vol.9 No.6, 2014 1057

Matsuzaki, S. et al.
[2] M. Blondet, J. Vargas, and N. Tarque, “Observed behaviour ofearthen structures during the Pisco (Peru) earthquake of August 15,2007,” Proc. of the 14th World Conf. on Earthquake Engineering,No.01-1031, 2008.
[3] T. Narafu, H. Imai, S. Matsuzaki, K. Sakoda, F. Matsumura, Y.Ishiyama, and A. Tasaka, “Basic study for bridge between engi-neering and construction practice of non-engineered houses,” Proc.of the 14th World Conf. on Earthquake Engineering, S18-003, 2008.
[4] A. S. Elnashai, H. J. Alva, O. Pineda, O. Kwon, Y. L. Moran,G. Huaco, and G. Pluta, “The Pisco-Chincha earthquake of Au-gust 15, 2007 seismological, geotechnical, and structural assess-ments,” MAE Center Report 08-01, Mid-America Earthquake Cen-ter, Civil and Environmental Engineering Department, Universityof Illinois at Urbana – Champaign, IL, 2008.
[5] O. Murao and F. Yamazaki, “Development of fragility curves forbuildings based on damage data due to the Hyogoken-nanbu earth-quake,” Proc. of the Asian-Pacific Symposium on Structural Relia-bility and Its Applications, pp. 259-269, 1999.
[6] K. Jaiswal, D. Wald, and D. D’Ayala, “Developing empirical col-lapse fragility functions for global building types,” EarthquakeSpectra, Vol.27, No.3, pp. 775-795, 2011.
[7] U. Hancilar, F. Taucer, and C. Corbane, “Empirical fragility func-tions based on remote sensing and field data after the 12 Jan-uary 2010 Haiti earthquake,” Earthquake Spectra, Vol.29, No.4,pp. 1275-1310, 2013.
[8] Federal Emergency Management Agency (FEMA), Multi-hazardLoss Estimation Methodology Earthquake Model (HAZUS-MHMR3), DC, 2003.
[9] N. Tarque, H. Crowley, R. Pinho, and H. Varumd, “Displacement-based fragility curves for seismic assessment of adobe buildings inCusco, Peru,” Earthquake Spectra, Vol.28, No.2, pp. 759-794, 2012.
[10] M. A. Erberik, “Generation of fragility curves for Turkish masonrybuildings considering in-plane failure modes,” Earthquake Engi-neering Structural Dynamics, Vol.37, pp. 387-405, 2008.
[11] M. A. Erberik, “Seismic risk assessment of masonry buildings inIstanbul for effective risk mitigation,” Earthquake Spectra, Vol.26,No.4, pp. 967-982, 2010.
[12] National Institute of Statistic and Informatics (INEI), Census 2007,2007.
[13] A. Sladen, H. Tavera, H. Simons, J. P. Avouac, A. O. Konca, H.Perfettini, L. Audin, E. J. Fielding, F. Ortega, and R. Cavagnoud,“Source model of the 2007 Mw 8.0 Pisco, Peru earthquake: Impli-cations for seismogenic behavior of subduction megathrusts,” Jour-nal of Geophysical Research, Vol.115, B02405, 2010.
[14] N. Pulido, H. Tavera, Z. Aguilar, S. Nakai, and F. Yamazaki,“Strong motion simulation of the M8.0 August 15, 2007, Piscoearthquake; Effect of a multi-frequency rupture process,” Journalof Disaster Research, Vol.8, No.2, pp. 235-242, 2013.
[15] C. Zavala, M. Estrada, L. Chang, L. Cardenas, J. Tayra, L. Con-islla, and G. Guibovich, “Behavior of non-engineered houses dur-ing Pisco earthquake 15/8/2007,” Proc. of the 14th World Conf. onEarthquake Engineering, S18-031, 2008.
[16] S. Matsuzaki, F. Yamazaki, M. Estrada, and C. Zavala, “Visual dam-age interpretation of buildings using QuickBird images followingthe 2007 Peru earthquake,” Proc. of the third Asia Conf. on Earth-quake Engineering, ACEE-P-067, 2010.
[17] U. S. Tejada and Buena tierra, “apuntes para el diseno y con-struccion con adobe,” CIDAP, pp. 169, 2010 (in Spanish).
[18] Ministry of Housing, Construction and Sanitation, Peru, NationalBuilding Code (Las Normas del Reglamento Nacional de Edifica-ciones), E.070 Brick Structure, E.080 Adobe Structure, 2012 (inSpanish).
[19] European Macroseismic Scale 1998 (EMS-98), European Seis-mological Commission, G. Grunthal (editor), Luxembourg, 1998,http://www.franceseisme.fr/EMS98 Original english.pdf [accessedJul. 28, 2014]
[20] M. Astroza, O. Moroni, S. Brzev, and J. Tanner, “Seismic perfor-mance of engineered masonry buildings in the 2010 Maule earth-quake,” Earthquake Spectra, Vol.28, pp. S385-S406, 2012.
[21] M. Matsuoka and M. Estrada, “Development of earthquake-inducedbuilding damage estimation model based on ALOS/PALSAR ob-serving the 2007 Peru earthquake,” Journal of Disaster Research,Vol.8, No.2, pp. 346-355, 2013.
[22] Y. Onishi and Y. Hayashi, “Fragility curves for wooden houses con-sidering aged deterioration of the earthquake resistance,” Proc. ofthe 14th World Conf. on Earthquake Engineering, S12-028, 2008.
[23] J. Johansson, P. Mayorca, T. Torres, and E. Leon, Reconnaissanceteam by Japan Society of Civil Engineers (JSCE), Japan Associa-tion for Earthquake Engineering (JAEE) and University of Tokyo,“A reconnaissance report on the Pisco, Peru earthquake of Au-gust 15, 2007,” 2007, http://www.jsce.or.jp/report/45/content.pdf[accessed Jul. 28, 2014].
[24] Y. Nakamura, “A method for dynamic characteristics estimationof subsurface using microtremor on the ground surface,” Rail-way Technical Research Institute, Quarterly Reports, Vol.30, IssueNumber 1, pp. 25-33, 1989.
[25] Y. Nakamura, “Clear identification of fundamental idea of Naka-mura’s technique and its applications,” Proc. of the 12th WorldConf. on Earthquake Engineering, pp. 2656, 2000.
[26] D. F. Watson and G. M. Philip, “A refinement of Inverse DistanceWeighted interpolation,” Geo-processing, Vol.2, pp. 315-327, 1985.
[27] J. P. Bardet, K. Ichii, and C. H. Lin, “EERA; A computer pro-gram for Equivalent-linear Earthquake site Response Analyses oflayered soil deposits,” Department of Civil Engineering, Universityof Southern California, CA, 2000.
[28] J. I. Sun, R. Golesorkhi, and H. B. Seed, “Dynamic moduli anddamping ratios for cohesive soils,” Report No. UCB/EERC-88/15,Earthquake Engineering Research Center, University of California,Berkeley, 42p., 1988.
[29] B. Mansouri, M. Ghafory-Ashtiany, K. Amini-Hosseini, R. Nour-jou, and M. Mousavie, “Building seismic loss model for Tehran,”Earthquake Spectra, Vol.26, No.1, pp. 153-168, 2010.
Name:Shizuko Matsuzaki
Affiliation:Project Researcher, Department of Urban Envi-ronment System, Graduate School of Engineer-ing, Chiba University
Address:1-33 Yayoi-cho, Inage-ku, Chiba 263-8522, JapanBrief Career:2013 Dr. Eng., Chiba University2013 Project Researcher, Chiba UniversitySelected Publications:• “Visual damage interpretation of buildings using QuickBird imagesfollowing the 2007 Peru earthquake,” Proc. of the third Asia Conf. onEarthquake Engineering, ACEE-P-067, 2010.Academic Societies & Scientific Organizations:• Architectural Institute of Japan (AIJ)• Institute of Social Safety Science (ISSS)• Japan Association for Earthquake Engineering (JAEE)
1058 Journal of Disaster Research Vol.9 No.6, 2014