
Pamela Cantrell, PI Leigh Smith, Co-PI Charles Graham, Co-PI Jacque Ewing-Taylor, Evaluator A...
21
Pamela Cantrell, PI Leigh Smith, Co-PI Charles Graham, Co-PI Jacque Ewing-Taylor, Evaluator A Brigham Young University Partnership Project
-
Upload
amelia-washington -
Category
Documents
-
view
219 -
download
0
Transcript of Pamela Cantrell, PI Leigh Smith, Co-PI Charles Graham, Co-PI Jacque Ewing-Taylor, Evaluator A...
Pamela Cantrell, PILeigh Smith, Co-PICharles Graham, Co-PIJacque Ewing-Taylor, EvaluatorA Brigham Young University Partnership Project
Increase participants’ understanding of content and inquiry ◦ PLUS Factors: Technology, Assessment &
Differentiated Instruction Transfer new understanding into
participants’ classroom practice Increase student achievement scores on
state science test
Collaborated with development team◦ 2 Science Education Professors◦ 2 Science Professors (Integrative Biology &
Geology)◦ 1 Instructional Technology Professor◦ Reps from 3 BYU Partnership school districts
Used previous experience with PD models◦ Incorporated successful elements◦ Addressed problems with desired elements that
were less successful in previous programs
Searched literature◦ Learning Transfer
Thorndike and Woodworth (1901), Perkins and Salomon (1992), Cree and Macaulay (2000), and Ormond (2004)
◦ Situated Learning Theory Lave & Wenger (1991), Brown, Collins, & Duguid, (1989)
◦ Assessment Wiggins & McTighe (2005), Wiggins (1989)
◦ Differentiated Instruction Tomlinson (1999)
◦ Science Inquiry National Research Council (1996, 2000), Abrams, Southerland & Silva
(2008), many more
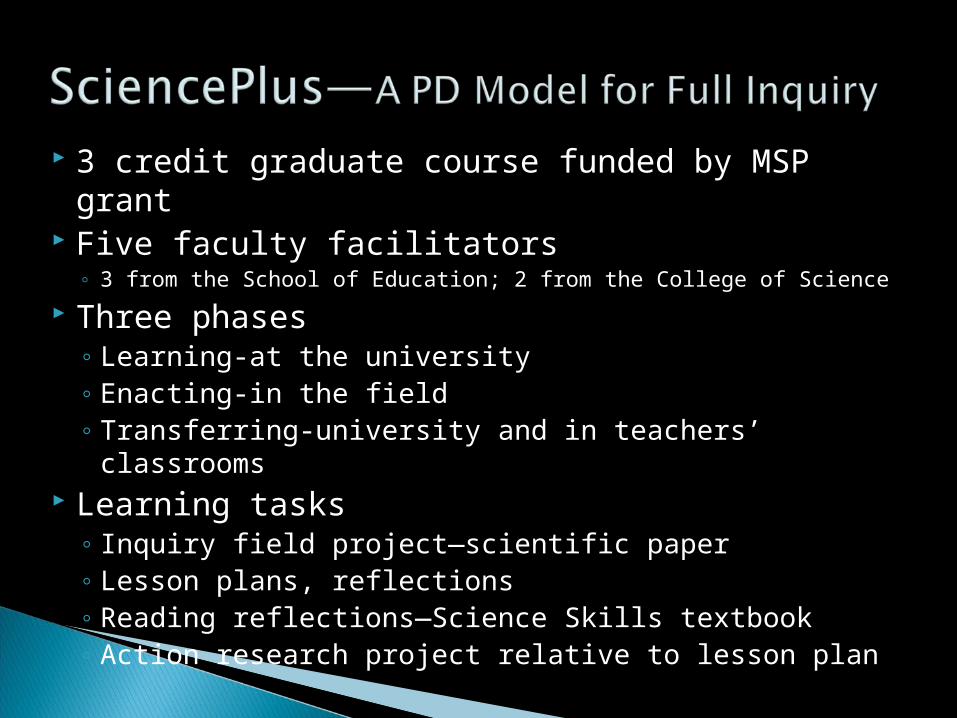
3 credit graduate course funded by MSP grant Five faculty facilitators
◦ 3 from the School of Education; 2 from the College of Science
Three phases◦ Learning-at the university◦ Enacting-in the field◦ Transferring-university and in teachers’ classrooms
Learning tasks◦ Inquiry field project—scientific paper ◦ Lesson plans, reflections ◦ Reading reflections—Science Skills textbook◦ Action research project relative to lesson plan
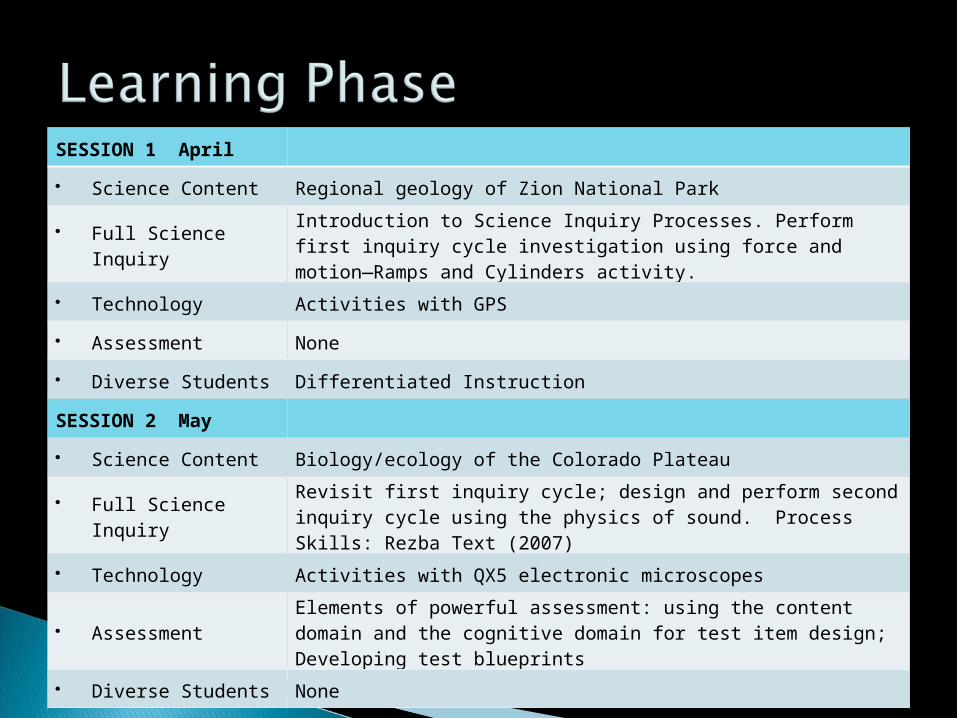
SESSION 1 April
Science Content Regional geology of Zion National Park
Full Science InquiryIntroduction to Science Inquiry Processes. Perform first inquiry cycle investigation using force and motion—Ramps and Cylinders activity.
Technology Activities with GPS
Assessment None
Diverse Students Differentiated Instruction
SESSION 2 May
Science Content Biology/ecology of the Colorado Plateau
Full Science InquiryRevisit first inquiry cycle; design and perform second inquiry cycle using the physics of sound. Process Skills: Rezba Text (2007)
Technology Activities with QX5 electronic microscopes
AssessmentElements of powerful assessment: using the content domain and the cognitive domain for test item design; Developing test blueprints
Diverse Students None
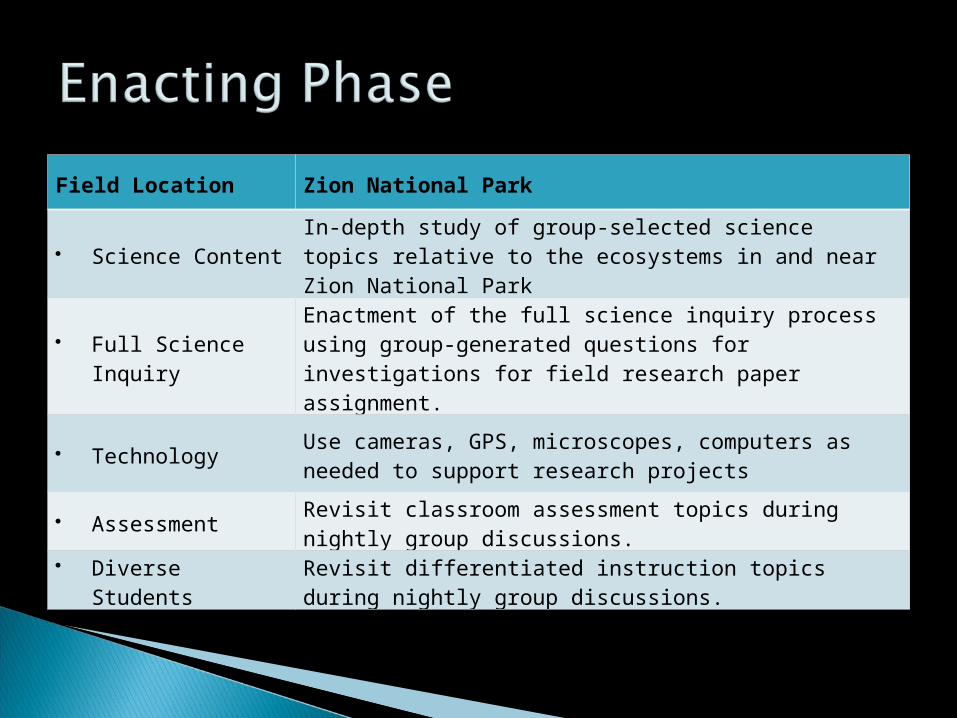
Field Location Zion National Park
Science ContentIn-depth study of group-selected science topics relative to the ecosystems in and near Zion National Park
Full Science InquiryEnactment of the full science inquiry process using group-generated questions for investigations for field research paper assignment.
TechnologyUse cameras, GPS, microscopes, computers as needed to support research projects
Assessment Revisit classroom assessment topics during nightly group discussions.
Diverse StudentsRevisit differentiated instruction topics during nightly group discussions.
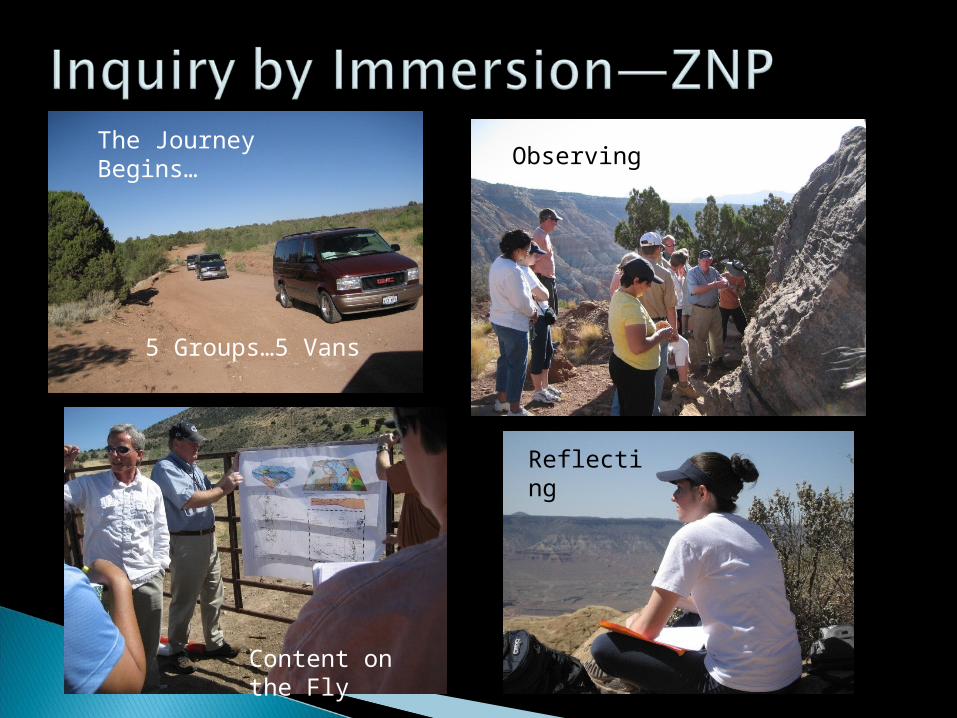
5 Groups…5 Vans
The Journey Begins…Observing
Practicing Sampling Methods Reflecting
Content on the Fly
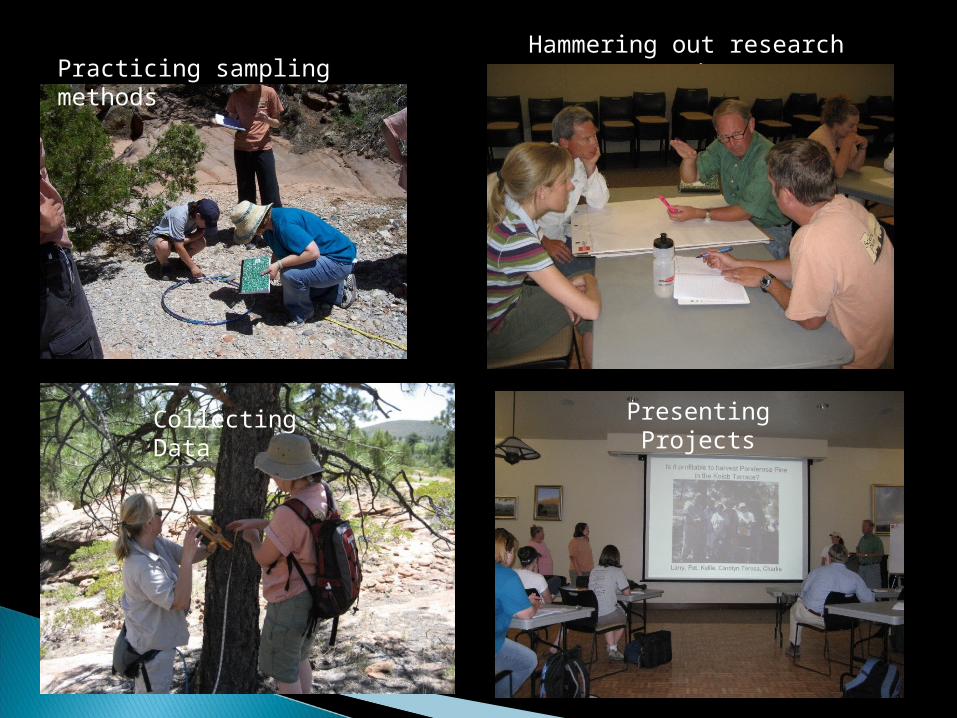
Hammering out research questions
Collecting Data Presenting Projects
Practicing sampling methods
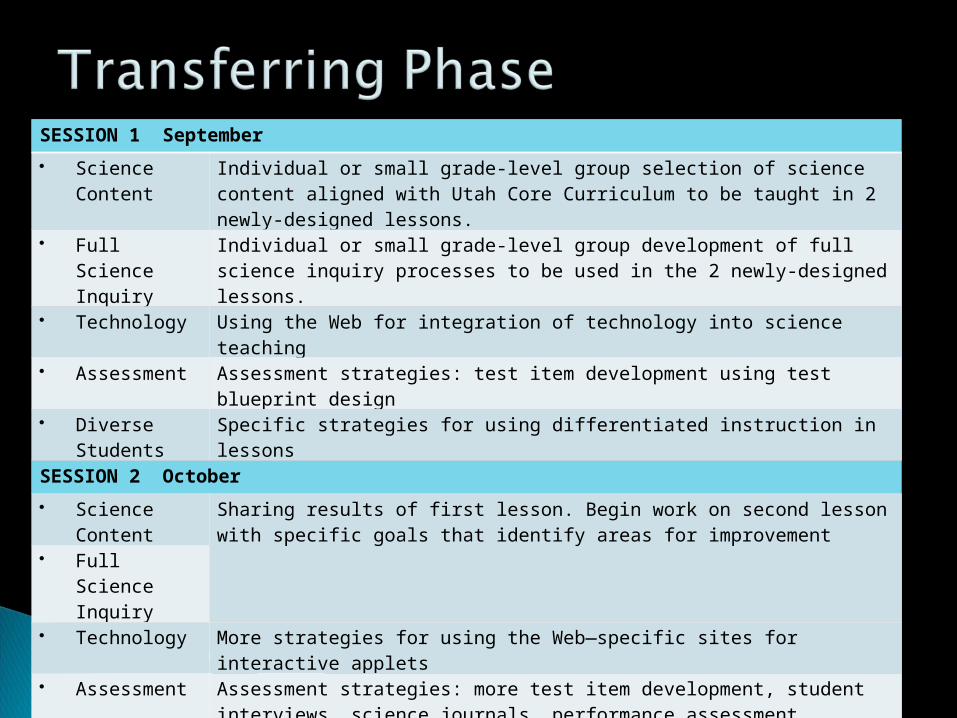
SESSION 1 September
Science Content Individual or small grade-level group selection of science content aligned with Utah Core Curriculum to be taught in 2 newly-designed lessons.
Full Science Inquiry
Individual or small grade-level group development of full science inquiry processes to be used in the 2 newly-designed lessons.
Technology Using the Web for integration of technology into science teaching
Assessment Assessment strategies: test item development using test blueprint design
Diverse Students
Specific strategies for using differentiated instruction in lessons
SESSION 2 October
Science Content Sharing results of first lesson. Begin work on second lesson with specific goals that identify areas for improvement Full Science
Inquiry Technology More strategies for using the Web—specific sites for interactive applets
Assessment Assessment strategies: more test item development, student interviews, science journals, performance assessment
Diverse Students
How to differentiate content, product and process for specific student needs.
SESSION 3 December
Participants shared results of Lesson Plan #2 and Action Research Project.
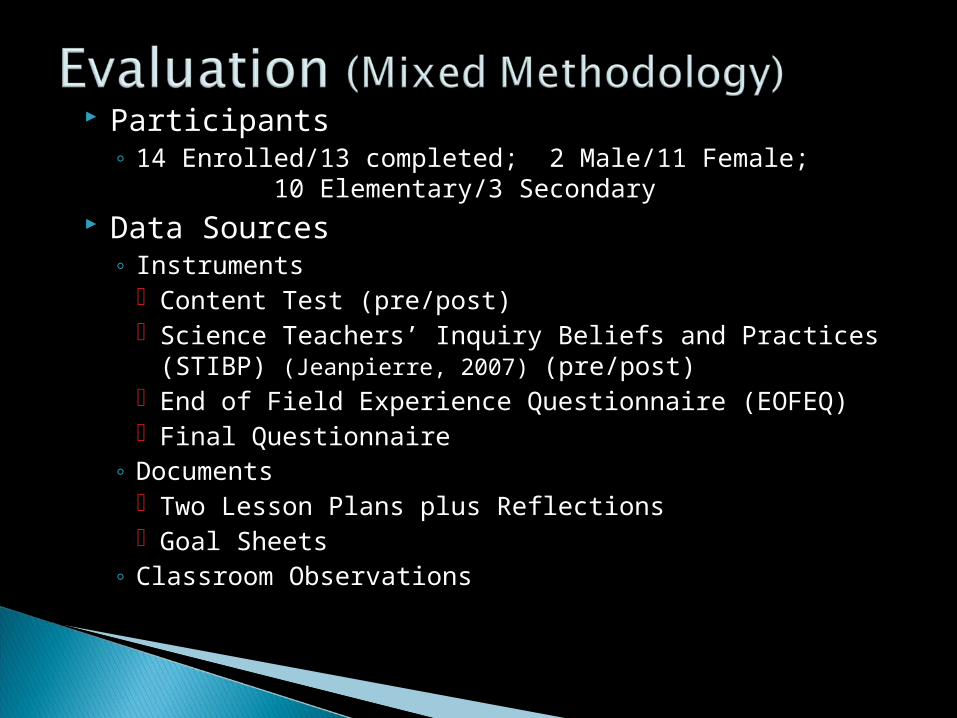
Participants◦ 14 Enrolled/13 completed; 2 Male/11 Female;
10 Elementary/3 Secondary Data Sources
◦ Instruments Content Test (pre/post) Science Teachers’ Inquiry Beliefs and Practices (STIBP)
(Jeanpierre, 2007) (pre/post) End of Field Experience Questionnaire (EOFEQ) Final Questionnaire
◦ Documents Two Lesson Plans plus Reflections Goal Sheets
◦ Classroom Observations
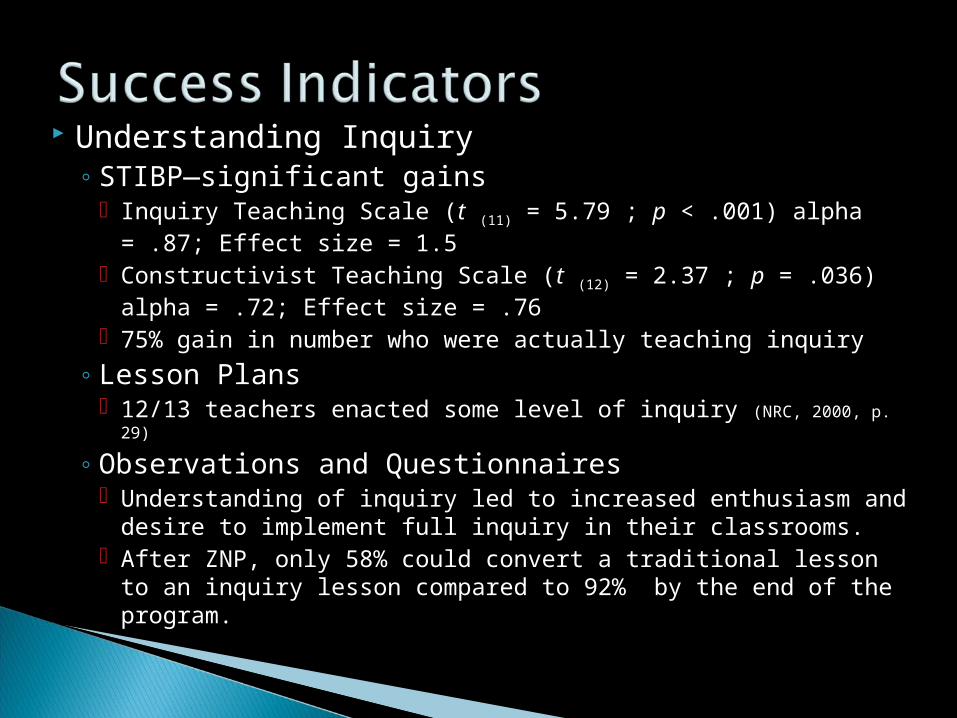
Understanding Inquiry◦ STIBP—significant gains
Inquiry Teaching Scale (t (11) = 5.79 ; p < .001) alpha = .87; Effect size = 1.5
Constructivist Teaching Scale (t (12) = 2.37 ; p = .036) alpha = .72; Effect size = .76
75% gain in number who were actually teaching inquiry
◦ Lesson Plans 12/13 teachers enacted some level of inquiry (NRC, 2000, p. 29)
◦ Observations and Questionnaires Understanding of inquiry led to increased enthusiasm and
desire to implement full inquiry in their classrooms. After ZNP, only 58% could convert a traditional lesson to
an inquiry lesson compared to 92% by the end of the program.
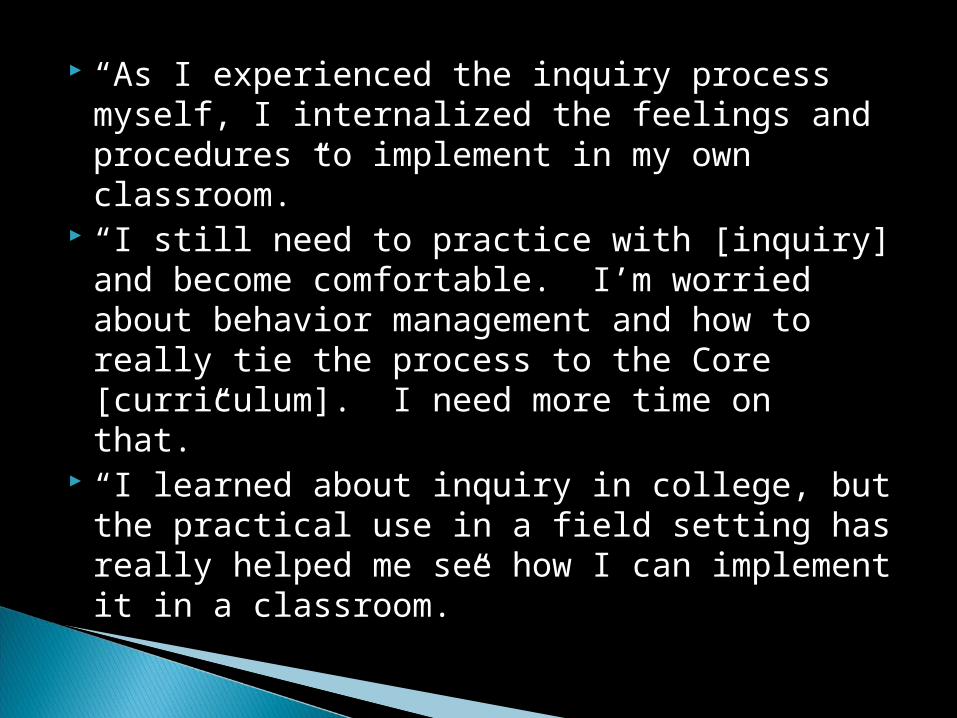
“As I experienced the inquiry process myself, I internalized the feelings and procedures to implement in my own classroom.”
“I still need to practice with [inquiry] and become comfortable. I’m worried about behavior management and how to really tie the process to the Core [curriculum]. I need more time on that.”
“I learned about inquiry in college, but the practical use in a field setting has really helped me see how I can implement it in a classroom.”
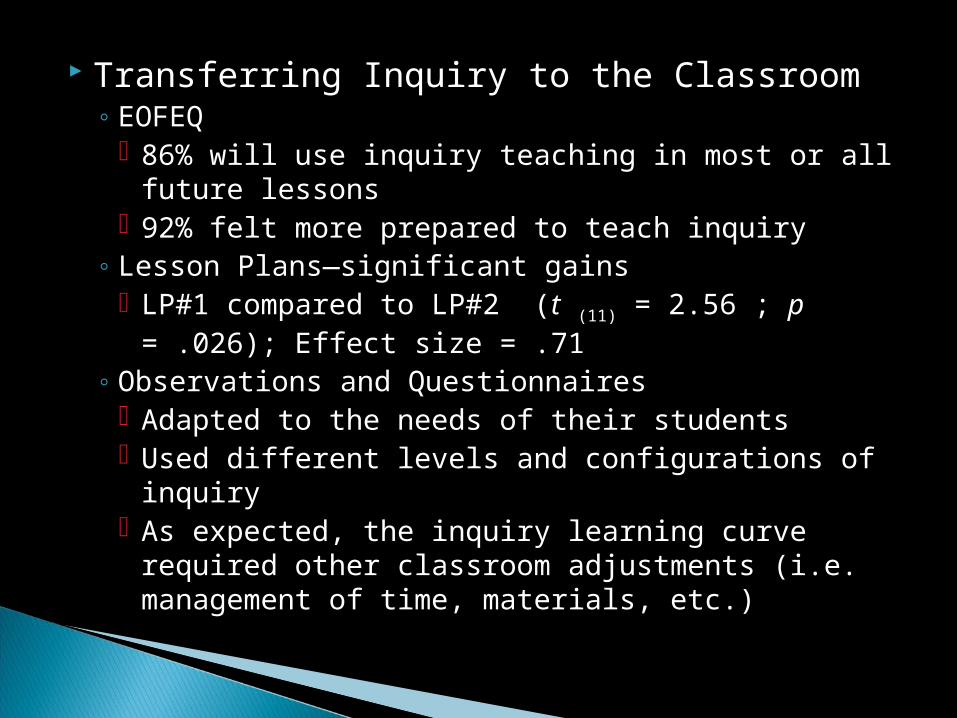
Transferring Inquiry to the Classroom◦ EOFEQ
86% will use inquiry teaching in most or all future lessons
92% felt more prepared to teach inquiry◦ Lesson Plans—significant gains
LP#1 compared to LP#2 (t (11) = 2.56 ; p = .026); Effect size = .71
◦ Observations and Questionnaires Adapted to the needs of their students Used different levels and configurations of inquiry As expected, the inquiry learning curve required
other classroom adjustments (i.e. management of time, materials, etc.)
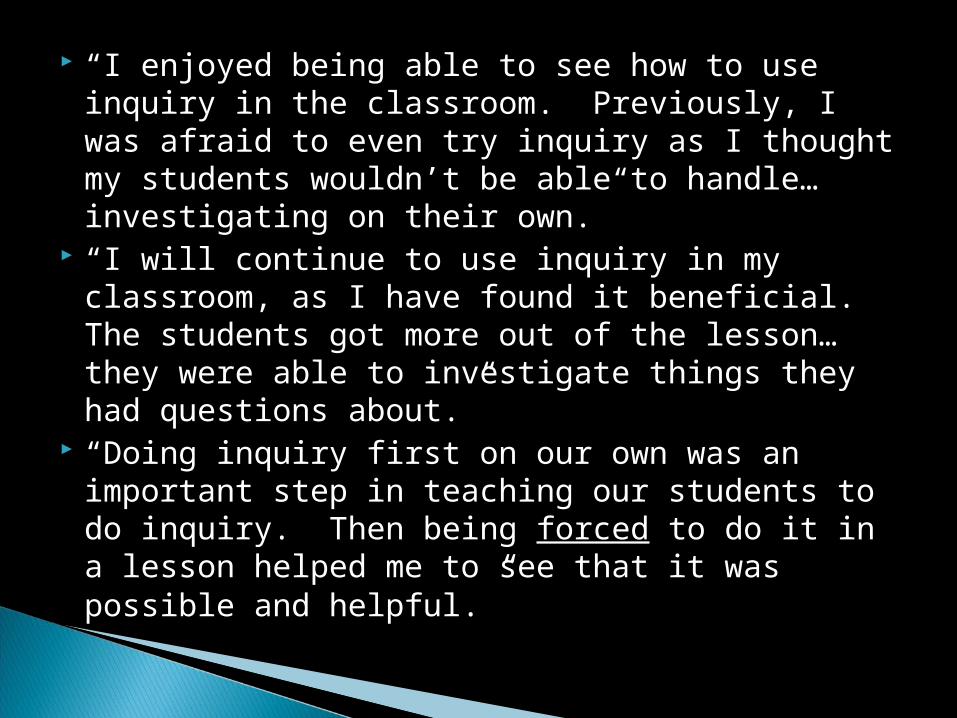
“I enjoyed being able to see how to use inquiry in the classroom. Previously, I was afraid to even try inquiry as I thought my students wouldn’t be able to handle…investigating on their own.”
“I will continue to use inquiry in my classroom, as I have found it beneficial. The students got more out of the lesson…they were able to investigate things they had questions about.”
“Doing inquiry first on our own was an important step in teaching our students to do inquiry. Then being forced to do it in a lesson helped me to see that it was possible and helpful.”
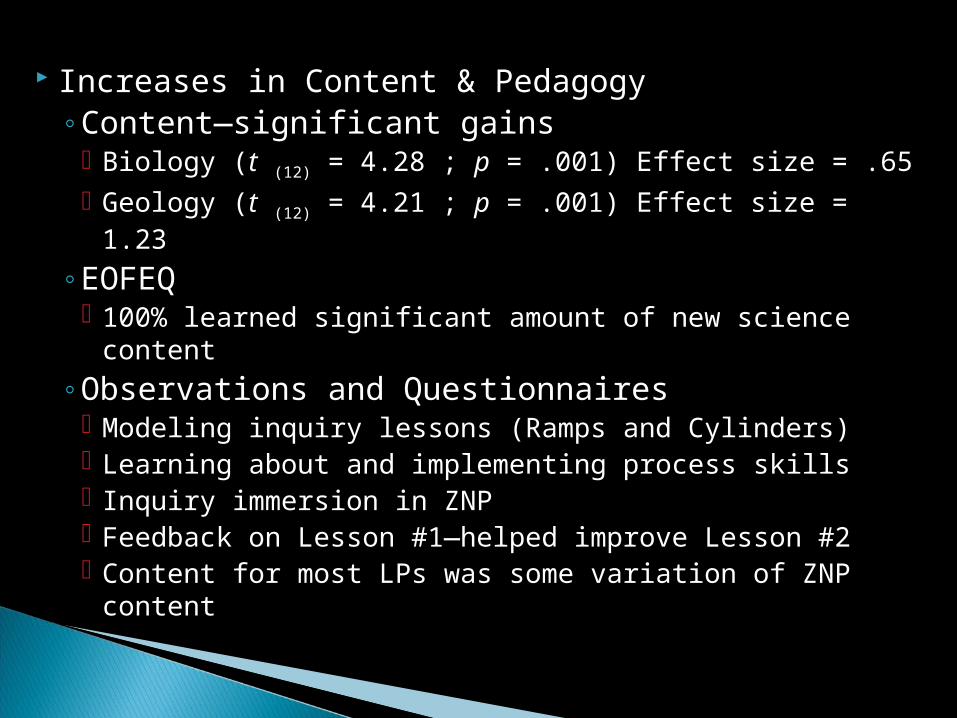
Increases in Content & Pedagogy◦Content—significant gains
Biology (t (12) = 4.28 ; p = .001) Effect size = .65 Geology (t (12) = 4.21 ; p = .001) Effect size = 1.23
◦EOFEQ 100% learned significant amount of new science
content◦Observations and Questionnaires
Modeling inquiry lessons (Ramps and Cylinders) Learning about and implementing process skills Inquiry immersion in ZNP Feedback on Lesson #1—helped improve Lesson #2 Content for most LPs was some variation of ZNP
content
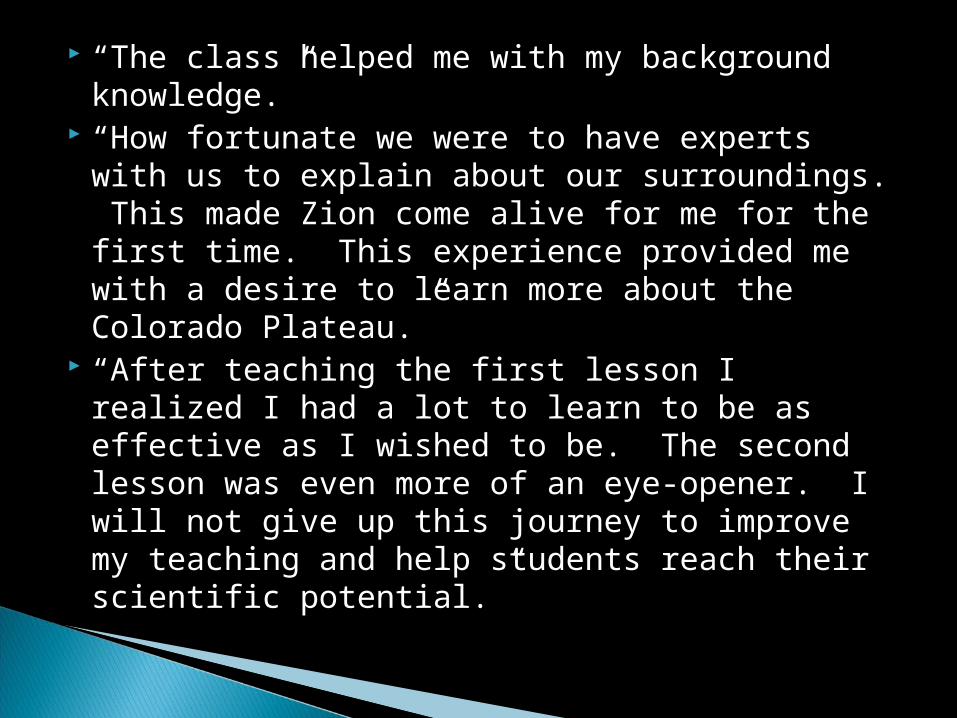
“The class helped me with my background knowledge.”
“How fortunate we were to have experts with us to explain about our surroundings. This made Zion come alive for me for the first time. This experience provided me with a desire to learn more about the Colorado Plateau.”
“After teaching the first lesson I realized I had a lot to learn to be as effective as I wished to be. The second lesson was even more of an eye-opener. I will not give up this journey to improve my teaching and help students reach their scientific potential.”
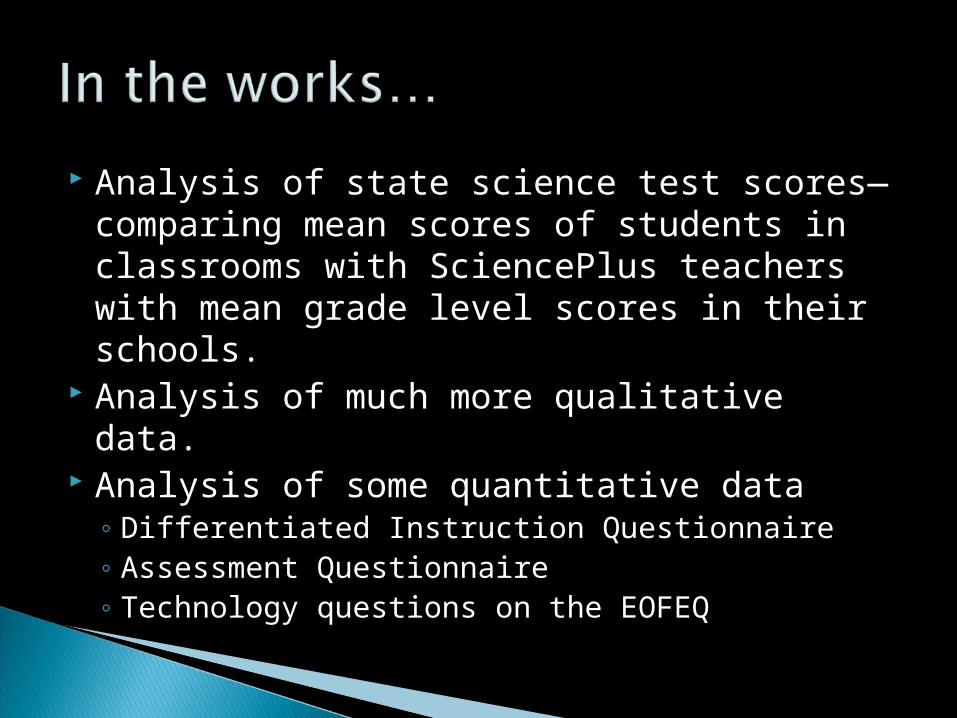
Analysis of state science test scores—comparing mean scores of students in classrooms with SciencePlus teachers with mean grade level scores in their schools.
Analysis of much more qualitative data. Analysis of some quantitative data
◦ Differentiated Instruction Questionnaire◦ Assessment Questionnaire◦ Technology questions on the EOFEQ
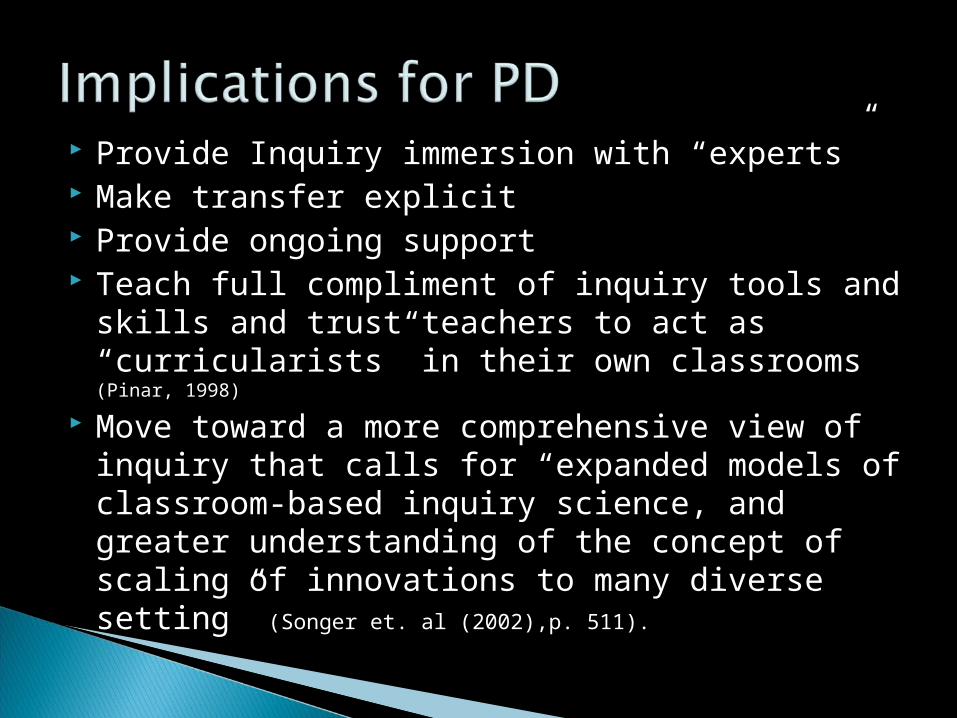
Provide Inquiry immersion with “experts” Make transfer explicit Provide ongoing support Teach full compliment of inquiry tools and skills
and trust teachers to act as “curricularists” in their own classrooms (Pinar, 1998)
Move toward a more comprehensive view of inquiry that calls for “expanded models of classroom-based inquiry science, and greater understanding of the concept of scaling of innovations to many diverse setting” (Songer et. al (2002),p. 511).
The instructional practices and assessments discussed or shown in this presentation are not intended as an endorsement by the U.S. Department of Education.


![Kat Cantrell - [Corações Roubados] - Compromisso Casual (Desejo 220.2)](https://static.fdocument.pub/doc/165x107/577cc04e1a28aba7118f9f52/kat-cantrell-coracoes-roubados-compromisso-casual-desejo-2202.jpg)


![ZÀi\w hnizmkw Adn-bpI Pohn¡pI/]IÀ¶p-sIm-Sp-¡pI {]mÀ°n¡pI BtLmjn¡pI.](https://static.fdocument.pub/doc/165x107/56649d165503460f949ebd8f/zaiw-hnizmkw-adn-bpi-pohnpiiap-sim-sp-pi-manpi-btlmjnpi.jpg)