Nature, Extent, Causes and Issues in Agricultural Distress
27
Nature, Extent, Causes and Issues in Agricultural Distress Foundation Day Seminar National Bank for Agriculture and Rural Development (NABARD) Mumbai, India 12 July 2015 Link to Paper Srijit Mishra
-
Upload
srijit-mishra -
Category
Economy & Finance
-
view
351 -
download
3
Transcript of Nature, Extent, Causes and Issues in Agricultural Distress
Nature, Extent, Causes and Issues in Agricultural Distress
Foundation Day Seminar National Bank for Agriculture and Rural Development (NABARD)
Mumbai, India 12 July 2015 Link to Paper
Srijit Mishra
Presentation Format
• Introduction/Motivation
• Twin Dimensions of Crisis/Distress
– Agricultural and Agrarian
• Farmers’ Suicides: Interrelated factors
– Demand and Supply side
• Data, Debate, and Livelihood
– Transfer of technology vs Knowledge-centric
• Concluding Remarks
12 July 2015 Srijit Mishra, NABARD Foundation Day Seminar 2
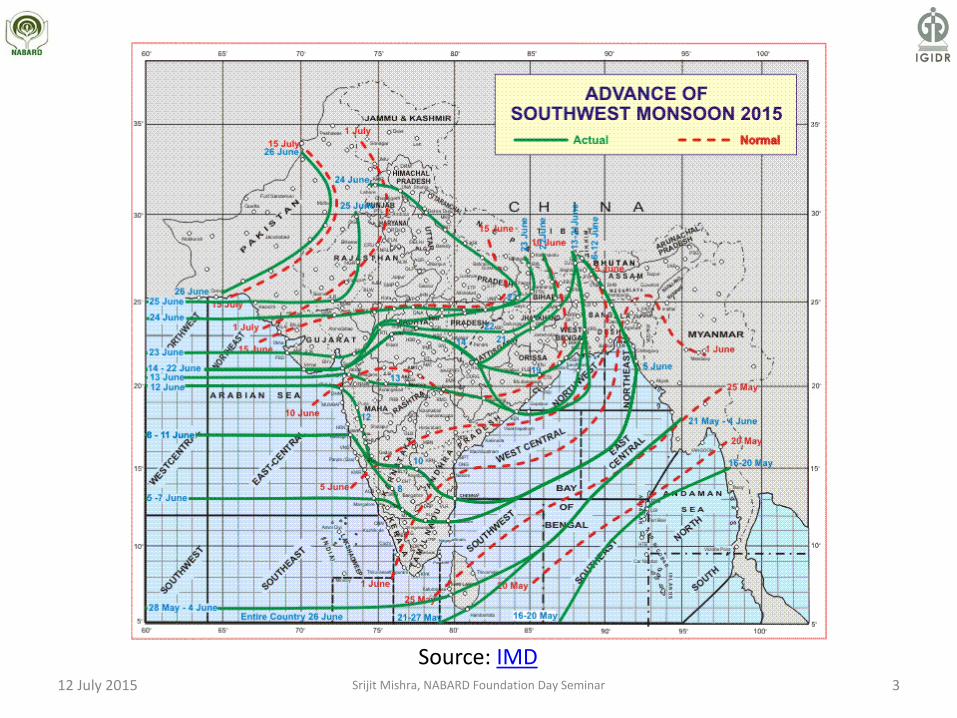
Source: IMD 12 July 2015 3 Srijit Mishra, NABARD Foundation Day Seminar
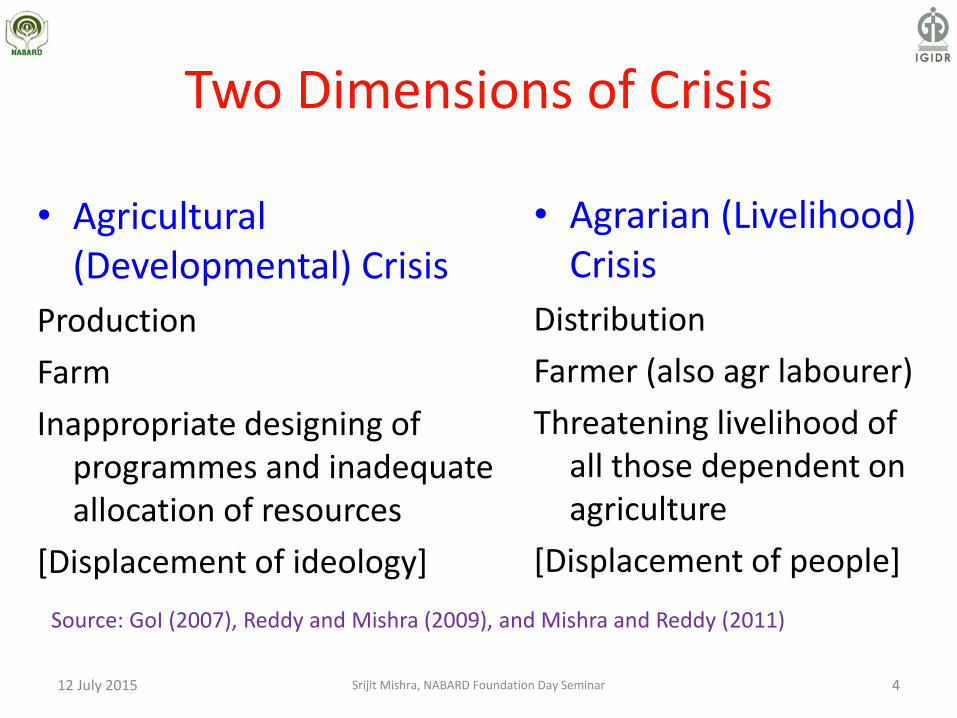
Two Dimensions of Crisis
• Agrarian (Livelihood) Crisis
Distribution
Farmer (also agr labourer)
Threatening livelihood of all those dependent on agriculture
[Displacement of people]
• Agricultural (Developmental) Crisis
Production
Farm
Inappropriate designing of programmes and inadequate allocation of resources
[Displacement of ideology]
12 July 2015 4
Source: GoI (2007), Reddy and Mishra (2009), and Mishra and Reddy (2011)
Srijit Mishra, NABARD Foundation Day Seminar
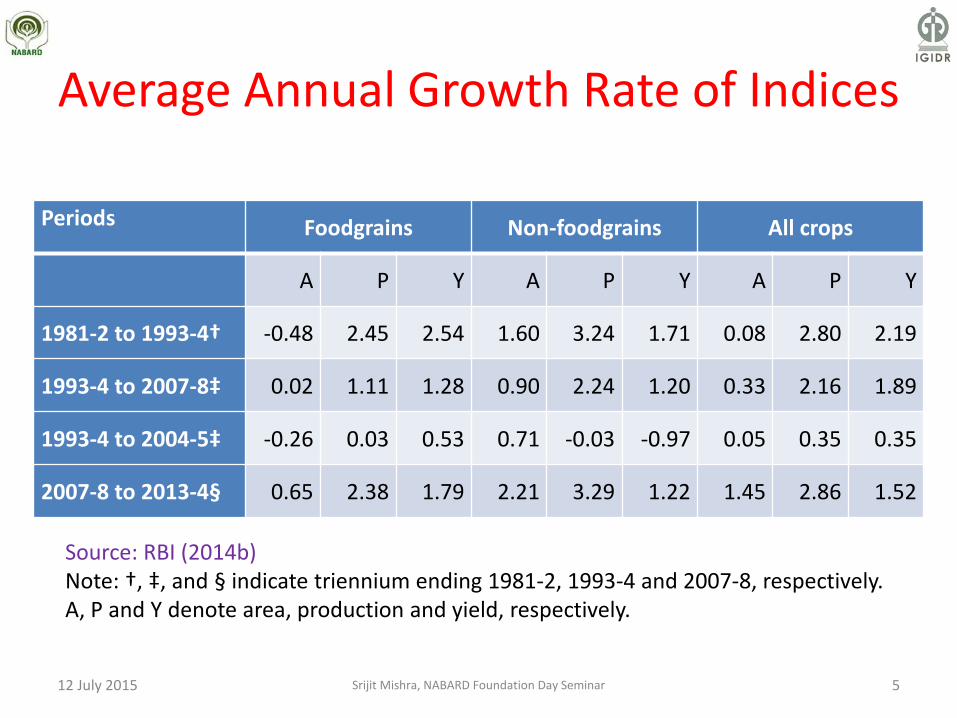
Average Annual Growth Rate of Indices
Periods Foodgrains Non-foodgrains All crops
A P Y A P Y A P Y
1981-2 to 1993-4† -0.48 2.45 2.54 1.60 3.24 1.71 0.08 2.80 2.19
1993-4 to 2007-8‡ 0.02 1.11 1.28 0.90 2.24 1.20 0.33 2.16 1.89
1993-4 to 2004-5‡ -0.26 0.03 0.53 0.71 -0.03 -0.97 0.05 0.35 0.35
2007-8 to 2013-4§ 0.65 2.38 1.79 2.21 3.29 1.22 1.45 2.86 1.52
Source: RBI (2014b) Note: †, ‡, and § indicate triennium ending 1981-2, 1993-4 and 2007-8, respectively. A, P and Y denote area, production and yield, respectively.
12 July 2015 5 Srijit Mishra, NABARD Foundation Day Seminar

Average Annual Growth Rate of Index of Agricultural Production, Maj Crops
Periods Rice Wht C. Cer Puls G.nut S.sm R n M Co.tn Ru.br
1981–2 to
1993–4† 2.84 3.59 -1.44 -0.43 -1.70 -1.48 4.93 1.00 8.33
1993–4 to
2004–5‡ -0.33 0.94 -0.42 -1.20 -6.89 -1.57 0.11 2.02 4.41
2007–8 to
2013–4§ 1.34 3.15 -0.59 4.04 -7.37 -3.91 4.31 4.25 1.76
Source: RBI (2014b) Note: †, ‡, and § indicate triennium ending 1981-2, 1993-4 and 2007-8, respectively.
12 July 2015 6 Srijit Mishra, NABARD Foundation Day Seminar
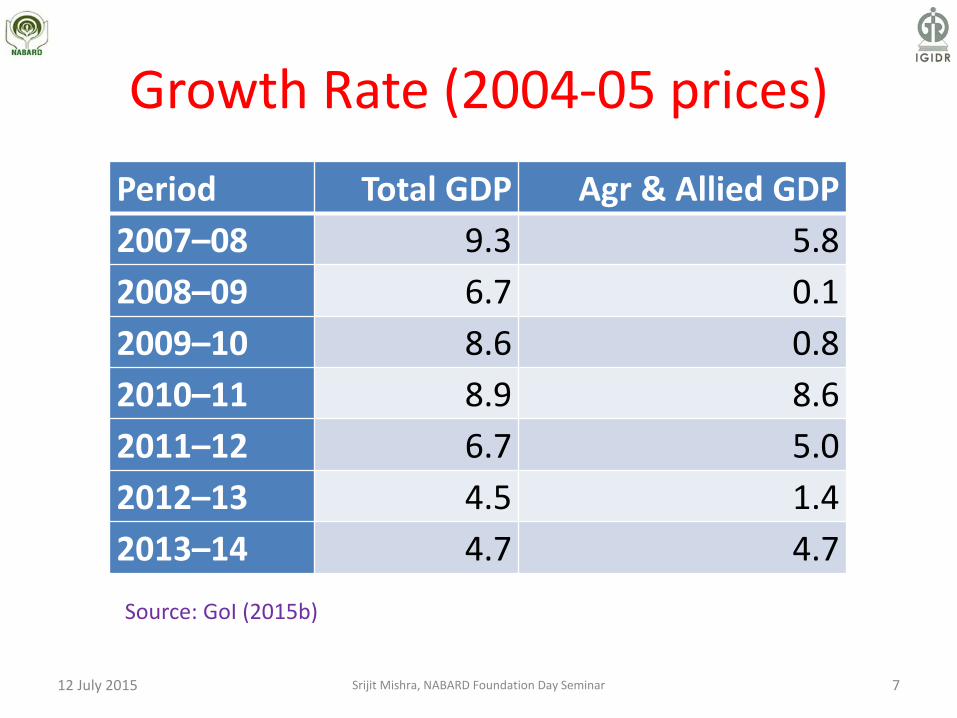
Growth Rate (2004-05 prices)
Period Total GDP Agr & Allied GDP
2007–08 9.3 5.8
2008–09 6.7 0.1
2009–10 8.6 0.8
2010–11 8.9 8.6
2011–12 6.7 5.0
2012–13 4.5 1.4
2013–14 4.7 4.7
Source: GoI (2015b)
12 July 2015 7 Srijit Mishra, NABARD Foundation Day Seminar
8
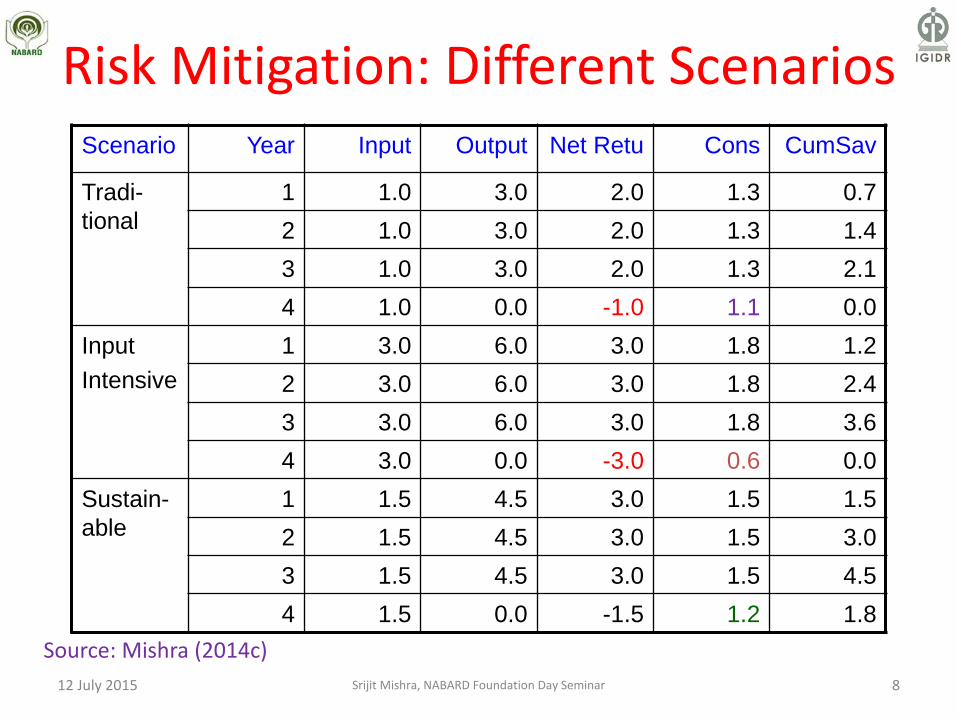
Risk Mitigation: Different Scenarios Scenario Year Input Output Net Retu Cons CumSav
Tradi-
tional
1 1.0 3.0 2.0 1.3 0.7
2 1.0 3.0 2.0 1.3 1.4
3 1.0 3.0 2.0 1.3 2.1
4 1.0 0.0 -1.0 1.1 0.0
Input
Intensive
1 3.0 6.0 3.0 1.8 1.2
2 3.0 6.0 3.0 1.8 2.4
3 3.0 6.0 3.0 1.8 3.6
4 3.0 0.0 -3.0 0.6 0.0
Sustain-
able
1 1.5 4.5 3.0 1.5 1.5
2 1.5 4.5 3.0 1.5 3.0
3 1.5 4.5 3.0 1.5 4.5
4 1.5 0.0 -1.5 1.2 1.8
12 July 2015
Source: Mishra (2014c)
Srijit Mishra, NABARD Foundation Day Seminar
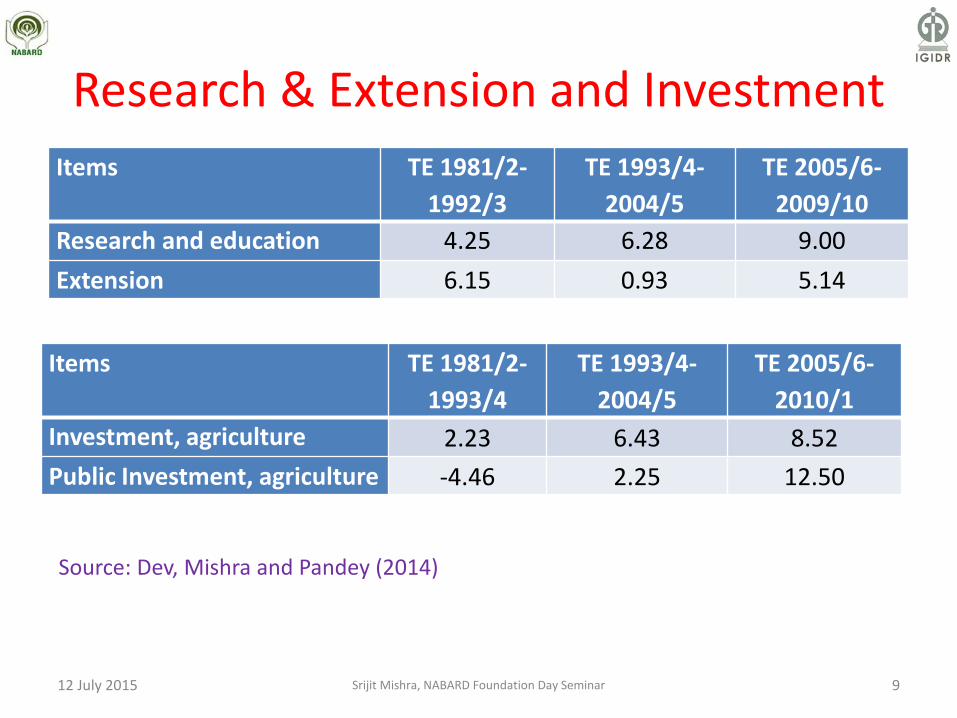
Research & Extension and Investment
Items TE 1981/2-
1992/3
TE 1993/4-
2004/5
TE 2005/6-
2009/10
Research and education 4.25 6.28 9.00
Extension 6.15 0.93 5.14
12 July 2015 9
Items TE 1981/2-
1993/4
TE 1993/4-
2004/5
TE 2005/6-
2010/1
Investment, agriculture 2.23 6.43 8.52
Public Investment, agriculture -4.46 2.25 12.50
Source: Dev, Mishra and Pandey (2014)
Srijit Mishra, NABARD Foundation Day Seminar
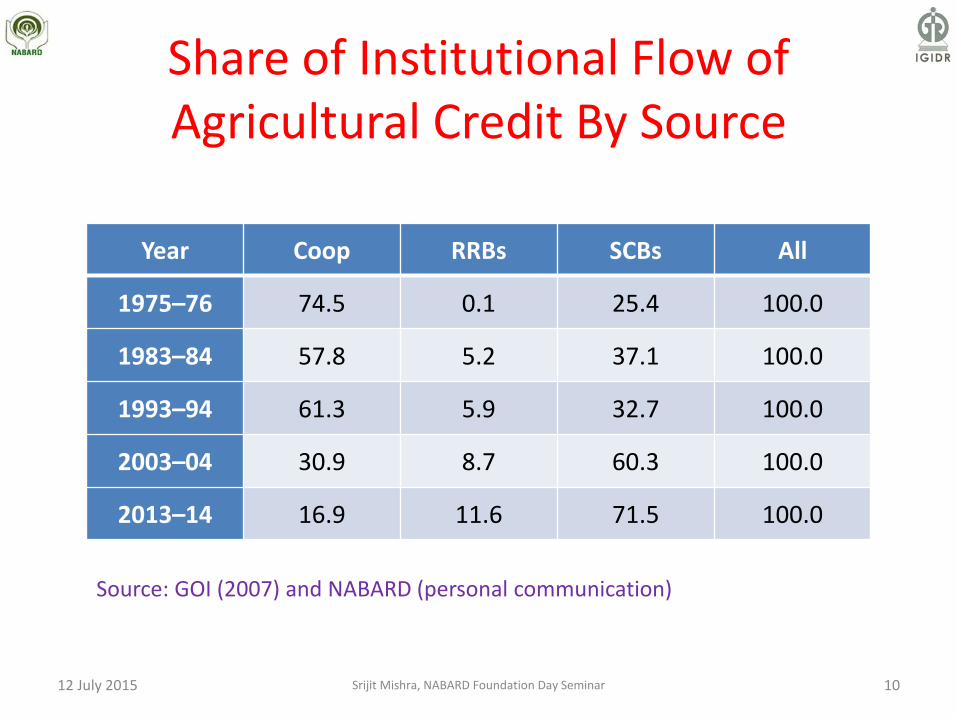
Share of Institutional Flow of Agricultural Credit By Source
Year Coop RRBs SCBs All
1975–76 74.5 0.1 25.4 100.0
1983–84 57.8 5.2 37.1 100.0
1993–94 61.3 5.9 32.7 100.0
2003–04 30.9 8.7 60.3 100.0
2013–14 16.9 11.6 71.5 100.0
12 July 2015 10
Source: GOI (2007) and NABARD (personal communication)
Srijit Mishra, NABARD Foundation Day Seminar
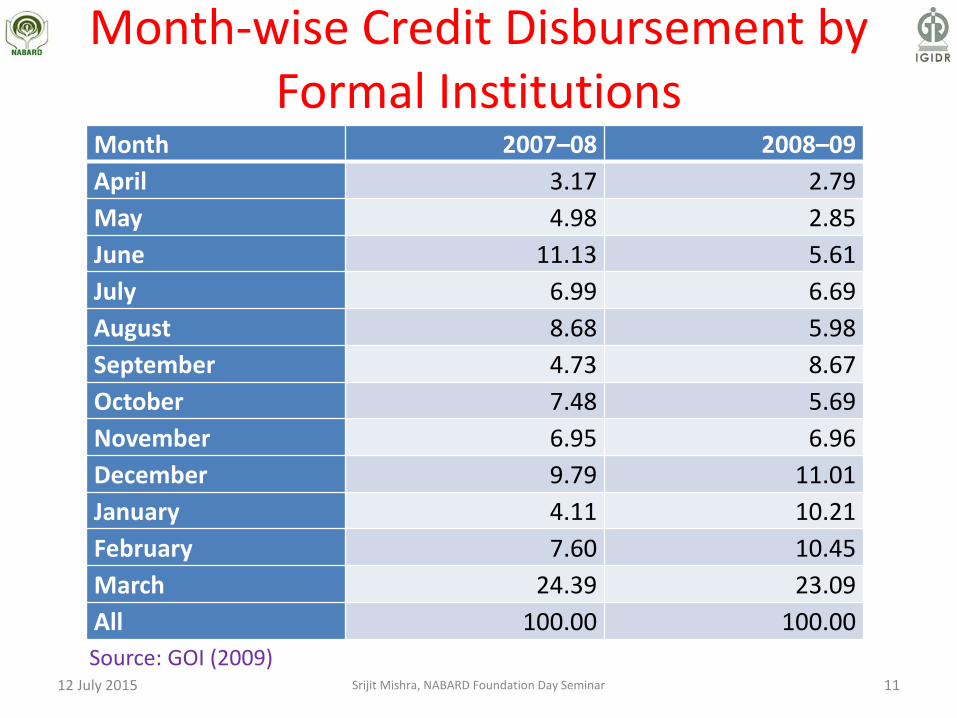
Month-wise Credit Disbursement by Formal Institutions
Month 2007–08 2008–09
April 3.17 2.79
May 4.98 2.85
June 11.13 5.61
July 6.99 6.69
August 8.68 5.98
September 4.73 8.67
October 7.48 5.69
November 6.95 6.96
December 9.79 11.01
January 4.11 10.21
February 7.60 10.45
March 24.39 23.09
All 100.00 100.00
12 July 2015 11
Source: GOI (2009) Srijit Mishra, NABARD Foundation Day Seminar

Credit/Area and Accounts/Holdings
Year Share of credit disbursed to
share of area operated
Share of borrowal accounts (No) to
share of operational holdings (No)
Marginal Small Other Marginal Small Other
1981–82 2.41 1.24 0.72 0.90 1.28 1.01
1991–92 1.84 1.33 0.71 0.72 1.77 1.19
2002–03 0.96 1.25 0.93 0.49 2.79 3.25
2012–13† 1.11 1.30 0.78 0.54 3.28 3.09
12 July 2015 12
Source: NSSO (c.1993, 2014b) and RBI (2014b) † Credit data for 2011-12 (latest available)
Srijit Mishra, NABARD Foundation Day Seminar
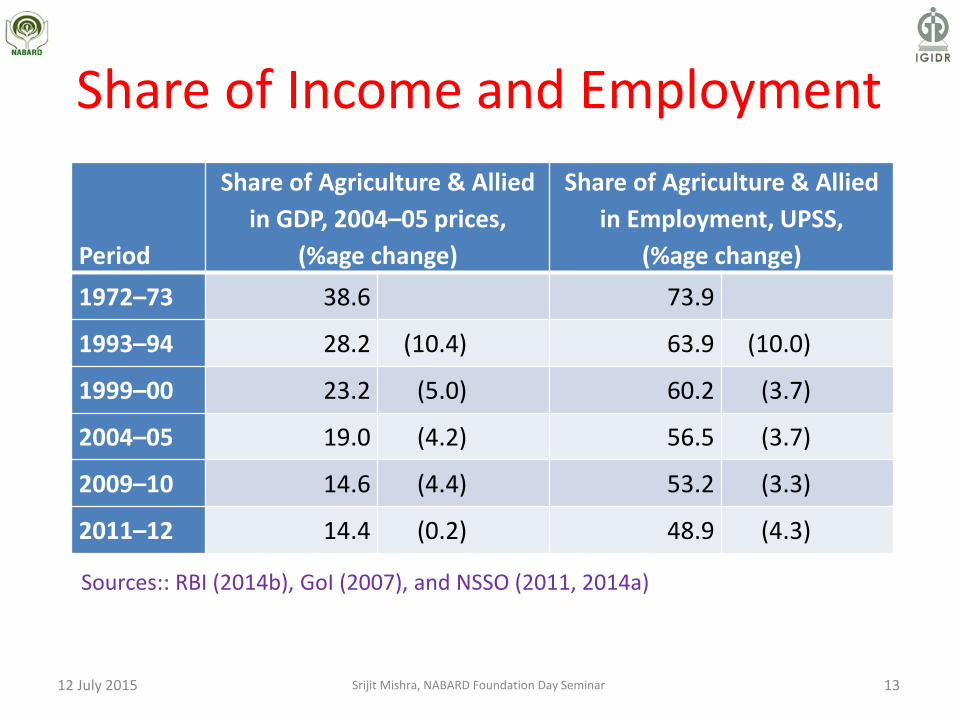
Share of Income and Employment
Period
Share of Agriculture & Allied
in GDP, 2004–05 prices,
(%age change)
Share of Agriculture & Allied
in Employment, UPSS,
(%age change)
1972–73 38.6 73.9
1993–94 28.2 (10.4) 63.9 (10.0)
1999–00 23.2 (5.0) 60.2 (3.7)
2004–05 19.0 (4.2) 56.5 (3.7)
2009–10 14.6 (4.4) 53.2 (3.3)
2011–12 14.4 (0.2) 48.9 (4.3)
12 July 2015 13
Sources:: RBI (2014b), GoI (2007), and NSSO (2011, 2014a)
Srijit Mishra, NABARD Foundation Day Seminar
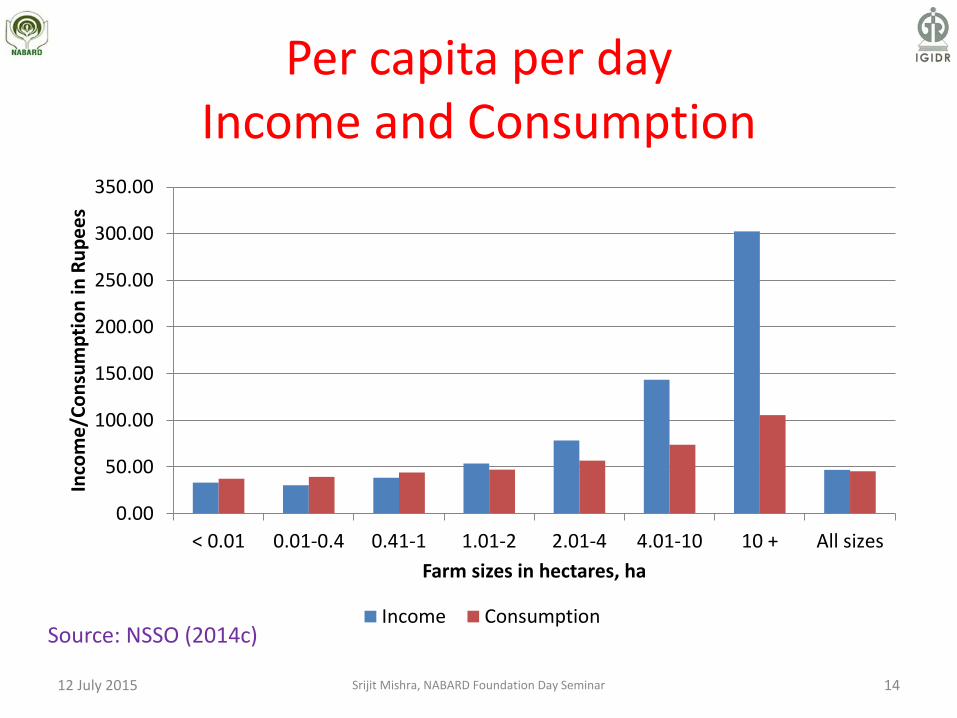
Per capita per day Income and Consumption
12 July 2015 14
0.00
50.00
100.00
150.00
200.00
250.00
300.00
350.00
< 0.01 0.01-0.4 0.41-1 1.01-2 2.01-4 4.01-10 10 + All sizes
Inco
me
/Co
nsu
mp
tio
n i
n R
up
ee
s
Farm sizes in hectares, ha
Income ConsumptionSource: NSSO (2014c)
Srijit Mishra, NABARD Foundation Day Seminar
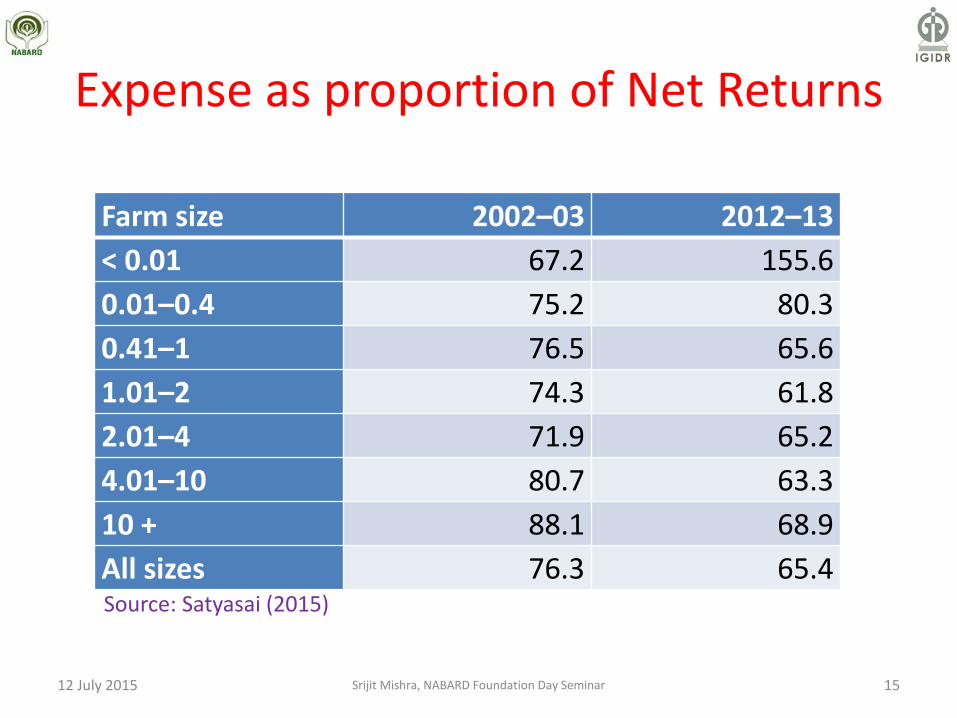
Expense as proportion of Net Returns
Farm size 2002–03 2012–13
< 0.01 67.2 155.6
0.01–0.4 75.2 80.3
0.41–1 76.5 65.6
1.01–2 74.3 61.8
2.01–4 71.9 65.2
4.01–10 80.7 63.3
10 + 88.1 68.9
All sizes 76.3 65.4
12 July 2015 15
Source: Satyasai (2015)
Srijit Mishra, NABARD Foundation Day Seminar

Food Insecurity, 2011-12
Region Calorie poor Protein poor Fat poor
Rural 62.04 33.62 29.13
Urban 58.90 40.03 10.58
Total 61.06 35.62 23.35
12 July 2015 16
Source: Preliminary estimate as part of an ongoing work with L Hari
Srijit Mishra, NABARD Foundation Day Seminar
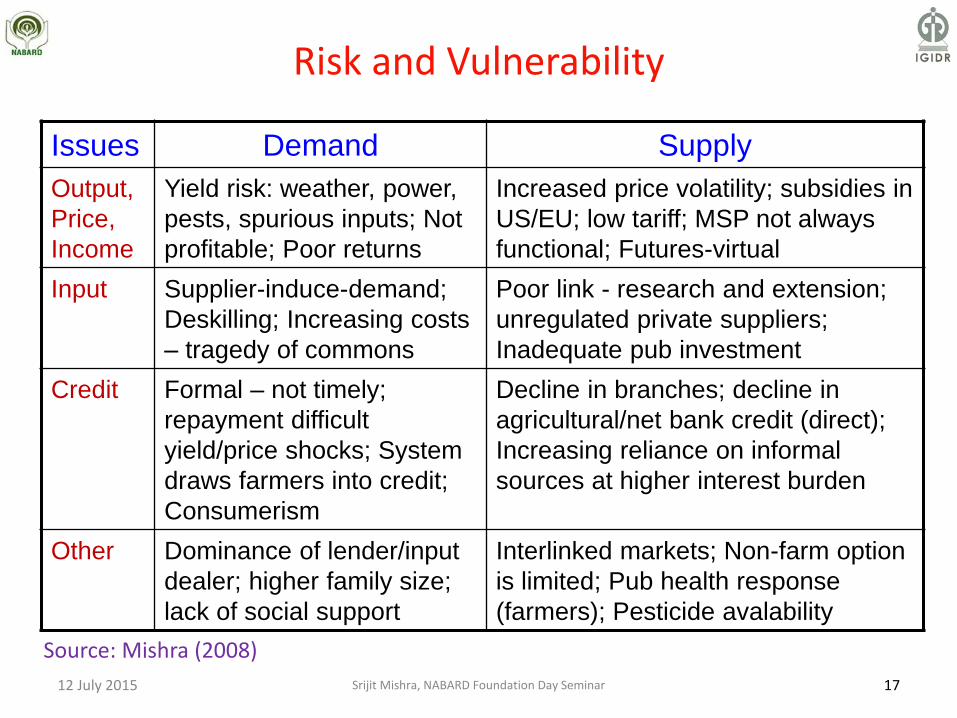
Risk and Vulnerability
Issues Demand Supply
Output,
Price,
Income
Yield risk: weather, power,
pests, spurious inputs; Not
profitable; Poor returns
Increased price volatility; subsidies in
US/EU; low tariff; MSP not always
functional; Futures-virtual
Input Supplier-induce-demand;
Deskilling; Increasing costs
– tragedy of commons
Poor link - research and extension;
unregulated private suppliers;
Inadequate pub investment
Credit Formal – not timely;
repayment difficult
yield/price shocks; System
draws farmers into credit;
Consumerism
Decline in branches; decline in
agricultural/net bank credit (direct);
Increasing reliance on informal
sources at higher interest burden
Other Dominance of lender/input
dealer; higher family size;
lack of social support
Interlinked markets; Non-farm option
is limited; Pub health response
(farmers); Pesticide avalability
17 12 July 2015
Source: Mishra (2008)
Srijit Mishra, NABARD Foundation Day Seminar
Suicide rates: how to normalise
• Farmer population or farm population (the latter includes agricultural labourers)
– Contextualising from Australia/Europe/North America - Peter Mayer (2010) Establet (2012)
• Farmer population or operational holdings
– Ignoring land partitioning - (Plewis 2014)
• Non-farmer population (use workers only)
– Inappropriate classifications
18 12 July 2015 Srijit Mishra, NABARD Foundation Day Seminar
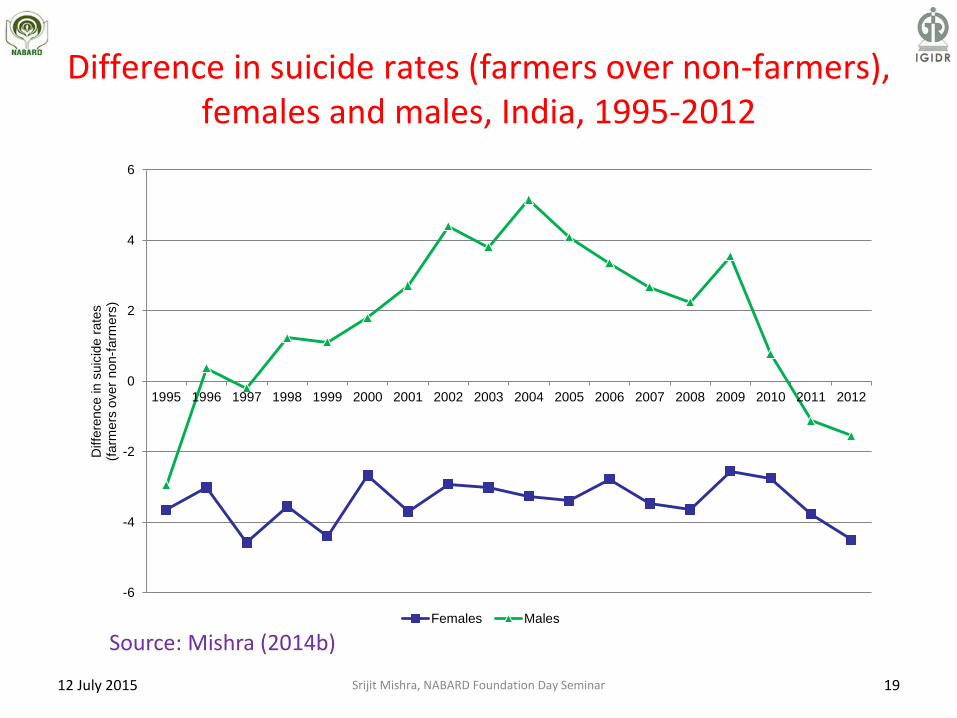
Difference in suicide rates (farmers over non-farmers), females and males, India, 1995-2012
-6
-4
-2
0
2
4
6
1995 1996 1997 1998 1999 2000 2001 2002 2003 2004 2005 2006 2007 2008 2009 2010 2011 2012
Diffe
rence in s
uic
ide r
ate
s
(farm
ers
over
non
-farm
ers
)
Females Males
19 12 July 2015
Source: Mishra (2014b)
Srijit Mishra, NABARD Foundation Day Seminar
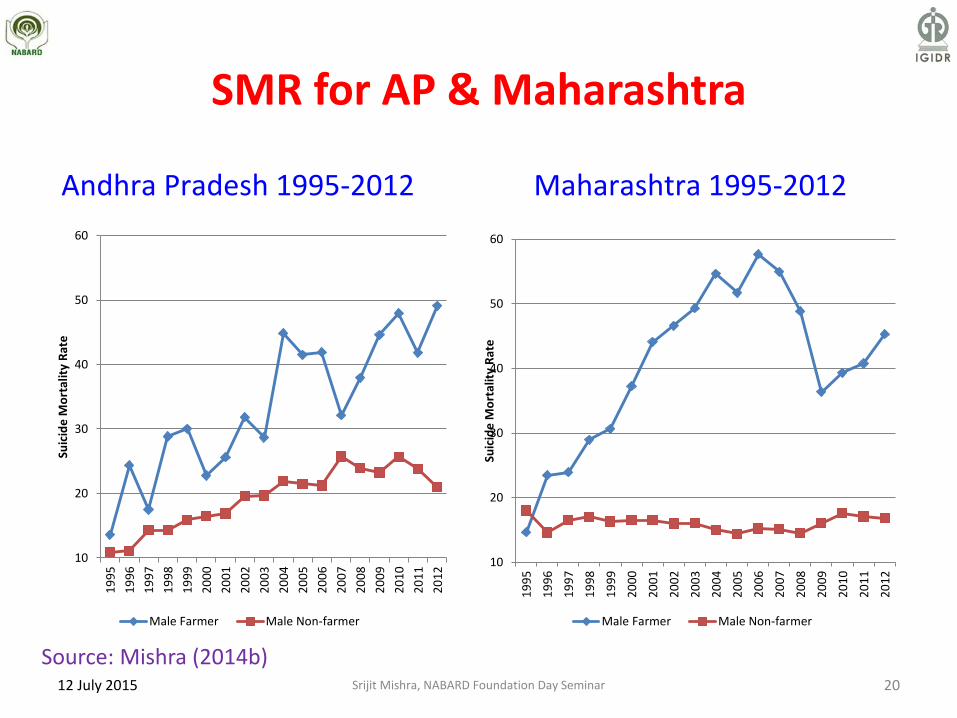
20
SMR for AP & Maharashtra
Maharashtra 1995-2012 Andhra Pradesh 1995-2012
10
20
30
40
50
60
19
95
19
96
19
97
19
98
19
99
20
00
20
01
20
02
20
03
20
04
20
05
20
06
20
07
20
08
20
09
20
10
20
11
20
12
Suic
ide
Mo
rtal
ity
Rat
e
Male Farmer Male Non-farmer
10
20
30
40
50
60
19
95
19
96
19
97
19
98
19
99
20
00
20
01
20
02
20
03
20
04
20
05
20
06
20
07
20
08
20
09
20
10
20
11
20
12
Suic
ide
Mo
rtal
ity
Rat
e
Male Farmer Male Non-farmer
12 July 2015
Source: Mishra (2014b) Srijit Mishra, NABARD Foundation Day Seminar
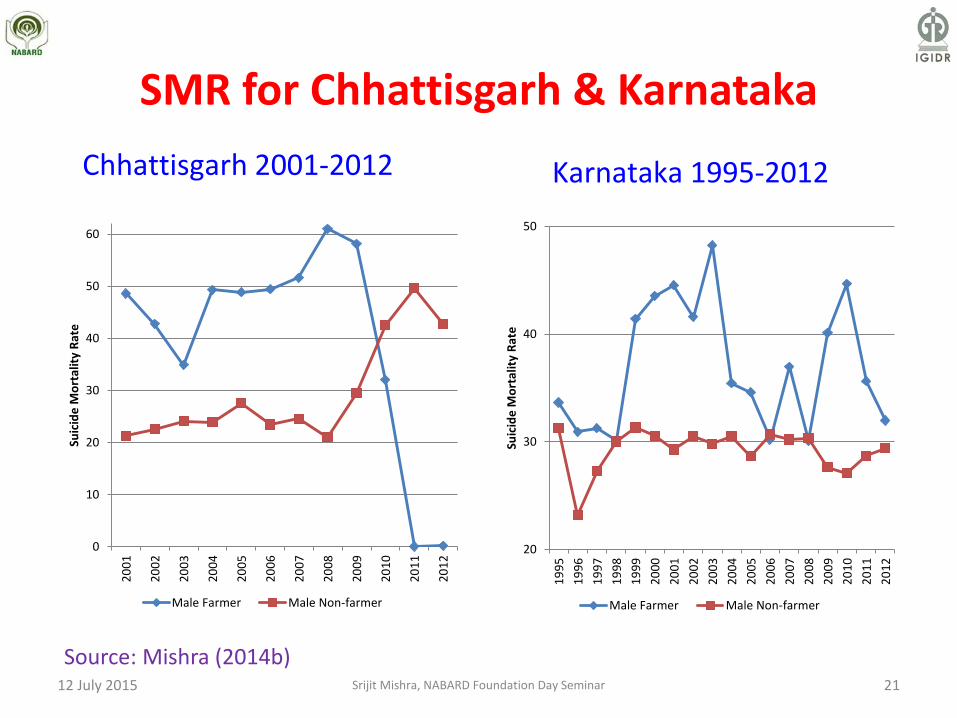
21
SMR for Chhattisgarh & Karnataka
Karnataka 1995-2012 Chhattisgarh 2001-2012
0
10
20
30
40
50
60
20
01
20
02
20
03
20
04
20
05
20
06
20
07
20
08
20
09
20
10
20
11
20
12
Suic
ide
Mo
rtal
ity
Rat
e
Male Farmer Male Non-farmer
20
30
40
50
19
95
19
96
19
97
19
98
19
99
20
00
20
01
20
02
20
03
20
04
20
05
20
06
20
07
20
08
20
09
20
10
20
11
20
12
Suic
ide
Mo
rtal
ity
Rat
e
Male Farmer Male Non-farmer
Source: Mishra (2014b) 12 July 2015 Srijit Mishra, NABARD Foundation Day Seminar

Suicides data: grey areas
0.0
5.0
10.0
15.0
20.0
25.0
30.0
1995-97 1998-00 2001-03 2004-06 2007-09 2010-12
Self-employed Others Others
22
Source: Mishra (2014b)
12 July 2015 Srijit Mishra, NABARD Foundation Day Seminar

Debate shifts for/against a technology
• Bt cotton was expected to control only bollworms and it succeeded in doing just that”
Kranthi, Bt Cotton Q&A (2012)
• “…A success story for the environment and local welfare”
Finnish Institute of Biotechnology (VIB, 2012)
• “False hype and failed promises … crisis continues with crop failure and suicides”
Coalition for a GM-Free India (2012)
• Bt cotton and suicides: an assessment (suicides is long term - link with Bt is neither necessary nor sufficient, indirectly linked through Bt costs and indebtedness).
Gruère and Sengupta (2011)
23 12 July 2015 Srijit Mishra, NABARD Foundation Day Seminar
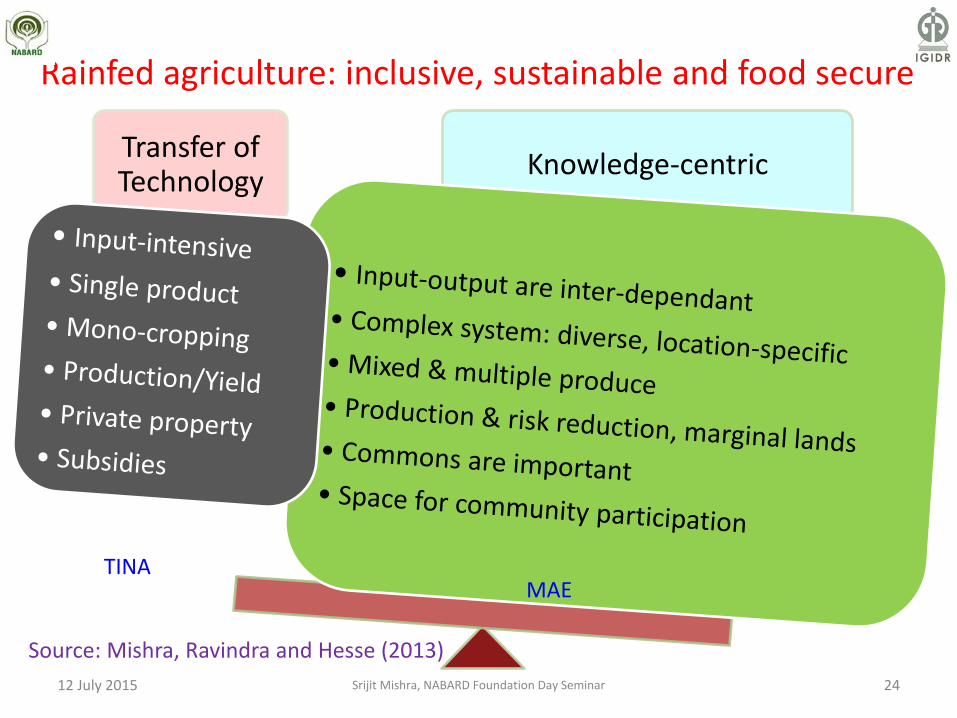
24
Rainfed agriculture: inclusive, sustainable and food secure
Transfer of Technology
Knowledge-centric
TINA MAE
12 July 2015
Source: Mishra, Ravindra and Hesse (2013)
Srijit Mishra, NABARD Foundation Day Seminar
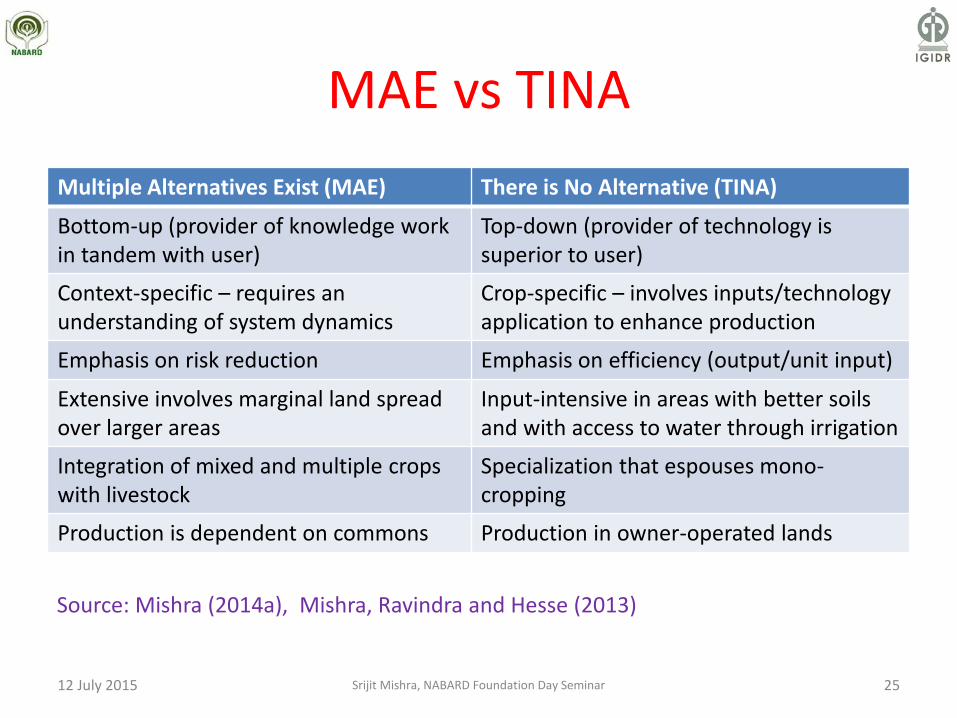
MAE vs TINA
Multiple Alternatives Exist (MAE) There is No Alternative (TINA)
Bottom-up (provider of knowledge work in tandem with user)
Top-down (provider of technology is superior to user)
Context-specific – requires an understanding of system dynamics
Crop-specific – involves inputs/technology application to enhance production
Emphasis on risk reduction Emphasis on efficiency (output/unit input)
Extensive involves marginal land spread over larger areas
Input-intensive in areas with better soils and with access to water through irrigation
Integration of mixed and multiple crops with livestock
Specialization that espouses mono-cropping
Production is dependent on commons Production in owner-operated lands
12 July 2015 25
Source: Mishra (2014a), Mishra, Ravindra and Hesse (2013)
Srijit Mishra, NABARD Foundation Day Seminar
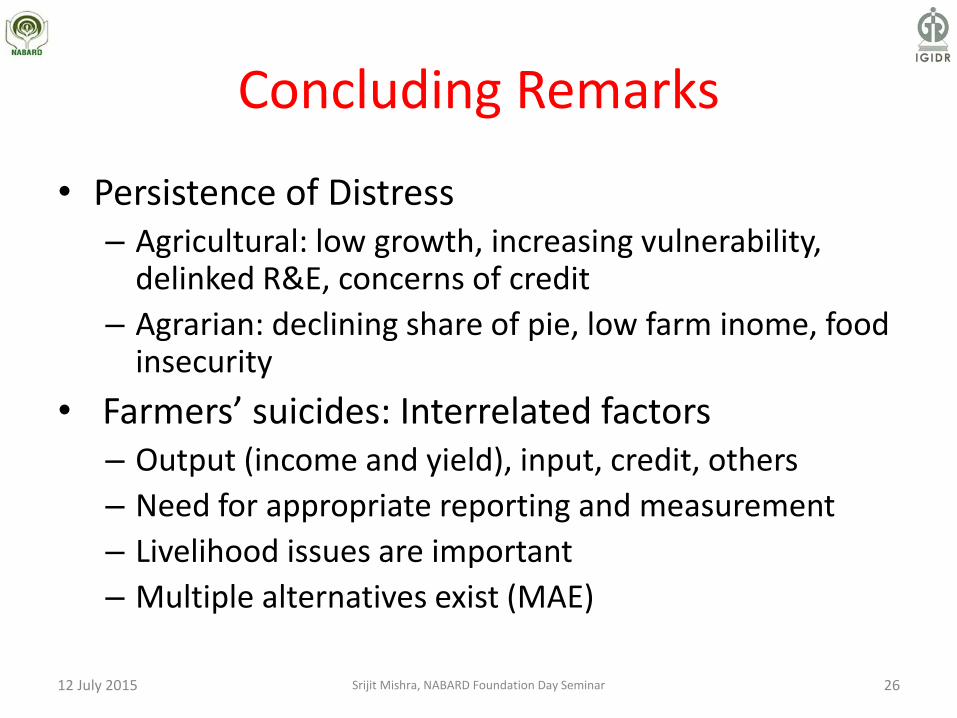
Concluding Remarks
• Persistence of Distress – Agricultural: low growth, increasing vulnerability,
delinked R&E, concerns of credit
– Agrarian: declining share of pie, low farm inome, food insecurity
• Farmers’ suicides: Interrelated factors – Output (income and yield), input, credit, others
– Need for appropriate reporting and measurement
– Livelihood issues are important
– Multiple alternatives exist (MAE)
12 July 2015 Srijit Mishra, NABARD Foundation Day Seminar 26
Comments and Questions
Email: [email protected]
Link to Paper
12 July 2015 Srijit Mishra, NABARD Foundation Day Seminar 27