National Transfer Account 1 National Transfer Account China NTA Workshop I NUPRI, Tokyo, Japan...
16
1 National Transfer Account National Transfer Account China NTA Workshop I NUPRI, Tokyo, Japan Qiulin CHEN 陈陈陈 CCER, Peking University Beijing, China October 27, 2005
-
Upload
erika-wiggins -
Category
Documents
-
view
228 -
download
0
Transcript of National Transfer Account 1 National Transfer Account China NTA Workshop I NUPRI, Tokyo, Japan...

1
Nation
al Tran
sfer Accou
nt
National Transfer
Account China
NTA Workshop I
NUPRI, Tokyo, Japan
Qiulin CHEN 陈秋霖
CCER, Peking University
Beijing, China
October 27, 2005
2
Nation
al Tran
sfer Accou
nt
Description
• Rural NTA -- Only rural individual survey data now – Household survey from the Department of Agriculture– Annually statistic data: Statistic Yearbook, and other
special yearbook– Population census data (aggregate)
• Has to combine the individual and household data – Has not cleaned it well. Should be more careful
• Household expenditure/income data– Can not reach some results required
A Practice -- Preparation for the researchA Practice -- Preparation for the research

3
Nation
al Tran
sfer Accou
nt
• Some results
• The great curve
• NTA Table
What we have?
4
Nation
al Tran
sfer Accou
nt
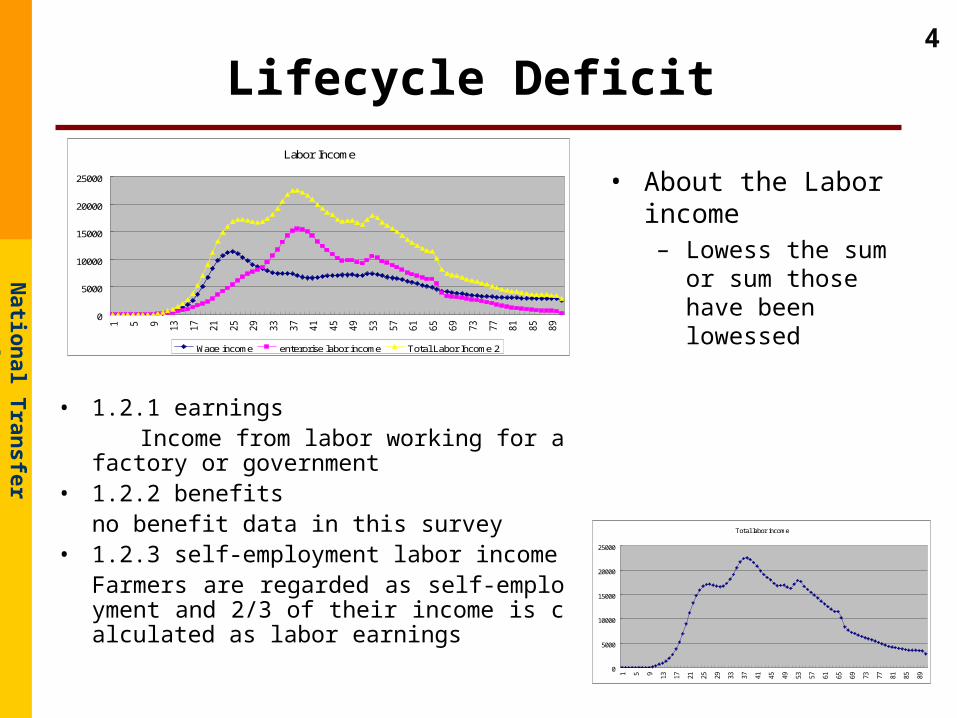
Lifecycle Deficit
• 1.2.1 earnings Income from labor working for a factory or gove
rnment• 1.2.2 benefits
no benefit data in this survey• 1.2.3 self-employment labor income
Farmers are regarded as self-employment and 2/3 of their income is calculated as labor earnings
Labor Income
0
5000
10000
15000
20000
25000
1 5 9 13 17 21 25 29 33 37 41 45 49 53 57 61 65 69 73 77 81 85 89
Wage income enterorise labor income Total Labor Income 2
Total labor income
0
5000
10000
15000
20000
25000
1 5 9 13 17 21 25 29 33 37 41 45 49 53 57 61 65 69 73 77 81 85 89
• About the Labor income– Lowess the sum or
sum those have been lowessed

5
Nation
al Tran
sfer Accou
nt
Lifecycle Deficit
• About the wage – The young have more labor
earning because many young rural people work outside the village, which is an important reason of “China Price”.
– Something may be wrong with the older group.
– Use estimation to deal with the wage because have no individual wage
– Using average of wage in an family will got another result.
Wage income (estimated)
0.00
2000.00
4000.00
6000.00
8000.00
10000.00
12000.00
1 4 7 10 13 16 19 22 25 28 31 34 37 40 43 46 49 52 55 58 61 64 67 70 73 76 79 82 85 88
wage by average
0
500
1000
1500
2000
2500
3000
3500
4000
1 5 9 13 17 21 25 29 33 37 41 45 49 53 57 61 65 69 73 77 81 85 89
6
Nation
al Tran
sfer Accou
nt
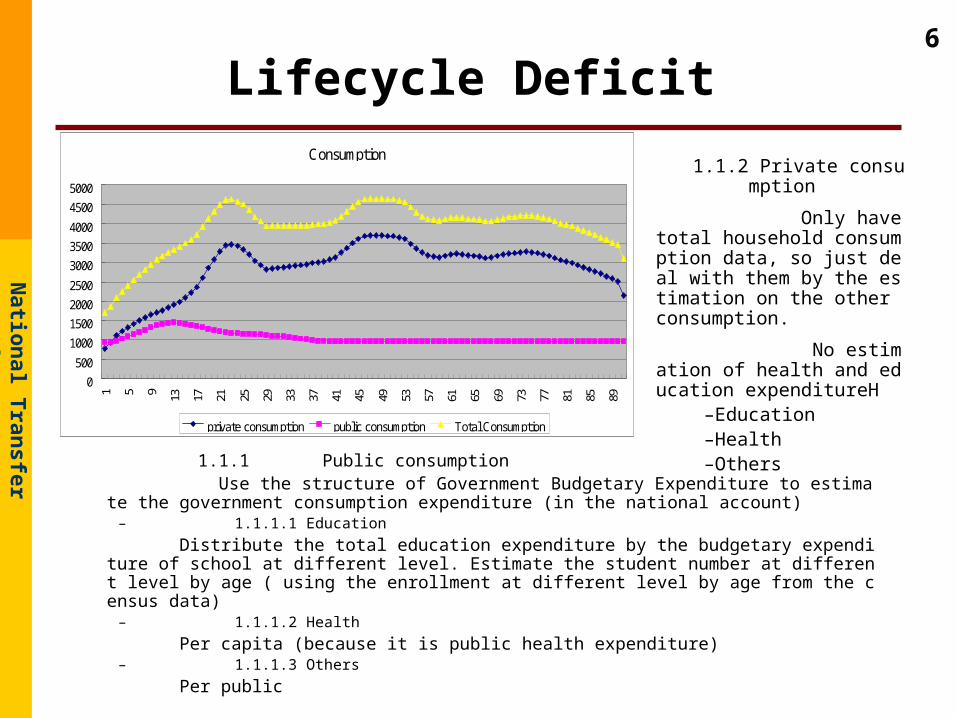
Lifecycle Deficit
1.1.1 Public consumption Use the structure of Government Budgetary Expenditure to estimate the government consumption
expenditure (in the national account)– 1.1.1.1 Education
Distribute the total education expenditure by the budgetary expenditure of school at different level. Estimate the student number at different level by age ( using the enrollment at different level by age from the census data)
– 1.1.1.2 Health
Per capita (because it is public health expenditure) – 1.1.1.3 Others
Per public
Consumption
0
500
1000
1500
2000
2500
3000
3500
4000
4500
5000
1 5 9 13 17 21 25 29 33 37 41 45 49 53 57 61 65 69 73 77 81 85 89
private consumption public consumption Total Consumption
1.1.2 Private consumption
Only have total household consumption data, so just deal with them by the estimation on the other consumption.
No estimation of health and education expenditureH
–Education–Health –Others

7
Nation
al Tran
sfer Accou
nt
Asset Reallocation
• 2.2 Private Asset Reallocations
• 2.2.1.1 Private capital inflow– Inflow: income from the capital and borrow from the bank
– Banks lend most money for production in rural China
Income on private capital and Credit inflow
0
1000
2000
3000
4000
5000
6000
7000
8000
9000
1 5 9 13 17 21 25 29 33 37 41 45 49 53 57 61 65 69 73 77 81 85 89
income from fixed capital capital income (1/ 3) borrow from the bank other borrow

8
Nation
al Tran
sfer Accou
nt
Asset Reallocation
• 2.2.1.2 Private capital onflow– Onflow: operational investment, bond and saving, interest payed – Banks lend most money for production in rural China
• 2.2.2 Private land– Land is owned by the government, the privatization is a hot topic now.
• 2.2.3 Credit– inflow
Private Investment
0
2000
4000
6000
8000
10000
12000
1 5 9 13 17 21 25 29 33 37 41 45 49 53 57 61 65 69 73 77 81 85 89
operational investment bond and saving interest
9
Nation
al Tran
sfer Accou
nt
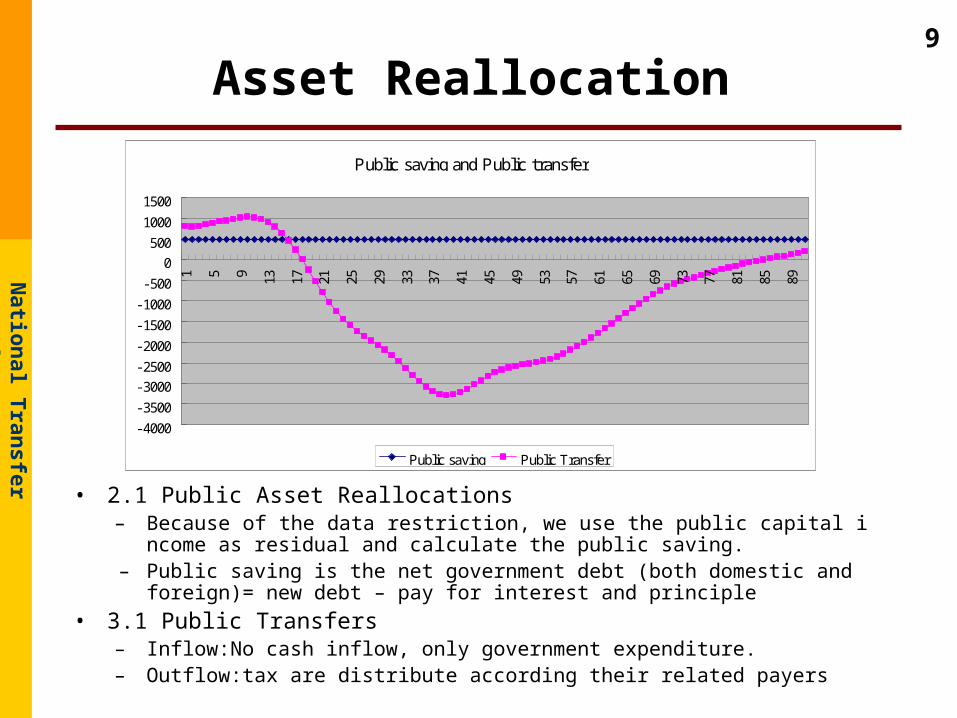
Asset Reallocation
• 2.1 Public Asset Reallocations– Because of the data restriction, we use the public capital income as residual and calc
ulate the public saving.– Public saving is the net government debt (both domestic and foreign)= new debt – p
ay for interest and principle
• 3.1 Public Transfers– Inflow:No cash inflow, only government expenditure.– Outflow:tax are distribute according their related payers
Public saving and Public transfer
-4000
-3500
-3000-2500
-2000
-1500
-1000
-500
0500
1000
15001 5 9 13 17 21 25 29 33 37 41 45 49 53 57 61 65 69 73 77 81 85 89
Public saving Public Transfer

10
Nation
al Tran
sfer Accou
nt
Transfers
• 3.2 Private Transfers– Intra-house transfer: can not estimate now. Need househol
d health/education/ other expenditure share – inter house transfer: support from relatives outside the fam
ily
Inter-house transfer
0
100
200
300
400
500
600
1 5 9 13 17 21 25 29 33 37 41 45 49 53 57 61 65 69 73 77 81 85 89

11
Nation
al Tran
sfer Accou
nt
The Great Cure of China- individual
• Why the older has no deficit of surplus?– Check carefully the consistency of the data– The estimation method
• household total consumption • Wage earning may be overvalued
The great curve now looks not very great! ?The great curve now looks not very great! ?
0
5000
10000
15000
20000
250000 5 10 15 20 25 30 35 40 45 50 55 60 65 70 75 80 85 90+
ConsumptionLabor Income

12
Nation
al Tran
sfer Accou
nt
NTA table of Rural China - aggregate
• Only aggregate the rural data (rural population)
• Population distribution: Use the current total population (2002) distributed by the population census data (2000)
Table 1. National Transfer Flow Account, country, year (currency and units), aggregate, nominal Total 0~9 10~19 20~29 30~39 40~49 50~59 60~69 70~79 80~89 90+
Lifecycle Deficit (60330.34) 2940.82 1452.51 (13778.51) (23586.75) (14571.17) (9062.43) (3252.29) (470.96) (3.52) 1.94Consumption 31454.92 2964.01 5623.66 5110.31 5790.18 4870.12 3329.88 2187.21 1251.39 307.90 20.25 Public 9057.45 1358.59 2221.18 1370.17 1488.33 1024.41 725.30 502.49 284.52 76.27 6.19 Private 22397.47 1605.42 3402.48 3740.14 4301.85 3845.72 2604.58 1684.72 966.87 231.62 14.06Less: Labor income 91785.27 23.19 4171.15 18888.82 29376.94 19441.29 12392.31 5439.50 1722.35 311.41 18.32ReallocationsAsset Reallocations (51509.47) 1842.47 371.34 (11741.11) (19339.62) (11852.18) (7493.00) (2811.52) (471.80) (14.23) 0.18 Public (42490.77) 1849.12 (277.62) (15298.65) (26200.33) (10139.80) 897.66 3509.45 2632.91 505.00 31.49 Income on Assets (38505.34) 2422.29 487.65 (14717.45) (25486.04) (9611.21) 1271.92 3768.73 2779.72 544.36 34.69 Less: Public Saving 3985.43 573.18 765.28 581.20 714.29 528.59 374.25 259.28 146.81 39.36 3.19 Private (9018.70) (6.65) 648.96 3557.54 6860.71 (1712.38) (8390.66) (6320.97) (3104.70) (519.23) (31.32) Income on Assets 30446.59 5.20 653.49 3860.71 10504.98 8353.71 4803.49 1764.78 459.46 40.77 0.00 Less: Private Saving 39465.29 11.85 4.53 303.17 3644.28 10066.09 13194.15 8085.75 3564.16 560.00 31.32Transfers (8820.88) 1098.35 1081.17 (2037.40) (4247.13) (2718.99) (1569.43) (440.77) 0.84 10.71 1.76 Public (9846.19) 1098.35 1081.06 (2056.43) (4377.28) (2977.19) (1803.57) (675.94) (133.93) (3.01) 1.76 Private 1025.31 0.00 0.11 19.03 130.15 258.20 234.15 235.17 134.77 13.72 0.00 Intervivos Bequests
13
Nation
al Tran
sfer Accou
nt
Problems
研• About definition
• About methodology
• About data
14
Nation
al Tran
sfer Accou
nt
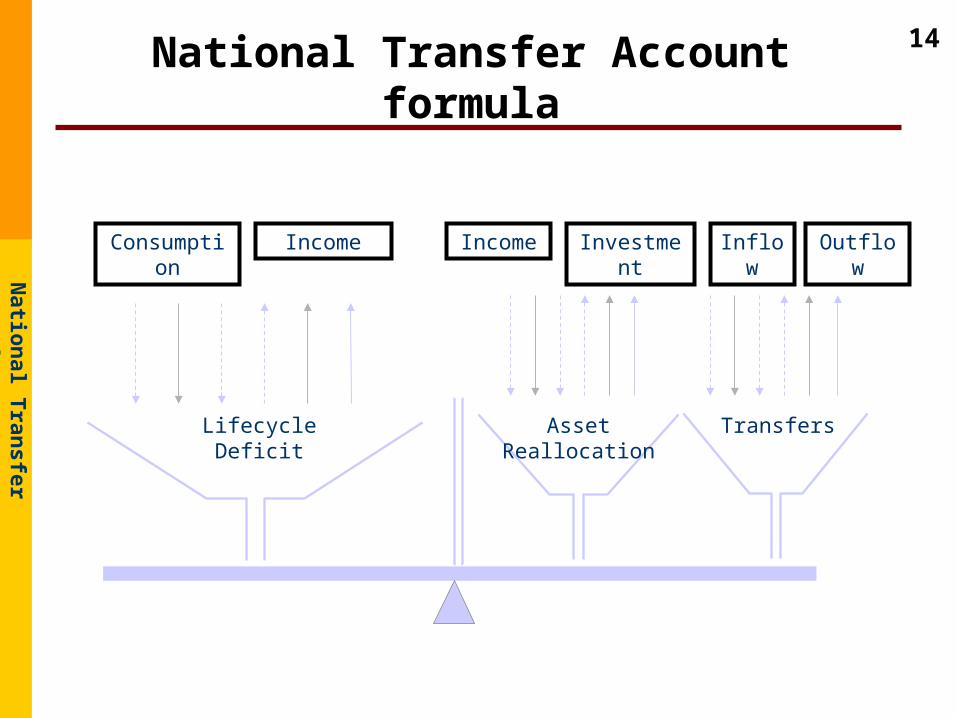
National Transfer Account formula
Lifecycle Deficit Asset Reallocation Transfers
IncomeConsumption Income Investment OutflowInflow

15
Nation
al Tran
sfer Accou
nt
What’s going on?
• Access of proper database
– Population census data
– Expenditure survey data
– Health service data
• Adjusting statistical items to NTA account
– As a transitional country, there is a lot of policy and institutional factors
– As a big country, the difference among area may affect the consistency
• Theoretical discussion
– Lifecycle transfers in Marco-econ Model
• Method development
– Other way to solve coming problems

16
Nation
al Tran
sfer Accou
nt Tha
nks
Welcome to CHINA
Peking Univ.CCER
谢谢
Thanks!