National Statistics - Yeongam · 2014. 11. 10. · National Statistics ß³ 577 1. SUMMARY OF...
116
ⅩⅦ. 전국통계 National Statistics
Transcript of National Statistics - Yeongam · 2014. 11. 10. · National Statistics ß³ 577 1. SUMMARY OF...
ⅩⅦ. 전국통계
National Statistics

ⅩⅦ . 전국통계576
1. 전국행정구역총괄
단위:개소 면 적 구ㆍ시ㆍ군 GuㆍSiㆍGun 읍ㆍ면ㆍ동1) EupㆍMyeonㆍDong
(㎢) 시 군 구Gu 읍 면 동연 별시도별
구성비 자치 일반
Area Ratio Si Gun Autonomous Gu Eup Myeon Dong 2006 99,990.49 100.00 258 77 86 69 26 3,584 212 1,206 2,166 2007 100,032.73 100.00 258 77 86 69 26 3,562 212 1,205 2,145 2008 100,140.10 100.00 260 77 86 69 28 3,497 211 1,205 2,081 2009 100,207.98 100.00 260 77 86 69 28 3,468 214 1,196 2,058 2010 100,213.79 100.00 263 75 86 69 33 3,477 215 1,201 2,061 2011 100,222.44 100.00 263 76 85 69 33 3,476 216 1,192 2,068 2012 100,266.89 100.00 262 76 84 69 33 3,487 216 1,198 2,073 시 시 시 시 계 계 계 계 5,865.84 5,865.84 5,865.84 5,865.84 5.85 5.85 5.85 5.85 74 74 74 74 0 0 0 0 5 5 5 5 69 69 69 69 0 0 0 0 1,160 1,160 1,160 1,160 11 11 11 11 45 45 45 45 1,104 1,104 1,104 1,104
서울특별시 605.21 0.60 25 - - 25 - 423 - - 423 부산광역시 769.67 0.77 16 - 1 15 - 214 2 3 209 대구광역시 883.68 0.88 8 - 1 7 - 139 3 6 130 인천광역시 1,040.82 1.04 10 - 2 8 - 146 1 19 126 광주광역시 501.18 0.50 5 - - 5 - 94 - - 94 대전광역시 540.25 0.54 5 - - 5 - 77 - - 77 울산광역시 1,060.19 1.06 5 - 1 4 - 56 4 8 44 세종특별자치시 464.84 0.46 - - - - - 11 1 9 1
도 도 도 도 계 계 계 계 94,401.05 94,401.05 94,401.05 94,401.05 94.15 94.15 94.15 94.15 188 188 188 188 76 76 76 76 79 79 79 79 - - - - 33 33 33 33 2,327 2,327 2,327 2,327 205 205 205 205 1,153 1,153 1,153 1,153 969 969 969 969 경 기 도 10,170.91 10.14 51 27 4 - 20 547 32 109 406 강 원 도 16,873.50 16.83 18 7 11 - - 193 24 95 74 충청북도 7,406.17 7.39 14 3 9 - 2 153 15 87 51 충청남도 8,204.00 8.18 17 8 7 - 2 205 24 137 44 전라북도 8,066.77 8.05 16 6 8 - 2 241 14 145 82 전라남도 12,266.87 12.23 22 5 17 - - 296 33 196 67 경상북도 19,028.74 18.98 25 10 13 - 2 331 36 202 93 경상남도 10,534.80 10.51 23 8 10 - 5 318 20 177 121 제 주 도 1,849.29 1.84 2 2 - - - 43 7 5 31
주:1) 읍ㆍ면ㆍ동합계에법정동수는제외. 2) 통리 합계에 법정리수 제외. 3) 12.31현재 주민등록인구통계.(외국인 인구 제외, 1998년부터 외국인 세대수 제외)자료 : 안전행정부 『안전행정 통계연보』
National Statistics 577
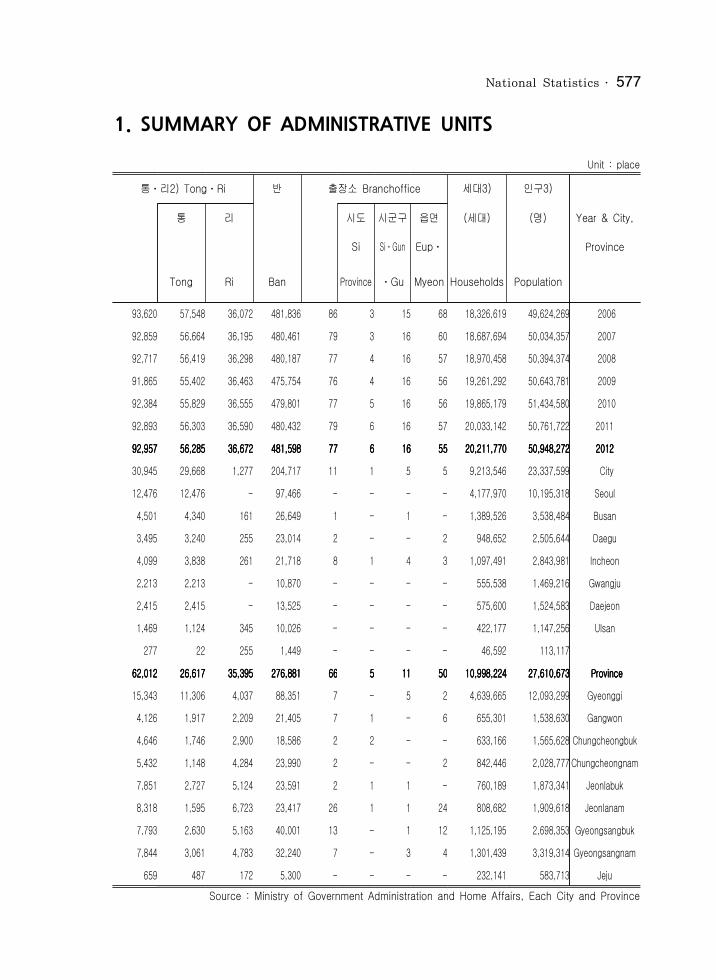
1. SUMMARY OF ADMINISTRATIVE UNITS
Unit : place통ㆍ리2) TongㆍRi 반 출장소 Branchoffice 세대3) 인구3)
통 리 시도 시군구 읍면 (세대) (명) Year & City,
Si SiㆍGun Eupㆍ Province
Tong Ri Ban Province ㆍGu Myeon Households Population
93,620 57,548 36,072 481,836 86 3 15 68 18,326,619 49,624,269 2006 92,859 56,664 36,195 480,461 79 3 16 60 18,687,694 50,034,357 2007 92,717 56,419 36,298 480,187 77 4 16 57 18,970,458 50,394,374 2008 91,865 55,402 36,463 475,754 76 4 16 56 19,261,292 50,643,781 2009 92,384 55,829 36,555 479,801 77 5 16 56 19,865,179 51,434,580 2010 92,893 56,303 36,590 480,432 79 6 16 57 20,033,142 50,761,722 201192,95792,95792,95792,957 56,28556,28556,28556,285 36,67236,67236,67236,672 481,598481,598481,598481,598 77777777 6666 16161616 55555555 20,211,77020,211,77020,211,77020,211,770 50,948,27250,948,27250,948,27250,948,272 201220122012201230,945 29,668 1,277 204,717 11 1 5 5 9,213,546 23,337,599 City
12,476 12,476 - 97,466 - - - - 4,177,970 10,195,318 Seoul 4,501 4,340 161 26,649 1 - 1 - 1,389,526 3,538,484 Busan 3,495 3,240 255 23,014 2 - - 2 948,652 2,505,644 Daegu 4,099 3,838 261 21,718 8 1 4 3 1,097,491 2,843,981 Incheon 2,213 2,213 - 10,870 - - - - 555,538 1,469,216 Gwangju 2,415 2,415 - 13,525 - - - - 575,600 1,524,583 Daejeon 1,469 1,124 345 10,026 - - - - 422,177 1,147,256 Ulsan
277 22 255 1,449 - - - - 46,592 113,117 62,01262,01262,01262,012 26,61726,61726,61726,617 35,39535,39535,39535,395 276,881276,881276,881276,881 66 66 66 66 5 5 5 5 11 11 11 11 50 50 50 50 10,998,22410,998,22410,998,22410,998,224 27,610,67327,610,67327,610,67327,610,673 ProvinceProvinceProvinceProvince
15,343 11,306 4,037 88,351 7 - 5 2 4,639,665 12,093,299 Gyeonggi 4,126 1,917 2,209 21,405 7 1 - 6 655,301 1,538,630 Gangwon 4,646 1,746 2,900 18,586 2 2 - - 633,166 1,565,628 Chungcheongbuk 5,432 1,148 4,284 23,990 2 - - 2 842,446 2,028,777 Chungcheongnam 7,851 2,727 5,124 23,591 2 1 1 - 760,189 1,873,341 Jeonlabuk 8,318 1,595 6,723 23,417 26 1 1 24 808,682 1,909,618 Jeonlanam 7,793 2,630 5,163 40,001 13 - 1 12 1,125,195 2,698,353 Gyeongsangbuk 7,844 3,061 4,783 32,240 7 - 3 4 1,301,439 3,319,314 Gyeongsangnam
659 487 172 5,300 - - - - 232,141 583,713 JejuSource : Ministry of Government Administration and Home Affairs, Each City and Province

ⅩⅦ . 전국통계578
2. 인 구 추 이
단위:천명
연 별
총조사1) 연앙추계인구2) 증가율 성 비 인구밀도 면 적 3) 북한인구4)
인 구 Estimates of midyearpopulation (㎢) Population
Census 남 여 Increase Sex Population of north
population Male Female rate ratio density Area korea 1960 25,012 12,551 12,462 - 100.7 254.1 98,431 10,600 1961 25,766 12,937 12,829 3.01 100.8 261.8 98,431 10,900 1962 26,513 13,321 13,192 2.90 101.0 269.4 98,431 11,140 1963 27,262 13,708 13,554 2.83 101.1 277.0 98,431 11,460 1964 27,984 14,082 13,902 2.65 101.3 284.3 98,431 11,770 1965 28,705 14,453 14,252 2.58 101.4 291.5 98,477 12,100 1966 29,160 - (14,684) (14,475) - (101.4) (296.1) 98,447 - 1966 29,436 14,830 14,606 2.55 101.5 298.9 98,477 12,440 1967 30,131 15,205 14,926 2.36 101.9 306.0 98,477 12,780 1968 30,838 15,576 15,262 2.35 102.1 313.1 98,477 13,150 1969 31,544 15,941 15,603 2.29 102.2 320.3 98,477 13,510 1970 31,466 - (15,796) (15,670) - (100.8) (320.4) 98,222 - 1970 32,241 16,309 15,932 2.21 102.4 328.2 98,222 14,905 1971 32,883 16,649 16,234 1.99 102.6 334.7 98,234 15,292 1972 33,505 16,955 16,550 1.89 102.4 340.2 98,484 15,683 1973 34,103 17,235 16,868 1.78 102.2 345.3 98,758 16,080 1974 34,692 17,514 17,178 1.73 102.0 351.0 98,824 16,388 1975 34,707 - (17,461) (17,245) - (101.3) (351.3) 98,807 - 1975 35,281 17,766 17,515 1.70 101.4 357.1 98,807 16,646 1976 35,849 18,059 17,790 1.61 101.5 362.8 98,799 16,871 1977 36,412 18,349 18,062 1.57 101.5 368.3 98,859 17,083 1978 36,969 18,637 18,332 1.53 101.7 373.6 98,955 17,303 1979 37,534 18,929 18,605 1.53 101.7 379.3 98,966 17,434 1980 37,436 - (18,767) (18,669) - (100.5) (378.2) 98,992 -1980 38,124 19,236 18,888 1.57 101.8 385.1 98,992 17,6221981 38,723 19,536 19,187 1.57 101.8 391.1 99,016 17,8661982 39,326 19,837 19,489 1.56 101.8 397.1 99,022 18,1681983 39,910 20,129 19,781 1.49 101.8 402.8 99,091 18,5281984 40,406 20,375 20,031 1.24 101.7 407.7 99,117 18,8281985 40,448 - (20,244) (20,205) (100.2) (408.0) 99,143 - 40,806 20,576 20,230 0.99 101.7 411.6 99,143 19,097
주 : 1) 외국인 포함. 2) 59년까지는 연말상주인구조사, 60년이후는 추계인구, () 내는 총조사 결과임.

National Statistics 579
2. POPULATION TREND
Unit : 1,000 persons 총조사1) 연앙추계인구2) 증가율 성 비 인구밀도 면 적 3) 북한인구4)
Year인 구 Estimates of midyear population (㎢) Population
Census 남 여 Increase Sex Population of north
population Male Female rate ratio density Area korea41,214 20,772 20,442 1.00 101.6 415.6 99,173 19,339 1986 41,622 20,960 20,662 0.99 101.4 419.5 99,222 19,559 1987 42,031 21,155 20,876 0.98 101.3 423.5 99,237 19,762 1988 42,449 21,357 21,092 101.3 427.6 99,263 19,977 1989 42,869 21,568 21,301 0.99 101.3 431.8 99,274 20,221 1990
43,411 - (21,782) (21,629) - (100.7) (437.3) 99,274 - 1990 43,296 21,784 21,512 0.99 101.3 436.0 99,300 20,495 1991 43,748 22,014 21,734 1.04 101.3 440.5 99,314 20,798 1992 44,195 22,243 21,952 1.02 101.3 444.7 99,392 21,123 1993 44,642 22,472 22,169 1.01 101.4 449.1 99,394 21,353 1994 45,093 22,705 22,388 1.01 101.4 454.3 99,268 21,543 1995
44,609 - (22,389) (22,219) (100.8) (449.4) 99,268 - 1995 45,525 22,925 22,600 0.96 101.4 458.4 99,313 21,684 1996 45,954 23,148 22,805 0.94 101.5 462.4 99,373 21,810 1997 46,287 23,296 22,991 0.72 101.3 465.6 99,408 21,942 1998 46,617 23,458 23,159 101.3 468.8 99,434 22,082 1999 47,008 23,667 23,341 0.84 101.4 470.9 99,816 22,175 2000
46,136 - (23,159) (22,978) - (100.7) (463.9) 99,816 - 2000 47,357 23,843 23,514 0.74 101.4 474.3 99,852 22,253 2001 47,622 23,970 23,652 0.56 101.3 476.7 99,900 22,369 2002 47,859 24,090 23,770 0.50 101.3 480.5 99,601 22,522 2003 48,039 24,165 23,874 101.2 482.2 99,617 22,709 2004 48,138 24,191 23,947 0.21 101.0 483.1 99,646 22,928 2005
47,279 - (23,624) (23,655) - (99.9) (474.5) 99,646 - 200548,372 24,303 24,069 0.49 101.0 483.8 99,990 23,079 200648,598 24,410 24,188 0.47 100.9 485.8 100,033 23,200 200748,949 24,576 24,373 0.72 100.8 488.8 100,139 23,298 200849,182 24,665 24,518 0.48 100.6 490.8 100,208 23,380 2009
48,580 49,410 24,758 24,653 0.46 100.4 493.9 100,212 24,187 201049,779 24,942 24,837 0.74 100.4 496.7 100,221 24,308 201150,00450,00450,00450,004 25,040 25,040 25,040 25,040 24,965 24,965 24,965 24,965 0.450.450.450.45 100.3100.3100.3100.3 498.7 498.7 498.7 498.7 100,267100,267100,267100,267 24,42724,42724,42724,427 2012201220122012
Source : National Statistical Office
ⅩⅦ . 전국통계580
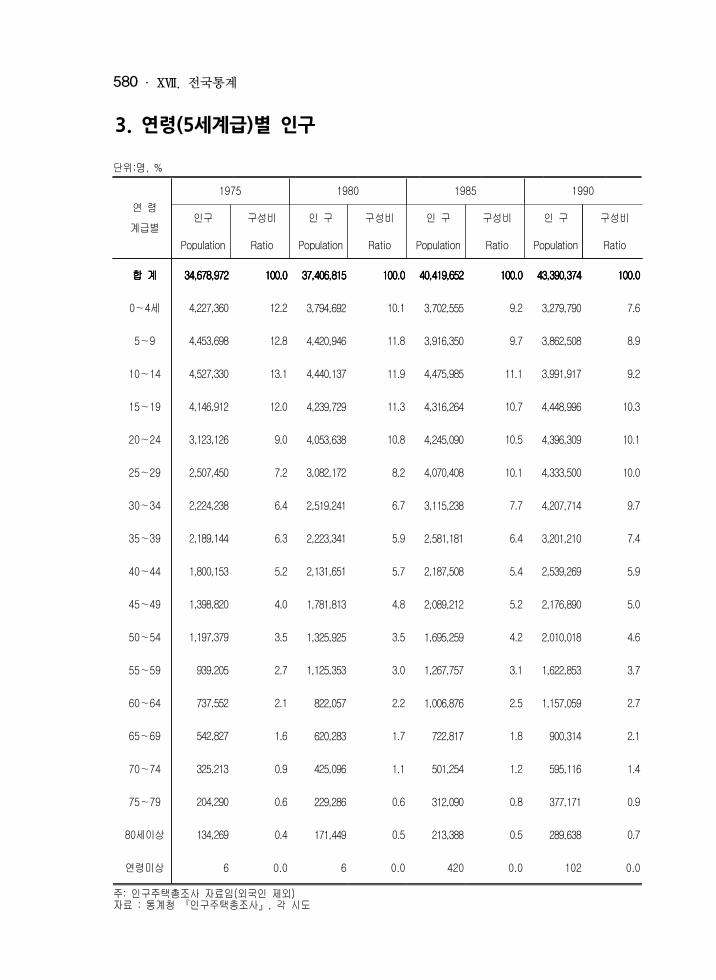
3. 연령(5세계급)별 인구
단위:명, % 1975 1980 1985 1990
연 령 인구 구성비 인 구 구성비 인 구 구성비 인 구 구성비 계급별 Population Ratio Population Ratio Population Ratio Population Ratio
합 합 합 합 계 계 계 계 34,678,972 34,678,972 34,678,972 34,678,972 100.0 100.0 100.0 100.0 37,406,815 37,406,815 37,406,815 37,406,815 100.0 100.0 100.0 100.0 40,419,652 40,419,652 40,419,652 40,419,652 100.0 100.0 100.0 100.0 43,390,374 43,390,374 43,390,374 43,390,374 100.0 100.0 100.0 100.0
0∼4세 4,227,360 12.2 3,794,692 10.1 3,702,555 9.2 3,279,790 7.6
5∼9 4,453,698 12.8 4,420,946 11.8 3,916,350 9.7 3,862,508 8.9
10∼14 4,527,330 13.1 4,440,137 11.9 4,475,985 11.1 3,991,917 9.2
15∼19 4,146,912 12.0 4,239,729 11.3 4,316,264 10.7 4,448,996 10.3
20∼24 3,123,126 9.0 4,053,638 10.8 4,245,090 10.5 4,396,309 10.1
25∼29 2,507,450 7.2 3,082,172 8.2 4,070,408 10.1 4,333,500 10.0
30∼34 2,224,238 6.4 2,519,241 6.7 3,115,238 7.7 4,207,714 9.7
35∼39 2,189,144 6.3 2,223,341 5.9 2,581,181 6.4 3,201,210 7.4
40∼44 1,800,153 5.2 2,131,651 5.7 2,187,508 5.4 2,539,269 5.9
45∼49 1,398,820 4.0 1,781,813 4.8 2,089,212 5.2 2,176,890 5.0
50∼54 1,197,379 3.5 1,325,925 3.5 1,695,259 4.2 2,010,018 4.6
55∼59 939,205 2.7 1,125,353 3.0 1,267,757 3.1 1,622,853 3.7
60∼64 737,552 2.1 822,057 2.2 1,006,876 2.5 1,157,059 2.7
65∼69 542,827 1.6 620,283 1.7 722,817 1.8 900,314 2.1
70∼74 325,213 0.9 425,096 1.1 501,254 1.2 595,116 1.4
75∼79 204,290 0.6 229,286 0.6 312,090 0.8 377,171 0.9
80세이상 134,269 0.4 171,449 0.5 213,388 0.5 289,638 0.7
연령미상 6 0.0 6 0.0 420 0.0 102 0.0 주: 인구주택총조사 자료임(외국인 제외) 자료 : 통계청 『인구주택총조사』, 각 시도
National Statistics 581
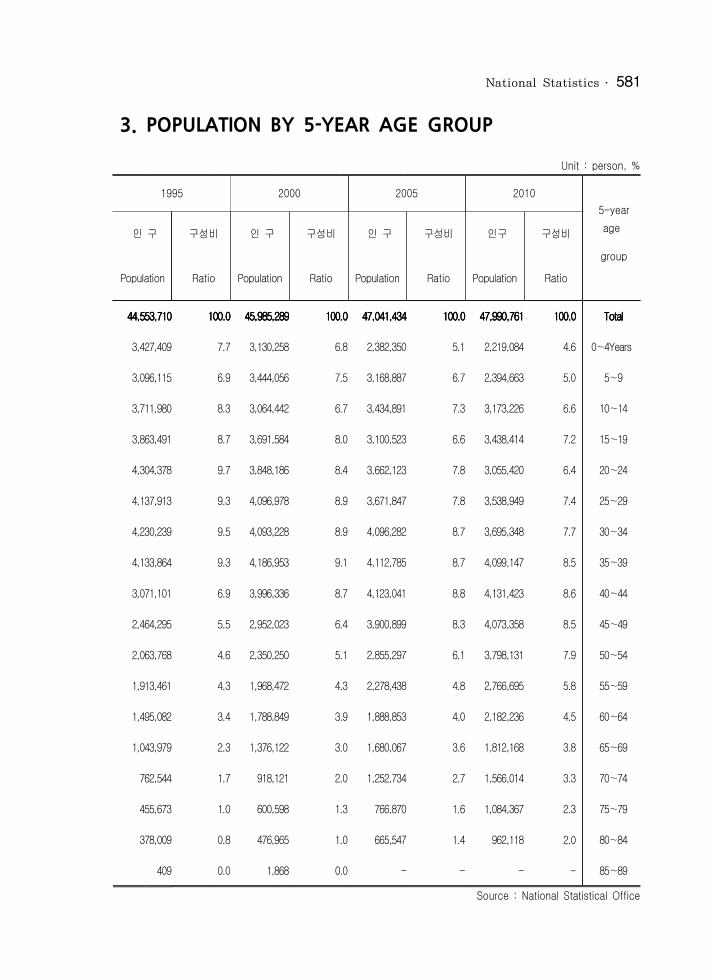
3. POPULATION BY 5-YEAR AGE GROUP
Unit : person, %1995 2000 2005 2010
5-year age 인 구 구성비 인 구 구성비 인 구 구성비 인구 구성비
group Population Ratio Population Ratio Population Ratio Population Ratio
44,553,71044,553,71044,553,71044,553,710 100.0100.0100.0100.0 45,985,28945,985,28945,985,28945,985,289 100.0100.0100.0100.0 47,041,43447,041,43447,041,43447,041,434 100.0100.0100.0100.0 47,990,76147,990,76147,990,76147,990,761 100.0100.0100.0100.0 Total Total Total Total
3,427,409 7.7 3,130,258 6.8 2,382,350 5.1 2,219,084 4.6 0∼4Years
3,096,115 6.9 3,444,056 7.5 3,168,887 6.7 2,394,663 5.0 5∼9
3,711,980 8.3 3,064,442 6.7 3,434,891 7.3 3,173,226 6.6 10∼14
3,863,491 8.7 3,691,584 8.0 3,100,523 6.6 3,438,414 7.2 15∼19
4,304,378 9.7 3,848,186 8.4 3,662,123 7.8 3,055,420 6.4 20∼24
4,137,913 9.3 4,096,978 8.9 3,671,847 7.8 3,538,949 7.4 25∼29
4,230,239 9.5 4,093,228 8.9 4,096,282 8.7 3,695,348 7.7 30∼34
4,133,864 9.3 4,186,953 9.1 4,112,785 8.7 4,099,147 8.5 35∼39
3,071,101 6.9 3,996,336 8.7 4,123,041 8.8 4,131,423 8.6 40∼44
2,464,295 5.5 2,952,023 6.4 3,900,899 8.3 4,073,358 8.5 45∼49
2,063,768 4.6 2,350,250 5.1 2,855,297 6.1 3,798,131 7.9 50∼54
1,913,461 4.3 1,968,472 4.3 2,278,438 4.8 2,766,695 5.8 55∼59
1,495,082 3.4 1,788,849 3.9 1,888,853 4.0 2,182,236 4.5 60∼64
1,043,979 2.3 1,376,122 3.0 1,680,067 3.6 1,812,168 3.8 65∼69
762,544 1.7 918,121 2.0 1,252,734 2.7 1,566,014 3.3 70∼74
455,673 1.0 600,598 1.3 766,870 1.6 1,084,367 2.3 75∼79
378,009 0.8 476,965 1.0 665,547 1.4 962,118 2.0 80∼84
409 0.0 1,868 0.0 - - - - 85∼89 Source : National Statistical Office
ⅩⅦ . 전국통계582
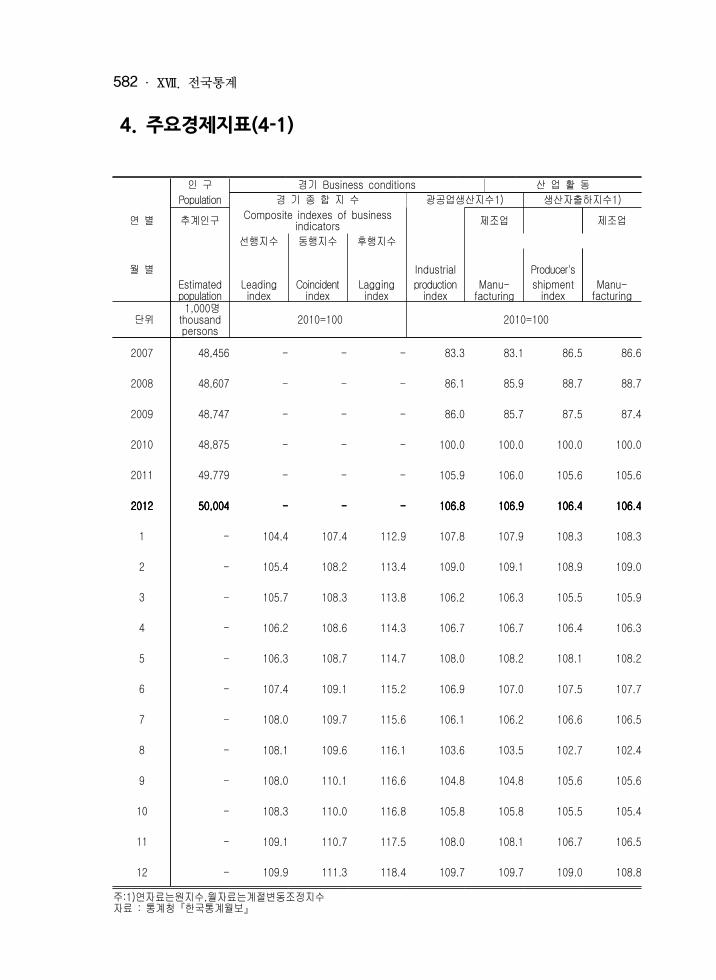
4. 주요경제지표(4-1)
인 구 경기 Business conditions 산 업 활 동
Population 경 기 종 합 지 수 광공업생산지수1) 생산자출하지수1) 연 별 추계인구 Composite indexes of business indicators 제조업 제조업
선행지수 동행지수 후행지수
월 별 Industrial Producer's Estimated Leading Coincident Lagging production Manu- shipment Manu-population index index index index facturing index facturing
단위 1,000명 thousand persons 2010=100 2010=100
2007 48,456 - - - 83.3 83.1 86.5 86.6
2008 48,607 - - - 86.1 85.9 88.7 88.7
2009 48,747 - - - 86.0 85.7 87.5 87.4
2010 48,875 - - - 100.0 100.0 100.0 100.0
2011 49,779 - - - 105.9 106.0 105.6 105.6
2012201220122012 50,00450,00450,00450,004 ---- ---- ---- 106.8106.8106.8106.8 106.9106.9106.9106.9 106.4106.4106.4106.4 106.4106.4106.4106.4
1 - 104.4 107.4 112.9 107.8 107.9 108.3 108.3
2 - 105.4 108.2 113.4 109.0 109.1 108.9 109.0
3 - 105.7 108.3 113.8 106.2 106.3 105.5 105.9
4 - 106.2 108.6 114.3 106.7 106.7 106.4 106.3
5 - 106.3 108.7 114.7 108.0 108.2 108.1 108.2
6 - 107.4 109.1 115.2 106.9 107.0 107.5 107.7
7 - 108.0 109.7 115.6 106.1 106.2 106.6 106.5
8 - 108.1 109.6 116.1 103.6 103.5 102.7 102.4
9 - 108.0 110.1 116.6 104.8 104.8 105.6 105.6
10 - 108.3 110.0 116.8 105.8 105.8 105.5 105.4
11 - 109.1 110.7 117.5 108.0 108.1 106.7 106.5
12 - 109.9 111.3 118.4 109.7 109.7 109.0 108.8주:1)연자료는원지수,월자료는계절변동조정지수 자료 : 통계청『한국통계월보』
National Statistics 583
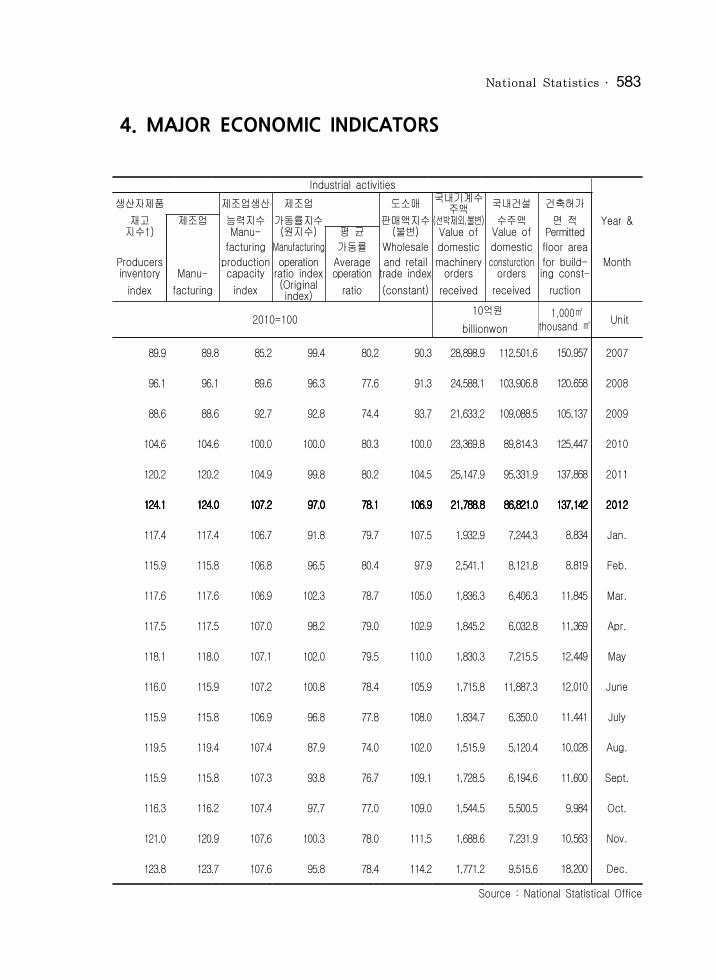
4. MAJOR ECONOMIC INDICATORS
Industrial activities
생산자제품 제조업생산 제조업 도소매 국내기계수주액 국내건설 건축허가재고 제조업 능력지수 가동률지수 판매액지수 (선박제외,불변) 수주액 면 적 Year &지수1) Manu- (원지수) 평 균 (불변) Value of Value of Permitted
facturing Manufacturing 가동률 Wholesale domestic domestic floor areaProducers production operation Average and retail machinery consturction for build- Monthinventory Manu- capacity ratio index operation trade index orders orders ing const-
index facturing index (Original index) ratio (constant) received received ruction
2010=100 10억원billionwon
1,000㎡ thousand ㎡ Unit
89.9 89.8 85.2 99.4 80.2 90.3 28,898.9 112,501.6 150,957 2007
96.1 96.1 89.6 96.3 77.6 91.3 24,588.1 103,906.8 120,658 2008
88.6 88.6 92.7 92.8 74.4 93.7 21,633.2 109,088.5 105,137 2009
104.6 104.6 100.0 100.0 80.3 100.0 23,369.8 89,814.3 125,447 2010
120.2 120.2 104.9 99.8 80.2 104.5 25,147.9 95,331.9 137,868 2011
124.1124.1124.1124.1 124.0124.0124.0124.0 107.2107.2107.2107.2 97.097.097.097.0 78.178.178.178.1 106.9106.9106.9106.9 21,788.821,788.821,788.821,788.8 86,821.086,821.086,821.086,821.0 137,142137,142137,142137,142 2012201220122012
117.4 117.4 106.7 91.8 79.7 107.5 1,932.9 7,244.3 8,834 Jan.
115.9 115.8 106.8 96.5 80.4 97.9 2,541.1 8,121.8 8,819 Feb.
117.6 117.6 106.9 102.3 78.7 105.0 1,836.3 6,406.3 11,845 Mar.
117.5 117.5 107.0 98.2 79.0 102.9 1,845.2 6,032.8 11,369 Apr.
118.1 118.0 107.1 102.0 79.5 110.0 1,830.3 7,215.5 12,449 May
116.0 115.9 107.2 100.8 78.4 105.9 1,715.8 11,887.3 12,010 June
115.9 115.8 106.9 96.8 77.8 108.0 1,834.7 6,350.0 11,441 July
119.5 119.4 107.4 87.9 74.0 102.0 1,515.9 5,120.4 10,028 Aug.
115.9 115.8 107.3 93.8 76.7 109.1 1,728.5 6,194.6 11,600 Sept.
116.3 116.2 107.4 97.7 77.0 109.0 1,544.5 5,500.5 9,984 Oct.
121.0 120.9 107.6 100.3 78.0 111.5 1,688.6 7,231.9 10,563 Nov.
123.8 123.7 107.6 95.8 78.4 114.2 1,771.2 9,515.6 18,200 Dec.Source : National Statistical Office

ⅩⅦ . 전국통계584
4. 주요경제지표(4-2)
노동ㆍ임금 Labor and wages경제활동인구
취업자2) 실업률 노동생산성지수3) 상용근로자월평균임금4)Monthly earnings regularemployees 연 별 제조업 IneicesofLabor
productivity 광공업 제조업 전산업 제조업
월 별 Economica- Emplo- Unemp- lly active yed Manu- loyment Manu- All Manu-
population persons facturing rate Industry facturing industries facturing 단위 1,000명
thousand persons % 2010=100 원 won
2007 24,216 23,433 4,014 3.2 - - - -
2008 24,347 23,577 3,963 3.2 88.3 88.3 2,939,605 2,871,119
2009 23,394 23,506 3,836 3.6 90.8 90.8 3,000,754 2,928,235
2010 24,748 23,829 4,028 3.7 100.0 100.0 3,195,551 3,189,945
2011 25,099 24,244 4,091 3.4 102.6 102.5 3,176,037 3,210,462
2012201220122012 25,501 25,501 25,501 25,501 24,681 24,681 24,681 24,681 4,1054,1054,1054,105 3.2 3.2 3.2 3.2 103.6 103.6 103.6 103.6 103.5 103.5 103.5 103.5 3,352,341 3,352,341 3,352,341 3,352,341 3,407,1903,407,1903,407,1903,407,190
1 24,585 23,732 4,034 3.5 - - - -
2 24,825 23,783 4,060 4.2 - - - -
3 25,210 24,265 4,018 3.7 103.4 102.7 3,405,164 3,488,273
4 25,653 24,758 4,027 3.5 - - - -
5 25,939 25,133 4,071 3.1 - - - -
6 25,939 25,117 4,084 3.2 104.5 104.7 3,167,059 3,147,024
7 25,901 25,106 4,114 3.1 - - - -
8 25,623 24,859 4,111 3.0 - - - -
9 25,755 25,003 4,153 2.9 100.6 100.7 3,427,824 3,527,052
10 25,787 25,069 4,188 2.8 - - - -
11 25,652 24,941 4,218 2.8 - - - -
12 25,139 24,402 4,183 2.9 105.8 105.7 3,411,174 3,467,906주:2)4)한국표준산업분류9차개정(2007년)기준 3) 2011년 이후 자료는 잠정치임 5) 평균소비성향={소비지출/(소득- 비소비지출)}*100, 6) 엥겔계수=(식료품비/소비지출)*100자료 : 통계청『한국통계월보』

National Statistics 585
4. MAJOR ECONOMIC INDICATORS(Cont'd)
도시가계 Husehold economy 물 가 Price
도시근로자 가계수지Income & expenditurenof salary and wage earners' household상품성질별 소비자물가지수 생산자물가지수
상품 서비스 Year &소득 가계지출 평균소비 엥겔계수6) 농림수산품 공산품 성 향5) Cons- Agriculture Manufac- Average umer Producer forest turing Month propensity Engel's price Commo- price & marine industry
Income Expenditure to consume Coefficient index dities Services index products products 1,000원 thousand
won 2010=100 2010=100 Unit
3,656.2 2,826.6 72.3 13.0 90.3 87.1 92.4 88.9 83.5 87.1 2007
3,900.6 3,025.6 72.5 13.2 94.5 92.5 95.9 96.5 84.4 97.6 2008
3,853.2 3,036.7 73.9 13.1 97.1 95.6 98.2 96.3 91.8 95.9 2009
4,007.7 3,209.5 75.3 13.1 100.0 100.0 100.0 100.0 100.0 100.0 2010
4,248.6 3,364.7 74.1 13.4 104.0 105.7 102.7 106.7 107.4 109.0 2011
4,492.44,492.44,492.44,492.4 3,494.83,494.83,494.83,494.8 72.4 72.4 72.4 72.4 13.5 13.5 13.5 13.5 106.3106.3106.3106.3 108.9108.9108.9108.9 104.2104.2104.2104.2 107.5107.5107.5107.5 108.3108.3108.3108.3 108.6108.6108.6108.6 2012201220122012
- - - - 105.7 107.9 103.9 107.7 107.3 109.4 Jan.
- - - - 106.1 108.5 104.2 108.4 113.4 110.2 Feb.
4,682.2 3,708.9 74.0 12.7 106.0 109.2 103.5 108.9 115.1 110.7 Mar.
- - - - 106.0 108.9 103.7 109.0 111.7 110.9 Apr.
- - - - 106.2 109.2 103.9 108.4 111.1 110.0 May
4,313.1 3,406.2 73.9 13.0 106.1 108.8 104.0 107.1 105.3 108.2 June
- - - - 105.9 107.9 104.2 106.6 104.9 107.4 July
- - - - 106.3 108.8 104.4 107.2 110.2 107.9 Aug.
4,583.8 3,548.9 71.8 14.7 107.0 110.4 104.4 107.6 112.5 108.4 Sept.
- - - - 106.9 109.8 104.6 106.8 104.7 107.4 Oct.
- - - - 106.5 108.9 104.6 106.1 100.5 106.5 Nov.
4,517.4 3,405.3 69.8 13.6 106.7 109.0 104.8 105.8 103.1 105.9 Dec.Source : National Statistical Office

ⅩⅦ . 전국통계586
4. 주요경제지표(4-3)
재 정 Financial 통화및금융 Money and banking 농가가격지수Farmer price index
수지수출입물가지수Export & import price index통 합 재 정 Consolidated central gov't statistics
화 폐연 별 발행액
농 가 농 가 수출물가 수입물가 총수입 총지출 순융자 통 합 판매가격 구입가격 재정수지 Bank-월 별 Received notes& by Paid by Export Import Total Total Net coin farmers farmers price price revenue expenditure lending Balance issue단위 2010=100 10 억원 billion won
2007 93.8 85.7 84.41 72.74 243,633 199,477 7,107 37,049 29,322
2008 91.9 94.4 102.84 99.06 250,713 229,403 5,480 15,831 30,758
2009 93.4 98.5 102.63 94.96 250,810 250,381 18,049 -17,620 37,346
2010 100.0 100.0 100.00 100.00 270,923 251,147 3,085 16,692 43,307
2011 107.6 103.5 100.24 111.60 292,323 269,768 3,926 18,629 48,658
2012201220122012 117.5 117.5 117.5 117.5 106.1 106.1 106.1 106.1 97.87 97.87 97.87 97.87 110.79 110.79 110.79 110.79 311,456 311,456 311,456 311,456 286,921 286,921 286,921 286,921 6,056 6,056 6,056 6,056 18,479 18,479 18,479 18,479 54,334 54,334 54,334 54,334
1 - - 100.36 114.43 40,806 27,995 1,425 11,386 52,614
2 - - 99.99 114.98 54,830 55,799 3,455 -4,424 49,675
3 122.9 106.6 100.62 116.89 85,585 92,490 4,400 -11,304 49,326
4 - - 101.04 115.63 120,100 115,269 4,543 287 49,777
5 - - 100.22 113.45 144,005 139,853 3,510 642 50,528
6 118.1 106.3 98.81 109.42 163,118 170,008 4,601 -11,492 50,227
7 - - 97.50 108.49 196,367 188,435 4,424 3,507 50,591
8 - - 97.47 110.30 214,569 205,422 4,568 4,579 50,681
9 114.2 105.9 97.62 111.10 237,451 229,584 4,175 3,692 55,524
10 - - 95.57 107.43 270,034 242,809 3,623 23,603 52,775
11 - - 92.94 104.25 287,816 257,616 3,467 26,734 53,214 주: 7) M1=현금통화(기념화폐 제외한 민간화폐보유액) + 요구불예금 및 수시입출식 저축성예금(투신사 MF포함) 8) M2=M1+기간물 예·적금 및 부금+시장형금융상품+실적배당형상품+금융채+기타(단, 장기금융상품 제외) 9) Lf=M2+예금취급기관의 2년이상 유동성상품+증권금융예수금 등+생명보험회사 보험계약준비금등(종전 M3) 9) Lf=M2+예금취급기관의 2년이상 유동성상품+증권금융예수금 등+생명보험회사 보험계약준비금등(종전 M3) 자료 : 통계청『한국통계월보』
National Statistics 587
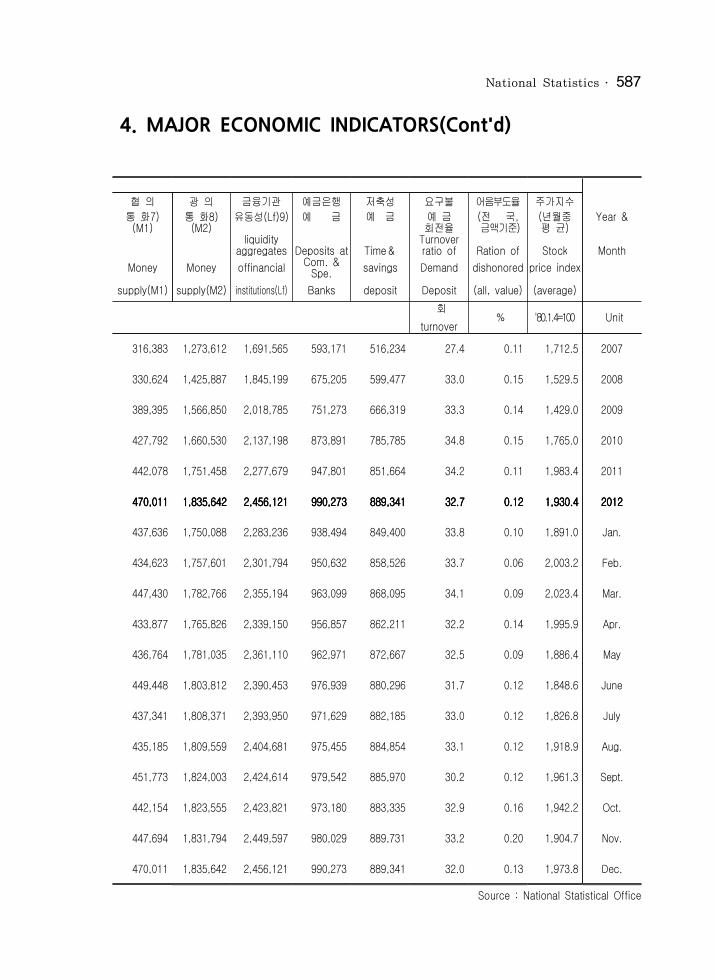
4. MAJOR ECONOMIC INDICATORS(Cont'd)
협 의 광 의 금융기관 예금은행 저축성 요구불 어음부도율 주가지수통 화7) 통 화8) 유동성(Lf)9) 예 금 예 금 예 금 (전 국, (년월중 Year &(M1) (M2) 회전율 금액기준) 평 균) liquidity Turnover aggregates Deposits at Time& ratio of Ration of Stock MonthMoney Money offinancial Com. & Spe. savings Demand dishonored price index
supply(M1) supply(M2) institutions(Lf) Banks deposit Deposit (all, value) (average) 회
turnover % '80.1.4=100 Unit
316,383 1,273,612 1,691,565 593,171 516,234 27.4 0.11 1,712.5 2007
330,624 1,425,887 1,845,199 675,205 599,477 33.0 0.15 1,529.5 2008
389,395 1,566,850 2,018,785 751,273 666,319 33.3 0.14 1,429.0 2009
427,792 1,660,530 2,137,198 873,891 785,785 34.8 0.15 1,765.0 2010
442,078 1,751,458 2,277,679 947,801 851,664 34.2 0.11 1,983.4 2011
470,011 470,011 470,011 470,011 1,835,642 1,835,642 1,835,642 1,835,642 2,456,121 2,456,121 2,456,121 2,456,121 990,273 990,273 990,273 990,273 889,341 889,341 889,341 889,341 32.7 32.7 32.7 32.7 0.120.120.120.12 1,930.4 1,930.4 1,930.4 1,930.4 2012201220122012
437,636 1,750,088 2,283,236 938,494 849,400 33.8 0.10 1,891.0 Jan.
434,623 1,757,601 2,301,794 950,632 858,526 33.7 0.06 2,003.2 Feb.
447,430 1,782,766 2,355,194 963,099 868,095 34.1 0.09 2,023.4 Mar.
433,877 1,765,826 2,339,150 956,857 862,211 32.2 0.14 1,995.9 Apr.
436,764 1,781,035 2,361,110 962,971 872,667 32.5 0.09 1,886.4 May
449,448 1,803,812 2,390,453 976,939 880,296 31.7 0.12 1,848.6 June
437,341 1,808,371 2,393,950 971,629 882,185 33.0 0.12 1,826.8 July
435,185 1,809,559 2,404,681 975,455 884,854 33.1 0.12 1,918.9 Aug.
451,773 1,824,003 2,424,614 979,542 885,970 30.2 0.12 1,961.3 Sept.
442,154 1,823,555 2,423,821 973,180 883,335 32.9 0.16 1,942.2 Oct.
447,694 1,831,794 2,449,597 980,029 889,731 33.2 0.20 1,904.7 Nov.
470,011 1,835,642 2,456,121 990,273 889,341 32.0 0.13 1,973.8 Dec.Source : National Statistical Office
ⅩⅦ . 전국통계588
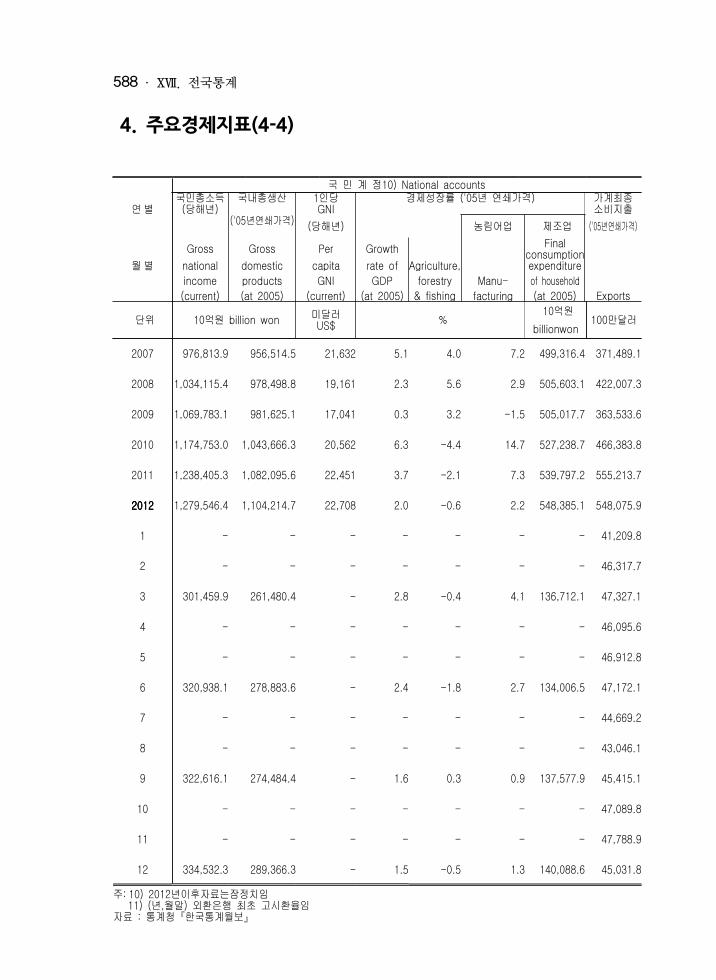
4. 주요경제지표(4-4)
국 민 계 정10) National accounts 국민총소득 국내총생산 1인당 경제성장률 ('05년 연쇄가격) 가계최종연 별 (당해년) ('05년연쇄가격) GNI 소비지출 (당해년) 농림어업 제조업 ('05년연쇄가격) Gross Gross Per Growth Final consumption월 별 national domestic capita rate of Agriculture, expenditure income products GNI GDP forestry Manu- of household (current) (at 2005) (current) (at 2005) & fishing facturing (at 2005) Exports
단위 10억원 billion won 미달러US$ % 10억원billionwon 100만달러
2007 976,813.9 956,514.5 21,632 5.1 4.0 7.2 499,316.4 371,489.1
2008 1,034,115.4 978,498.8 19,161 2.3 5.6 2.9 505,603.1 422,007.3
2009 1,069,783.1 981,625.1 17,041 0.3 3.2 -1.5 505,017.7 363,533.6
2010 1,174,753.0 1,043,666.3 20,562 6.3 -4.4 14.7 527,238.7 466,383.8
2011 1,238,405.3 1,082,095.6 22,451 3.7 -2.1 7.3 539,797.2 555,213.7
2012201220122012 1,279,546.4 1,104,214.7 22,708 2.0 -0.6 2.2 548,385.1 548,075.9
1 - - - - - - - 41,209.8
2 - - - - - - - 46,317.7
3 301,459.9 261,480.4 - 2.8 -0.4 4.1 136,712.1 47,327.1
4 - - - - - - - 46,095.6
5 - - - - - - - 46,912.8
6 320,938.1 278,883.6 - 2.4 -1.8 2.7 134,006.5 47,172.1
7 - - - - - - - 44,669.2
8 - - - - - - - 43,046.1
9 322,616.1 274,484.4 - 1.6 0.3 0.9 137,577.9 45,415.1
10 - - - - - - - 47,089.8
11 - - - - - - - 47,788.9
12 334,532.3 289,366.3 - 1.5 -0.5 1.3 140,088.6 45,031.8 주: 10) 2012년이후자료는잠정치임 11) (년,월말) 외환은행 최초 고시환율임자료 : 통계청『한국통계월보』
National Statistics 589
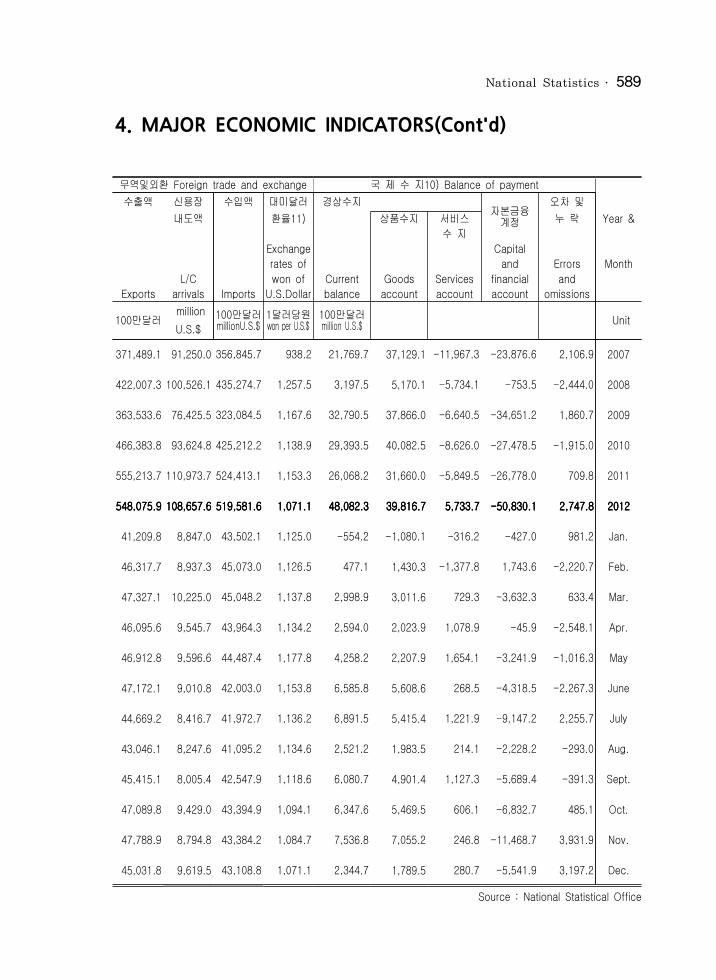
4. MAJOR ECONOMIC INDICATORS(Cont'd)
무역및외환 Foreign trade and exchange 국 제 수 지10) Balance of payment수출액 신용장 수입액 대미달러 경상수지 자본금융계정
오차 및내도액 환율11) 상품수지 서비스 누 락 Year &
수 지 Exchange Capital
rates of and Errors Month L/C won of Current Goods Services financial and
Exports arrivals Imports U.S.Dollar balance account account account omissions 100만달러 million
U.S.$ 100만달러millionU.S.$ 1달러당원 won per U.S.$ 100만달러 million U.S.$ Unit
371,489.1 91,250.0 356,845.7 938.2 21,769.7 37,129.1 -11,967.3 -23,876.6 2,106.9 2007
422,007.3 100,526.1 435,274.7 1,257.5 3,197.5 5,170.1 -5,734.1 -753.5 -2,444.0 2008
363,533.6 76,425.5 323,084.5 1,167.6 32,790.5 37,866.0 -6,640.5 -34,651.2 1,860.7 2009
466,383.8 93,624.8 425,212.2 1,138.9 29,393.5 40,082.5 -8,626.0 -27,478.5 -1,915.0 2010
555,213.7 110,973.7 524,413.1 1,153.3 26,068.2 31,660.0 -5,849.5 -26,778.0 709.8 2011
548,075.9 548,075.9 548,075.9 548,075.9 108,657.6 108,657.6 108,657.6 108,657.6 519,581.6519,581.6519,581.6519,581.6 1,071.11,071.11,071.11,071.1 48,082.348,082.348,082.348,082.3 39,816.739,816.739,816.739,816.7 5,733.75,733.75,733.75,733.7 -50,830.1-50,830.1-50,830.1-50,830.1 2,747.82,747.82,747.82,747.8 2012201220122012
41,209.8 8,847.0 43,502.1 1,125.0 -554.2 -1,080.1 -316.2 -427.0 981.2 Jan.
46,317.7 8,937.3 45,073.0 1,126.5 477.1 1,430.3 -1,377.8 1,743.6 -2,220.7 Feb.
47,327.1 10,225.0 45,048.2 1,137.8 2,998.9 3,011.6 729.3 -3,632.3 633.4 Mar.
46,095.6 9,545.7 43,964.3 1,134.2 2,594.0 2,023.9 1,078.9 -45.9 -2,548.1 Apr.
46,912.8 9,596.6 44,487.4 1,177.8 4,258.2 2,207.9 1,654.1 -3,241.9 -1,016.3 May
47,172.1 9,010.8 42,003.0 1,153.8 6,585.8 5,608.6 268.5 -4,318.5 -2,267.3 June
44,669.2 8,416.7 41,972.7 1,136.2 6,891.5 5,415.4 1,221.9 -9,147.2 2,255.7 July
43,046.1 8,247.6 41,095.2 1,134.6 2,521.2 1,983.5 214.1 -2,228.2 -293.0 Aug.
45,415.1 8,005.4 42,547.9 1,118.6 6,080.7 4,901.4 1,127.3 -5,689.4 -391.3 Sept.
47,089.8 9,429.0 43,394.9 1,094.1 6,347.6 5,469.5 606.1 -6,832.7 485.1 Oct.
47,788.9 8,794.8 43,384.2 1,084.7 7,536.8 7,055.2 246.8 -11,468.7 3,931.9 Nov.
45,031.8 9,619.5 43,108.8 1,071.1 2,344.7 1,789.5 280.7 -5,541.9 3,197.2 Dec.Source : National Statistical Office
ⅩⅦ . 전국통계590
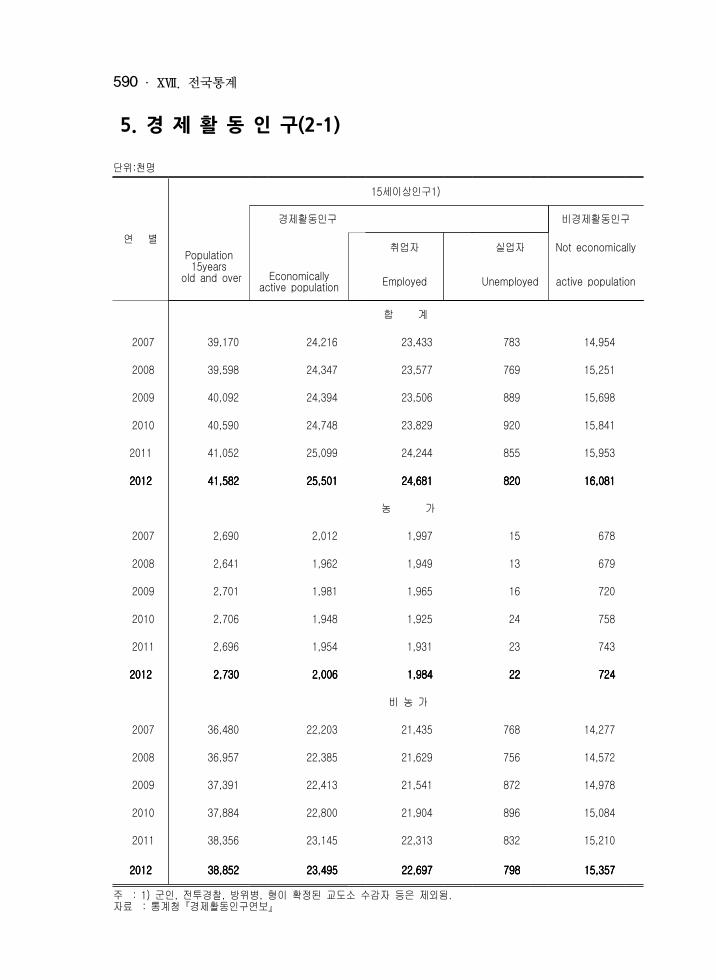
5. 경 제 활 동 인 구(2-1)
단위:천명
연 별
15세이상인구1) 경제활동인구 비경제활동인구
Population 15years old and over
취업자 실업자 Not economically
Economically active population Employed Unemployed active population
합 계 2007 39,170 24,216 23,433 783 14,954 2008 39,598 24,347 23,577 769 15,251 2009 40,092 24,394 23,506 889 15,698 2010 40,590 24,748 23,829 920 15,8412011 41,052 25,099 24,244 855 15,9532012201220122012 41,582 41,582 41,582 41,582 25,50125,50125,50125,501 24,68124,68124,68124,681 820820820820 16,08116,08116,08116,081 농 가
2007 2,690 2,012 1,997 15 678 2008 2,641 1,962 1,949 13 679 2009 2,701 1,981 1,965 16 720 2010 2,706 1,948 1,925 24 758 2011 2,696 1,954 1,931 23 7432012201220122012 2,730 2,730 2,730 2,730 2,0062,0062,0062,006 1,9841,9841,9841,984 22222222 724724724724 비 농 가
2007 36,480 22,203 21,435 768 14,277 2008 36,957 22,385 21,629 756 14,572 2009 37,391 22,413 21,541 872 14,978 2010 37,884 22,800 21,904 896 15,084 2011 38,356 23,145 22,313 832 15,210
2012201220122012 38,852 38,852 38,852 38,852 23,49523,49523,49523,495 22,69722,69722,69722,697 798798798798 15,35715,35715,35715,357주 : 1) 군인, 전투경찰, 방위병, 형이 확정된 교도소 수감자 등은 제외됨.자료 : 통계청『경제활동인구연보』
National Statistics 591
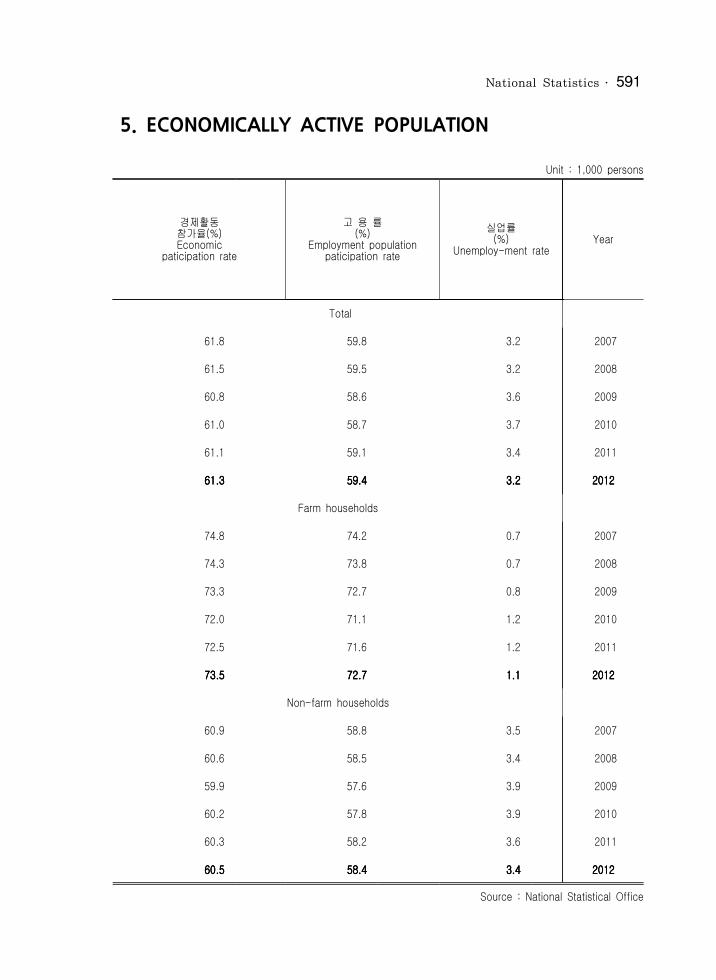
5. ECONOMICALLY ACTIVE POPULATION
Unit : 1,000 persons
경제활동참가율(%)Economicpaticipation rate
고 용 률(%)Employment populationpaticipation rate실업률(%)Unemploy-ment rate Year
Total 61.8 59.8 3.2 2007 61.5 59.5 3.2 2008 60.8 58.6 3.6 2009 61.0 58.7 3.7 2010 61.1 59.1 3.4 2011 61.3 61.3 61.3 61.3 59.4 59.4 59.4 59.4 3.2 3.2 3.2 3.2 2012201220122012
Farm households 74.8 74.2 0.7 2007 74.3 73.8 0.7 2008 73.3 72.7 0.8 2009 72.0 71.1 1.2 2010 72.5 71.6 1.2 2011 73.5 73.5 73.5 73.5 72.7 72.7 72.7 72.7 1.1 1.1 1.1 1.1 2012201220122012
Non-farm households 60.9 58.8 3.5 2007 60.6 58.5 3.4 2008 59.9 57.6 3.9 2009 60.2 57.8 3.9 2010 60.3 58.2 3.6 2011 60.5 60.5 60.5 60.5 58.4 58.4 58.4 58.4 3.4 3.4 3.4 3.4 2012201220122012
Source : National Statistical Office

ⅩⅦ . 전국통계592
5. 경제활동인구(2-2)
단위 : 천명
연 별
15 세 이상인구 1) 경제활동 고 용 률 실 업 률
Population 경제활동인구 Economically
비경제활동인구 참가율 (%) (%) (%)
15years active 취업자 실업자 Not economically Eonomic Employ- Unemploy- old and over population Employed Unemployed active population paticipation rate ment rate ment rate
남 자(Male) 2007 19,084 14,124 13,607 517 4,960 74.0 71.3 3.7 2008 19,324 14,208 13,703 505 5,117 73.5 70.9 3.6 2009 19,596 14,319 13,734 584 5,278 73.1 70.1 4.1 2010 19,849 14,492 13,915 577 5,356 73 70.1 42011 20,076 14,683 14,153 530 5,393 73.1 70.5 3.62012201220122012 20,32820,32820,32820,328 14,89114,89114,89114,891 14,38714,38714,38714,387 504504504504 5,4375,4375,4375,437 73.373.373.373.3 70.870.870.870.8 3.43.43.43.4
농 가 (Farm households) 2007 1,311 1,079 1,068 11 233 82.3 81.5 1.0 2008 1,296 1,059 1,051 8 237 81.7 81.1 0.8 2009 1,346 1,089 1,077 12 257 80.9 80.0 1.1 2010 1,344 1,086 1,071 15 259 80.8 79.7 1.4 2011 1,345 1,083 1,068 16 261 80.6 79.4 1.42012201220122012 1,3711,3711,3711,371 1,1191,1191,1191,119 1,1051,1051,1051,105 14141414 252252252252 81.681.681.681.6 80.780.780.780.7 1.21.21.21.2
비 농 가 (Non-farm households) 2007 17,772 13,045 12,539 506 4,727 73.4 70.6 3.9 2008 18,028 13,149 12,652 496 4,880 72.9 70.2 3.8 2009 18,251 13,230 12,658 572 5,021 72.5 69.4 4.3 2010 18,504 13,407 12,844 563 5,098 72.5 69.4 4.2 2011 18,731 13,600 13,085 514 5,131 72.6 69.9 3.82012201220122012 18,95818,95818,95818,958 13,77313,77313,77313,773 13,28213,28213,28213,282 491491491491 5,1855,1855,1855,185 72.672.672.672.6 70.170.170.170.1 3.63.63.63.6
주 : 1) 군인, 전투경찰, 방위병, 형이 확정된 교도소 수감자 등은 제외됨.자료 : 통계청『경제활동인구연보』

National Statistics 593
5. ECONOMICALLY ACTIVE POPULATION(Cont'd)
Unit : 1,000 persons15 세 이상인구 1) 경제활동 고 용 률 실 업 률
YearPopulation 경제활동인구 비경제활동인구 참가율(%) (%) (%)
15years Economically 취업자 실업자 Not economically Economic Employ- Unemploy- old and over active population Employed Unemployed active population paticipation rate ment rate ment rate
여 자 (Female) 20,086 10,092 9,826 266 9,994 50.2 48.9 2.6 2007 20,273 10,139 9,874 265 10,134 50.0 48.7 2.6 2008 20,496 10,076 9,772 304 10,420 49.2 47.7 3.0 2009 20,741 10,256 9,914 342 10,485 49.4 47.8 3.3 2010 20,976 10,416 10,091 325 10,561 49.7 48.1 3.1 2011 21,25421,25421,25421,254 10,60910,60910,60910,609 10,29410,29410,29410,294 316316316316 10,64510,64510,64510,645 49.949.949.949.9 48.448.448.448.4 3.0 3.0 3.0 3.0 2012201220122012
농 가 (Farm households) 1,379 934 929 4 445 67.7 67.4 0.5 2007 1,345 903 898 5 442 67.1 66.8 0.5 2008 1,355 892 888 4 463 65.8 65.5 0.5 2009 1,362 863 854 9 499 63.3 62.7 1.0 2010 1,352 870 863 7 481 64.4 63.8 0.8 2,011 1,3591,3591,3591,359 887887887887 878878878878 9999 472472472472 65.265.265.265.2 64.664.664.664.6 1.0 1.0 1.0 1.0 2011201120112011
비 농 가 (Non-farm households) 18,708 9,158 8,897 262 9,549 49.0 47.6 2.9 2007 18,929 9,236 8,976 260 9,692 48.8 47.4 2.8 2008 19,141 9,184 8,883 300 9,957 48.0 46.4 3.3 2009 19,380 9,394 9,060 334 9,986 48.5 46.7 3.6 2010 19,625 9,546 9,228 318 10,079 48.6 47 3.3 2,011 19,89419,89419,89419,894 9,7229,7229,7229,722 9,4159,4159,4159,415 307307307307 10,17210,17210,17210,172 48.948.948.948.9 47.347.347.347.3 3.2 3.2 3.2 3.2 2011201120112011
Source : National Statistical Office
ⅩⅦ . 전국통계594
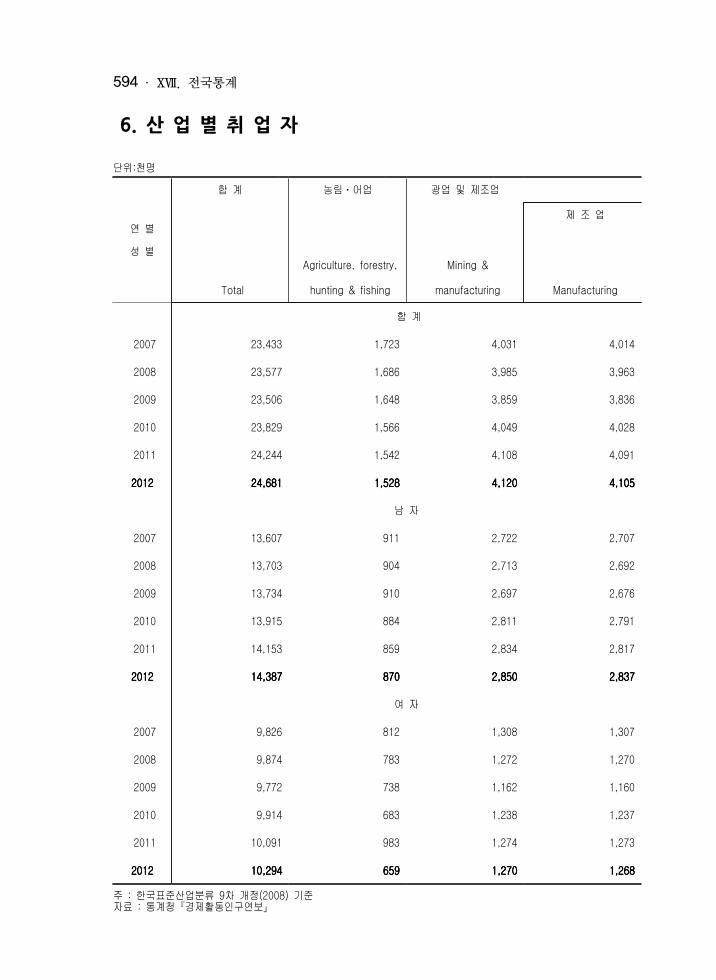
6. 산 업 별 취 업 자
단위:천명
연 별성 별
합 계 농림ㆍ어업 광업 및 제조업 제 조 업
Agriculture, forestry, Mining & Total hunting & fishing manufacturing Manufacturing
합 계 2007 23,433 1,723 4,031 4,014 2008 23,577 1,686 3,985 3,963 2009 23,506 1,648 3,859 3,836 2010 23,829 1,566 4,049 4,028 2011 24,244 1,542 4,108 4,0912012201220122012 24,68124,68124,68124,681 1,5281,5281,5281,528 4,1204,1204,1204,120 4,1054,1054,1054,105 남 자
2007 13,607 911 2,722 2,707 2008 13,703 904 2,713 2,692 2009 13,734 910 2,697 2,676 2010 13,915 884 2,811 2,791 2011 14,153 859 2,834 2,8172012201220122012 14,38714,38714,38714,387 870870870870 2,8502,8502,8502,850 2,8372,8372,8372,837 여 자
2007 9,826 812 1,308 1,307 2008 9,874 783 1,272 1,270 2009 9,772 738 1,162 1,160 2010 9,914 683 1,238 1,237 2011 10,091 983 1,274 1,2732012201220122012 10,29410,29410,29410,294 659659659659 1,2701,2701,2701,270 1,2681,2681,2681,268
주 : 한국표준산업분류 9차 개정(2008) 기준자료 : 통계청『경제활동인구연보』

National Statistics 595
6. EMPLOYED PERSONS BY INDUSTRY(BY 2000 CLASSIFICATION)
Unit : 1,000 persons사회간접자본 및
Year&Gender
기타서비스업 건설업 도소매·음식숙박업 전기·운수· 사업·개인공공통신·금융 서비스 및 기타 Wholesale and
Electricity,transport,
Business,personal, S.O.C & retail trade, Hotels public service
& other storage finance other services Construction and Restaurants
Total 17,679 1,849 5,722 2,773 7,336 2007 17,906 1,812 5,675 2,786 7,633 2008 17,998 1,720 5,536 2,761 7,981 2009 18,214 1,753 5,469 2,834 8,158 2010 18,595 1,751 5,492 2,956 8,396 2011 19,03319,03319,03319,033 1,7731,7731,7731,773 5,5955,5955,5955,595 2,9972,9972,9972,997 8,6688,6688,6688,668 2012201220122012
Male 9,973 1,677 2,629 2,062 3,606 2007
10,086 1,637 2,612 2,092 3,746 2008 10,127 1,557 2,610 2,092 3,868 2009 10,220 1,587 2,588 2,143 3,903 2010 10,460 1,595 2,660 2,216 3,990 2011 10,668 10,668 10,668 10,668 1,6261,6261,6261,626 2,7062,7062,7062,706 2,2382,2382,2382,238 4,0984,0984,0984,098 2012201220122012
Female 7,706 172 3,093 711 3,730 2007 7,820 175 3,063 694 3,888 2008 7,872 163 2,926 669 4,114 2009 7,994 166 2,882 691 4,255 2010 8,134 156 2,832 740 4,407 2011 8,3658,3658,3658,365 147147147147 2,8892,8892,8892,889 759759759759 4,5704,5704,5704,570 2012201220122012
Source : National Statistical Office

ⅩⅦ . 전국통계596
7. 직업별 취업자
단위 : 천명, % 합 계 관리자 전문가 및 관련 사무종사자 서비스종사자연 별 종사자 성 별 Total managers Professionals Clerks Service workers
합 계 2007 23,433 601 4,050 3,388 2,586 2008 23,577 549 4,382 3,486 2,655 2009 23,506 546 4,426 3,590 2,519 2010 23,829 562 4,571 3,739 2,434 2011 24,244 515 4,686 3,992 2,4682012201220122012 24,68124,68124,68124,681 464464464464 4,7914,7914,7914,791 4,1004,1004,1004,100 2,5462,5462,5462,546 남 자
2007 13,607 548 2,262 1,750 825 2008 13,703 497 2,481 1,802 862 2009 13,734 499 2,457 1,911 848 2010 13,915 509 2,542 1,971 819 2011 14,153 463 2,581 2,118 8332012201220122012 14,38714,38714,38714,387 413413413413 2,6192,6192,6192,619 2,1612,1612,1612,161 867867867867 여 자
2007 9,826 53 1,788 1,639 1,762 2008 9,874 52 1,901 1,684 1,792 2009 9,772 47 1,969 1,679 1,670 2010 9,914 53 2,030 1,768 1,614 2011 10,091 52 2,104 1,873 1,6352012201220122012 10,29410,29410,29410,294 51515151 2,1722,1722,1722,172 1,9391,9391,9391,939 1,6781,6781,6781,678
주 : 한국표준직업분류 6 차 개정(2007) 기준자료 : 통계청『경제활동인구연보』
National Statistics 597
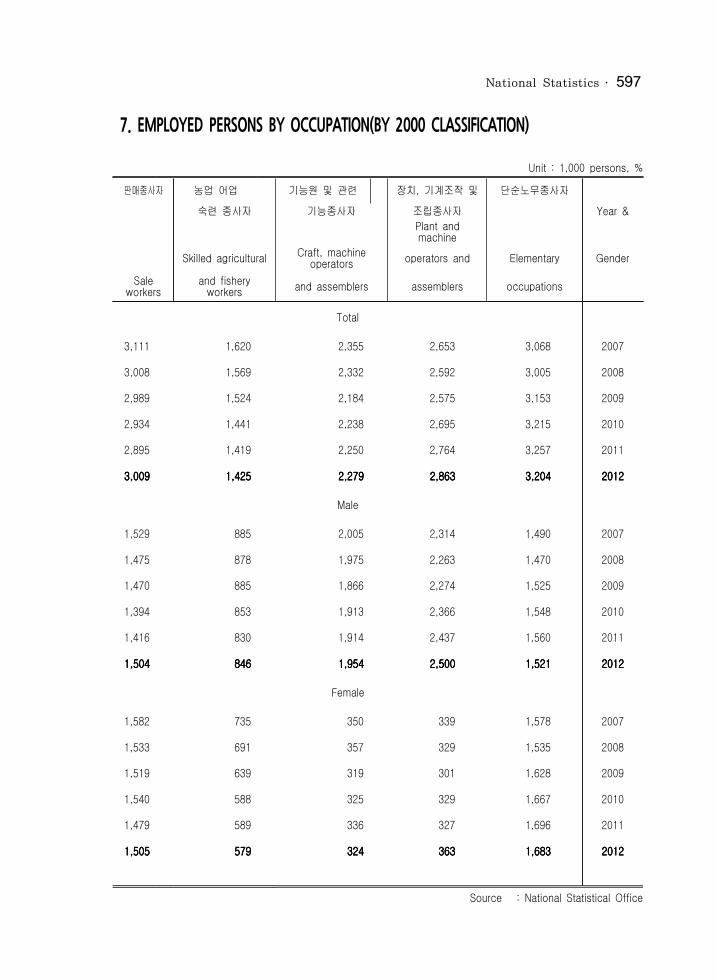
7. EMPLOYED PERSONS BY OCCUPATION(BY 2000 CLASSIFICATION)
Unit : 1,000 persons, %판매종사자 농업 어업 기능원 및 관련 장치, 기계조작 및 단순노무종사자
숙련 종사자 기능종사자 조립종사자 Year & Plant and machine Skilled agricultural Craft, machine operators operators and Elementary Gender
Sale workers and fishery workers and assemblers assemblers occupations
Total 3,111 1,620 2,355 2,653 3,068 20073,008 1,569 2,332 2,592 3,005 20082,989 1,524 2,184 2,575 3,153 20092,934 1,441 2,238 2,695 3,215 20102,895 1,419 2,250 2,764 3,257 20113,0093,0093,0093,009 1,4251,4251,4251,425 2,2792,2792,2792,279 2,8632,8632,8632,863 3,2043,2043,2043,204 2012201220122012
Male
1,529 885 2,005 2,314 1,490 20071,475 878 1,975 2,263 1,470 20081,470 885 1,866 2,274 1,525 20091,394 853 1,913 2,366 1,548 20101,416 830 1,914 2,437 1,560 20111,5041,5041,5041,504 846846846846 1,9541,9541,9541,954 2,5002,5002,5002,500 1,5211,5211,5211,521 2012201220122012
Female
1,582 735 350 339 1,578 20071,533 691 357 329 1,535 20081,519 639 319 301 1,628 20091,540 588 325 329 1,667 20101,479 589 336 327 1,696 20111,5051,5051,5051,505 579579579579 324324324324 363363363363 1,6831,6831,6831,683 2012201220122012
Source : National Statistical Office
ⅩⅦ . 전국통계598
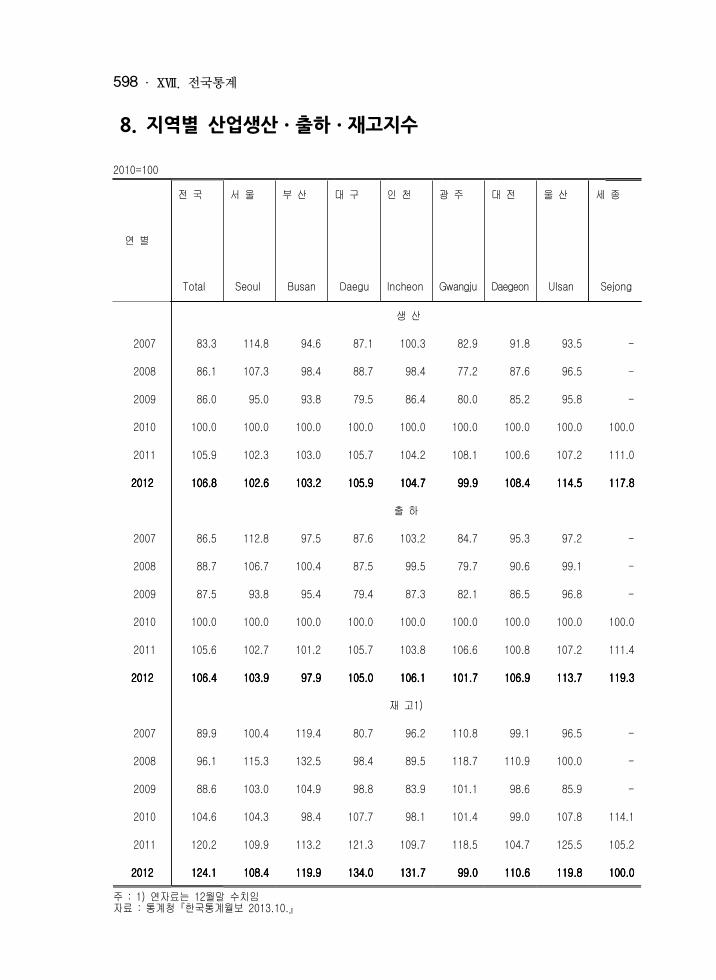
8. 지역별 산업생산ㆍ출하ㆍ재고지수
2010=100
연 별
전 국 서 울 부 산 대 구 인 천 광 주 대 전 울 산 세 종
Total Seoul Busan Daegu Incheon Gwangju Daegeon Ulsan Sejong
생 산 2007 83.3 114.8 94.6 87.1 100.3 82.9 91.8 93.5 - 2008 86.1 107.3 98.4 88.7 98.4 77.2 87.6 96.5 - 2009 86.0 95.0 93.8 79.5 86.4 80.0 85.2 95.8 - 2010 100.0 100.0 100.0 100.0 100.0 100.0 100.0 100.0 100.0 2011 105.9 102.3 103.0 105.7 104.2 108.1 100.6 107.2 111.0 2012201220122012 106.8 106.8 106.8 106.8 102.6 102.6 102.6 102.6 103.2 103.2 103.2 103.2 105.9 105.9 105.9 105.9 104.7 104.7 104.7 104.7 99.9 99.9 99.9 99.9 108.4 108.4 108.4 108.4 114.5 114.5 114.5 114.5 117.8 117.8 117.8 117.8 출 하
2007 86.5 112.8 97.5 87.6 103.2 84.7 95.3 97.2 - 2008 88.7 106.7 100.4 87.5 99.5 79.7 90.6 99.1 - 2009 87.5 93.8 95.4 79.4 87.3 82.1 86.5 96.8 - 2010 100.0 100.0 100.0 100.0 100.0 100.0 100.0 100.0 100.0 2011 105.6 102.7 101.2 105.7 103.8 106.6 100.8 107.2 111.4 2012201220122012 106.4 106.4 106.4 106.4 103.9 103.9 103.9 103.9 97.9 97.9 97.9 97.9 105.0 105.0 105.0 105.0 106.1 106.1 106.1 106.1 101.7 101.7 101.7 101.7 106.9 106.9 106.9 106.9 113.7 113.7 113.7 113.7 119.3 119.3 119.3 119.3 재 고1)
2007 89.9 100.4 119.4 80.7 96.2 110.8 99.1 96.5 - 2008 96.1 115.3 132.5 98.4 89.5 118.7 110.9 100.0 - 2009 88.6 103.0 104.9 98.8 83.9 101.1 98.6 85.9 - 2010 104.6 104.3 98.4 107.7 98.1 101.4 99.0 107.8 114.1 2011 120.2 109.9 113.2 121.3 109.7 118.5 104.7 125.5 105.2 2012201220122012 124.1 124.1 124.1 124.1 108.4 108.4 108.4 108.4 119.9 119.9 119.9 119.9 134.0 134.0 134.0 134.0 131.7 131.7 131.7 131.7 99.0 99.0 99.0 99.0 110.6 110.6 110.6 110.6 119.8 119.8 119.8 119.8 100.0 100.0 100.0 100.0
주 : 1) 연자료는 12월말 수치임자료 : 통계청『한국통계월보 2013.10.』

National Statistics 599
8. INDUSTRIAL PRODUCTION, SHIPMENT AND INVENTORY BY PROVINCE
2010=100경 기 강 원 충 북 충 남 전 북 전 남 경 북 경 남 제 주
Year
Gyeonggi Gangwon Chunguk Chungnam Jeonbuk Jeonnam Gyeongbuk Gyeongnam Jeju
Production 76.3 86.7 78.5 64.7 87.3 85.4 103.5 81.8 85.0 2007 80.2 91.1 80.8 70.5 87.3 90.0 104.3 87.4 94.1 2008 79.5 87.1 86.2 83.8 83.2 89.8 97.5 87.9 102.7 2009
100.0 100.0 100.0 100.0 100.0 100.0 100.0 100.0 100.0 2010 105.7 109.5 112.3 106.3 105.6 106.8 101.9 102.6 107.7 2011 107.6 107.6 107.6 107.6 111.0 111.0 111.0 111.0 118.7 118.7 118.7 118.7 107.1 107.1 107.1 107.1 101.3 101.3 101.3 101.3 111.2 111.2 111.2 111.2 101.7 101.7 101.7 101.7 102.8 102.8 102.8 102.8 110.9 110.9 110.9 110.9 2012201220122012
Shipment81.6 87.8 75.1 70.2 90.9 88.2 103.4 79.6 84.8 2007 84.1 92.2 78.7 74.5 88.0 93.1 103.1 86.4 89.5 2008 81.8 88.7 86.2 84.7 83.7 93.6 97.0 86.6 93.4 2009
100.0 100.0 100.0 100.0 100.0 100.0 100.0 100.0 100.0 2010 106.7 110.6 109.3 106.8 107.2 105.0 100.4 101.4 104.8 2011 108.6 108.6 108.6 108.6 113.0 113.0 113.0 113.0 116.0 116.0 116.0 116.0 108.7 108.7 108.7 108.7 104.0 104.0 104.0 104.0 106.0 106.0 106.0 106.0 98.8 98.8 98.8 98.8 101.6 101.6 101.6 101.6 113.5 113.5 113.5 113.5 2012201220122012
Inventory70.8 90.8 85.5 83.7 82.8 102.3 94.0 92.3 132.4 2007 76.0 102.6 116.4 85.2 109.5 110.7 103.6 100.7 101.8 2008 82.2 84.3 89.1 76.0 101.4 87.6 91.8 91.3 99.0 2009
102.8 96.7 100.1 110.3 107.0 103.9 100.7 102.2 89.7 2010 113.0 125.0 111.8 122.4 118.1 106.3 121.4 110.6 106.6 2011
120.8 120.8 120.8 120.8 148.4 148.4 148.4 148.4 125.5 125.5 125.5 125.5 128.5 128.5 128.5 128.5 112.3 112.3 112.3 112.3 117.0 117.0 117.0 117.0 129.6 129.6 129.6 129.6 107.3 107.3 107.3 107.3 106.6 106.6 106.6 106.6 2012201220122012Source : National Statistical Office

ⅩⅦ . 전국통계600
9. 도시근로자가구당월평균가계수지1)(9-1)
단위:천원 가구원수 가구주 조사가구 소 득 Income
연 별 (명) 연령(세) 분포(%) 경 상 소 득 Current income 비경상Year 근로소득 사업소득 재산소득 이전소득 소 득
분기별 Household Ageof Distribution Quarterly size household of household Returns Transfer Irregular
(person) head(age) (%) Earnings Business from assets income income
2007 3.38 44.25 59.35 3,656.2 3,518.9 3,162.9 165.0 13.9 177.1 137.4
2008 3.44 44.36 60.86 3,900.6 3,757.6 3,383.1 168.8 13.2 192.4 143.0
2009 3.41 44.96 60.50 3,853.2 3,699.6 3,322.2 161.7 14.1 201.6 153.6
2010 3.40 45.31 60.60 4,007.7 3,881.0 3,479.2 175.9 13.1 212.7 126.7
2011 3.37 45.74 61.59 4,248.6 4,116.1 3,670.1 183.3 13.3 249.3 132.4
2012201220122012 3.36 3.36 3.36 3.36 46.30 46.30 46.30 46.30 62.85 62.85 62.85 62.85 4,492.4 4,492.4 4,492.4 4,492.4 4,358.5 4,358.5 4,358.5 4,358.5 3,885.1 3,885.1 3,885.1 3,885.1 191.2 191.2 191.2 191.2 15.2 15.2 15.2 15.2 266.9 266.9 266.9 266.9 133.9 133.9 133.9 133.9
1/4 3.37 45.49 61.39 4,682.2 4,522.5 3,999.6 191.8 17.2 314.0 159.7
2/4 3.37 46.09 62.39 4,313.1 4,187.3 3,741.4 185.5 17.1 243.3 125.8
3/4 3.37 46.24 62.75 4,583.8 4,473.4 4,041.7 175.3 11.7 244.7 110.3
4/4 3.39 46.01 62.59 4,517.4 4,402.5 3,977.1 168.6 16.5 240.3 114.9
주: 1) 2009년 소득 및 지출부문의 항목분류 개편으로 인한 가계동향조사 신분류 자료임자료 : 통계청『가계동향조사』

National Statistics 601
9. AVERAGE MONTHLY INCOME AND EXPENDITURE PER HOUSEHOLDFORURBANSALARY AND WAGE EARNER'S HOUSEHOLDS
Unit: thousand won 가 계 지 출 Expenditures
소 비 지 출 Consumption expenditures 식료품 · 비주류음료 Food and non-alcoholic beverages Year &
곡물 곡물 빵 및 육류 육류 신선수산 가공품 떡류 가공품 동물 Quarterly Processed White bread Processed Fresh fish Cereals cereals and rice cakes Meat meats and shellfish
2,826.6 2,163.6 282.1 22.4 12.4 15.9 37.2 8.1 20.5 2007
3,025.6 2,308.5 304.8 23.5 14.6 18.8 41.6 8.7 21.0 2008
3,036.7 2,310.3 303.6 20.6 15.4 20.0 43.8 8.6 20.0 2009
3,209.5 2,435.1 318.8 17.2 16.1 21.7 45.8 10.0 19.8 2010
3,364.6 2,531.3 339.5 18.9 17.2 22.9 48.3 11.7 20.0 2011
3,494.8 3,494.8 3,494.8 3,494.8 2,621.9 2,621.9 2,621.9 2,621.9 355.0 355.0 355.0 355.0 19.8 19.8 19.8 19.8 17.5 17.5 17.5 17.5 23.7 23.7 23.7 23.7 49.4 49.4 49.4 49.4 12.8 12.8 12.8 12.8 19.5 19.5 19.5 19.5 2012201220122012
3,708.9 2,770.6 351.7 16.8 18.8 25.1 54.0 12.8 21.5 1/4
3,406.2 2,570.7 335.1 16.4 16.7 22.6 43.3 12.0 16.1 2/4
3,548.9 2,635.0 387.8 20.0 18.4 22.3 54.9 15.0 19.2 3/4
3,405.3 2,567.3 350.1 25.9 16.5 25.2 46.0 11.2 20.8 4/4
Source : National Statistical Office

ⅩⅦ . 전국통계602
9. 도시근로자가구당월평균가계수지1)(9-2)
단위:천원 가 계 지 출 Expenditures연 별 소 비 지 출 Consumption expenditures
식료품 · 비주류음료 Food and non-alcoholic beverages 염건수산 기타수산 유제품 유지류 과일및 채소 및 해조 및분기별 동물 동물가공 및 알 과일가공품 채소가공품 해조가공품
Salted, dried fish Processed fish Milk, cheese Oils and Fruits and Vegetables and Seaweeds and and shellfish and shellfish and eggs fats processed fruits seaweeds processed seaweeds
2007 6.4 5.6 25.8 2.2 34.4 32.1 6.6
2008 6.4 6.2 29.4 2.6 36.5 31.5 7.0
2009 6.4 6.3 31.2 2.7 36.6 29.9 3.9
2010 6.4 6.5 31.8 2.7 38.5 35.9 3.9
2011 7.1 7.0 32.4 2.6 40.8 35.2 4.1
2012201220122012 6.7 6.7 6.7 6.7 7.3 7.3 7.3 7.3 34.2 34.2 34.2 34.2 2.7 2.7 2.7 2.7 44.9 44.9 44.9 44.9 38.3 38.3 38.3 38.3 4.4 4.4 4.4 4.4
1/4 7.5 7.0 34.9 3.1 46.1 33.0 5.3
2/4 5.7 6.3 34.3 2.3 42.2 43.2 3.4
3/4 7.6 7.5 35.3 3.6 55.1 36.3 4.4
4/4 5.9 8.7 33.3 2.1 36.9 40.7 4.4
주: 1) 2009년 소득 및 지출부문의 항목분류 개편으로 인한 가계동향조사 신분류 자료임자료 : 통계청『가계동향조사』

National Statistics 603
9. AVERAGE MONTHLY INCOME AND EXPENDITURE PER HOUSEHOLDFORURBANSALARY AND WAGE EARNER'S HOUSEHOLDS
Unit: thousand won가 계 지 출 Expenditures
소 비 지 출 Consumption expenditures 식료품·비주류음료 Food and non-alcoholic beverages 주류 및 담배 Year &
당류 및 과자류 조미 기타 커피 주스및기타음료 Alcoholic 주류 담배 Sugar,jam,honey, 식품 식품 및 차 Juices and other beverages, Quarterly
chocolate and Spices and Other Coffee non-alcoholic tobacco Alcoholic Tobacco confectionery condiments food and tea beverage beverages
18.1 9.5 9.2 5.3 10.4 28.5 7.9 20.6 2007
20.4 9.7 9.6 6.0 11.5 28.1 8.4 19.6 2008
21.6 10.1 9.6 6.4 10.6 27.5 9.0 18.4 2009
23.8 9.9 10.4 7.2 11.2 28.4 9.6 18.8 2010
26.4 13.4 10.5 8.1 11.8 28.1 9.9 18.1 2011
28.1 28.1 28.1 28.1 13.7 13.7 13.7 13.7 10.8 10.8 10.8 10.8 8.8 8.8 8.8 8.8 12.6 12.6 12.6 12.6 27.6 27.6 27.6 27.6 10.0 10.0 10.0 10.0 17.5 17.5 17.5 17.5 2012201220122012
27.4 8.4 10.3 9.0 10.8 27.1 9.0 18.0 1/4
30.3 8.8 10.1 8.3 13.4 27.6 9.7 17.9 2/4
30.7 22.7 11.2 8.6 14.9 29.2 11.7 17.5 3/4
25.1 14.8 11.6 9.3 11.7 27.2 9.8 17.4 4/4
Source : National Statistical Office

ⅩⅦ . 전국통계604
9. 도시근로자가구당월평균가계수지1)(9-3)
단위:천원 가 계 지 출 Expenditures
연 별 소 비 지 출 Consumption expenditures 의류 · 신발 Clothing and footwear
직물 및 내의 기타 의복관련 신발 신발분기별 외의 의복 서비스 서비스
Cloth and Other Clothing Footwear outwear Underwear clothing service Footwear service
2007 142.3 106.2 7.9 5.8 4.5 17.7 0.3
2008 148.6 110.1 8.1 6.3 4.6 19.1 0.3
2009 146.1 106.0 8.6 7.0 4.5 19.8 0.3
2010 158.0 112.9 9.7 7.6 4.7 22.7 0.3
2011 171.7 123.8 9.9 8.0 4.5 25.0 0.3
2012201220122012 182.2 182.2 182.2 182.2 131.5 131.5 131.5 131.5 10.6 10.6 10.6 10.6 8.4 8.4 8.4 8.4 4.7 4.7 4.7 4.7 26.7 26.7 26.7 26.7 0.3 0.3 0.3 0.3
1/4 176.9 130.6 9.6 8.7 4.3 23.4 0.3
2/4 186.9 132.4 10.7 7.2 5.8 30.5 0.4
3/4 143.9 99.8 10.8 5.7 3.0 24.3 0.2
4/4 223.5 165.6 11.7 12.2 4.8 29.0 0.3
주: 1) 2009년 소득 및 지출부문의 항목분류 개편으로 인한 가계동향조사 신분류 자료임자료 : 통계청『가계동향조사』
National Statistics 605
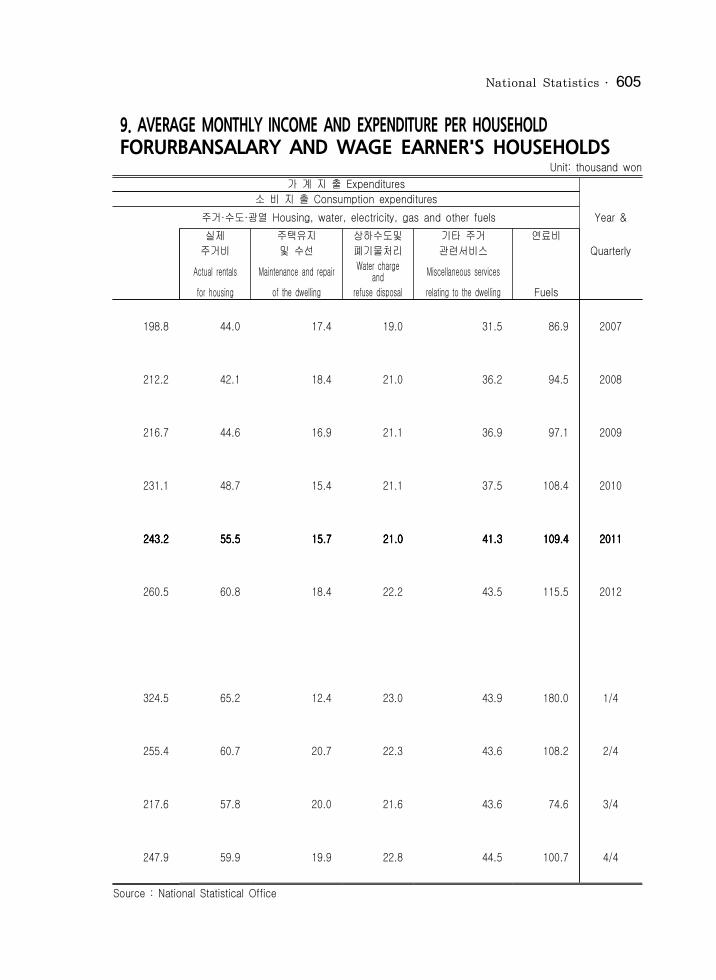
9. AVERAGE MONTHLY INCOME AND EXPENDITURE PER HOUSEHOLDFORURBANSALARY AND WAGE EARNER'S HOUSEHOLDS
Unit: thousand won가 계 지 출 Expenditures
소 비 지 출 Consumption expenditures 주거·수도·광열 Housing, water, electricity, gas and other fuels Year &
실제 주택유지 상하수도및 기타 주거 연료비 주거비 및 수선 폐기물처리 관련서비스 Quarterly Actual rentals Maintenance and repair Water charge and Miscellaneous services for housing of the dwelling refuse disposal relating to the dwelling Fuels
198.8 44.0 17.4 19.0 31.5 86.9 2007
212.2 42.1 18.4 21.0 36.2 94.5 2008
216.7 44.6 16.9 21.1 36.9 97.1 2009
231.1 48.7 15.4 21.1 37.5 108.4 2010
243.2 243.2 243.2 243.2 55.5 55.5 55.5 55.5 15.7 15.7 15.7 15.7 21.0 21.0 21.0 21.0 41.3 41.3 41.3 41.3 109.4 109.4 109.4 109.4 2011201120112011
260.5 60.8 18.4 22.2 43.5 115.5 2012
324.5 65.2 12.4 23.0 43.9 180.0 1/4
255.4 60.7 20.7 22.3 43.6 108.2 2/4
217.6 57.8 20.0 21.6 43.6 74.6 3/4
247.9 59.9 19.9 22.8 44.5 100.7 4/4
Source : National Statistical Office

ⅩⅦ . 전국통계606
9. 도시근로자가구당월평균가계수지1)(9-4)
단위:천원 가 계 지 출 Expenditures
연 별 소 비 지 출 Consumption expenditures 가정용품·가사서비스 Furnishings, household equipment and routine household maintenance
가구및조명 실내 가구·조명및 가정용 가전 및 가전관련서비스분기별 Furniture and 장식 장식서비스 섬유 가정용기기 Servicesfor
lighting Interior Services for the Household Household household equipment decoration furniture and interior textiles appliances appliances
2007 81.0 15.1 1.7 0.1 6.7 25.5 5.3
2008 78.4 13.6 1.8 0.1 6.3 21.9 5.9
2009 83.8 13.9 1.4 0.2 7.0 21.4 6.8
2010 94.0 14.8 1.7 0.2 8.1 23.4 7.4
2011 95.6 15.3 1.6 0.1 8.2 23.4 8.3
2012201220122012 101.8 101.8 101.8 101.8 17.6 17.6 17.6 17.6 1.8 1.8 1.8 1.8 0.3 0.3 0.3 0.3 8.6 8.6 8.6 8.6 23.9 23.9 23.9 23.9 10.1 10.1 10.1 10.1
1/4 100.1 20.1 2.0 0.3 8.2 21.3 9.8
2/4 100.7 18.7 1.6 0.3 7.8 24.0 10.2
3/4 103.6 14.9 1.8 0.2 8.7 25.7 10.6
4/4 103.4 14.6 1.9 0.2 9.7 25.1 9.9
주: 1) 2009년 소득 및 지출부문의 항목분류 개편으로 인한 가계동향조사 신분류 자료임자료 : 통계청『가계동향조사』

National Statistics 607
9. AVERAGE MONTHLY INCOME AND EXPENDITURE PER HOUSEHOLD
FORURBANSALARY AND WAGE EARNER'S HOUSEHOLDSUnit: thousand won
가 계 지 출 Expenditures 소 비 지 출 Consumption expenditures
가정용품·가사서비스 Furnishings, household equipmentandroutinehouseholdmaintenance 보 건 Health Year &가사 가정용공구 가사 가사 의약품 의료용 용품 및 기타 소모품 서비스 소모품 Quarterly
Household Tools and equipment Non-durable Household Medical utensils for household goods service product
5.2 2.6 9.2 9.4 123.6 34.6 6.0 2007
5.8 2.6 9.7 10.7 131.5 36.0 7.0 2008
7.5 2.3 10.5 12.9 142.3 38.3 7.3 2009
7.8 2.2 11.3 17.1 151.1 40.5 7.8 2010
8.0 2.8 11.7 15.7 159.9 42.0 7.8 2011
8.4 8.4 8.4 8.4 3.1 3.1 3.1 3.1 12.3 12.3 12.3 12.3 15.8 15.8 15.8 15.8 164.0 164.0 164.0 164.0 41.0 41.0 41.0 41.0 8.1 8.1 8.1 8.1 2012201220122012
9.5 3.3 11.5 14.2 173.6 43.5 8.5 1/4
7.8 2.7 12.6 15.0 159.7 39.9 7.8 2/4
8.4 3.3 13.0 17.0 157.0 39.9 8.1 3/4
8.2 3.0 12.4 18.4 161.5 40.2 8.4 4/4
Source : National Statistical Office

ⅩⅦ . 전국통계608
9. 도시근로자가구당월평균가계수지1)(9-5)
단위:천원 가 계 지 출 Expenditures
연 별 소 비 지 출 Consumption expenditures 보 건 Health 교 통 Transport
보건의료 외래의료서비스 치과서비스 기타의료 입원서비스 자동차 기타운송분기별 용품및기구 Out-patients Dental 서비스 In-patients 구입 기구구입
Medical hospital medical Other medical hospital Automobile Other vehicle appliances services services services services purchasing purchasing
2007 6.8 31.1 24.4 1.6 19.2 280.3 67.7 1.3
2008 6.4 33.7 27.2 1.8 19.4 293.9 65.6 1.6
2009 6.5 39.7 29.1 1.1 20.3 291.0 83.5 1.5
2010 7.3 43.9 26.2 1.2 24.3 293.8 74.2 1.5
2011 7.8 46.7 30.6 1.3 23.5 303.6 68.9 1.0
2012201220122012 7.7 7.7 7.7 7.7 51.0 51.0 51.0 51.0 30.4 30.4 30.4 30.4 1.7 1.7 1.7 1.7 24.1 24.1 24.1 24.1 326.8 326.8 326.8 326.8 84.8 84.8 84.8 84.8 1.6 1.6 1.6 1.6
1/4 8.3 56.4 31.7 1.5 23.6 308.6 70.6 0.9
2/4 7.8 47.9 31.0 1.1 24.2 344.3 98.2 2.9
3/4 7.9 48.4 30.5 2.3 20.0 321.5 70.8 1.4
4/4 6.9 49.6 27.4 1.9 27.0 341.1 101.1 1.1
주: 1) 2009년 소득 및 지출부문의 항목분류 개편으로 인한 가계동향조사 신분류 자료임자료 : 통계청『가계동향조사』
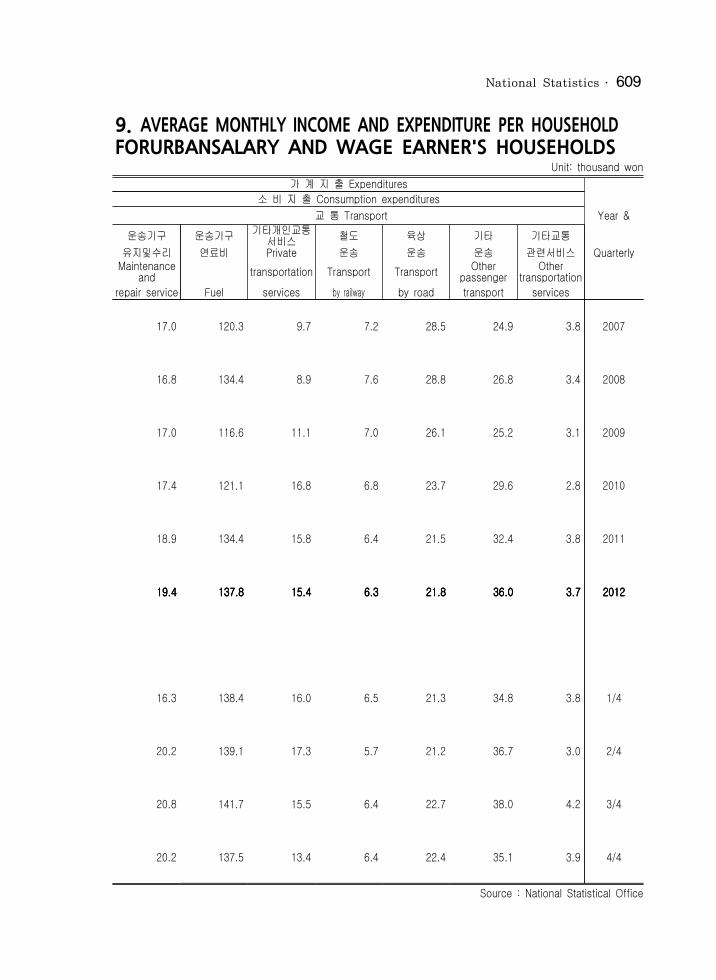
National Statistics 609
9. AVERAGE MONTHLY INCOME AND EXPENDITURE PER HOUSEHOLDFORURBANSALARY AND WAGE EARNER'S HOUSEHOLDS
Unit: thousand won가 계 지 출 Expenditures
소 비 지 출 Consumption expenditures 교 통 Transport Year &
운송기구 운송기구 기타개인교통서비스 철도 육상 기타 기타교통 유지및수리 연료비 Private 운송 운송 운송 관련서비스 Quarterly
Maintenance and transportation Transport Transport Other passenger Other transportation repair service Fuel services by railway by road transport services
17.0 120.3 9.7 7.2 28.5 24.9 3.8 2007
16.8 134.4 8.9 7.6 28.8 26.8 3.4 2008
17.0 116.6 11.1 7.0 26.1 25.2 3.1 2009
17.4 121.1 16.8 6.8 23.7 29.6 2.8 2010
18.9 134.4 15.8 6.4 21.5 32.4 3.8 2011
19.4 19.4 19.4 19.4 137.8 137.8 137.8 137.8 15.4 15.4 15.4 15.4 6.3 6.3 6.3 6.3 21.8 21.8 21.8 21.8 36.0 36.0 36.0 36.0 3.7 3.7 3.7 3.7 2012201220122012
16.3 138.4 16.0 6.5 21.3 34.8 3.8 1/4
20.2 139.1 17.3 5.7 21.2 36.7 3.0 2/4
20.8 141.7 15.5 6.4 22.7 38.0 4.2 3/4
20.2 137.5 13.4 6.4 22.4 35.1 3.9 4/4
Source : National Statistical Office
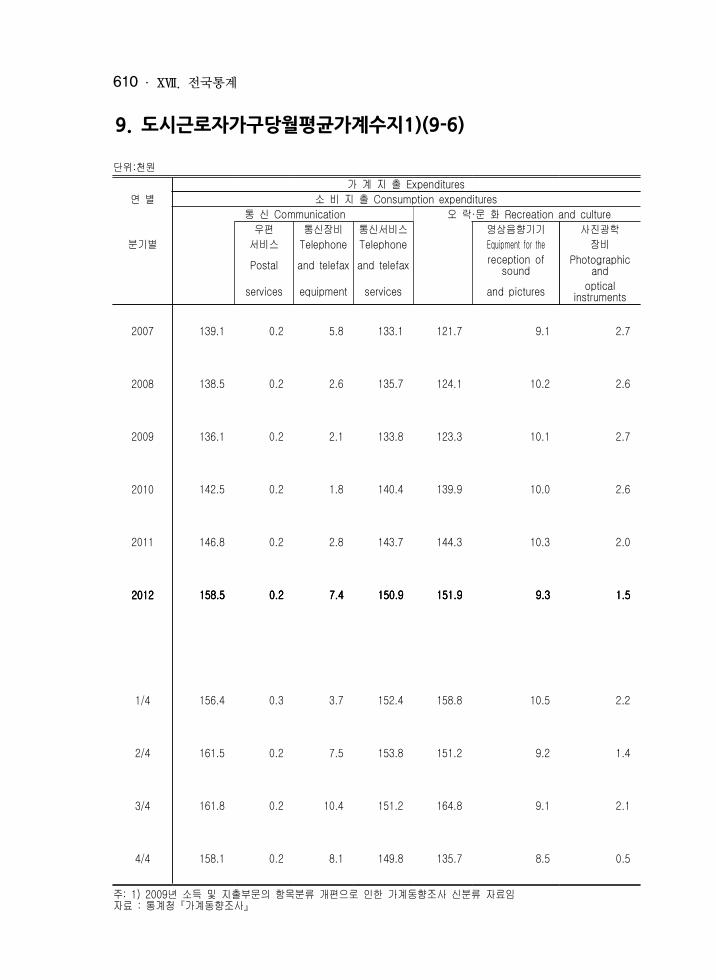
ⅩⅦ . 전국통계610
9. 도시근로자가구당월평균가계수지1)(9-6)
단위:천원 가 계 지 출 Expenditures
연 별 소 비 지 출 Consumption expenditures 통 신 Communication 오 락·문 화 Recreation and culture
우편 통신장비 통신서비스 영상음향기기 사진광학분기별 서비스 Telephone Telephone Equipment for the 장비
Postal and telefax and telefax reception of sound Photographic and services equipment services and pictures optical instruments
2007 139.1 0.2 5.8 133.1 121.7 9.1 2.7
2008 138.5 0.2 2.6 135.7 124.1 10.2 2.6
2009 136.1 0.2 2.1 133.8 123.3 10.1 2.7
2010 142.5 0.2 1.8 140.4 139.9 10.0 2.6
2011 146.8 0.2 2.8 143.7 144.3 10.3 2.0
2012201220122012 158.5 158.5 158.5 158.5 0.2 0.2 0.2 0.2 7.4 7.4 7.4 7.4 150.9 150.9 150.9 150.9 151.9 151.9 151.9 151.9 9.3 9.3 9.3 9.3 1.5 1.5 1.5 1.5
1/4 156.4 0.3 3.7 152.4 158.8 10.5 2.2
2/4 161.5 0.2 7.5 153.8 151.2 9.2 1.4
3/4 161.8 0.2 10.4 151.2 164.8 9.1 2.1
4/4 158.1 0.2 8.1 149.8 135.7 8.5 0.5
주: 1) 2009년 소득 및 지출부문의 항목분류 개편으로 인한 가계동향조사 신분류 자료임자료 : 통계청『가계동향조사』
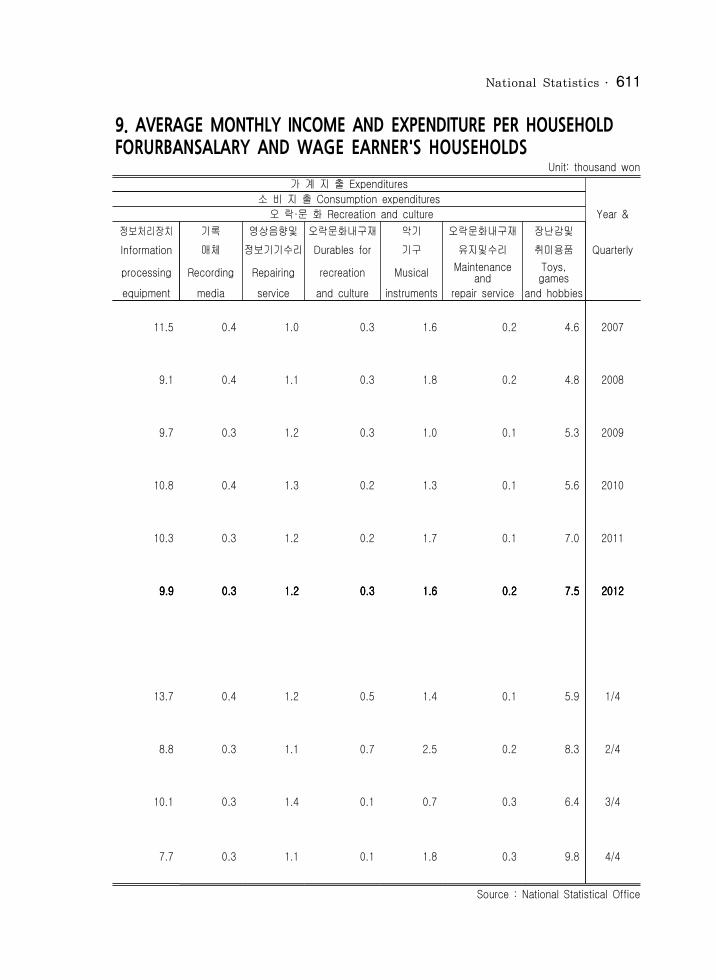
National Statistics 611
9. AVERAGE MONTHLY INCOME AND EXPENDITURE PER HOUSEHOLDFORURBANSALARY AND WAGE EARNER'S HOUSEHOLDS
Unit: thousand won가 계 지 출 Expenditures
소 비 지 출 Consumption expenditures 오 락·문 화 Recreation and culture Year &
정보처리장치 기록 영상음향및 오락문화내구재 악기 오락문화내구재 장난감및 Information 매체 정보기기수리 Durables for 기구 유지및수리 취미용품 Quarterlyprocessing Recording Repairing recreation Musical Maintenance and Toys, games equipment media service and culture instruments repair service and hobbies
11.5 0.4 1.0 0.3 1.6 0.2 4.6 2007
9.1 0.4 1.1 0.3 1.8 0.2 4.8 2008
9.7 0.3 1.2 0.3 1.0 0.1 5.3 2009
10.8 0.4 1.3 0.2 1.3 0.1 5.6 2010
10.3 0.3 1.2 0.2 1.7 0.1 7.0 2011
9.9 9.9 9.9 9.9 0.3 0.3 0.3 0.3 1.2 1.2 1.2 1.2 0.3 0.3 0.3 0.3 1.6 1.6 1.6 1.6 0.2 0.2 0.2 0.2 7.5 7.5 7.5 7.5 2012201220122012
13.7 0.4 1.2 0.5 1.4 0.1 5.9 1/4
8.8 0.3 1.1 0.7 2.5 0.2 8.3 2/4
10.1 0.3 1.4 0.1 0.7 0.3 6.4 3/4
7.7 0.3 1.1 0.1 1.8 0.3 9.8 4/4
Source : National Statistical Office

ⅩⅦ . 전국통계612
9. 도시근로자가구당월평균가계수지1)(9-7)
단위:천원 가 계 지 출 Expenditures
연 별 소 비 지 출 Consumption expenditures오락·문화 Recreation and culture
캠핑및운동 화훼관련 애완동물 화훼및애완 운동및 문화분기별 관련용품 용품 관련물품 동물서비스 오락서비스 서비스
Equipment for Gardens, plants Pets and Veterinary and other Recreational and Cultural sport, camping and flowers related products services for pets cultural services services
2007 4.6 2.4 1.3 1.1 13.7 21.1
2008 4.8 2.0 1.4 1.2 15.2 22.6
2009 5.0 2.3 1.6 1.0 14.3 24.1
2010 5.4 2.4 1.7 1.1 16.5 26.2
2011 6.8 2.3 1.9 1.1 17.0 28.3
2012201220122012 6.8 6.8 6.8 6.8 2.5 2.5 2.5 2.5 2.2 2.2 2.2 2.2 1.4 1.4 1.4 1.4 17.7 17.7 17.7 17.7 30.4 30.4 30.4 30.4
1/4 6.0 2.6 2.4 1.5 15.9 28.6
2/4 7.0 4.2 2.2 1.6 18.1 32.0
3/4 8.8 1.7 2.1 1.2 21.1 30.8
4/4 5.8 1.5 2.6 1.3 16.0 29.3
주: 1) 2009년 소득 및 지출부문의 항목분류 개편으로 인한 가계동향조사 신분류 자료임자료 : 통계청『가계동향조사』

National Statistics 613
9. AVERAGE MONTHLY INCOME AND EXPENDITURE PER HOUSEHOLDFORURBANSALARY AND WAGE EARNER'S HOUSEHOLDS
Unit: thousand won가 계 지 출 Expenditures
소 비 지 출 Consumption expenditures 오락·문화 Recreation and culture 교 육 Education Year &
복권 서적 기타인쇄물 문구 단체여행 정규교육 초등교육 중등 Other Pre-primary 교육 Quarterly printed Package Regular and Primary Secondary
Lottery Books matters Stationery tours Education education education
0.4 24.5 2.6 3.6 15.0 268.4 88.7 17.1 21.6 2007
0.3 27.2 3.2 3.8 11.8 319.8 101.3 21.3 25.4 2008
0.4 24.6 2.9 3.8 12.7 325.0 113.6 22.5 25.2 2009
0.3 25.9 2.7 4.4 21.1 332.1 118.7 23.9 23.7 2010
0.4 24.1 2.4 5.2 20.8 327.6 111.8 25.0 20.9 2011
0.4 0.4 0.4 0.4 22.0 22.0 22.0 22.0 2.3 2.3 2.3 2.3 5.5 5.5 5.5 5.5 29.0 29.0 29.0 29.0 320.7 320.7 320.7 320.7 101.4 101.4 101.4 101.4 20.1 20.1 20.1 20.1 19.5 19.5 19.5 19.5 2012201220122012
0.5 29.2 2.4 7.3 26.5 408.7 190.0 24.9 20.8 1/4
0.4 19.6 2.2 5.1 26.3 261.3 38.1 16.8 19.6 2/4
0.4 20.6 2.3 4.9 40.6 370.7 144.5 21.3 20.1 3/4
0.4 19.4 2.3 5.1 22.1 260.0 38.8 18.5 17.7 4/4
Source : National Statistical Office
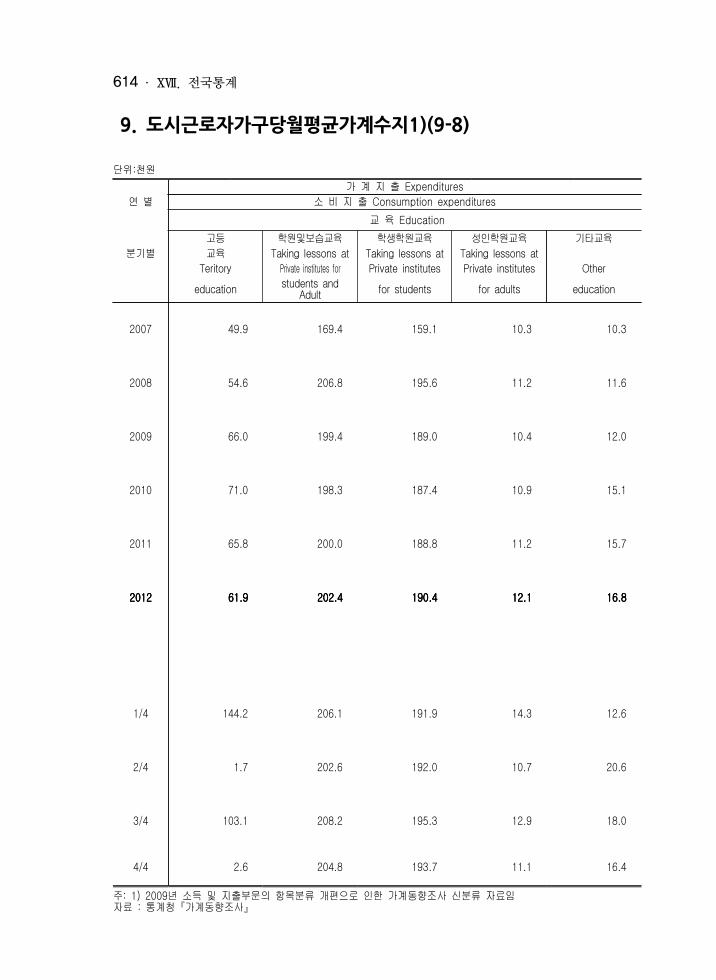
ⅩⅦ . 전국통계614
9. 도시근로자가구당월평균가계수지1)(9-8)
단위:천원 가 계 지 출 Expenditures
연 별 소 비 지 출 Consumption expenditures 교 육 Education
고등 학원및보습교육 학생학원교육 성인학원교육 기타교육분기별 교육 Taking lessons at Taking lessons at Taking lessons at
Teritory Private institutes for Private institutes Private institutes Other education students and Adult for students for adults education
2007 49.9 169.4 159.1 10.3 10.3
2008 54.6 206.8 195.6 11.2 11.6
2009 66.0 199.4 189.0 10.4 12.0
2010 71.0 198.3 187.4 10.9 15.1
2011 65.8 200.0 188.8 11.2 15.7
2012201220122012 61.9 61.9 61.9 61.9 202.4 202.4 202.4 202.4 190.4 190.4 190.4 190.4 12.1 12.1 12.1 12.1 16.8 16.8 16.8 16.8
1/4 144.2 206.1 191.9 14.3 12.6
2/4 1.7 202.6 192.0 10.7 20.6
3/4 103.1 208.2 195.3 12.9 18.0
4/4 2.6 204.8 193.7 11.1 16.4
주: 1) 2009년 소득 및 지출부문의 항목분류 개편으로 인한 가계동향조사 신분류 자료임자료 : 통계청『가계동향조사』
National Statistics 615
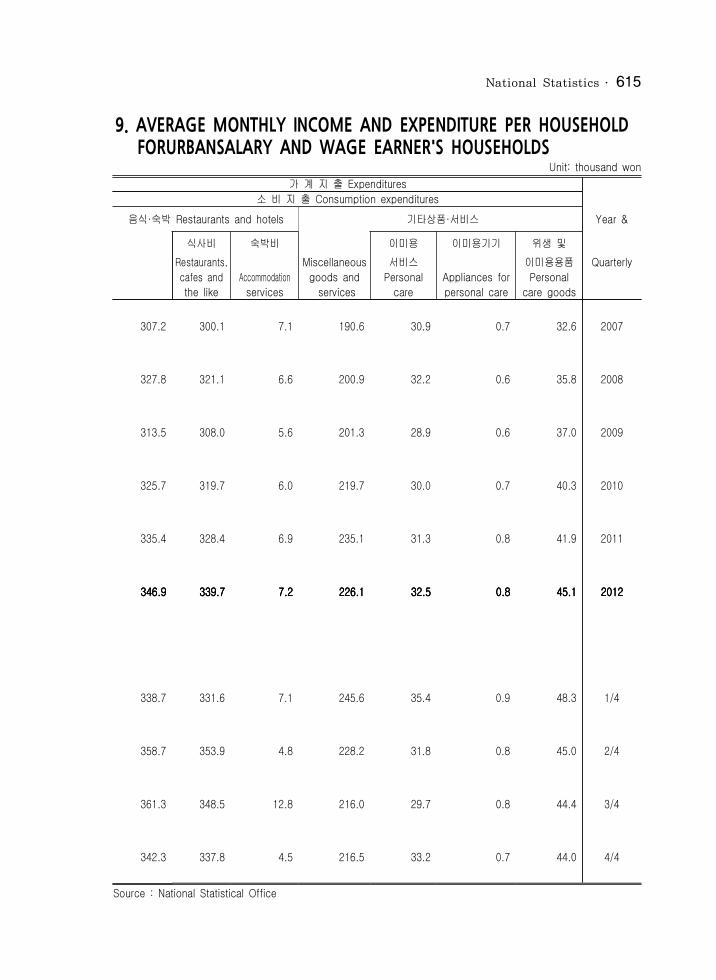
9. AVERAGE MONTHLY INCOME AND EXPENDITURE PER HOUSEHOLD FORURBANSALARY AND WAGE EARNER'S HOUSEHOLDS
Unit: thousand won가 계 지 출 Expenditures
소 비 지 출 Consumption expenditures 음식·숙박 Restaurants and hotels 기타상품·서비스 Year &
식사비 숙박비 이미용 이미용기기 위생 및 Restaurants, Miscellaneous 서비스 이미용용품 Quarterly cafes and Accommodation goods and Personal Appliances for Personal the like services services care personal care care goods
307.2 300.1 7.1 190.6 30.9 0.7 32.6 2007
327.8 321.1 6.6 200.9 32.2 0.6 35.8 2008
313.5 308.0 5.6 201.3 28.9 0.6 37.0 2009
325.7 319.7 6.0 219.7 30.0 0.7 40.3 2010
335.4 328.4 6.9 235.1 31.3 0.8 41.9 2011
346.9 346.9 346.9 346.9 339.7 339.7 339.7 339.7 7.2 7.2 7.2 7.2 226.1 226.1 226.1 226.1 32.5 32.5 32.5 32.5 0.8 0.8 0.8 0.8 45.1 45.1 45.1 45.1 2012201220122012
338.7 331.6 7.1 245.6 35.4 0.9 48.3 1/4
358.7 353.9 4.8 228.2 31.8 0.8 45.0 2/4
361.3 348.5 12.8 216.0 29.7 0.8 44.4 3/4
342.3 337.8 4.5 216.5 33.2 0.7 44.0 4/4
Source : National Statistical Office
ⅩⅦ . 전국통계616
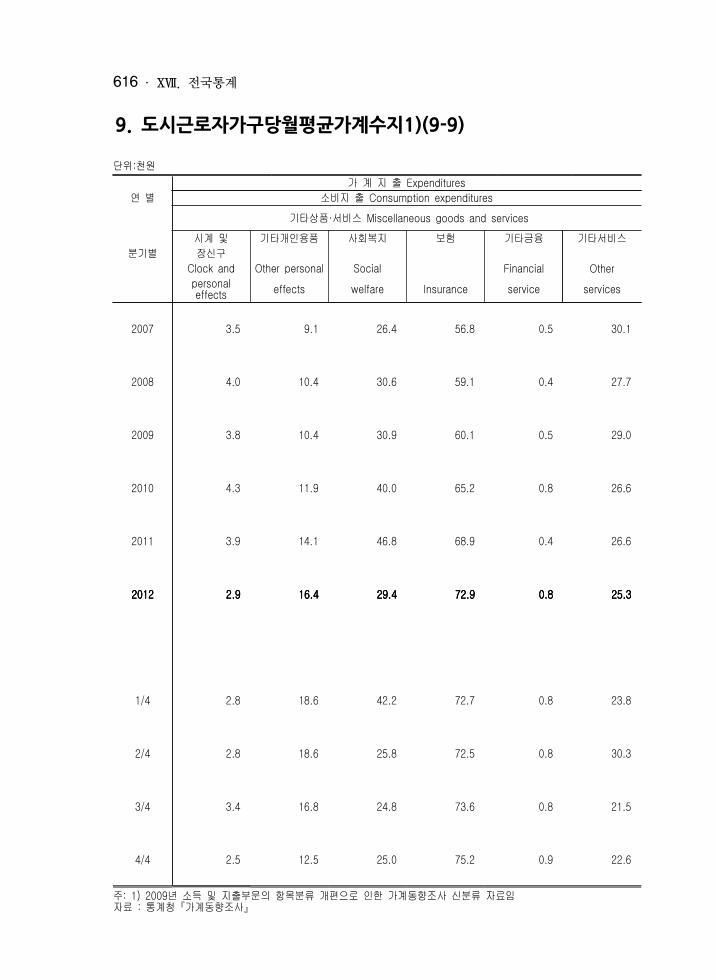
9. 도시근로자가구당월평균가계수지1)(9-9)
단위:천원 가 계 지 출 Expenditures
연 별 소비지 출 Consumption expenditures 기타상품·서비스 Miscellaneous goods and services
시계 및 기타개인용품 사회복지 보험 기타금융 기타서비스분기별 장신구
Clock and Other personal Social Financial Other personal effects effects welfare Insurance service services
2007 3.5 9.1 26.4 56.8 0.5 30.1
2008 4.0 10.4 30.6 59.1 0.4 27.7
2009 3.8 10.4 30.9 60.1 0.5 29.0
2010 4.3 11.9 40.0 65.2 0.8 26.6
2011 3.9 14.1 46.8 68.9 0.4 26.6
2012201220122012 2.9 2.9 2.9 2.9 16.4 16.4 16.4 16.4 29.4 29.4 29.4 29.4 72.9 72.9 72.9 72.9 0.8 0.8 0.8 0.8 25.3 25.3 25.3 25.3
1/4 2.8 18.6 42.2 72.7 0.8 23.8
2/4 2.8 18.6 25.8 72.5 0.8 30.3
3/4 3.4 16.8 24.8 73.6 0.8 21.5
4/4 2.5 12.5 25.0 75.2 0.9 22.6
주: 1) 2009년 소득 및 지출부문의 항목분류 개편으로 인한 가계동향조사 신분류 자료임자료 : 통계청『가계동향조사』
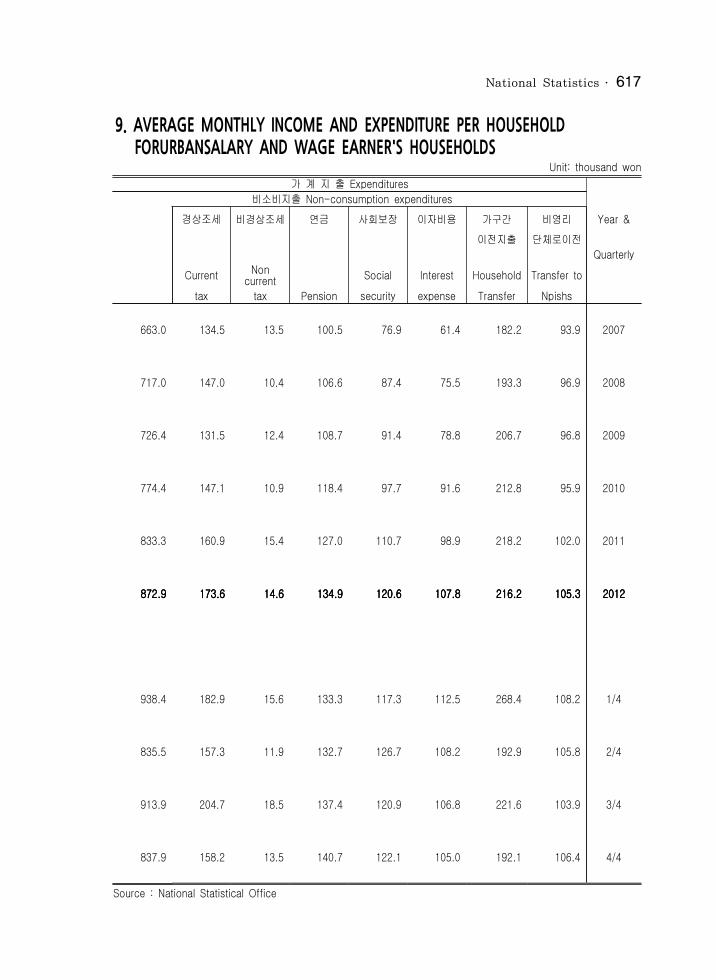
National Statistics 617
9. AVERAGE MONTHLY INCOME AND EXPENDITURE PER HOUSEHOLD FORURBANSALARY AND WAGE EARNER'S HOUSEHOLDS
Unit: thousand won가 계 지 출 Expenditures
비소비지출 Non-consumption expenditures 경상조세 비경상조세 연금 사회보장 이자비용 가구간 비영리 Year & 이전지출 단체로이전 Quarterly Current Non current Social Interest Household Transfer to tax tax Pension security expense Transfer Npishs
663.0 134.5 13.5 100.5 76.9 61.4 182.2 93.9 2007
717.0 147.0 10.4 106.6 87.4 75.5 193.3 96.9 2008
726.4 131.5 12.4 108.7 91.4 78.8 206.7 96.8 2009
774.4 147.1 10.9 118.4 97.7 91.6 212.8 95.9 2010
833.3 160.9 15.4 127.0 110.7 98.9 218.2 102.0 2011
872.9 872.9 872.9 872.9 173.6 173.6 173.6 173.6 14.6 14.6 14.6 14.6 134.9 134.9 134.9 134.9 120.6 120.6 120.6 120.6 107.8 107.8 107.8 107.8 216.2 216.2 216.2 216.2 105.3 105.3 105.3 105.3 2012201220122012
938.4 182.9 15.6 133.3 117.3 112.5 268.4 108.2 1/4
835.5 157.3 11.9 132.7 126.7 108.2 192.9 105.8 2/4
913.9 204.7 18.5 137.4 120.9 106.8 221.6 103.9 3/4
837.9 158.2 13.5 140.7 122.1 105.0 192.1 106.4 4/4
Source : National Statistical Office
ⅩⅦ . 전국통계618
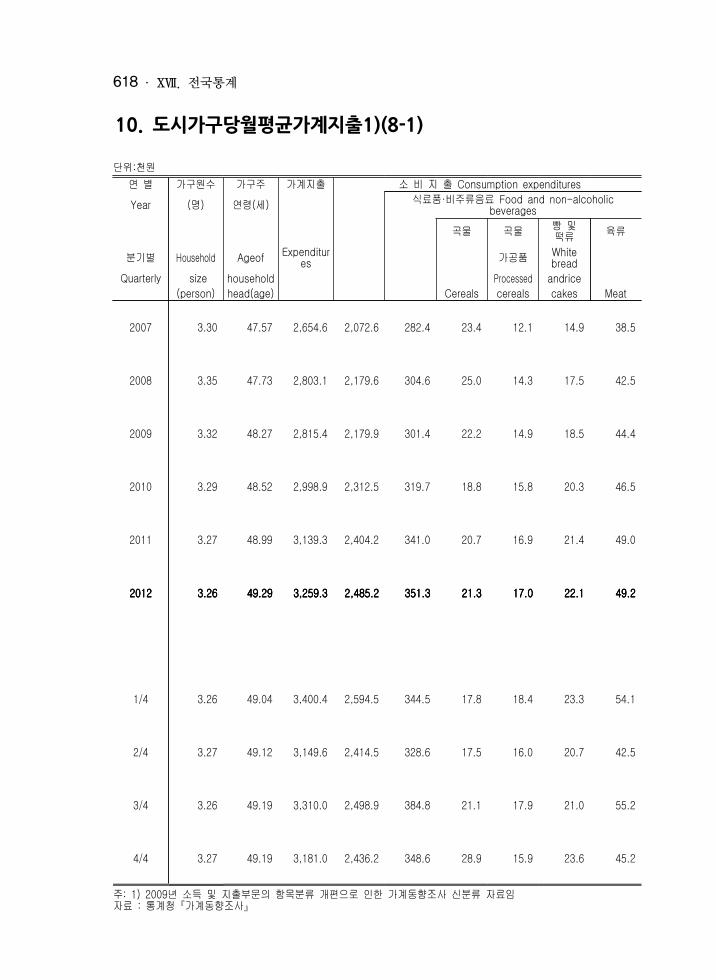
10. 도시가구당월평균가계지출1)(8-1)
단위:천원연 별 가구원수 가구주 가계지출 소 비 지 출 Consumption expendituresYear (명) 연령(세) 식료품·비주류음료 Food and non-alcoholic beverages 곡물 곡물 빵 및 떡류 육류
분기별 Household Ageof Expenditures 가공품 White bread Quarterly size household Processed andrice
(person) head(age) Cereals cereals cakes Meat
2007 3.30 47.57 2,654.6 2,072.6 282.4 23.4 12.1 14.9 38.5
2008 3.35 47.73 2,803.1 2,179.6 304.6 25.0 14.3 17.5 42.5
2009 3.32 48.27 2,815.4 2,179.9 301.4 22.2 14.9 18.5 44.4
2010 3.29 48.52 2,998.9 2,312.5 319.7 18.8 15.8 20.3 46.5
2011 3.27 48.99 3,139.3 2,404.2 341.0 20.7 16.9 21.4 49.0
2012201220122012 3.26 3.26 3.26 3.26 49.29 49.29 49.29 49.29 3,259.3 3,259.3 3,259.3 3,259.3 2,485.2 2,485.2 2,485.2 2,485.2 351.3 351.3 351.3 351.3 21.3 21.3 21.3 21.3 17.0 17.0 17.0 17.0 22.1 22.1 22.1 22.1 49.2 49.2 49.2 49.2
1/4 3.26 49.04 3,400.4 2,594.5 344.5 17.8 18.4 23.3 54.1
2/4 3.27 49.12 3,149.6 2,414.5 328.6 17.5 16.0 20.7 42.5
3/4 3.26 49.19 3,310.0 2,498.9 384.8 21.1 17.9 21.0 55.2
4/4 3.27 49.19 3,181.0 2,436.2 348.6 28.9 15.9 23.6 45.2
주: 1) 2009년 소득 및 지출부문의 항목분류 개편으로 인한 가계동향조사 신분류 자료임자료 : 통계청『가계동향조사』
National Statistics 619
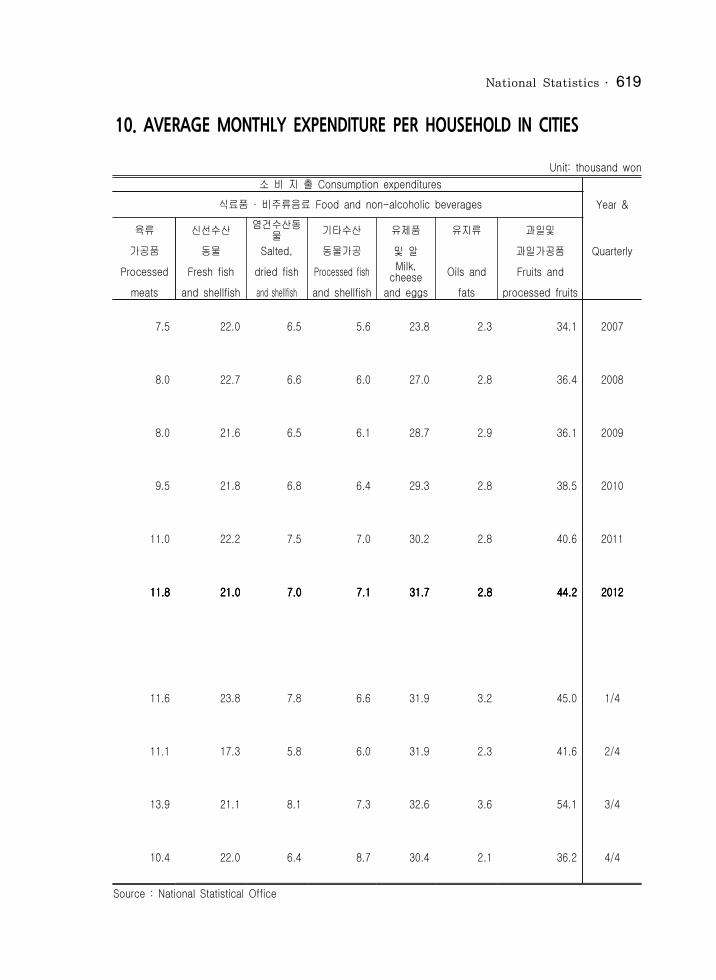
10. AVERAGE MONTHLY EXPENDITURE PER HOUSEHOLD IN CITIES
Unit: thousand won 소 비 지 출 Consumption expenditures
식료품 · 비주류음료 Food and non-alcoholic beverages Year &육류 신선수산 염건수산동물 기타수산 유제품 유지류 과일및
가공품 동물 Salted, 동물가공 및 알 과일가공품 QuarterlyProcessed Fresh fish dried fish Processed fish Milk, cheese Oils and Fruits and
meats and shellfish and shellfish and shellfish and eggs fats processed fruits
7.5 22.0 6.5 5.6 23.8 2.3 34.1 2007
8.0 22.7 6.6 6.0 27.0 2.8 36.4 2008
8.0 21.6 6.5 6.1 28.7 2.9 36.1 2009
9.5 21.8 6.8 6.4 29.3 2.8 38.5 2010
11.0 22.2 7.5 7.0 30.2 2.8 40.6 2011
11.8 11.8 11.8 11.8 21.0 21.0 21.0 21.0 7.0 7.0 7.0 7.0 7.1 7.1 7.1 7.1 31.7 31.7 31.7 31.7 2.8 2.8 2.8 2.8 44.2 44.2 44.2 44.2 2012201220122012
11.6 23.8 7.8 6.6 31.9 3.2 45.0 1/4
11.1 17.3 5.8 6.0 31.9 2.3 41.6 2/4
13.9 21.1 8.1 7.3 32.6 3.6 54.1 3/4
10.4 22.0 6.4 8.7 30.4 2.1 36.2 4/4
Source : National Statistical Office
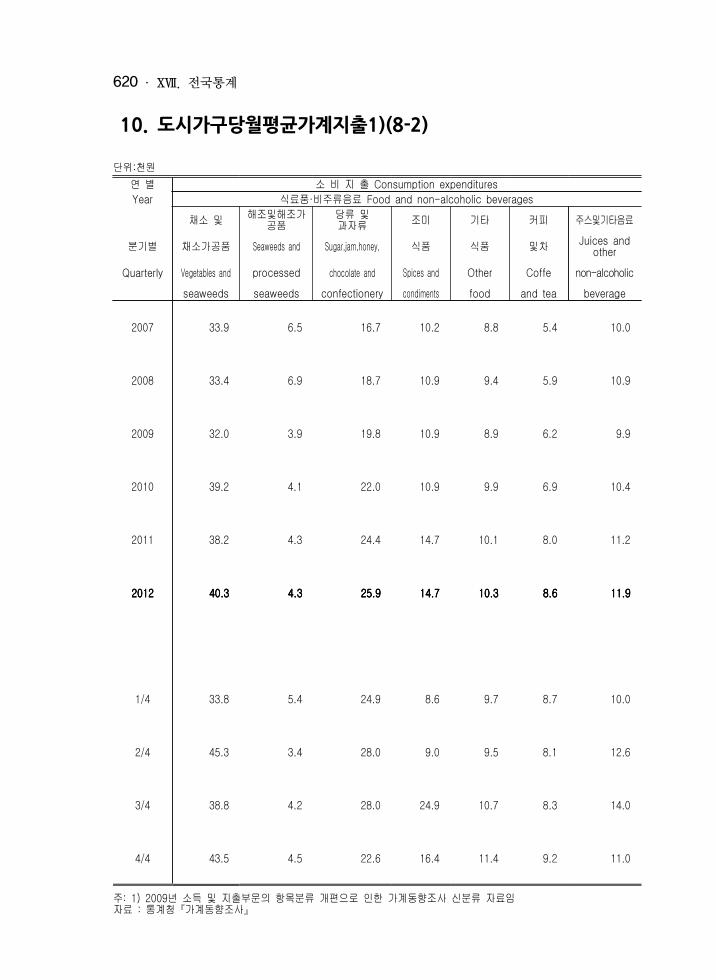
ⅩⅦ . 전국통계620
10. 도시가구당월평균가계지출1)(8-2)
단위:천원연 별 소 비 지 출 Consumption expendituresYear 식료품·비주류음료 Food and non-alcoholic beverages 채소 및 해조및해조가공품 당류 및 과자류 조미 기타 커피 주스및기타음료
분기별 채소가공품 Seaweeds and Sugar,jam,honey, 식품 식품 및차 Juices and otherQuarterly Vegetables and processed chocolate and Spices and Other Coffe non-alcoholic
seaweeds seaweeds confectionery condiments food and tea beverage
2007 33.9 6.5 16.7 10.2 8.8 5.4 10.0
2008 33.4 6.9 18.7 10.9 9.4 5.9 10.9
2009 32.0 3.9 19.8 10.9 8.9 6.2 9.9
2010 39.2 4.1 22.0 10.9 9.9 6.9 10.4
2011 38.2 4.3 24.4 14.7 10.1 8.0 11.2
2012201220122012 40.3 40.3 40.3 40.3 4.3 4.3 4.3 4.3 25.9 25.9 25.9 25.9 14.7 14.7 14.7 14.7 10.3 10.3 10.3 10.3 8.6 8.6 8.6 8.6 11.9 11.9 11.9 11.9
1/4 33.8 5.4 24.9 8.6 9.7 8.7 10.0
2/4 45.3 3.4 28.0 9.0 9.5 8.1 12.6
3/4 38.8 4.2 28.0 24.9 10.7 8.3 14.0
4/4 43.5 4.5 22.6 16.4 11.4 9.2 11.0
주: 1) 2009년 소득 및 지출부문의 항목분류 개편으로 인한 가계동향조사 신분류 자료임자료 : 통계청『가계동향조사』
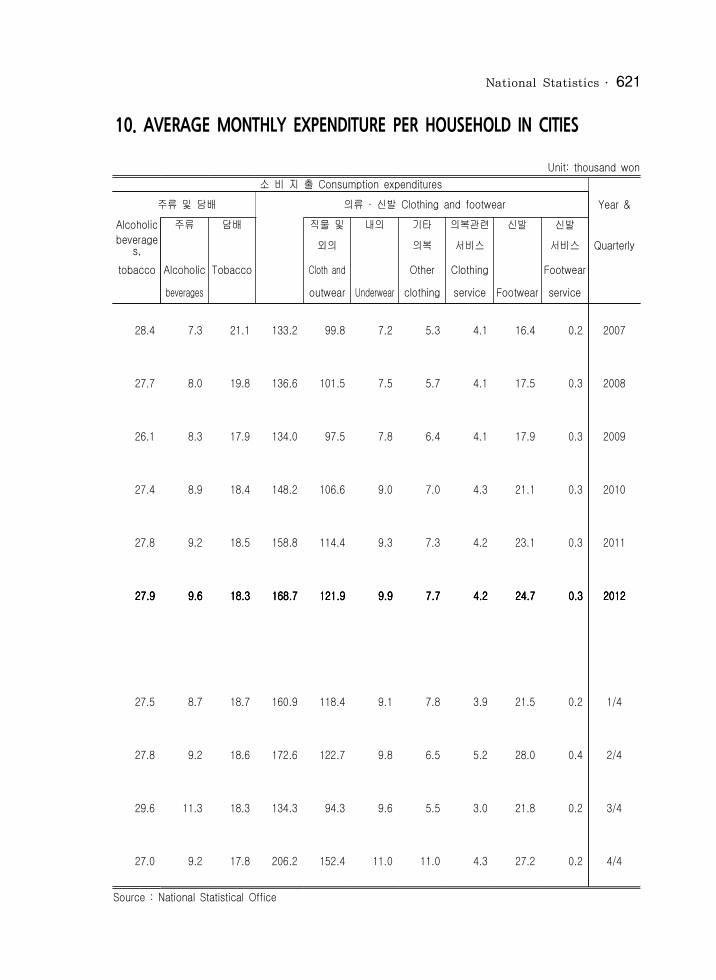
National Statistics 621
10. AVERAGE MONTHLY EXPENDITURE PER HOUSEHOLD IN CITIES
Unit: thousand won소 비 지 출 Consumption expenditures
주류 및 담배 의류 · 신발 Clothing and footwear Year &Alcoholic 주류 담배 직물 및 내의 기타 의복관련 신발 신발 beverages, 외의 의복 서비스 서비스 Quarterlytobacco Alcoholic Tobacco Cloth and Other Clothing Footwear
beverages outwear Underwear clothing service Footwear service
28.4 7.3 21.1 133.2 99.8 7.2 5.3 4.1 16.4 0.2 2007
27.7 8.0 19.8 136.6 101.5 7.5 5.7 4.1 17.5 0.3 2008
26.1 8.3 17.9 134.0 97.5 7.8 6.4 4.1 17.9 0.3 2009
27.4 8.9 18.4 148.2 106.6 9.0 7.0 4.3 21.1 0.3 2010
27.8 9.2 18.5 158.8 114.4 9.3 7.3 4.2 23.1 0.3 2011
27.9 27.9 27.9 27.9 9.6 9.6 9.6 9.6 18.3 18.3 18.3 18.3 168.7 168.7 168.7 168.7 121.9 121.9 121.9 121.9 9.9 9.9 9.9 9.9 7.7 7.7 7.7 7.7 4.2 4.2 4.2 4.2 24.7 24.7 24.7 24.7 0.3 0.3 0.3 0.3 2012201220122012
27.5 8.7 18.7 160.9 118.4 9.1 7.8 3.9 21.5 0.2 1/4
27.8 9.2 18.6 172.6 122.7 9.8 6.5 5.2 28.0 0.4 2/4
29.6 11.3 18.3 134.3 94.3 9.6 5.5 3.0 21.8 0.2 3/4
27.0 9.2 17.8 206.2 152.4 11.0 11.0 4.3 27.2 0.2 4/4
Source : National Statistical Office
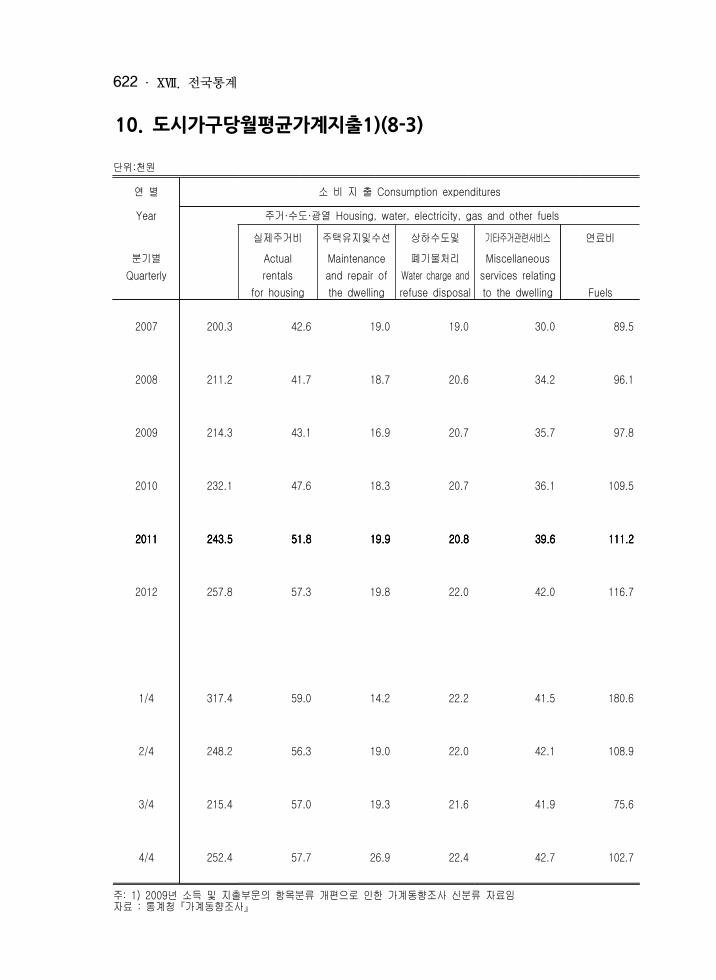
ⅩⅦ . 전국통계622
10. 도시가구당월평균가계지출1)(8-3)
단위:천원연 별 소 비 지 출 Consumption expendituresYear 주거·수도·광열 Housing, water, electricity, gas and other fuels 실제주거비 주택유지및수선 상하수도및 기타주거관련서비스 연료비
분기별 Actual Maintenance 폐기물처리 Miscellaneous Quarterly rentals and repair of Water charge and services relating
for housing the dwelling refuse disposal to the dwelling Fuels
2007 200.3 42.6 19.0 19.0 30.0 89.5
2008 211.2 41.7 18.7 20.6 34.2 96.1
2009 214.3 43.1 16.9 20.7 35.7 97.8
2010 232.1 47.6 18.3 20.7 36.1 109.5
2011201120112011 243.5 243.5 243.5 243.5 51.8 51.8 51.8 51.8 19.9 19.9 19.9 19.9 20.8 20.8 20.8 20.8 39.6 39.6 39.6 39.6 111.2 111.2 111.2 111.2
2012 257.8 57.3 19.8 22.0 42.0 116.7
1/4 317.4 59.0 14.2 22.2 41.5 180.6
2/4 248.2 56.3 19.0 22.0 42.1 108.9
3/4 215.4 57.0 19.3 21.6 41.9 75.6
4/4 252.4 57.7 26.9 22.4 42.7 102.7
주: 1) 2009년 소득 및 지출부문의 항목분류 개편으로 인한 가계동향조사 신분류 자료임자료 : 통계청『가계동향조사』

National Statistics 623
10. AVERAGE MONTHLY EXPENDITURE PER HOUSEHOLD IN CITIES
Unit: thousand won소 비 지 출 Consumption expenditures
가정용품·가사서비스 Furnishings, household equipment and routine household maintenance Year & 가구및조명 실내 가구·조명및 가정용 가전 및 가전관련서비스 Furniture and 장식 장식서비스 섬유 가정용기기 Servicesfor Quarterly lighting Interior Services for the Household Household household equipment decoration furniture and interior textiles appliances appliances
77.7 15.2 1.7 0.1 6.4 24.0 5.0 2007
75.2 13.0 1.6 0.1 6.1 20.8 5.4 2008
77.8 11.9 1.4 0.2 6.5 20.3 6.5 2009
88.3 13.8 1.6 0.2 7.5 22.3 7.2 2010
89.5 13.4 1.5 0.2 7.8 22.9 8.2 2011
94.9 94.9 94.9 94.9 15.9 15.9 15.9 15.9 1.6 1.6 1.6 1.6 0.3 0.3 0.3 0.3 8.0 8.0 8.0 8.0 22.5 22.5 22.5 22.5 9.3 9.3 9.3 9.3 2012201220122012
91.6 19.2 1.6 0.2 7.6 18.9 8.9 1/4
93.0 16.1 1.6 0.3 7.6 21.8 9.5 2/4
98.1 12.9 1.7 0.4 7.9 26.1 9.8 3/4
96.3 14.8 1.8 0.2 8.8 23.1 9.2 4/4
Source : National Statistical Office

ⅩⅦ . 전국통계624
10. 도시가구당월평균가계지출1)(8-4)
단위:천원연 별 소 비 지 출 Consumption expendituresYear 가정용품·가사서비스 Furnishings, household equipmentandroutinehouseholdmaintenance 보 건 Health 가사 가정용공구및기타 가사 가사 의약품 의료용 보건의료
분기별 용품 Toolsand 소모품 서비스 소모품 용품및기구Quarterly Household equipment Non-durable Household Medical Medical
utensils for household goods service product appliances
2007 5.1 2.5 8.6 9.1 128.8 36.4 5.3 6.4
2008 5.5 2.5 9.1 11.1 132.0 37.0 6.1 6.2
2009 6.6 2.1 9.8 12.5 143.0 38.7 6.1 5.9
2010 7.2 2.1 10.8 15.7 152.6 41.5 6.5 7.2
2011 7.6 2.6 11.1 13.9 157.5 42.5 6.6 7.3
2012201220122012 7.8 7.8 7.8 7.8 2.8 2.8 2.8 2.8 11.7 11.7 11.7 11.7 14.9 14.9 14.9 14.9 160.5 160.5 160.5 160.5 41.1 41.1 41.1 41.1 6.9 6.9 6.9 6.9 7.0 7.0 7.0 7.0
1/4 8.6 2.9 10.8 12.9 169.3 43.3 7.0 7.7
2/4 7.3 2.4 11.9 14.6 160.0 41.1 6.7 6.9
3/4 8.1 3.0 12.5 15.7 155.4 40.0 6.8 7.1
4/4 7.4 2.9 11.7 16.6 158.0 40.6 6.9 6.4
주: 1) 2009년 소득 및 지출부문의 항목분류 개편으로 인한 가계동향조사 신분류 자료임자료 : 통계청『가계동향조사』
National Statistics 625
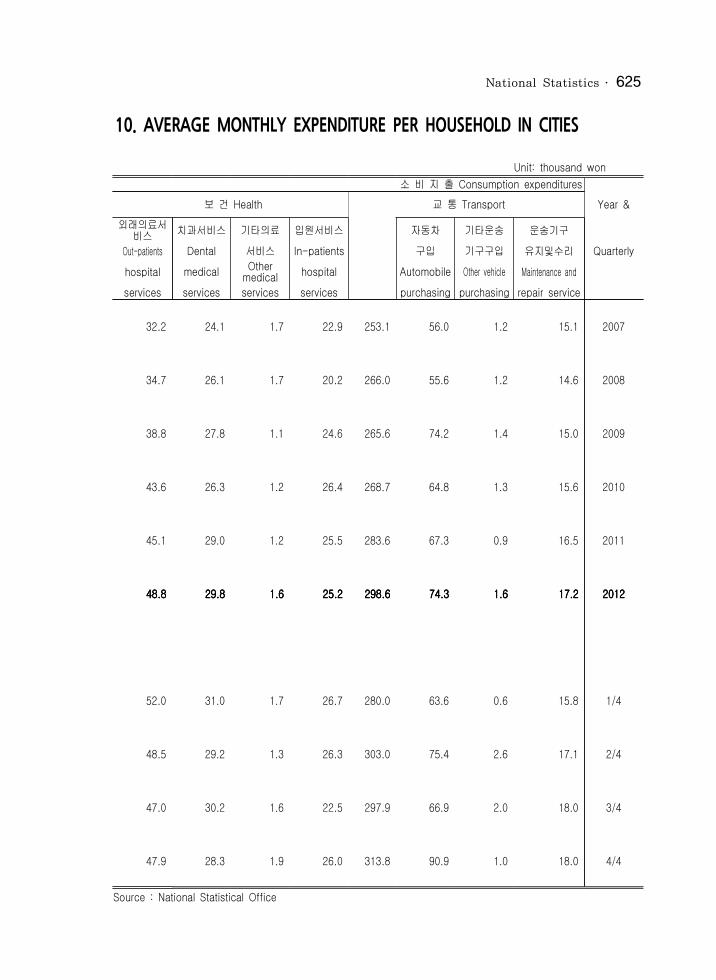
10. AVERAGE MONTHLY EXPENDITURE PER HOUSEHOLD IN CITIES
Unit: thousand won소 비 지 출 Consumption expenditures
보 건 Health 교 통 Transport Year &외래의료서비스 치과서비스 기타의료 입원서비스 자동차 기타운송 운송기구
Out-patients Dental 서비스 In-patients 구입 기구구입 유지및수리 Quarterlyhospital medical Other medical hospital Automobile Other vehicle Maintenance and services services services services purchasing purchasing repair service
32.2 24.1 1.7 22.9 253.1 56.0 1.2 15.1 2007
34.7 26.1 1.7 20.2 266.0 55.6 1.2 14.6 2008
38.8 27.8 1.1 24.6 265.6 74.2 1.4 15.0 2009
43.6 26.3 1.2 26.4 268.7 64.8 1.3 15.6 2010
45.1 29.0 1.2 25.5 283.6 67.3 0.9 16.5 2011
48.8 48.8 48.8 48.8 29.8 29.8 29.8 29.8 1.6 1.6 1.6 1.6 25.2 25.2 25.2 25.2 298.6 298.6 298.6 298.6 74.3 74.3 74.3 74.3 1.6 1.6 1.6 1.6 17.2 17.2 17.2 17.2 2012201220122012
52.0 31.0 1.7 26.7 280.0 63.6 0.6 15.8 1/4
48.5 29.2 1.3 26.3 303.0 75.4 2.6 17.1 2/4
47.0 30.2 1.6 22.5 297.9 66.9 2.0 18.0 3/4
47.9 28.3 1.9 26.0 313.8 90.9 1.0 18.0 4/4
Source : National Statistical Office

ⅩⅦ . 전국통계626
10. 도시가구당월평균가계지출1)(8-5)
단위:천원
연 별 분기별
소 비 지 출 Consumption expenditures 교 통 Transport 통신 Communication
운송기구 기타개인교통서비스 철도 육상 기타운송 기타교통 우편연료비 Private 운송 운송 Other 관련서비스 서비스
transportation Transport Transport passenger Other transportation Postal
Fuel services by railway by road transport services services
2007 111.3 8.6 6.7 26.8 23.8 3.6 136.8 0.3
2008 123.5 8.2 7.2 27.3 25.3 3.2 136.2 0.2
2009 107.8 9.9 6.4 24.2 24.1 2.7 132.3 0.2
2010 113.7 13.8 6.1 22.1 28.5 2.7 138.6 0.2
2011 124.8 13.3 5.7 20.4 30.8 3.5 143.0 0.2
2012201220122012 129.2 129.2 129.2 129.2 12.4 12.4 12.4 12.4 5.6 5.6 5.6 5.6 20.7 20.7 20.7 20.7 34.1 34.1 34.1 34.1 3.5 3.5 3.5 3.5 152.6 152.6 152.6 152.6 0.2 0.2 0.2 0.2
1/4 126.3 12.6 5.7 20.1 31.4 3.7 148.3 0.3
2/4 130.1 13.6 5.4 20.1 35.6 3.2 154.7 0.2
3/4 133.1 12.4 5.5 21.2 35.4 3.4 155.4 0.2
4/4 127.6 11.2 5.8 21.4 34.0 3.8 152.1 0.2
National Statistics 627
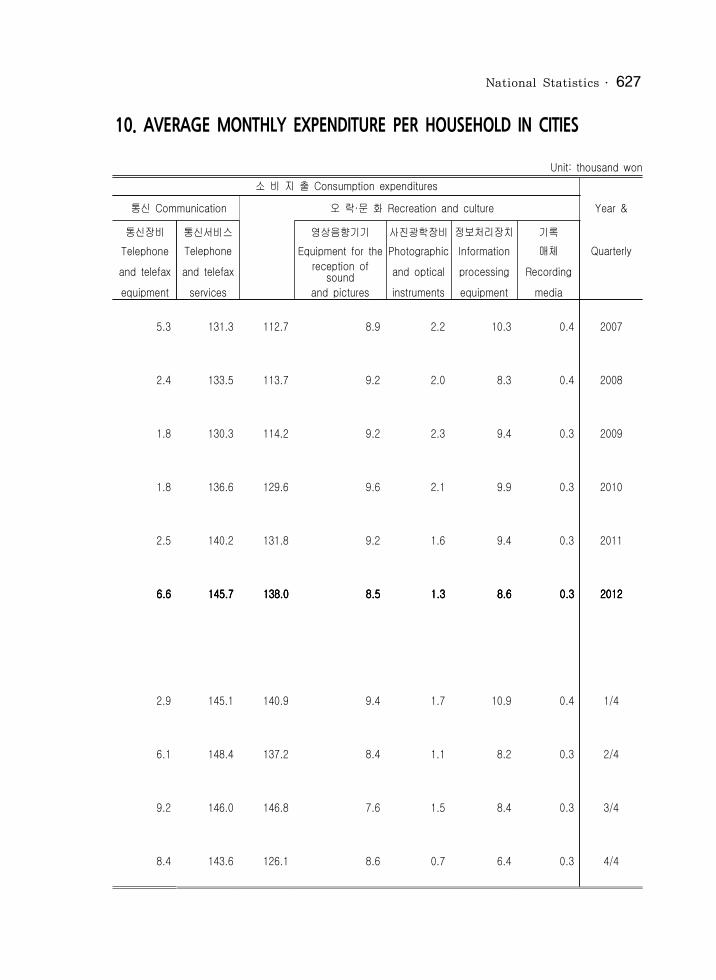
10. AVERAGE MONTHLY EXPENDITURE PER HOUSEHOLD IN CITIES
Unit: thousand won소 비 지 출 Consumption expenditures
통신 Communication 오 락·문 화 Recreation and culture Year &통신장비 통신서비스 영상음향기기 사진광학장비 정보처리장치 기록
Telephone Telephone Equipment for the Photographic Information 매체 Quarterlyand telefax and telefax reception of sound and optical processing Recording equipment services and pictures instruments equipment media
5.3 131.3 112.7 8.9 2.2 10.3 0.4 2007
2.4 133.5 113.7 9.2 2.0 8.3 0.4 2008
1.8 130.3 114.2 9.2 2.3 9.4 0.3 2009
1.8 136.6 129.6 9.6 2.1 9.9 0.3 2010
2.5 140.2 131.8 9.2 1.6 9.4 0.3 2011
6.6 6.6 6.6 6.6 145.7 145.7 145.7 145.7 138.0 138.0 138.0 138.0 8.5 8.5 8.5 8.5 1.3 1.3 1.3 1.3 8.6 8.6 8.6 8.6 0.3 0.3 0.3 0.3 2012201220122012
2.9 145.1 140.9 9.4 1.7 10.9 0.4 1/4
6.1 148.4 137.2 8.4 1.1 8.2 0.3 2/4
9.2 146.0 146.8 7.6 1.5 8.4 0.3 3/4
8.4 143.6 126.1 8.6 0.7 6.4 0.3 4/4
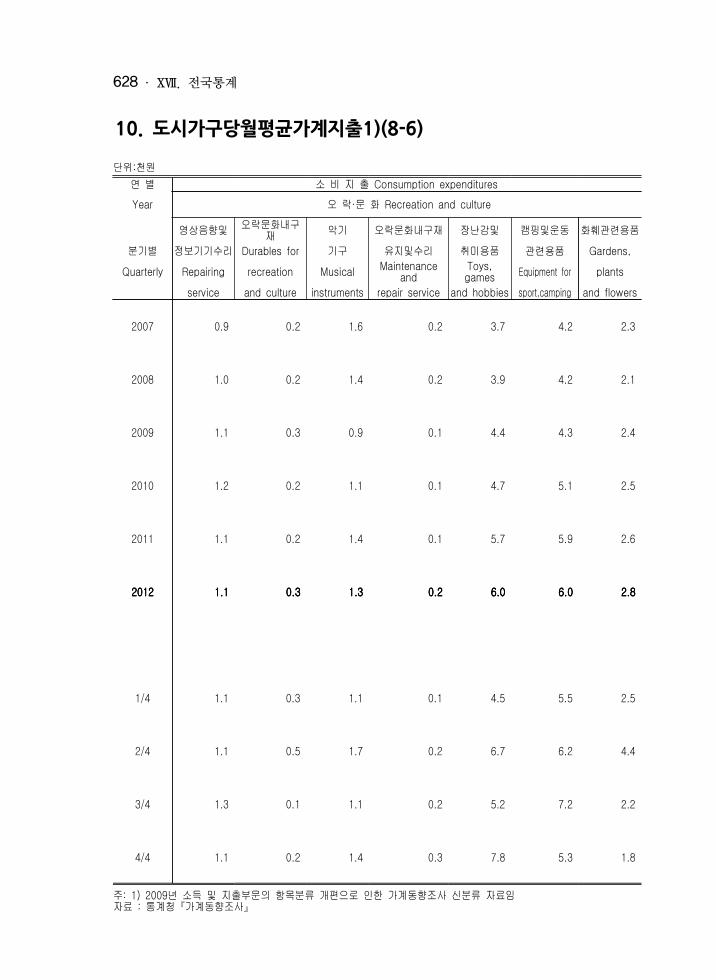
ⅩⅦ . 전국통계628
10. 도시가구당월평균가계지출1)(8-6)
단위:천원연 별 소 비 지 출 Consumption expendituresYear 오 락·문 화 Recreation and culture 영상음향및 오락문화내구재 악기 오락문화내구재 장난감및 캠핑및운동 화훼관련용품
분기별 정보기기수리 Durables for 기구 유지및수리 취미용품 관련용품 Gardens,Quarterly Repairing recreation Musical Maintenance and Toys, games Equipment for plants
service and culture instruments repair service and hobbies sport,camping and flowers
2007 0.9 0.2 1.6 0.2 3.7 4.2 2.3
2008 1.0 0.2 1.4 0.2 3.9 4.2 2.1
2009 1.1 0.3 0.9 0.1 4.4 4.3 2.4
2010 1.2 0.2 1.1 0.1 4.7 5.1 2.5
2011 1.1 0.2 1.4 0.1 5.7 5.9 2.6
2012201220122012 1.1 1.1 1.1 1.1 0.3 0.3 0.3 0.3 1.3 1.3 1.3 1.3 0.2 0.2 0.2 0.2 6.0 6.0 6.0 6.0 6.0 6.0 6.0 6.0 2.8 2.8 2.8 2.8
1/4 1.1 0.3 1.1 0.1 4.5 5.5 2.5
2/4 1.1 0.5 1.7 0.2 6.7 6.2 4.4
3/4 1.3 0.1 1.1 0.2 5.2 7.2 2.2
4/4 1.1 0.2 1.4 0.3 7.8 5.3 1.8
주: 1) 2009년 소득 및 지출부문의 항목분류 개편으로 인한 가계동향조사 신분류 자료임자료 : 통계청『가계동향조사』

National Statistics 629
10. AVERAGE MONTHLY EXPENDITURE PER HOUSEHOLD IN CITIES
Unit: thousand won소 비 지 출 Consumption expenditures
오락·문화 Recreation and culture Year &애완동물관련용품 화훼및애완동물서비스 운동및오락서비스 문화 복권 서적 기타인쇄물 문구 단체 Pets and Veterinary and Recreational 서비스 Other 여행 Quarterlyrelated other survices and cultural Cultural printed Package
products for pets services services Lottery Books matters Stationery tours
1.3 1.1 12.3 20.2 0.4 22.0 2.7 3.3 14.6 2007
1.3 1.1 13.9 21.5 0.3 23.7 3.1 3.4 12.4 2008
1.5 0.9 13.7 23.0 0.3 21.5 3.0 3.4 12.3 2009
1.7 1.1 15.3 24.8 0.3 22.3 2.9 3.8 20.4 2010
2.0 1.2 15.5 26.9 0.3 20.9 2.5 4.5 19.7 2011
2.3 2.3 2.3 2.3 1.4 1.4 1.4 1.4 16.3 16.3 16.3 16.3 28.4 28.4 28.4 28.4 0.4 0.4 0.4 0.4 19.3 19.3 19.3 19.3 2.4 2.4 2.4 2.4 5.0 5.0 5.0 5.0 25.9 25.9 25.9 25.9 2012201220122012
2.3 1.3 15.0 26.6 0.4 25.4 2.4 6.5 23.5 1/4
2.2 1.4 16.3 30.2 0.3 16.8 2.3 4.4 24.5 2/4
2.2 1.6 19.3 28.7 0.3 18.4 2.4 4.5 34.2 3/4
2.6 1.3 14.9 27.8 0.3 16.6 2.5 4.9 21.3 4/4
Source : National Statistical Office

ⅩⅦ . 전국통계630
10. 도시가구당월평균가계지출1)(8-7)
단위:천원연 별 소 비 지 출 Consumption expendituresYear 교 육 Education 정규교육 초등교육 중등 고등 학원및보습교육 학생학원교육
분기별 Pre-primary 교육 교육 Taking lessons at Taking lessons atQuarterly Regular and Primary Secondary Teritory Private institutes for Private institutes
education education education education students and Adult for students
2007 255.6 90.9 14.1 21.4 55.5 155.3 145.4
2008 289.4 97.2 17.7 24.6 54.9 181.5 170.8
2009 300.7 107.2 18.7 24.0 64.5 182.6 172.2
2010 306.9 112.0 18.7 23.8 69.5 181.1 171.0
2011 303.7 106.2 20.2 19.7 66.2 182.7 171.9
2012201220122012 298.7 298.7 298.7 298.7 98.4 98.4 98.4 98.4 17.1 17.1 17.1 17.1 19.1 19.1 19.1 19.1 62.2 62.2 62.2 62.2 185.1 185.1 185.1 185.1 173.8 173.8 173.8 173.8
1/4 378.9 182.7 20.3 19.5 143.0 184.5 171.6
2/4 238.8 34.9 14.4 19.1 1.4 184.2 173.2
3/4 342.2 139.7 17.8 19.9 102.1 187.0 175.6
4/4 235.1 36.2 15.9 18.1 2.2 185.0 174.9
주: 1) 2009년 소득 및 지출부문의 항목분류 개편으로 인한 가계동향조사 신분류 자료임자료 : 통계청『가계동향조사』

National Statistics 631
10. AVERAGE MONTHLY EXPENDITURE PER HOUSEHOLD IN CITIES
Unit: thousand won소 비 지 출 Consumption expenditures Year &
교육 Education 음식·숙박 Restaurants and hotels 기타상품·서비스 성인학원교육 기타교육 식사비 숙박비 이미용 이미용기기
Taking lessons at Restaurants, Miscellaneous 서비스 Appliances QuarterlyPrivate institutes Other cafes and Accommodation goods and Personal for personal
for adults education the like services services care care
9.9 9.4 281.9 275.3 6.6 181.6 31.3 0.6 2007
10.7 10.7 299.2 292.8 6.4 187.9 32.2 0.6 2008
10.3 10.9 284.9 280.0 4.8 185.6 29.1 0.6 2009
10.1 13.8 296.1 290.9 5.2 204.4 30.0 0.6 2010
10.8 14.7 306.1 300.1 5.9 217.4 31.1 0.7 2011
11.3 11.3 11.3 11.3 15.2 15.2 15.2 15.2 319.1 319.1 319.1 319.1 312.6 312.6 312.6 312.6 6.5 6.5 6.5 6.5 217.2 217.2 217.2 217.2 32.5 32.5 32.5 32.5 0.7 0.7 0.7 0.7 2012201220122012
12.8 11.8 304.0 297.3 6.7 231.1 35.4 0.8 1/4
11.0 19.6 329.5 325.0 4.4 221.1 31.5 0.7 2/4
11.4 15.4 329.9 318.9 11.1 209.0 29.8 0.7 3/4
10.0 13.9 314.1 310.2 3.8 206.8 33.2 0.7 4/4
Source : National Statistical Office
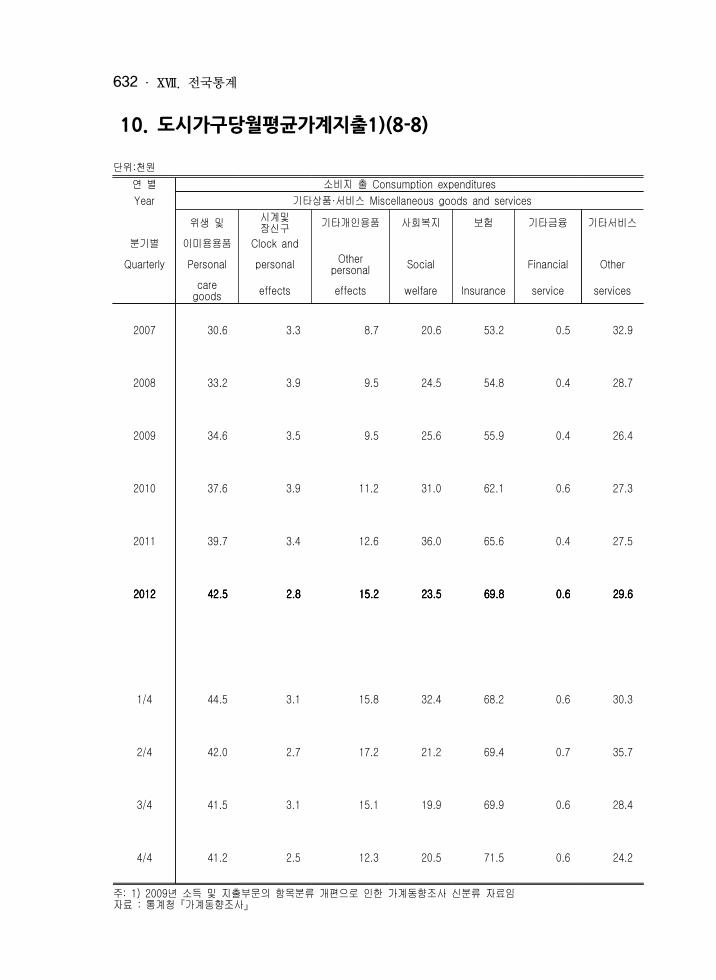
ⅩⅦ . 전국통계632
10. 도시가구당월평균가계지출1)(8-8)
단위:천원연 별 소비지 출 Consumption expendituresYear 기타상품·서비스 Miscellaneous goods and services 위생 및 시계및 장신구 기타개인용품 사회복지 보험 기타금융 기타서비스
분기별 이미용용품 Clock and Quarterly Personal personal Other personal Social Financial Other
care goods effects effects welfare Insurance service services
2007 30.6 3.3 8.7 20.6 53.2 0.5 32.9
2008 33.2 3.9 9.5 24.5 54.8 0.4 28.7
2009 34.6 3.5 9.5 25.6 55.9 0.4 26.4
2010 37.6 3.9 11.2 31.0 62.1 0.6 27.3
2011 39.7 3.4 12.6 36.0 65.6 0.4 27.5
2012201220122012 42.5 42.5 42.5 42.5 2.8 2.8 2.8 2.8 15.2 15.2 15.2 15.2 23.5 23.5 23.5 23.5 69.8 69.8 69.8 69.8 0.6 0.6 0.6 0.6 29.6 29.6 29.6 29.6
1/4 44.5 3.1 15.8 32.4 68.2 0.6 30.3
2/4 42.0 2.7 17.2 21.2 69.4 0.7 35.7
3/4 41.5 3.1 15.1 19.9 69.9 0.6 28.4
4/4 41.2 2.5 12.3 20.5 71.5 0.6 24.2
주: 1) 2009년 소득 및 지출부문의 항목분류 개편으로 인한 가계동향조사 신분류 자료임자료 : 통계청『가계동향조사』
National Statistics 633
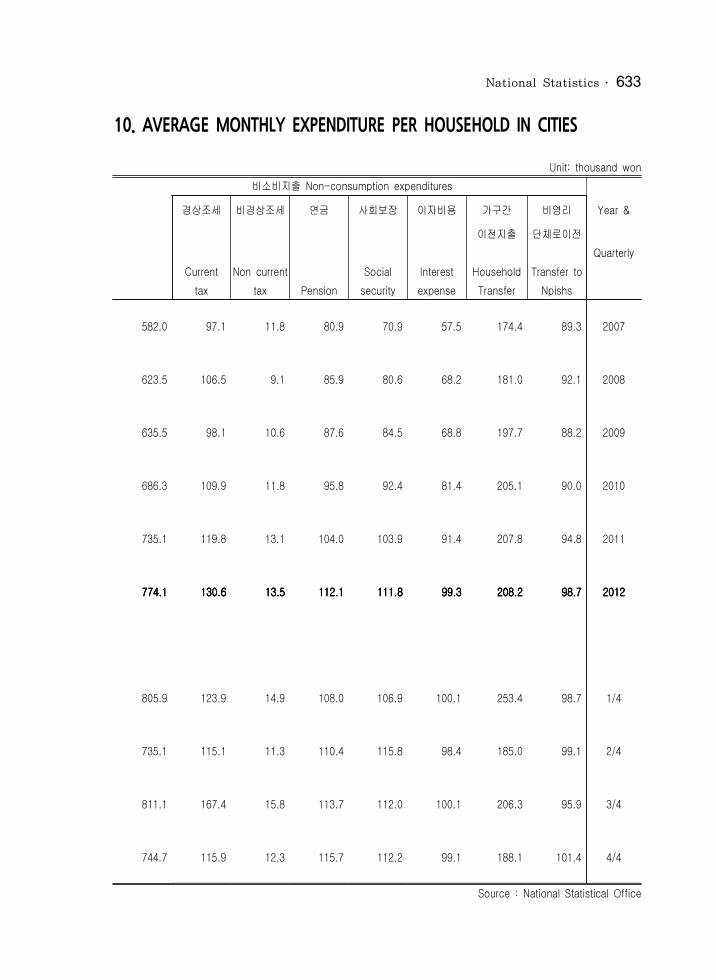
10. AVERAGE MONTHLY EXPENDITURE PER HOUSEHOLD IN CITIES
Unit: thousand won 비소비지출 Non-consumption expenditures
경상조세 비경상조세 연금 사회보장 이자비용 가구간 비영리 Year & 이전지출 단체로이전 Quarterly Current Non current Social Interest Household Transfer to tax tax Pension security expense Transfer Npishs
582.0 97.1 11.8 80.9 70.9 57.5 174.4 89.3 2007
623.5 106.5 9.1 85.9 80.6 68.2 181.0 92.1 2008
635.5 98.1 10.6 87.6 84.5 68.8 197.7 88.2 2009
686.3 109.9 11.8 95.8 92.4 81.4 205.1 90.0 2010
735.1 119.8 13.1 104.0 103.9 91.4 207.8 94.8 2011
774.1 774.1 774.1 774.1 130.6 130.6 130.6 130.6 13.5 13.5 13.5 13.5 112.1 112.1 112.1 112.1 111.8 111.8 111.8 111.8 99.3 99.3 99.3 99.3 208.2 208.2 208.2 208.2 98.7 98.7 98.7 98.7 2012201220122012
805.9 123.9 14.9 108.0 106.9 100.1 253.4 98.7 1/4
735.1 115.1 11.3 110.4 115.8 98.4 185.0 99.1 2/4
811.1 167.4 15.8 113.7 112.0 100.1 206.3 95.9 3/4
744.7 115.9 12.3 115.7 112.2 99.1 188.1 101.4 4/4
Source : National Statistical Office

ⅩⅦ . 전국통계634
11. 생산자 물가지수(9-1)
2010=100
연 월
월 별
총지수 상품 농림수산품
광산품
공산품
농산물 수산물 석탄,원유및천연가스 비금속광물
All items Goods Agricultural,forest&marineproductsAgricultural foods
Marine foods MiningproductsCoal, crude petroleum & natural gas
Non-metallic mineral productsManufacturingindustryproducts
가중치 1,000.0 701.9 33.8 18.7 5.5 2.4 0.4 2.0 611.4
2007 88.93 86.73 83.49 86.86 74.85 75.47 77.56 74.93 87.05
2008 96.53 96.20 84.41 83.54 77.45 82.27 80.07 82.83 97.59
2009 96.33 95.61 91.75 85.84 98.43 90.23 94.93 89.03 95.87
2010 100.00 100.00 100.00 100.00 100.00 100.00 100.00 100.00 100.00
2011 106.71 108.67 107.43 106.52 103.49 102.14 107.59 101.13 109.00
2012201220122012 107.45107.45107.45107.45 108.94108.94108.94108.94 108.33108.33108.33108.33 118.33118.33118.33118.33 96.5196.5196.5196.51 105.68105.68105.68105.68 115.81115.81115.81115.81 103.80103.80103.80103.80 108.57108.57108.57108.57
1월 107.65 109.52 107.32 113.83 97.78 105.22 115.40 103.32 109.41
2월 108.39 110.53 113.38 125.34 98.01 105.45 115.40 103.60 110.15
3월 108.92 111.17 115.12 127.16 98.71 105.45 115.40 103.60 110.74
4월 108.97 111.12 111.67 122.83 98.05 105.90 116.69 103.90 110.92
5월 108.37 110.25 111.14 121.71 97.23 106.24 119.03 103.90 110.01
6월 107.05 108.37 105.34 110.68 94.94 106.58 121.36 103.90 108.23
7월 106.58 107.63 104.88 111.58 95.14 106.24 119.03 103.90 107.39
8월 107.24 108.56 110.23 121.01 96.58 105.86 116.44 103.90 107.86
9월 107.62 109.17 112.52 127.95 97.16 105.26 112.30 103.90 108.41
10월 106.78 107.84 104.74 117.55 95.66 105.17 111.78 103.90 107.39
11월 106.05 106.77 100.45 107.34 93.57 105.17 111.78 103.90 106.45
12월 105.78 106.40 103.13 113.00 95.32 105.67 115.15 103.90 105.85자료 : 한국은행『월간물가』

National Statistics 635
11. PRODUCER PRICE INDEX
2010=100
Year
month
음식료품 섬유및가죽제품
식료품 음료품 사료 담배 섬유사및직물
섬유사 섬유직물
Food products & beverages
Food productsBeverages Feeds Cigarette
Fiber products & leather products
Yarns & threads & fabricsYarns & threads Fiber fabrics
39.4 26.4 5.5 6.1 1.4 20.4 3.7 1.7 2.0 Weight
82.00 79.63 90.99 67.00 100.00 89.09 79.13 74.94 83.79 2007
91.93 88.71 93.90 96.33 100.00 92.91 88.08 83.84 92.80 2008
98.57 96.80 98.37 104.78 100.00 96.61 93.52 88.33 99.30 2009
100.00 100.00 100.00 100.00 100.00 100.00 100.00 100.00 100.00 2010
106.60 106.22 103.53 112.09 103.66 108.41 113.53 117.87 107.80 2011
110.66110.66110.66110.66 110.7110.7110.7110.77777106.4106.4106.4106.44444
115.1115.1115.1115.16666 108.45108.45108.45108.45 110.67110.67110.67110.67 107.61107.61107.61107.61 104.94104.94104.94104.94 110.97110.97110.97110.97 2012201220122012
109.87 110.07 104.68 115.63 104.88 109.87 110.07 108.27 112.37 Jan.
110.00 110.02 104.68 115.37 110.23 110.19 110.71 109.73 112.06 Feb.
109.81 109.99 104.68 114.60 108.63 110.60 110.41 109.16 112.04 Mar.
109.82 110.06 104.68 114.42 108.63 110.48 109.41 107.04 112.41 Apr.
110.37 110.81 104.81 114.58 108.63 110.51 109.08 105.92 113.04 May
110.41 110.80 104.81 114.94 108.63 110.43 106.99 103.31 111.55 June
110.64 110.89 105.77 115.13 108.63 110.56 106.18 102.35 110.92 July
111.16 111.05 108.34 115.43 108.63 110.58 106.66 103.26 110.89 Aug.
111.26 111.17 108.40 115.43 108.63 111.47 106.31 103.08 110.35 Sept.
111.45 111.49 108.45 115.36 108.63 111.26 105.67 102.86 109.19 Oct.
111.53 111.63 108.47 115.21 108.63 111.12 105.14 102.33 108.68 Nov.
111.54 111.28 109.56 115.79 108.63 110.99 104.74 102.00 108.17 Dec. Source : The Bank of Korea

ⅩⅦ . 전국통계636
11. 생산자 물가지수(9-2)
2010=100
연 월
월 별
목재및종이제품
섬유및의복제품
가죽제품
목재및목제품섬유및직물제품 봉제및편조의류 의복관련장신품 가죽및모피 가방및신발Fibers & apparel products
Fiber & fabric productsSewn apparels & knitted apparels
Ornaments for apparelsLeather products Leather & fur Bags & footwear
Wood & paper productsWood & wooden products
가중치 14.3 3.7 10.3 0.3 2.4 0.5 1.9 16.2 3.9
2007 92.40 90.92 94.15 70.99 90.56 82.49 92.97 80.50 84.23
2008 94.41 96.00 94.53 75.25 94.15 94.22 94.12 89.56 91.78
2009 97.21 97.38 97.06 98.52 99.15 101.09 98.56 93.37 98.72
2010 100.00 100.00 100.00 100.00 100.00 100.00 100.00 100.00 100.00
2011 108.08 108.43 107.78 111.63 101.56 101.92 101.39 106.39 111.07
2012201220122012 112.36112.36112.36112.36 109.67109.67109.67109.67 113.05113.05113.05113.05 117.03117.03117.03117.03 102.28102.28102.28102.28 104.19104.19104.19104.19 101.80101.80101.80101.80 108.08108.08108.08108.08 111.72111.72111.72111.72
1월 110.75 109.79 110.86 115.21 102.90 105.70 102.09 109.38 113.93
2월 111.09 109.38 111.45 115.94 102.44 103.98 102.09 109.24 113.70
3월 111.69 109.41 112.23 116.96 102.47 104.10 102.09 109.09 113.39
4월 111.72 109.65 112.19 116.96 102.58 104.54 102.09 108.74 112.79
5월 111.79 109.74 112.27 116.96 102.82 105.40 102.09 108.51 112.37
6월 112.08 109.64 112.68 116.96 102.95 105.92 102.09 108.25 111.84
7월 112.46 110.08 113.06 116.92 102.43 104.90 101.74 108.14 111.76
8월 112.42 109.86 113.08 116.92 102.29 104.37 101.74 107.95 111.08
9월 113.64 109.90 114.68 117.88 102.56 104.05 102.24 107.67 110.38
10월 113.62 109.69 114.73 117.88 101.51 103.22 101.11 107.43 110.06
11월 113.55 109.51 114.71 117.88 101.27 102.31 101.11 107.31 109.85
12월 113.47 109.35 114.65 117.88 101.14 101.81 101.11 105.19 109.53자료 : 한국은행『월간물가』
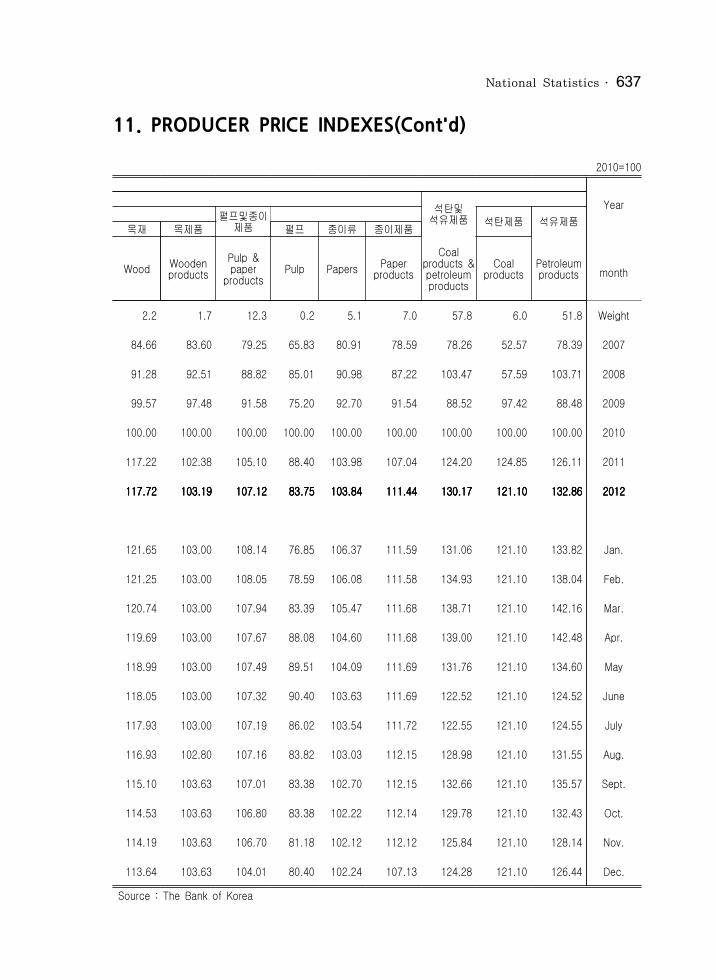
National Statistics 637
11. PRODUCER PRICE INDEXES(Cont'd)
2010=100
Year
month
석탄및석유제품
펄프및종이제품 석탄제품 석유제품목재 목제품 펄프 종이류 종이제품
Wood Wooden productsPulp & paper products Pulp Papers Paper products
Coal products & petroleum productsCoal products Petroleum products
2.2 1.7 12.3 0.2 5.1 7.0 57.8 6.0 51.8 Weight
84.66 83.60 79.25 65.83 80.91 78.59 78.26 52.57 78.39 2007
91.28 92.51 88.82 85.01 90.98 87.22 103.47 57.59 103.71 2008
99.57 97.48 91.58 75.20 92.70 91.54 88.52 97.42 88.48 2009
100.00 100.00 100.00 100.00 100.00 100.00 100.00 100.00 100.00 2010
117.22 102.38 105.10 88.40 103.98 107.04 124.20 124.85 126.11 2011
117.72117.72117.72117.72 103.19103.19103.19103.19 107.12107.12107.12107.12 83.7583.7583.7583.75 103.84103.84103.84103.84 111.44111.44111.44111.44 130.17130.17130.17130.17 121.10121.10121.10121.10 132.86132.86132.86132.86 2012201220122012
121.65 103.00 108.14 76.85 106.37 111.59 131.06 121.10 133.82 Jan.
121.25 103.00 108.05 78.59 106.08 111.58 134.93 121.10 138.04 Feb.
120.74 103.00 107.94 83.39 105.47 111.68 138.71 121.10 142.16 Mar.
119.69 103.00 107.67 88.08 104.60 111.68 139.00 121.10 142.48 Apr.
118.99 103.00 107.49 89.51 104.09 111.69 131.76 121.10 134.60 May
118.05 103.00 107.32 90.40 103.63 111.69 122.52 121.10 124.52 June
117.93 103.00 107.19 86.02 103.54 111.72 122.55 121.10 124.55 July
116.93 102.80 107.16 83.82 103.03 112.15 128.98 121.10 131.55 Aug.
115.10 103.63 107.01 83.38 102.70 112.15 132.66 121.10 135.57 Sept.
114.53 103.63 106.80 83.38 102.22 112.14 129.78 121.10 132.43 Oct.
114.19 103.63 106.70 81.18 102.12 112.12 125.84 121.10 128.14 Nov.
113.64 103.63 104.01 80.40 102.24 107.13 124.28 121.10 126.44 Dec. Source : The Bank of Korea
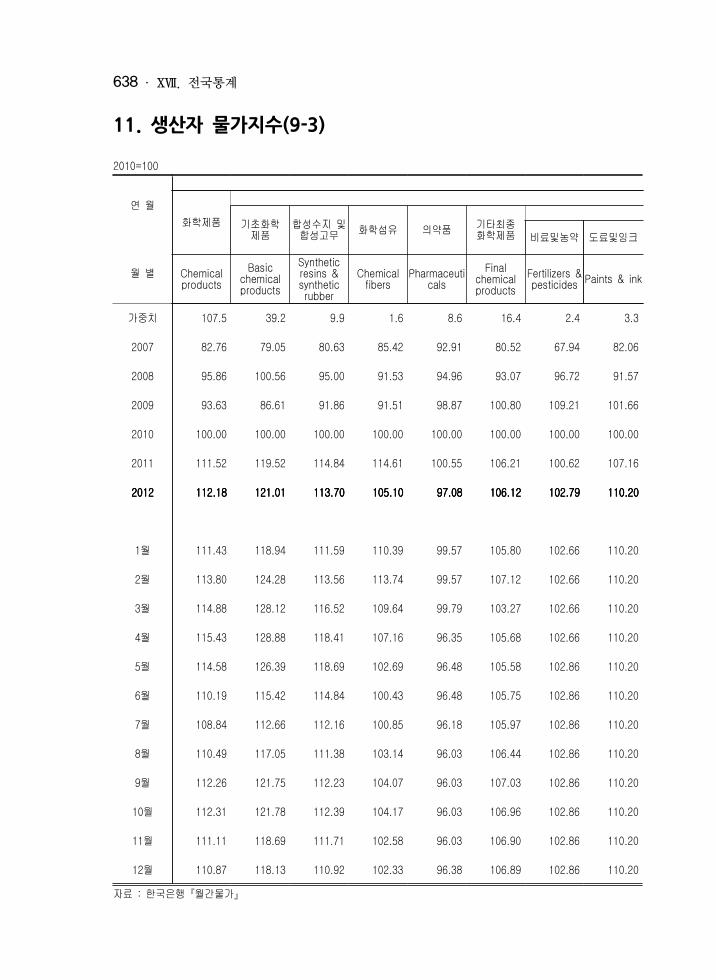
ⅩⅦ . 전국통계638
11. 생산자 물가지수(9-3)
2010=100
연 월
월 별
화학제품
기초화학제품 합성수지 및합성고무 화학섬유 의약품 기타최종화학제품
비료및농약 도료및잉크
Chemical productsBasic chemical products
Synthetic resins & synthetic rubberChemical fibers Pharmaceuticals
Final chemical productsFertilizers & pesticides Paints & ink
가중치 107.5 39.2 9.9 1.6 8.6 16.4 2.4 3.3
2007 82.76 79.05 80.63 85.42 92.91 80.52 67.94 82.06
2008 95.86 100.56 95.00 91.53 94.96 93.07 96.72 91.57
2009 93.63 86.61 91.86 91.51 98.87 100.80 109.21 101.66
2010 100.00 100.00 100.00 100.00 100.00 100.00 100.00 100.00
2011 111.52 119.52 114.84 114.61 100.55 106.21 100.62 107.16
2012201220122012 112.18112.18112.18112.18 121.01121.01121.01121.01 113.70113.70113.70113.70 105.10105.10105.10105.10 97.0897.0897.0897.08 106.12106.12106.12106.12 102.79102.79102.79102.79 110.20110.20110.20110.20
1월 111.43 118.94 111.59 110.39 99.57 105.80 102.66 110.20
2월 113.80 124.28 113.56 113.74 99.57 107.12 102.66 110.20
3월 114.88 128.12 116.52 109.64 99.79 103.27 102.66 110.20
4월 115.43 128.88 118.41 107.16 96.35 105.68 102.66 110.20
5월 114.58 126.39 118.69 102.69 96.48 105.58 102.86 110.20
6월 110.19 115.42 114.84 100.43 96.48 105.75 102.86 110.20
7월 108.84 112.66 112.16 100.85 96.18 105.97 102.86 110.20
8월 110.49 117.05 111.38 103.14 96.03 106.44 102.86 110.20
9월 112.26 121.75 112.23 104.07 96.03 107.03 102.86 110.20
10월 112.31 121.78 112.39 104.17 96.03 106.96 102.86 110.20
11월 111.11 118.69 111.71 102.58 96.03 106.90 102.86 110.20
12월 110.87 118.13 110.92 102.33 96.38 106.89 102.86 110.20자료 : 한국은행『월간물가』

National Statistics 639
11. PRODUCER PRICE INDEXES(Cont'd)
2010=100
Year
month
비금속광물제품
플라스틱제품 고무제품 유리제품 도자기및점토제품시멘트및콘크리트제품
기타비금속광물제품비누및화장품 기타화학제품
Soaps & cosmeticsOther chemical products
Plastic products Rubber productsNon-metallic mineral products
Glass productsCeramic ware & clay products
Cement & concrete productsOther non-metallic mineral products
3.7 7.0 26.0 5.8 20.1 6.3 1.5 8.8 3.5 Weight
91.12 77.64 87.10 79.53 83.92 86.22 77.08 86.43 74.11 2007
95.79 88.34 94.90 88.51 93.62 100.18 89.11 93.43 85.05 2008
98.39 94.75 96.10 95.75 101.24 105.84 100.53 100.09 97.64 2009
100.00 100.00 100.00 100.00 100.00 100.00 100.00 100.00 100.00 2010
103.02 110.71 106.22 108.19 100.25 95.96 104.28 101.39 102.30 2011
100.92100.92100.92100.92 109.06109.06109.06109.06 107.64107.64107.64107.64 114.99114.99114.99114.99 102.97102.97102.97102.97 87.8687.8687.8687.86 106.90106.90106.90106.90 111.59111.59111.59111.59 106.59106.59106.59106.59 2012201220122012
100.04 108.89 107.42 114.98 101.62 93.37 106.32 105.27 103.50 Jan.
100.26 112.44 107.40 114.83 100.92 89.77 106.44 106.45 103.69 Feb.
100.43 101.54 107.56 114.87 102.09 87.23 106.98 110.12 106.37 Mar.
100.91 107.92 107.87 114.75 103.55 88.29 106.98 112.68 106.37 Apr.
100.86 107.56 108.24 114.84 104.47 90.16 106.98 112.86 107.63 May
100.78 108.11 107.99 114.93 104.75 91.05 106.98 112.97 107.15 June
100.01 109.30 107.57 114.87 103.62 87.70 106.98 113.03 107.16 July
99.99 110.64 107.74 115.34 103.29 86.47 106.98 113.15 107.44 Aug.
101.80 110.90 107.31 115.25 103.30 86.55 106.98 113.15 107.27 Sept.
102.03 110.55 107.44 115.14 103.38 86.81 106.98 113.15 107.21 Oct.
101.89 110.48 107.53 115.02 102.81 84.92 106.98 113.15 107.69 Nov.
102.02 110.36 107.56 115.02 101.79 81.98 107.23 113.15 107.55 Dec. Source : The Bank of Korea
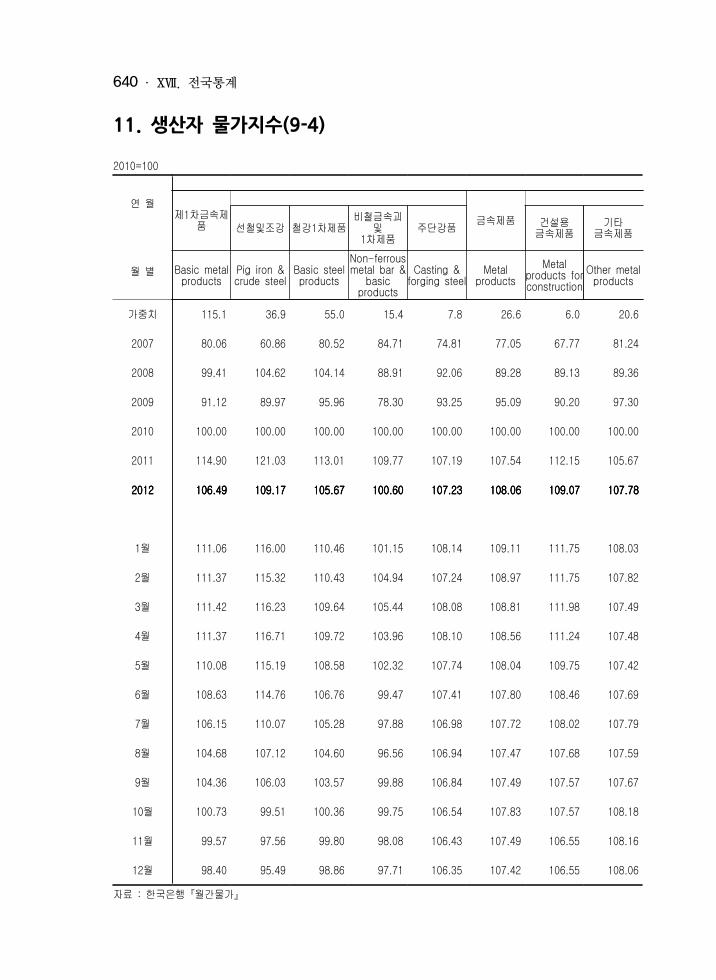
ⅩⅦ . 전국통계640
11. 생산자 물가지수(9-4)
2010=100
연 월
월 별
제1차금속제품
금속제품
선철및조강 철강1차제품 비철금속괴및1차제품 주단강품 건설용금속제품 기타금속제품
Basic metal products Pig iron & crude steel Basic steel productsNon-ferrous metal bar & basic products
Casting & forging steel Metal productsMetal products for construction
Other metal products
가중치 115.1 36.9 55.0 15.4 7.8 26.6 6.0 20.6
2007 80.06 60.86 80.52 84.71 74.81 77.05 67.77 81.24
2008 99.41 104.62 104.14 88.91 92.06 89.28 89.13 89.36
2009 91.12 89.97 95.96 78.30 93.25 95.09 90.20 97.30
2010 100.00 100.00 100.00 100.00 100.00 100.00 100.00 100.00
2011 114.90 121.03 113.01 109.77 107.19 107.54 112.15 105.67
2012201220122012 106.49106.49106.49106.49 109.17109.17109.17109.17 105.67105.67105.67105.67 100.60100.60100.60100.60 107.23107.23107.23107.23 108.06108.06108.06108.06 109.07109.07109.07109.07 107.78107.78107.78107.78
1월 111.06 116.00 110.46 101.15 108.14 109.11 111.75 108.03
2월 111.37 115.32 110.43 104.94 107.24 108.97 111.75 107.82
3월 111.42 116.23 109.64 105.44 108.08 108.81 111.98 107.49
4월 111.37 116.71 109.72 103.96 108.10 108.56 111.24 107.48
5월 110.08 115.19 108.58 102.32 107.74 108.04 109.75 107.42
6월 108.63 114.76 106.76 99.47 107.41 107.80 108.46 107.69
7월 106.15 110.07 105.28 97.88 106.98 107.72 108.02 107.79
8월 104.68 107.12 104.60 96.56 106.94 107.47 107.68 107.59
9월 104.36 106.03 103.57 99.88 106.84 107.49 107.57 107.67
10월 100.73 99.51 100.36 99.75 106.54 107.83 107.57 108.18
11월 99.57 97.56 99.80 98.08 106.43 107.49 106.55 108.16
12월 98.40 95.49 98.86 97.71 106.35 107.42 106.55 108.06자료 : 한국은행『월간물가』

National Statistics 641
11. PRODUCER PRICE INDEXES(Cont'd)
2010=100
Year
month
일반기계
일반목적용기계및장비 특수목적용기계및장비금속제탱크 금속제부착및부속품 공구및철선제품 기타금속제품
Metal tanksMetal attachment & components
Tools & steel wire productsOther metal products
General machineryGeneral purpose machinery & equipment
Special purpose machinery & equipment1.9 3.1 4.8 10.8 50.0 27.6 22.4 Weight
82.85 84.51 78.90 78.18 91.34 90.64 92.46 2007
86.78 88.51 92.30 88.72 95.63 95.62 95.64 2008
94.31 99.79 96.41 96.50 99.85 100.75 98.42 2009
100.00 100.00 100.00 100.00 100.00 100.00 100.00 2010
109.87 104.64 109.83 101.68 104.34 104.86 103.60 2011
115.68115.68115.68115.68 105.14105.14105.14105.14 112.72112.72112.72112.72 102.67102.67102.67102.67 106.68106.68106.68106.68 107.89107.89107.89107.89 104.93104.93104.93104.93 2012201220122012
114.62 107.71 112.82 102.50 106.24 107.33 104.65 Jan.
114.62 106.48 112.82 102.50 106.42 107.45 104.92 Feb.
114.67 104.27 112.70 102.63 106.45 107.60 104.77 Mar.
114.67 104.05 112.82 102.63 106.61 107.78 104.89 Apr.
114.67 103.93 112.68 102.63 106.55 107.73 104.85 May
114.67 105.14 112.74 102.76 106.71 108.01 104.85 June
114.67 105.19 113.05 102.76 106.83 108.17 104.88 July
114.67 105.20 112.41 102.68 106.85 108.21 104.88 Aug.
114.67 105.20 112.62 102.76 106.87 108.21 104.94 Sept.
118.73 105.17 112.58 102.76 106.88 108.06 105.18 Oct.
118.73 105.07 112.58 102.76 106.87 108.04 105.18 Nov.
118.73 104.31 112.76 102.70 106.87 108.04 105.18 Dec. Source : The Bank of Korea
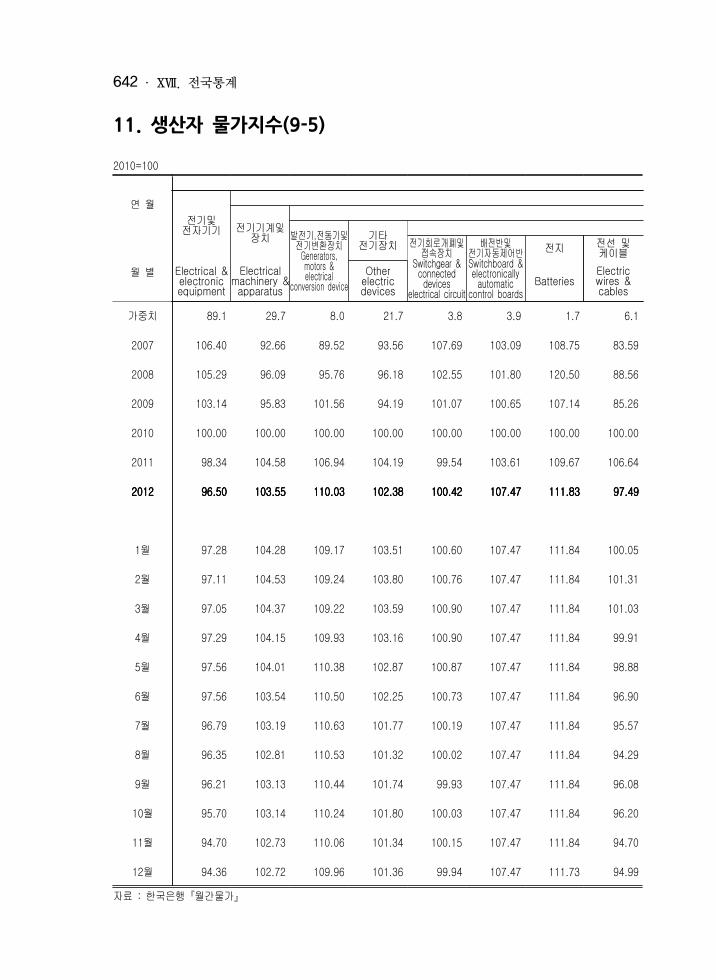
ⅩⅦ . 전국통계642
11. 생산자 물가지수(9-5)
2010=100
연 월
월 별
전기및전자기기
전기기계및장치
발전기,전동기및전기변환장치Generators, motors & electrical conversion device
기타전기장치
전기회로개폐및접속장치Switchgear & connected devices electrical circuit
배전반및전기자동제어반Switchboard & electronically automatic control boards
전지 전선 및 케이블Electrical & electronic equipment
Electrical machinery & apparatusOther electric devices Batteries Electric wires & cables
가중치 89.1 29.7 8.0 21.7 3.8 3.9 1.7 6.1
2007 106.40 92.66 89.52 93.56 107.69 103.09 108.75 83.59
2008 105.29 96.09 95.76 96.18 102.55 101.80 120.50 88.56
2009 103.14 95.83 101.56 94.19 101.07 100.65 107.14 85.26
2010 100.00 100.00 100.00 100.00 100.00 100.00 100.00 100.00
2011 98.34 104.58 106.94 104.19 99.54 103.61 109.67 106.64
2012201220122012 96.5096.5096.5096.50 103.55103.55103.55103.55 110.03110.03110.03110.03 102.38102.38102.38102.38 100.42100.42100.42100.42 107.47107.47107.47107.47 111.83111.83111.83111.83 97.4997.4997.4997.49
1월 97.28 104.28 109.17 103.51 100.60 107.47 111.84 100.05
2월 97.11 104.53 109.24 103.80 100.76 107.47 111.84 101.31
3월 97.05 104.37 109.22 103.59 100.90 107.47 111.84 101.03
4월 97.29 104.15 109.93 103.16 100.90 107.47 111.84 99.91
5월 97.56 104.01 110.38 102.87 100.87 107.47 111.84 98.88
6월 97.56 103.54 110.50 102.25 100.73 107.47 111.84 96.90
7월 96.79 103.19 110.63 101.77 100.19 107.47 111.84 95.57
8월 96.35 102.81 110.53 101.32 100.02 107.47 111.84 94.29
9월 96.21 103.13 110.44 101.74 99.93 107.47 111.84 96.08
10월 95.70 103.14 110.24 101.80 100.03 107.47 111.84 96.20
11월 94.70 102.73 110.06 101.34 100.15 107.47 111.84 94.70
12월 94.36 102.72 109.96 101.36 99.94 107.47 111.73 94.99자료 : 한국은행『월간물가』
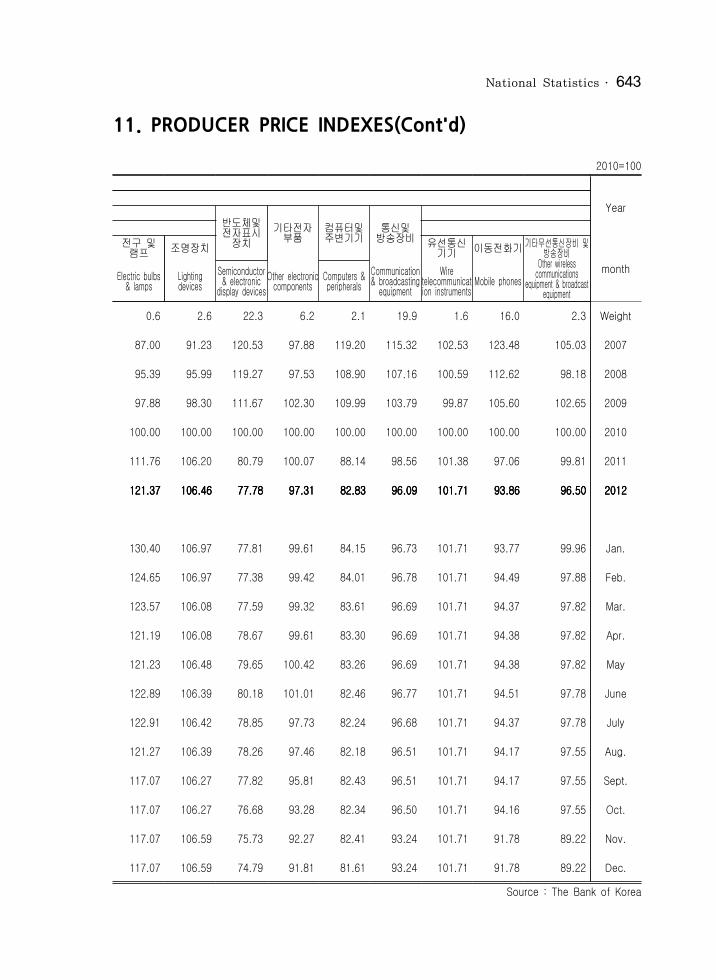
National Statistics 643
11. PRODUCER PRICE INDEXES(Cont'd)
2010=100
Year
month
반도체및전자표시장치
기타전자부품 컴퓨터및주변기기 통신및방송장비
전구 및 램프 조명장치 유선통신기기 이동전화기 기타무선통신장비 및 방송장비Other wireless communications equipment & broadcast equipment
Electric bulbs & lamps Lighting devicesSemiconductor & electronic display devices
Other electronic components Computers & peripheralsCommunication & broadcasting equipment
Wire telecommunication instruments Mobile phones
0.6 2.6 22.3 6.2 2.1 19.9 1.6 16.0 2.3 Weight
87.00 91.23 120.53 97.88 119.20 115.32 102.53 123.48 105.03 2007
95.39 95.99 119.27 97.53 108.90 107.16 100.59 112.62 98.18 2008
97.88 98.30 111.67 102.30 109.99 103.79 99.87 105.60 102.65 2009
100.00 100.00 100.00 100.00 100.00 100.00 100.00 100.00 100.00 2010
111.76 106.20 80.79 100.07 88.14 98.56 101.38 97.06 99.81 2011
121.37121.37121.37121.37 106.46106.46106.46106.46 77.7877.7877.7877.78 97.3197.3197.3197.31 82.8382.8382.8382.83 96.0996.0996.0996.09 101.71101.71101.71101.71 93.8693.8693.8693.86 96.5096.5096.5096.50 2012201220122012
130.40 106.97 77.81 99.61 84.15 96.73 101.71 93.77 99.96 Jan.
124.65 106.97 77.38 99.42 84.01 96.78 101.71 94.49 97.88 Feb.
123.57 106.08 77.59 99.32 83.61 96.69 101.71 94.37 97.82 Mar.
121.19 106.08 78.67 99.61 83.30 96.69 101.71 94.38 97.82 Apr.
121.23 106.48 79.65 100.42 83.26 96.69 101.71 94.38 97.82 May
122.89 106.39 80.18 101.01 82.46 96.77 101.71 94.51 97.78 June
122.91 106.42 78.85 97.73 82.24 96.68 101.71 94.37 97.78 July
121.27 106.39 78.26 97.46 82.18 96.51 101.71 94.17 97.55 Aug.
117.07 106.27 77.82 95.81 82.43 96.51 101.71 94.17 97.55 Sept.
117.07 106.27 76.68 93.28 82.34 96.50 101.71 94.16 97.55 Oct.
117.07 106.59 75.73 92.27 82.41 93.24 101.71 91.78 89.22 Nov.
117.07 106.59 74.79 91.81 81.61 93.24 101.71 91.78 89.22 Dec. Source : The Bank of Korea
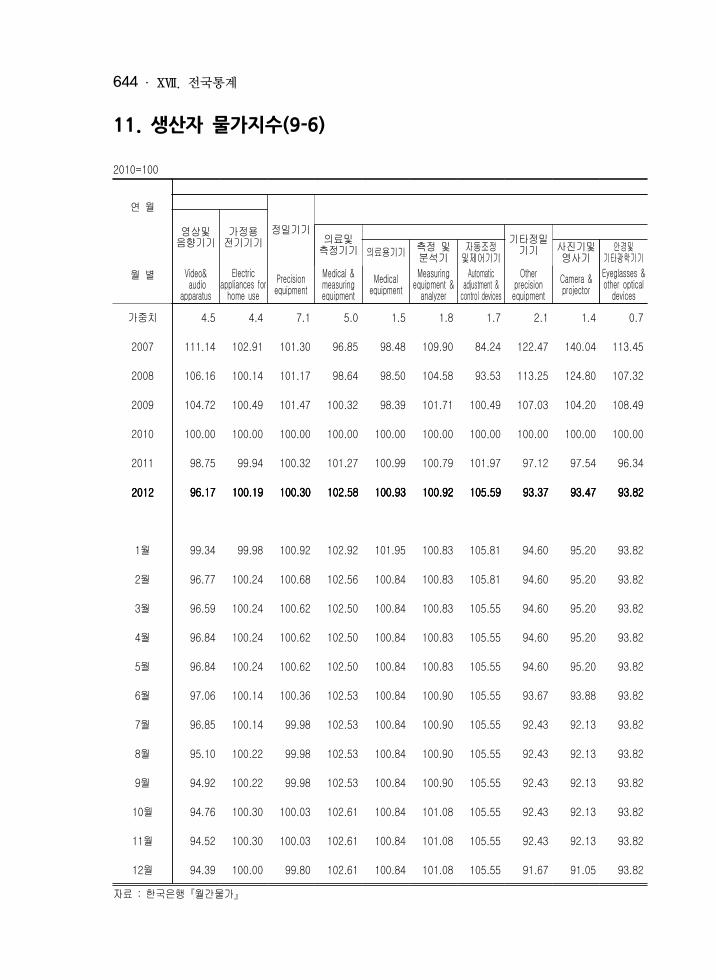
ⅩⅦ . 전국통계644
11. 생산자 물가지수(9-6)
2010=100
연 월
월 별
정밀기기
영상및음향기기 가정용전기기기
의료및측정기기 기타정밀기기
의료용기기 측정 및 분석기 자동조정및제어기기 사진기및영사기 안경및기타광학기기
Video& audio apparatusElectric appliances for home use
Precision equipmentMedical & measuring equipment
Medical equipmentMeasuring equipment & analyzer
Automatic adjustment & control devicesOther precision equipment
Camera & projectorEyeglasses & other optical devices
가중치 4.5 4.4 7.1 5.0 1.5 1.8 1.7 2.1 1.4 0.7
2007 111.14 102.91 101.30 96.85 98.48 109.90 84.24 122.47 140.04 113.45
2008 106.16 100.14 101.17 98.64 98.50 104.58 93.53 113.25 124.80 107.32
2009 104.72 100.49 101.47 100.32 98.39 101.71 100.49 107.03 104.20 108.49
2010 100.00 100.00 100.00 100.00 100.00 100.00 100.00 100.00 100.00 100.00
2011 98.75 99.94 100.32 101.27 100.99 100.79 101.97 97.12 97.54 96.34
2012201220122012 96.1796.1796.1796.17 100.19100.19100.19100.19 100.30100.30100.30100.30 102.58102.58102.58102.58 100.93100.93100.93100.93 100.92100.92100.92100.92 105.59105.59105.59105.59 93.3793.3793.3793.37 93.4793.4793.4793.47 93.8293.8293.8293.82
1월 99.34 99.98 100.92 102.92 101.95 100.83 105.81 94.60 95.20 93.82
2월 96.77 100.24 100.68 102.56 100.84 100.83 105.81 94.60 95.20 93.82
3월 96.59 100.24 100.62 102.50 100.84 100.83 105.55 94.60 95.20 93.82
4월 96.84 100.24 100.62 102.50 100.84 100.83 105.55 94.60 95.20 93.82
5월 96.84 100.24 100.62 102.50 100.84 100.83 105.55 94.60 95.20 93.82
6월 97.06 100.14 100.36 102.53 100.84 100.90 105.55 93.67 93.88 93.82
7월 96.85 100.14 99.98 102.53 100.84 100.90 105.55 92.43 92.13 93.82
8월 95.10 100.22 99.98 102.53 100.84 100.90 105.55 92.43 92.13 93.82
9월 94.92 100.22 99.98 102.53 100.84 100.90 105.55 92.43 92.13 93.82
10월 94.76 100.30 100.03 102.61 100.84 101.08 105.55 92.43 92.13 93.82
11월 94.52 100.30 100.03 102.61 100.84 101.08 105.55 92.43 92.13 93.82
12월 94.39 100.00 99.80 102.61 100.84 101.08 105.55 91.67 91.05 93.82자료 : 한국은행『월간물가』

National Statistics 645
11. PRODUCER PRICE INDEXES(Cont'd)
2010=100
전력, 가스 및 수도
Year
month
수송장비
기타제조업제품
자동차 기타수송장비
전력가구 장난감및운동용품 기타제조업제품Transport equipment Motor vehicles Other transport equipment
Other manufacturing products Furniture Toys & sporting goodsOther manufacturing products
Electric power, gas & water supply Electric power
52.9 52.6 0.3 9.2 7.1 0.5 1.6 54.3 29.5 Weight
95.58 95.66 81.42 92.27 92.03 91.91 95.62 86.41 90.88 2007
96.83 96.90 82.28 93.41 93.24 92.20 94.38 90.05 90.85 2008
98.06 98.08 95.01 99.21 98.61 98.70 102.22 96.07 96.24 2009
100.00 100.00 100.00 100.00 100.00 100.00 100.00 100.00 100.00 2010
101.29 101.26 105.55 101.75 102.23 100.00 100.28 105.82 103.66 2011
102.03102.03102.03102.03 101.99101.99101.99101.99 107.63107.63107.63107.63 106.36106.36106.36106.36 108.01108.01108.01108.01 100.57100.57100.57100.57 101.29101.29101.29101.29 113.74113.74113.74113.74 112.64112.64112.64112.64 2012201220122012
102.04 102.01 105.74 103.25 104.04 100.00 100.86 112.37 110.43 Jan.
101.70 101.67 106.76 103.13 103.93 100.00 100.69 112.62 110.43 Feb.
101.51 101.47 107.90 107.05 109.14 100.00 100.60 113.12 110.43 Mar.
101.54 101.50 107.90 107.02 109.10 100.00 100.58 112.86 110.43 Apr.
101.64 101.60 107.90 107.02 109.10 100.00 100.58 112.25 110.43 May
101.95 101.91 107.90 107.73 109.71 100.00 101.77 112.29 110.43 June
102.34 102.30 107.90 107.77 109.70 100.00 101.99 112.41 110.43 July
102.38 102.34 107.90 107.08 108.78 101.36 101.81 115.43 115.74 Aug.
102.37 102.33 107.90 107.08 108.78 101.36 101.77 115.41 115.74 Sept.
102.41 102.38 107.90 106.43 107.93 101.36 101.74 115.47 115.74 Oct.
102.44 102.40 107.90 106.40 107.93 101.36 101.61 115.34 115.74 Nov.
102.06 102.02 107.90 106.40 107.97 101.36 101.49 115.32 115.74 Dec. Source : The Bank of Korea
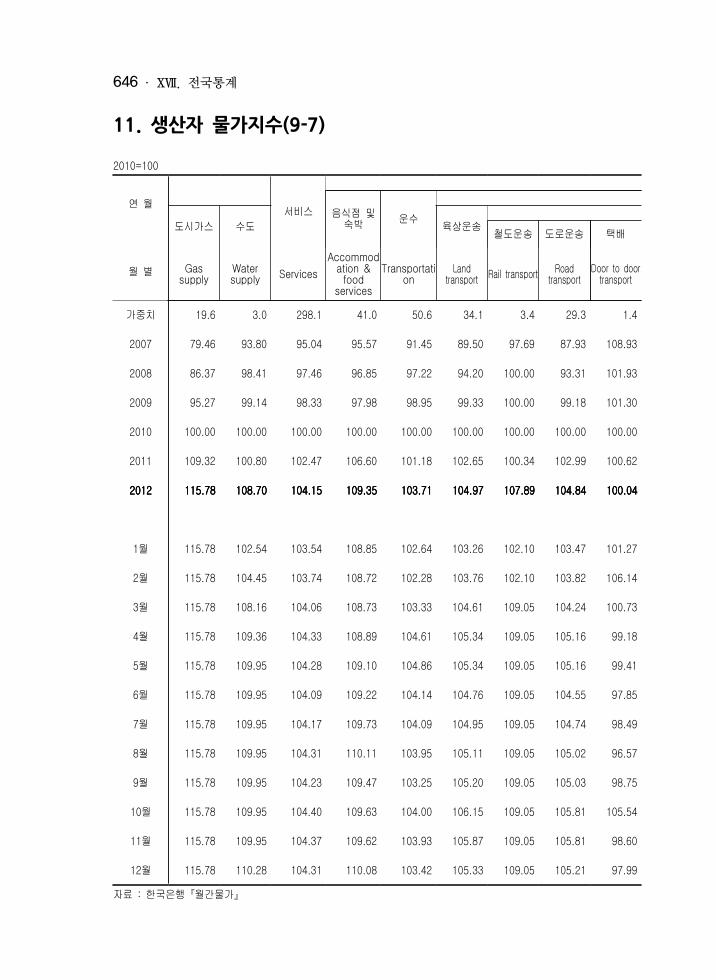
ⅩⅦ . 전국통계646
11. 생산자 물가지수(9-7)
2010=100
연 월
월 별
서비스
음식점 및 숙박 운수
도시가스 수도 육상운송
철도운송 도로운송 택배
Gas supply Water supply ServicesAccommodation & food services
Transportation Land transport Rail transport Road transport Door to door transport
가중치 19.6 3.0 298.1 41.0 50.6 34.1 3.4 29.3 1.4
2007 79.46 93.80 95.04 95.57 91.45 89.50 97.69 87.93 108.93
2008 86.37 98.41 97.46 96.85 97.22 94.20 100.00 93.31 101.93
2009 95.27 99.14 98.33 97.98 98.95 99.33 100.00 99.18 101.30
2010 100.00 100.00 100.00 100.00 100.00 100.00 100.00 100.00 100.00
2011 109.32 100.80 102.47 106.60 101.18 102.65 100.34 102.99 100.62
2012201220122012 115.78115.78115.78115.78 108.70108.70108.70108.70 104.15104.15104.15104.15 109.35109.35109.35109.35 103.71103.71103.71103.71 104.97104.97104.97104.97 107.89107.89107.89107.89 104.84104.84104.84104.84 100.04100.04100.04100.04
1월 115.78 102.54 103.54 108.85 102.64 103.26 102.10 103.47 101.27
2월 115.78 104.45 103.74 108.72 102.28 103.76 102.10 103.82 106.14
3월 115.78 108.16 104.06 108.73 103.33 104.61 109.05 104.24 100.73
4월 115.78 109.36 104.33 108.89 104.61 105.34 109.05 105.16 99.18
5월 115.78 109.95 104.28 109.10 104.86 105.34 109.05 105.16 99.41
6월 115.78 109.95 104.09 109.22 104.14 104.76 109.05 104.55 97.85
7월 115.78 109.95 104.17 109.73 104.09 104.95 109.05 104.74 98.49
8월 115.78 109.95 104.31 110.11 103.95 105.11 109.05 105.02 96.57
9월 115.78 109.95 104.23 109.47 103.25 105.20 109.05 105.03 98.75
10월 115.78 109.95 104.40 109.63 104.00 106.15 109.05 105.81 105.54
11월 115.78 109.95 104.37 109.62 103.93 105.87 109.05 105.81 98.60
12월 115.78 110.28 104.31 110.08 103.42 105.33 109.05 105.21 97.99자료 : 한국은행『월간물가』
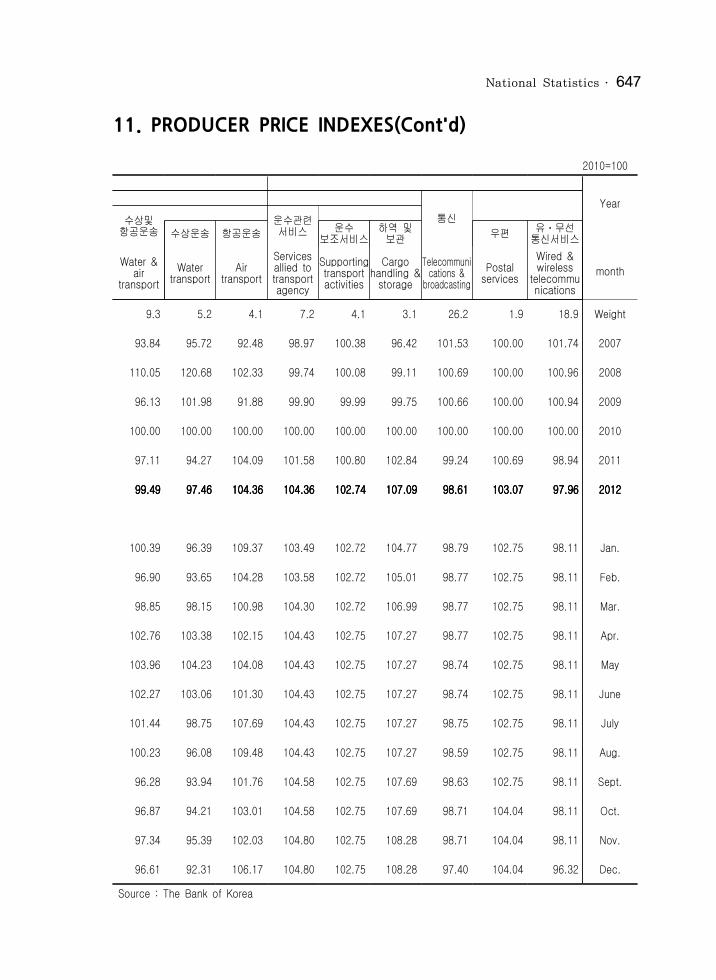
National Statistics 647
11. PRODUCER PRICE INDEXES(Cont'd)
2010=100
Year
month
통신
수상및항공운송
운수관련서비스
수상운송 항공운송 운수보조서비스 하역 및 보관 우편 유ㆍ무선통신서비스Water & air transport
Water transport Air transportServices allied to transport agency
Supporting transport activitiesCargo handling & storage
Telecommunications & broadcastingPostalservices
Wired & wireless telecommunications9.3 5.2 4.1 7.2 4.1 3.1 26.2 1.9 18.9 Weight
93.84 95.72 92.48 98.97 100.38 96.42 101.53 100.00 101.74 2007
110.05 120.68 102.33 99.74 100.08 99.11 100.69 100.00 100.96 2008
96.13 101.98 91.88 99.90 99.99 99.75 100.66 100.00 100.94 2009
100.00 100.00 100.00 100.00 100.00 100.00 100.00 100.00 100.00 2010
97.11 94.27 104.09 101.58 100.80 102.84 99.24 100.69 98.94 2011
99.4999.4999.4999.49 97.4697.4697.4697.46 104.36104.36104.36104.36 104.36104.36104.36104.36 102.74102.74102.74102.74 107.09107.09107.09107.09 98.6198.6198.6198.61 103.07103.07103.07103.07 97.9697.9697.9697.96 2012201220122012
100.39 96.39 109.37 103.49 102.72 104.77 98.79 102.75 98.11 Jan.
96.90 93.65 104.28 103.58 102.72 105.01 98.77 102.75 98.11 Feb.
98.85 98.15 100.98 104.30 102.72 106.99 98.77 102.75 98.11 Mar.
102.76 103.38 102.15 104.43 102.75 107.27 98.77 102.75 98.11 Apr.
103.96 104.23 104.08 104.43 102.75 107.27 98.74 102.75 98.11 May
102.27 103.06 101.30 104.43 102.75 107.27 98.74 102.75 98.11 June
101.44 98.75 107.69 104.43 102.75 107.27 98.75 102.75 98.11 July
100.23 96.08 109.48 104.43 102.75 107.27 98.59 102.75 98.11 Aug.
96.28 93.94 101.76 104.58 102.75 107.69 98.63 102.75 98.11 Sept.
96.87 94.21 103.01 104.58 102.75 107.69 98.71 104.04 98.11 Oct.
97.34 95.39 102.03 104.80 102.75 108.28 98.71 104.04 98.11 Nov.
96.61 92.31 106.17 104.80 102.75 108.28 97.40 104.04 96.32 Dec. Source : The Bank of Korea

ⅩⅦ . 전국통계648
11. 생산자 물가지수(9-8)
2010=100
연 월
월 별
정보,출판및영상서비스
금융및보험
정보서비스및소프트웨어개발공급출판및영상·오디오물제작배급
기타통신서비스 금융유선통신서비스Wired tele-communications
무선통신서비스Wireless tele-communicationsOther tele-communications
Information,publishing&imageservices
Information services, software development & supply
Publishing, video & audio production & distributionFinancial & insurance activities
Financial institutions
가중치 5.1 13.8 5.4 18.0 12.9 5.1 30.9 22.6
2007 100.31 102.56 101.29 95.55 98.61 89.82 109.40 112.08
2008 100.00 101.52 100.05 97.20 99.70 92.50 101.30 100.86
2009 100.00 101.48 100.00 98.85 99.70 97.24 96.65 95.41
2010 100.00 100.00 100.00 100.00 100.00 100.00 100.00 100.00
2011 100.00 98.47 99.81 100.99 100.94 101.16 102.56 102.75
2012201220122012 100.00100.00100.00100.00 97.0797.0797.0797.07 99.3699.3699.3699.36 101.14101.14101.14101.14 100.94100.94100.94100.94 101.71101.71101.71101.71 99.6299.6299.6299.62 99.0899.0899.0899.08
1월 100.00 97.28 99.81 101.25 100.94 102.09 100.70 100.16
2월 100.00 97.28 99.70 101.25 100.94 102.09 101.52 101.32
3월 100.00 97.28 99.70 101.24 100.94 102.07 101.56 101.54
4월 100.00 97.28 99.70 101.25 100.94 102.09 101.03 101.05
5월 100.00 97.28 99.54 101.24 100.94 102.07 99.27 98.57
6월 100.00 97.28 99.54 101.06 100.94 101.40 98.26 97.38
7월 100.00 97.28 99.59 101.06 100.94 101.40 98.06 97.00
8월 100.00 97.28 98.81 101.07 100.94 101.45 98.89 98.09
9월 100.00 97.28 98.97 101.07 100.94 101.45 99.40 98.87
10월 100.00 97.28 98.97 101.07 100.94 101.45 99.07 98.50
11월 100.00 97.28 98.97 101.07 100.94 101.45 98.58 97.86
12월 100.00 94.79 98.97 101.07 100.94 101.45 99.14 98.63자료 : 한국은행『월간물가』

National Statistics 649
11. PRODUCER PRICE INDEXES(Cont'd)
2010=100
Year
month
부동산
사업서비스
사업관련전문서비스
Professional services related to business
보험 예금취급기관Banking & savings institutions
금융투자기관Financial investment institutions
주거서비스Housing service
비주거용건물임대Renting of non-residential buildings
부동산관련서비스Services related to real estateInsurance Real estate activities
Business services
2.4 2.3 8.3 45.0 18.6 21.8 4.6 40.4 22.1 Weight
99.88 124.82 103.00 93.48 - 93.59 92.98 88.35 83.16 2007
99.59 115.43 102.35 96.19 - 96.32 95.58 94.26 91.72 2008
100.00 95.05 99.60 98.61 - 98.79 97.83 96.26 94.59 2009
100.00 100.00 100.00 100.00 100.00 100.00 100.00 100.00 100.00 2010
98.82 101.01 102.02 102.10 104.01 100.75 101.55 102.77 103.24 2011
87.8487.8487.8487.84 90.5690.5690.5690.56 100.52100.52100.52100.52 104.52104.52104.52104.52 108.38108.38108.38108.38 101.79101.79101.79101.79 103.42103.42103.42103.42 105.02105.02105.02105.02 105.64105.64105.64105.64 2012201220122012
92.89 92.87 101.59 103.61 106.61 101.52 102.71 104.60 105.31 Jan.
92.89 92.71 101.65 103.95 106.97 101.55 104.25 104.77 105.54 Feb.
92.89 92.65 101.29 104.15 107.44 101.56 104.36 104.92 105.72 Mar.
92.89 92.68 100.70 104.28 107.87 101.64 103.73 105.04 105.84 Apr.
88.81 91.49 100.49 104.36 108.18 101.65 103.32 105.06 105.68 May
84.82 90.75 99.91 104.50 108.43 101.77 103.11 105.00 105.58 June
84.82 90.02 100.08 104.56 108.61 101.81 102.94 104.94 105.45 July
84.82 89.07 100.34 104.71 108.84 101.83 103.33 104.89 105.40 Aug.
84.82 89.16 100.25 104.78 109.01 101.92 102.99 105.35 105.95 Sept.
84.82 88.86 100.04 104.92 109.24 101.97 103.20 105.27 105.85 Oct.
84.82 88.58 99.88 105.09 109.57 102.06 103.12 105.22 105.76 Nov.
84.82 87.86 99.96 105.32 109.80 102.16 103.96 105.13 105.63 Dec. Source : The Bank of Korea
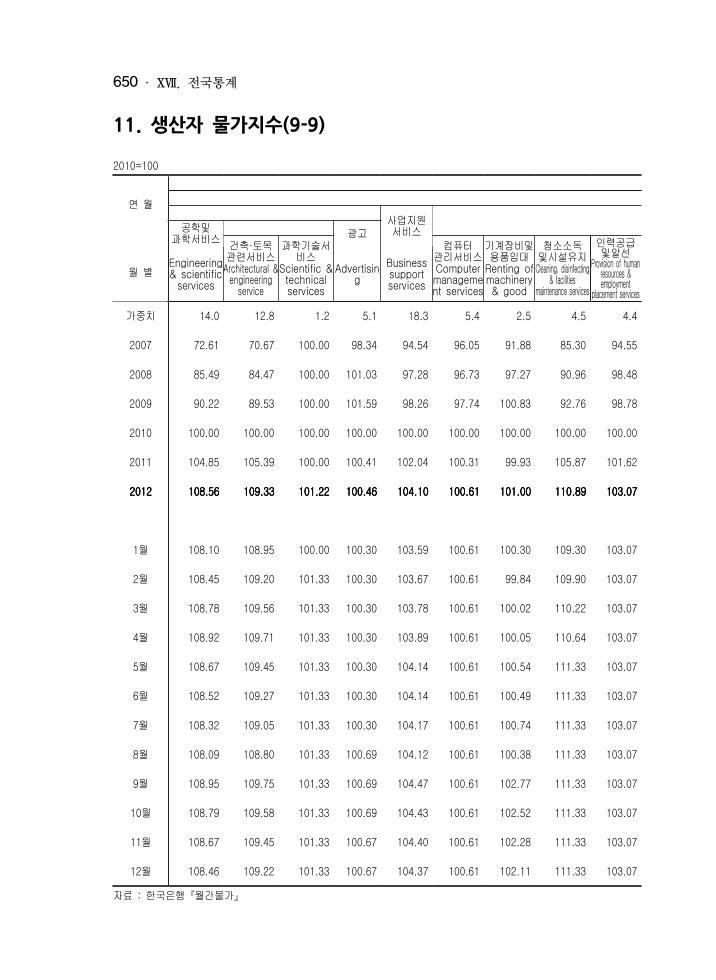
ⅩⅦ . 전국통계650
11. 생산자 물가지수(9-9)
2010=100
연 월
월 별
사업지원서비스
공학및과학서비스 광고
건축·토목관련서비스Architectural & engineering service
과학기술서비스Scientific & technical services
컴퓨터관리서비스Computer management services
기계장비및용품임대Renting of machinery & good
청소소독및시설유지Cleaning, disinfecting & facilities maintenance services
인력공급및알선Provision of human resources & employment placement services
Engineering & scientific servicesAdvertising
Business support services
가중치 14.0 12.8 1.2 5.1 18.3 5.4 2.5 4.5 4.4
2007 72.61 70.67 100.00 98.34 94.54 96.05 91.88 85.30 94.55
2008 85.49 84.47 100.00 101.03 97.28 96.73 97.27 90.96 98.48
2009 90.22 89.53 100.00 101.59 98.26 97.74 100.83 92.76 98.78
2010 100.00 100.00 100.00 100.00 100.00 100.00 100.00 100.00 100.00
2011 104.85 105.39 100.00 100.41 102.04 100.31 99.93 105.87 101.62
2012201220122012 108.56108.56108.56108.56 109.33109.33109.33109.33 101.22101.22101.22101.22 100.46100.46100.46100.46 104.10104.10104.10104.10 100.61100.61100.61100.61 101.00101.00101.00101.00 110.89110.89110.89110.89 103.07103.07103.07103.07
1월 108.10 108.95 100.00 100.30 103.59 100.61 100.30 109.30 103.07
2월 108.45 109.20 101.33 100.30 103.67 100.61 99.84 109.90 103.07
3월 108.78 109.56 101.33 100.30 103.78 100.61 100.02 110.22 103.07
4월 108.92 109.71 101.33 100.30 103.89 100.61 100.05 110.64 103.07
5월 108.67 109.45 101.33 100.30 104.14 100.61 100.54 111.33 103.07
6월 108.52 109.27 101.33 100.30 104.14 100.61 100.49 111.33 103.07
7월 108.32 109.05 101.33 100.30 104.17 100.61 100.74 111.33 103.07
8월 108.09 108.80 101.33 100.69 104.12 100.61 100.38 111.33 103.07
9월 108.95 109.75 101.33 100.69 104.47 100.61 102.77 111.33 103.07
10월 108.79 109.58 101.33 100.69 104.43 100.61 102.52 111.33 103.07
11월 108.67 109.45 101.33 100.67 104.40 100.61 102.28 111.33 103.07
12월 108.46 109.22 101.33 100.67 104.37 100.61 102.11 111.33 103.07자료 : 한국은행『월간물가』
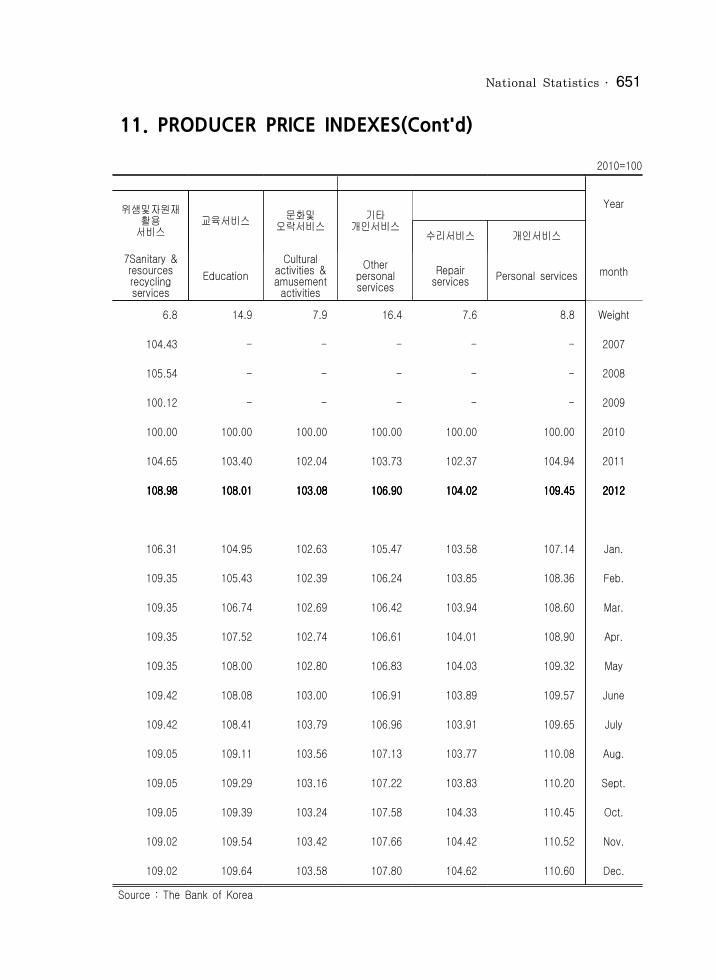
National Statistics 651
11. PRODUCER PRICE INDEXES(Cont'd)
2010=100
Year
month
위생및자원재활용서비스 교육서비스 문화및오락서비스 기타개인서비스
수리서비스 개인서비스7Sanitary & resources recycling services
EducationCultural activities & amusement activities
Other personal servicesRepair services Personal services
6.8 14.9 7.9 16.4 7.6 8.8 Weight
104.43 - - - - - 2007
105.54 - - - - - 2008
100.12 - - - - - 2009
100.00 100.00 100.00 100.00 100.00 100.00 2010
104.65 103.40 102.04 103.73 102.37 104.94 2011
108.98108.98108.98108.98 108.01108.01108.01108.01 103.08103.08103.08103.08 106.90106.90106.90106.90 104.02104.02104.02104.02 109.45109.45109.45109.45 2012201220122012
106.31 104.95 102.63 105.47 103.58 107.14 Jan.
109.35 105.43 102.39 106.24 103.85 108.36 Feb.
109.35 106.74 102.69 106.42 103.94 108.60 Mar.
109.35 107.52 102.74 106.61 104.01 108.90 Apr.
109.35 108.00 102.80 106.83 104.03 109.32 May
109.42 108.08 103.00 106.91 103.89 109.57 June
109.42 108.41 103.79 106.96 103.91 109.65 July
109.05 109.11 103.56 107.13 103.77 110.08 Aug.
109.05 109.29 103.16 107.22 103.83 110.20 Sept.
109.05 109.39 103.24 107.58 104.33 110.45 Oct.
109.02 109.54 103.42 107.66 104.42 110.52 Nov.
109.02 109.64 103.58 107.80 104.62 110.60 Dec. Source : The Bank of Korea

ⅩⅦ . 전국통계652
12. 전도시 소비자 물가지수(3-1)
2010=100
연 별 월 별
총지수 식료품·비주류음료 주류·담배 의복·신발 식료품 차와음료 주류 담배 의류 Allitems
Food& Non-alcoholicbeverages
Food
Clothing
Alcoholicbeverages&Cigarettes
AlcoholicbeveragesCigarettes
Clothing&FootwearTeas&Beverages
가중치 1,000.0 135.9 127.4 8.5 12.4 3.9 8.5 62.3 53.4
2007 90.3 83.2 83.3 80.9 97.9 92.6 100.0 90.1 89.8
2008 94.5 87.3 87.2 88.5 98.4 94.5 100.0 92.4 92.0
2009 97.1 93.9 93.7 96.9 99.6 98.5 100.0 97.1 96.8
2010 100.0 100.0 100.0 100.0 100.0 100.0 100.0 100.0 100.0
2011 104.0 108.1 108.2 106.4 100.8 99.6 101.3 103.3 103.3
2012201220122012 106.3106.3106.3106.3 112.4112.4112.4112.4 112.5112.5112.5112.5 111.3111.3111.3111.3 102.3102.3102.3102.3 100.4100.4100.4100.4 103.2103.2103.2103.2 108.3108.3108.3108.3 108.2108.2108.2108.2
1 105.7 111.9 112.0 110.4 101.2 99.6 101.9 106.0 106.1
2 106.1 111.7 111.8 110.7 102.1 99.6 103.3 106.9 106.4
3 106.0 112.8 113.0 110.7 102.0 99.1 103.3 106.9 106.4
4 106.0 112.4 112.5 110.5 102.1 99.5 103.3 106.4 106.4
5 106.2 112.3 112.4 110.7 101.8 98.7 103.3 108.3 108.0
6 106.1 111.8 111.9 110.7 102.1 99.6 103.3 109.0 108.8
7 105.9 110.9 110.9 110.5 102.0 99.2 103.3 108.9 108.8
8 106.3 112.1 112.2 110.6 102.5 100.6 103.3 108.9 108.8
9 107.0 115.8 116.0 112.1 102.9 102.0 103.3 109.0 108.8
10 106.9 114.1 114.2 112.8 102.9 102.2 103.3 108.5 108.8
11 106.5 111.3 111.2 113.1 102.9 102.1 103.3 110.2 110.3
12 106.7 112.0 111.9 113.3 103.0 102.5 103.3 110.2 110.3자료 : 통계청『물가연보』

National Statistics 653
12. CONSUMER PRICE INDEXES OF ALL CITIES
2010=100 주거및수도· 광열 가구집기· 가사용품
신발 집세 주택설비 수도· 광열 가구 침구· Year & 수리 기타주거 직물제품
Water Furnishings Housing, Maintenance supply Electricity, & Water & Rental for & repair of & other Gas& Household Household Month
Footwear Fuels Housing the dwelling housing Other fuels equipment Furnitures textiles 8.9 169.7 91.8 7.2 23.2 47.5 37.9 6.6 3.1 Weight
92.7 92.5 94.5 90.4 92.3 89.3 91.4 86.5 86.7 2007
95.8 96.6 96.6 95.2 96.7 96.8 95.4 91.2 91.3 2008
99.3 97.6 98.1 98.9 98.4 96.2 99.6 98.3 97.9 2009
100.0 100.0 100.0 100.0 100.0 100.0 100.0 100.0 100.0 2010
103.5 104.5 104.0 105.0 102.7 106.4 103.7 105.2 107.2 2011
108.8108.8108.8108.8 109.3109.3109.3109.3 108.3108.3108.3108.3 110.2110.2110.2110.2 107.7107.7107.7107.7 111.9111.9111.9111.9 106.7106.7106.7106.7 108.2108.2108.2108.2 109.8109.8109.8109.8 2012201220122012
105.3 107.4 106.6 107.6 105.3 109.8 105.7 107.1 107.8 Jan.
109.9 108.2 106.9 107.9 109.3 110.1 106.7 107.1 107.8 Feb.
109.9 108.6 107.4 108.5 109.4 110.4 107.0 107.2 110.2 Mar.
106.5 108.7 107.8 108.8 108.3 110.5 106.4 107.2 110.2 Apr.
110.0 108.8 108.1 109.8 107.7 110.5 107.0 107.5 110.2 May
109.9 109.0 108.4 110.3 107.4 110.7 107.0 107.5 110.2 June
109.7 109.6 108.6 110.5 107.1 112.5 106.7 108.9 110.2 July
109.7 110.0 108.8 110.7 107.8 113.4 106.8 109.0 110.3 Aug.
109.7 110.1 109.0 111.0 106.9 113.6 107.3 109.2 110.2 Sept.
106.2 110.4 109.2 112.3 107.3 113.8 106.8 109.2 110.2 Oct.
109.7 110.5 109.5 112.6 107.2 113.7 106.8 109.2 110.2 Nov.
109.6 110.8 109.8 112.6 108.8 113.6 106.1 109.2 110.3 Dec. Source : National Statistical Office
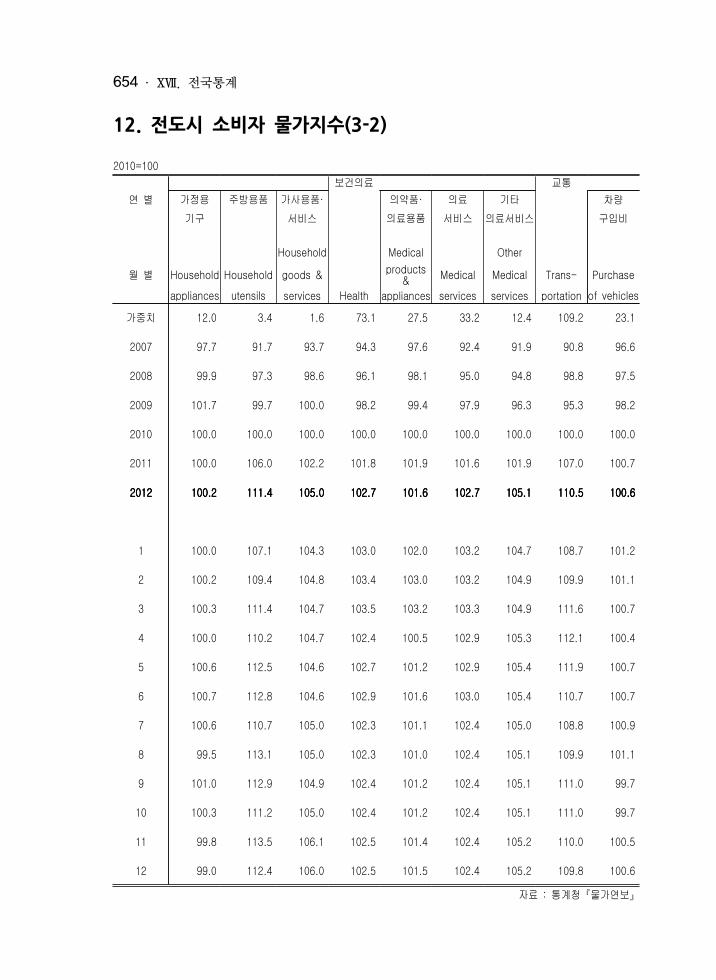
ⅩⅦ . 전국통계654
12. 전도시 소비자 물가지수(3-2)
2010=100 보건의료 교통
연 별 가정용 주방용품 가사용품· 의약품· 의료 기타 차량기구 서비스 의료용품 서비스 의료서비스 구입비 Household Medical Other
월 별 Household Household goods & products & Medical Medical Trans- Purchase appliances utensils services Health appliances services services portation of vehicles
가중치 12.0 3.4 1.6 73.1 27.5 33.2 12.4 109.2 23.1
2007 97.7 91.7 93.7 94.3 97.6 92.4 91.9 90.8 96.6
2008 99.9 97.3 98.6 96.1 98.1 95.0 94.8 98.8 97.5
2009 101.7 99.7 100.0 98.2 99.4 97.9 96.3 95.3 98.2
2010 100.0 100.0 100.0 100.0 100.0 100.0 100.0 100.0 100.0
2011 100.0 106.0 102.2 101.8 101.9 101.6 101.9 107.0 100.7
2012201220122012 100.2100.2100.2100.2 111.4111.4111.4111.4 105.0105.0105.0105.0 102.7102.7102.7102.7 101.6101.6101.6101.6 102.7102.7102.7102.7 105.1105.1105.1105.1 110.5110.5110.5110.5 100.6100.6100.6100.6
1 100.0 107.1 104.3 103.0 102.0 103.2 104.7 108.7 101.2
2 100.2 109.4 104.8 103.4 103.0 103.2 104.9 109.9 101.1
3 100.3 111.4 104.7 103.5 103.2 103.3 104.9 111.6 100.7
4 100.0 110.2 104.7 102.4 100.5 102.9 105.3 112.1 100.4
5 100.6 112.5 104.6 102.7 101.2 102.9 105.4 111.9 100.7
6 100.7 112.8 104.6 102.9 101.6 103.0 105.4 110.7 100.7
7 100.6 110.7 105.0 102.3 101.1 102.4 105.0 108.8 100.9
8 99.5 113.1 105.0 102.3 101.0 102.4 105.1 109.9 101.1
9 101.0 112.9 104.9 102.4 101.2 102.4 105.1 111.0 99.7
10 100.3 111.2 105.0 102.4 101.2 102.4 105.1 111.0 99.7
11 99.8 113.5 106.1 102.5 101.4 102.4 105.2 110.0 100.5
12 99.0 112.4 106.0 102.5 101.5 102.4 105.2 109.8 100.6자료 : 통계청『물가연보』
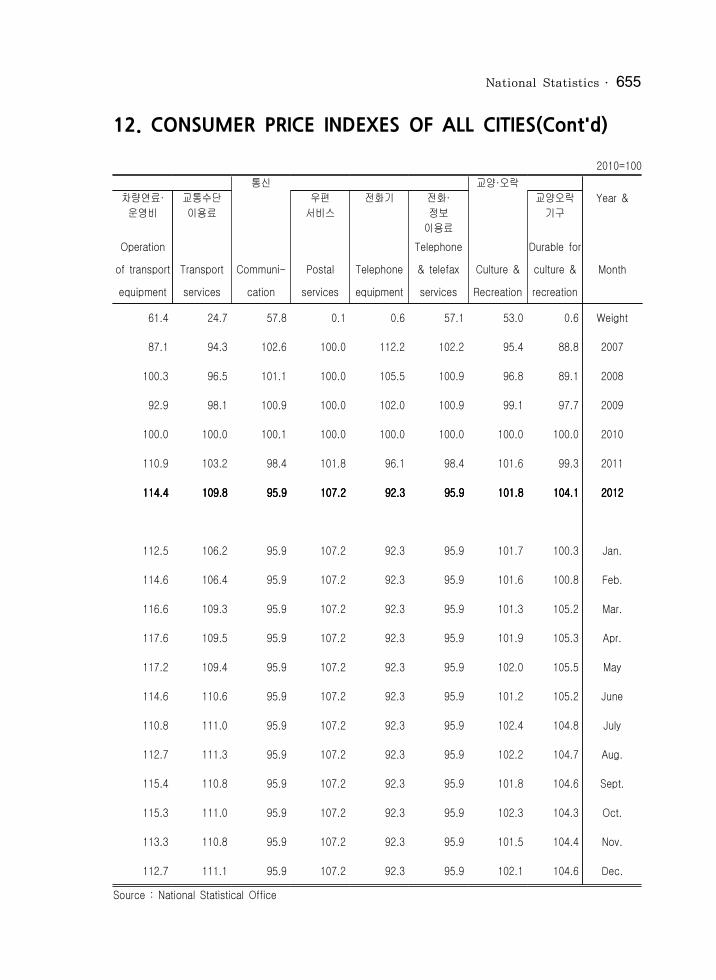
National Statistics 655
12. CONSUMER PRICE INDEXES OF ALL CITIES(Cont'd)
2010=100 통신 교양·오락
차량연료· 교통수단 우편 전화기 전화· 교양오락 Year &운영비 이용료 서비스 정보 기구
이용료 Operation Telephone Durable for
of transport Transport Communi- Postal Telephone & telefax Culture & culture & Monthequipment services cation services equipment services Recreation recreation
61.4 24.7 57.8 0.1 0.6 57.1 53.0 0.6 Weight
87.1 94.3 102.6 100.0 112.2 102.2 95.4 88.8 2007
100.3 96.5 101.1 100.0 105.5 100.9 96.8 89.1 2008
92.9 98.1 100.9 100.0 102.0 100.9 99.1 97.7 2009
100.0 100.0 100.1 100.0 100.0 100.0 100.0 100.0 2010
110.9 103.2 98.4 101.8 96.1 98.4 101.6 99.3 2011
114.4114.4114.4114.4 109.8109.8109.8109.8 95.995.995.995.9 107.2107.2107.2107.2 92.392.392.392.3 95.995.995.995.9 101.8101.8101.8101.8 104.1104.1104.1104.1 2012201220122012
112.5 106.2 95.9 107.2 92.3 95.9 101.7 100.3 Jan.
114.6 106.4 95.9 107.2 92.3 95.9 101.6 100.8 Feb.
116.6 109.3 95.9 107.2 92.3 95.9 101.3 105.2 Mar.
117.6 109.5 95.9 107.2 92.3 95.9 101.9 105.3 Apr.
117.2 109.4 95.9 107.2 92.3 95.9 102.0 105.5 May
114.6 110.6 95.9 107.2 92.3 95.9 101.2 105.2 June
110.8 111.0 95.9 107.2 92.3 95.9 102.4 104.8 July
112.7 111.3 95.9 107.2 92.3 95.9 102.2 104.7 Aug.
115.4 110.8 95.9 107.2 92.3 95.9 101.8 104.6 Sept.
115.3 111.0 95.9 107.2 92.3 95.9 102.3 104.3 Oct.
113.3 110.8 95.9 107.2 92.3 95.9 101.5 104.4 Nov.
112.7 111.1 95.9 107.2 92.3 95.9 102.1 104.6 Dec.Source : National Statistical Office

ⅩⅦ . 전국통계656
12. 전도시 소비자 물가지수(3-3)
2010=100 교육
연 별 악기· 교양·오락 도서·신문 단체여행 유치원 중등교육 고등교육오락용품 서비스 및 문방구 초등교육 Musical
instrument & Cultural & Books, Pri-primary 월 별 Durable for recreational Newspaper & Package & Primary Secondary Tertiary
recreation services Stantionery Holidays Education education education education가중치 6.6 16.8 11.3 8.2 114.1 6.9 7.6 26.7
2007 90.1 95.5 88.4 92.4 90.4 82.1 97.5 90.2
2008 91.0 96.7 92.1 99.2 95.4 89.1 99.6 96.9
2009 97.5 98.4 97.2 96.0 97.7 94.4 100.0 98.9
2010 100.0 100.0 100.0 100.0 100.0 100.0 100.0 100.0
2011 102.8 102.6 103.8 106.0 101.7 103.3 85.6 101.6
2012201220122012 104.7104.7104.7104.7 104.0104.0104.0104.0 107.3107.3107.3107.3 109.6109.6109.6109.6 103.2103.2103.2103.2 94.294.294.294.2 82.882.882.882.8 98.798.798.798.7
1 105.3 104.1 105.0 106.0 102.6 103.8 82.7 101.8
2 106.9 104.1 106.3 103.7 102.9 103.8 82.7 101.8
3 105.7 103.6 107.1 103.5 102.1 92.3 82.8 98.1
4 104.0 103.7 107.2 108.4 102.6 92.3 82.8 98.1
5 104.4 103.8 107.3 109.6 102.9 92.3 82.8 98.1
6 104.0 103.9 107.3 107.6 103.0 92.3 82.8 98.1
7 103.3 104.2 107.6 116.6 103.2 92.3 82.8 98.1
8 103.6 104.2 107.5 114.7 103.6 92.3 82.8 98.1
9 104.9 104.1 107.5 110.6 103.7 92.3 82.8 98.0
10 103.7 104.1 108.0 114.2 103.8 92.3 82.8 98.0
11 104.9 104.2 108.0 108.9 103.8 92.3 82.8 98.0
12 105.7 104.3 108.2 111.0 103.9 92.3 82.8 98.0자료 : 통계청『물가연보』
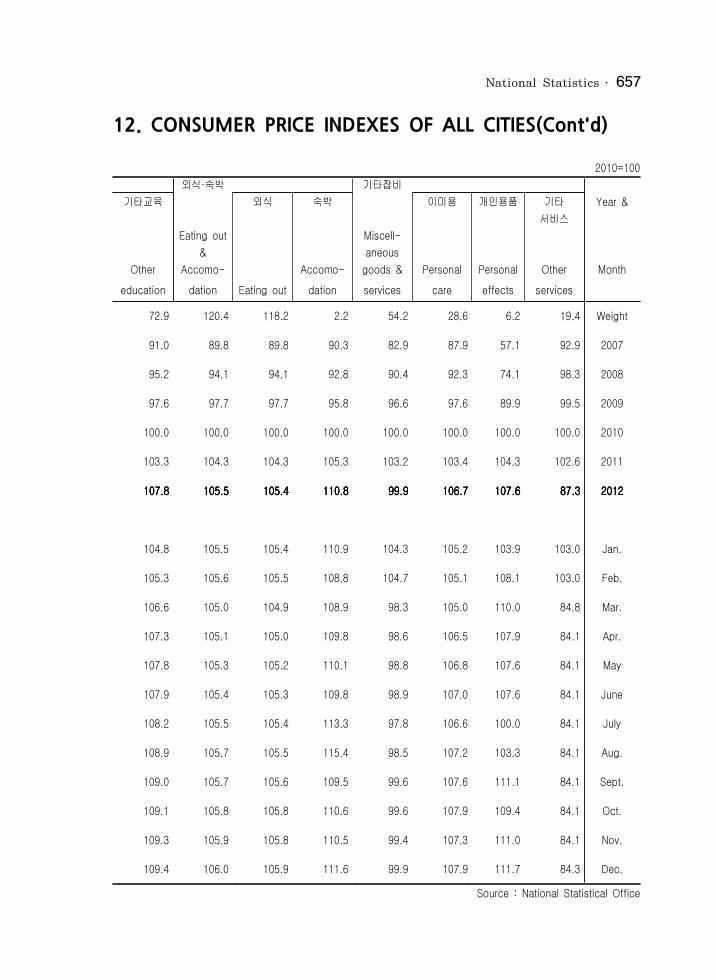
National Statistics 657
12. CONSUMER PRICE INDEXES OF ALL CITIES(Cont'd)
2010=100 외식·숙박 기타잡비
기타교육 외식 숙박 이미용 개인용품 기타 Year & 서비스 Eating out Miscell- & aneous
Other Accomo- Accomo- goods & Personal Personal Other Montheducation dation Eating out dation services care effects services
72.9 120.4 118.2 2.2 54.2 28.6 6.2 19.4 Weight
91.0 89.8 89.8 90.3 82.9 87.9 57.1 92.9 2007
95.2 94.1 94.1 92.8 90.4 92.3 74.1 98.3 2008
97.6 97.7 97.7 95.8 96.6 97.6 89.9 99.5 2009
100.0 100.0 100.0 100.0 100.0 100.0 100.0 100.0 2010
103.3 104.3 104.3 105.3 103.2 103.4 104.3 102.6 2011
107.8107.8107.8107.8 105.5105.5105.5105.5 105.4105.4105.4105.4 110.8110.8110.8110.8 99.999.999.999.9 106.7106.7106.7106.7 107.6107.6107.6107.6 87.387.387.387.3 2012201220122012
104.8 105.5 105.4 110.9 104.3 105.2 103.9 103.0 Jan.
105.3 105.6 105.5 108.8 104.7 105.1 108.1 103.0 Feb.
106.6 105.0 104.9 108.9 98.3 105.0 110.0 84.8 Mar.
107.3 105.1 105.0 109.8 98.6 106.5 107.9 84.1 Apr.
107.8 105.3 105.2 110.1 98.8 106.8 107.6 84.1 May
107.9 105.4 105.3 109.8 98.9 107.0 107.6 84.1 June
108.2 105.5 105.4 113.3 97.8 106.6 100.0 84.1 July
108.9 105.7 105.5 115.4 98.5 107.2 103.3 84.1 Aug.
109.0 105.7 105.6 109.5 99.6 107.6 111.1 84.1 Sept.
109.1 105.8 105.8 110.6 99.6 107.9 109.4 84.1 Oct.
109.3 105.9 105.8 110.5 99.4 107.3 111.0 84.1 Nov.
109.4 106.0 105.9 111.6 99.9 107.9 111.7 84.3 Dec.Source : National Statistical Office

ⅩⅦ . 전국통계658
13. 통 합 재 정 수 지 (2-1)
단위:조원 총 수 입 Total revenues
연별 경 상 수 입 Current revenues 자본수입 조 세 수 입 Total tax revenues 사회보장 세외수입 소득세및이익세 Income profits & cap.gains 기여금
월별 재산세 재화 및 용역 관세 기타 Social Non-tax goods & Customs security revenues Capital property services duties Others contribu. revenues
2007 243.6 241.7 161.5 74.3 8.7 59.8 7.4 11.2 29.7 50.5 1.9
2008 250.7 248.8 167.3 75.5 7.7 63.1 8.8 12.3 32.9 48.6 1.9
2009 250.8 248.3 164.5 69.7 7.2 63.5 9.2 15.0 33.9 49.8 2.5
2010 270.9 268.5 177.7 74.7 7.8 71.0 10.7 13.5 35.6 55.2 2.4
2011 292.2 289.8 192.4 87.1 8.7 71.5 11.0 14.0 38.9 58.5 2.5
2012201220122012 311.5 311.5 311.5 311.5 307.8 307.8 307.8 307.8 203.0 203.0 203.0 203.0 91.7 91.7 91.7 91.7 8.8 8.8 8.8 8.8 77.8 77.8 77.8 77.8 9.8 9.8 9.8 9.8 14.9 14.9 14.9 14.9 43.9 43.9 43.9 43.9 60.8 60.8 60.8 60.8 3.7 3.7 3.7 3.7
주 : 2010년 이후 자료는 잠정치임자료 : 기획재정부
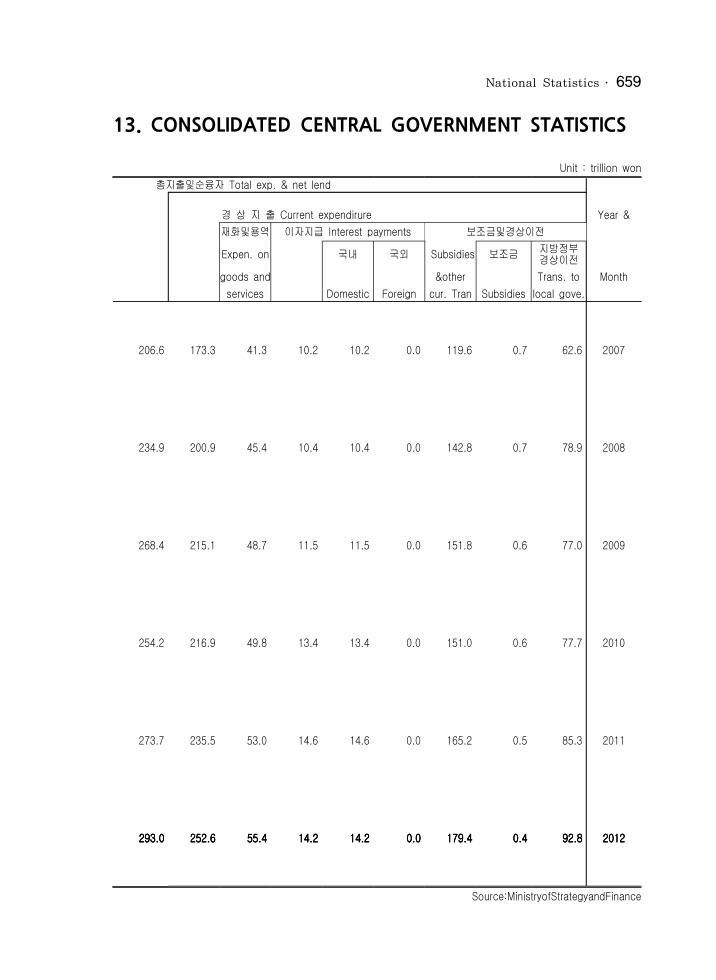
National Statistics 659
13. CONSOLIDATED CENTRAL GOVERNMENT STATISTICS
Unit : trillion won총지출및순융자 Total exp. & net lend
경 상 지 출 Current expendirure Year &
재화및용역 이자지급 Interest payments 보조금및경상이전 Expen. on 국내 국외 Subsidies 보조금 지방정부경상이전 goods and &other Trans. to Month
services Domestic Foreign cur. Tran Subsidies local gove.
206.6 173.3 41.3 10.2 10.2 0.0 119.6 0.7 62.6 2007
234.9 200.9 45.4 10.4 10.4 0.0 142.8 0.7 78.9 2008
268.4 215.1 48.7 11.5 11.5 0.0 151.8 0.6 77.0 2009
254.2 216.9 49.8 13.4 13.4 0.0 151.0 0.6 77.7 2010
273.7 235.5 53.0 14.6 14.6 0.0 165.2 0.5 85.3 2011
293.0 293.0 293.0 293.0 252.6 252.6 252.6 252.6 55.4 55.4 55.4 55.4 14.2 14.2 14.2 14.2 14.2 14.2 14.2 14.2 0.0 0.0 0.0 0.0 179.4 179.4 179.4 179.4 0.4 0.4 0.4 0.4 92.8 92.8 92.8 92.8 2012201220122012
Source:MinistryofStrategyandFinance
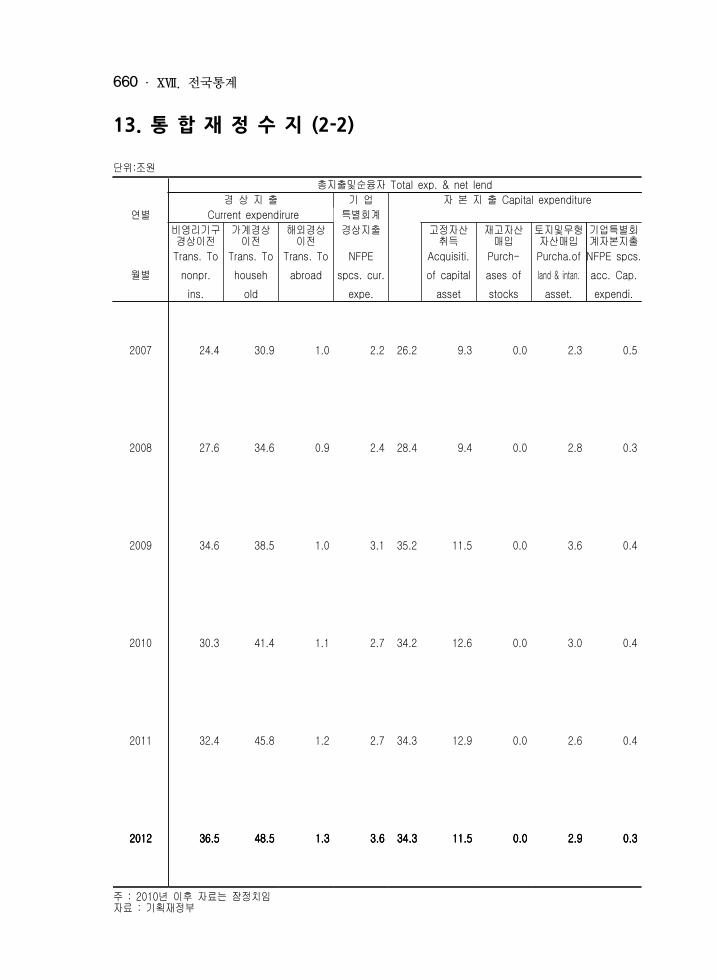
ⅩⅦ . 전국통계660
13. 통 합 재 정 수 지 (2-2)
단위:조원 총지출및순융자 Total exp. & net lend 경 상 지 출 기 업 자 본 지 출 Capital expenditure
연별 Current expendirure 특별회계 비영리기구경상이전 가계경상이전 해외경상이전 경상지출 고정자산취득 재고자산매입 토지및무형자산매입 기업특별회계자본지출Trans. To Trans. To Trans. To NFPE Acquisiti. Purch- Purcha.of NFPE spcs.
월별 nonpr. househ abroad spcs. cur. of capital ases of land & intan. acc. Cap. ins. old expe. asset stocks asset. expendi.
2007 24.4 30.9 1.0 2.2 26.2 9.3 0.0 2.3 0.5
2008 27.6 34.6 0.9 2.4 28.4 9.4 0.0 2.8 0.3
2009 34.6 38.5 1.0 3.1 35.2 11.5 0.0 3.6 0.4
2010 30.3 41.4 1.1 2.7 34.2 12.6 0.0 3.0 0.4
2011 32.4 45.8 1.2 2.7 34.3 12.9 0.0 2.6 0.4
2012201220122012 36.5 36.5 36.5 36.5 48.5 48.5 48.5 48.5 1.3 1.3 1.3 1.3 3.6 3.6 3.6 3.6 34.3 34.3 34.3 34.3 11.5 11.5 11.5 11.5 0.0 0.0 0.0 0.0 2.9 2.9 2.9 2.9 0.3 0.3 0.3 0.3
주 : 2010년 이후 자료는 잠정치임 자료 : 기획재정부

National Statistics 661
13. CONSOLIDATED CENTRAL GOVERNMENT STATISTICS (Cont'd)
Unit : trillion won총지출 및 순융자 통합 보전재원 Financing
자본지출 순융자 재정 국 내 Domestic 해외 수지 예금 국채 국고 기타 Year &
자본이전 은행 시재 Net
Capital lending Balance Bank of Bonds Change Other External Monthtransfers Korea in cash
14.1 7.1 37.0 -37.0 -33.0 40.1 5.0 -9.7 -68.3 -0.8 2007
15.9 5.5 15.9 -15.9 -10.9 36.0 5.5 14.6 -67.0 -0.9 2008
19.7 18.0 -17.6 17.6 18.6 -5.3 46.9 0.1 -23.1 -1.0 2009
18.2 3.1 16.7 -16.7 -15.9 -9.9 15.9 -3.6 -18.2 -0.8 2010
18.4 3.9 18.6 -18.6 -17.9 -15.3 14.8 0.8 -18.1 -0.7 2011
19.5 19.5 19.5 19.5 6.1 6.1 6.1 6.1 18.5 18.5 18.5 18.5 -18.5 -18.5 -18.5 -18.5 -17.9 -17.9 -17.9 -17.9 -0.2 -0.2 -0.2 -0.2 8.48.48.48.4 4.1 4.1 4.1 4.1 -30.2 -30.2 -30.2 -30.2 -0.6 -0.6 -0.6 -0.6 2012201220122012
Source:Ministryof Strategy and Finance
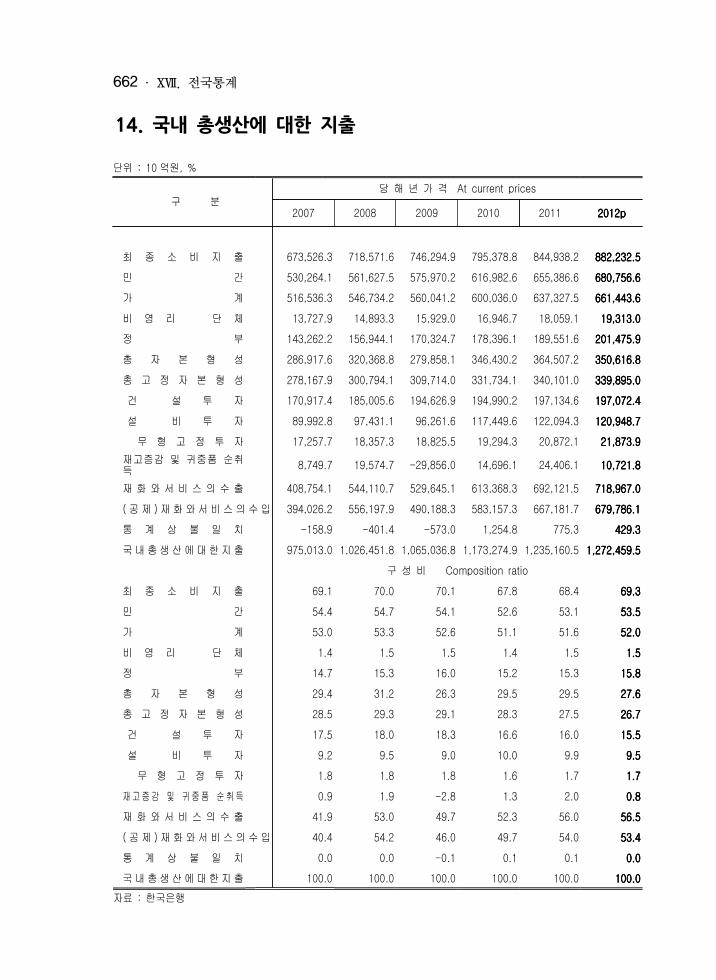
ⅩⅦ . 전국통계662
14. 국내 총생산에 대한 지출
단위 : 10 억원, %
구 분 당 해 년 가 격 At current prices
2007 2008 2009 2010 2011 2012p2012p2012p2012p
최 종 소 비 지 출 673,526.3 718,571.6 746,294.9 795,378.8 844,938.2 882,232.5882,232.5882,232.5882,232.5민 간 530,264.1 561,627.5 575,970.2 616,982.6 655,386.6 680,756.6680,756.6680,756.6680,756.6가 계 516,536.3 546,734.2 560,041.2 600,036.0 637,327.5 661,443.6661,443.6661,443.6661,443.6비 영 리 단 체 13,727.9 14,893.3 15,929.0 16,946.7 18,059.1 19,313.019,313.019,313.019,313.0정 부 143,262.2 156,944.1 170,324.7 178,396.1 189,551.6 201,475.9201,475.9201,475.9201,475.9총 자 본 형 성 286,917.6 320,368.8 279,858.1 346,430.2 364,507.2 350,616.8350,616.8350,616.8350,616.8총 고 정 자 본 형 성 278,167.9 300,794.1 309,714.0 331,734.1 340,101.0 339,895.0339,895.0339,895.0339,895.0 건 설 투 자 170,917.4 185,005.6 194,626.9 194,990.2 197,134.6 197,072.4197,072.4197,072.4197,072.4 설 비 투 자 89,992.8 97,431.1 96,261.6 117,449.6 122,094.3 120,948.7120,948.7120,948.7120,948.7 무 형 고 정 투 자 17,257.7 18,357.3 18,825.5 19,294.3 20,872.1 21,873.921,873.921,873.921,873.9재고증감 및 귀중품 순취득 8,749.7 19,574.7 -29,856.0 14,696.1 24,406.1 10,721.810,721.810,721.810,721.8재 화 와 서 비 스 의 수 출 408,754.1 544,110.7 529,645.1 613,368.3 692,121.5 718,967.0718,967.0718,967.0718,967.0( 공 제 ) 재 화 와 서 비 스 의 수 입 394,026.2 556,197.9 490,188.3 583,157.3 667,181.7 679,786.1679,786.1679,786.1679,786.1통 계 상 불 일 치 -158.9 -401.4 -573.0 1,254.8 775.3 429.3429.3429.3429.3국 내 총 생 산 에 대 한 지 출 975,013.0 1,026,451.8 1,065,036.8 1,173,274.9 1,235,160.5 1,272,459.51,272,459.51,272,459.51,272,459.5
구 성 비 Composition ratio최 종 소 비 지 출 69.1 70.0 70.1 67.8 68.4 69.3 69.3 69.3 69.3 민 간 54.4 54.7 54.1 52.6 53.1 53.5 53.5 53.5 53.5 가 계 53.0 53.3 52.6 51.1 51.6 52.0 52.0 52.0 52.0 비 영 리 단 체 1.4 1.5 1.5 1.4 1.5 1.5 1.5 1.5 1.5 정 부 14.7 15.3 16.0 15.2 15.3 15.8 15.8 15.8 15.8 총 자 본 형 성 29.4 31.2 26.3 29.5 29.5 27.6 27.6 27.6 27.6 총 고 정 자 본 형 성 28.5 29.3 29.1 28.3 27.5 26.7 26.7 26.7 26.7 건 설 투 자 17.5 18.0 18.3 16.6 16.0 15.5 15.5 15.5 15.5 설 비 투 자 9.2 9.5 9.0 10.0 9.9 9.5 9.5 9.5 9.5 무 형 고 정 투 자 1.8 1.8 1.8 1.6 1.7 1.7 1.7 1.7 1.7 재 고 증 감 및 귀 중 품 순 취 득 0.9 1.9 -2.8 1.3 2.0 0.8 0.8 0.8 0.8 재 화 와 서 비 스 의 수 출 41.9 53.0 49.7 52.3 56.0 56.5 56.5 56.5 56.5 ( 공 제 ) 재 화 와 서 비 스 의 수 입 40.4 54.2 46.0 49.7 54.0 53.4 53.4 53.4 53.4 통 계 상 불 일 치 0.0 0.0 -0.1 0.1 0.1 0.0 0.0 0.0 0.0 국 내 총 생 산 에 대 한 지 출 100.0 100.0 100.0 100.0 100.0 100.0 100.0 100.0 100.0
자료 : 한국은행
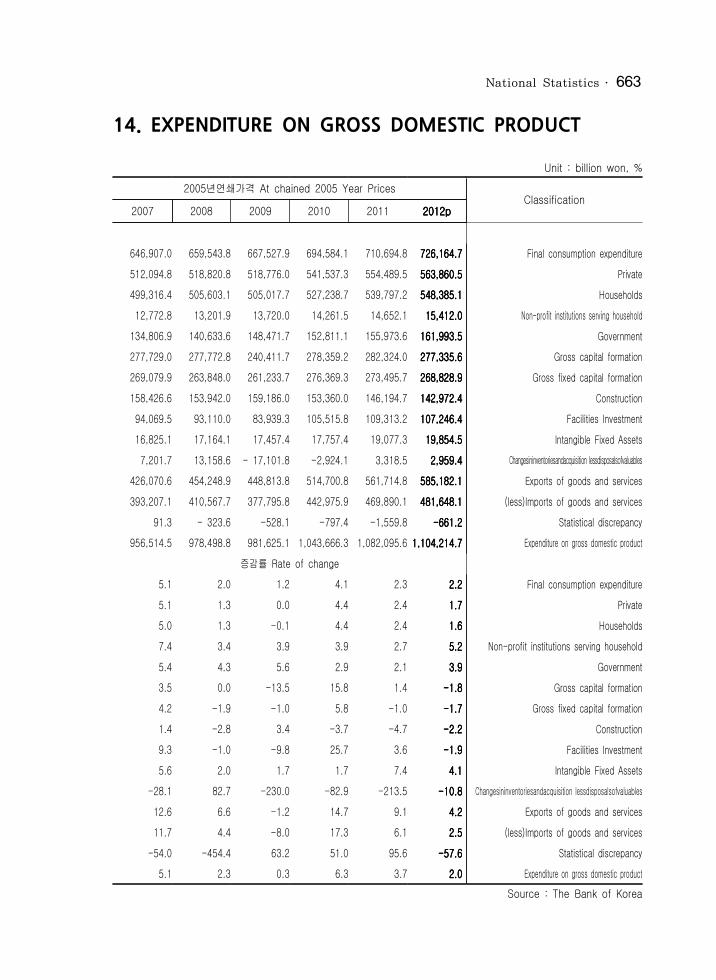
National Statistics 663
14. EXPENDITURE ON GROSS DOMESTIC PRODUCT
Unit : billion won, %2005년연쇄가격 At chained 2005 Year Prices Classification2007 2008 2009 2010 2011 2012p2012p2012p2012p
646,907.0 659,543.8 667,527.9 694,584.1 710,694.8 726,164.7 726,164.7 726,164.7 726,164.7 Final consumption expenditure 512,094.8 518,820.8 518,776.0 541,537.3 554,489.5 563,860.5 563,860.5 563,860.5 563,860.5 Private 499,316.4 505,603.1 505,017.7 527,238.7 539,797.2 548,385.1 548,385.1 548,385.1 548,385.1 Households 12,772.8 13,201.9 13,720.0 14,261.5 14,652.1 15,412.0 15,412.0 15,412.0 15,412.0 Non-profit institutions serving household
134,806.9 140,633.6 148,471.7 152,811.1 155,973.6 161,993.5 161,993.5 161,993.5 161,993.5 Government 277,729.0 277,772.8 240,411.7 278,359.2 282,324.0 277,335.6 277,335.6 277,335.6 277,335.6 Gross capital formation 269,079.9 263,848.0 261,233.7 276,369.3 273,495.7 268,828.9 268,828.9 268,828.9 268,828.9 Gross fixed capital formation 158,426.6 153,942.0 159,186.0 153,360.0 146,194.7 142,972.4 142,972.4 142,972.4 142,972.4 Construction 94,069.5 93,110.0 83,939.3 105,515.8 109,313.2 107,246.4 107,246.4 107,246.4 107,246.4 Facilities Investment 16,825.1 17,164.1 17,457.4 17,757.4 19,077.3 19,854.5 19,854.5 19,854.5 19,854.5 Intangible Fixed Assets 7,201.7 13,158.6 - 17,101.8 -2,924.1 3,318.5 2,959.4 2,959.4 2,959.4 2,959.4 Changesininventoriesandacquisition lessdisposalsofvaluables
426,070.6 454,248.9 448,813.8 514,700.8 561,714.8 585,182.1 585,182.1 585,182.1 585,182.1 Exports of goods and services 393,207.1 410,567.7 377,795.8 442,975.9 469,890.1 481,648.1 481,648.1 481,648.1 481,648.1 (less)Imports of goods and services
91.3 - 323.6 -528.1 -797.4 -1,559.8 -661.2 -661.2 -661.2 -661.2 Statistical discrepancy 956,514.5 978,498.8 981,625.1 1,043,666.3 1,082,095.6 1,104,214.7 1,104,214.7 1,104,214.7 1,104,214.7 Expenditure on gross domestic product
증감률 Rate of change 5.1 2.0 1.2 4.1 2.3 2.22.22.22.2 Final consumption expenditure5.1 1.3 0.0 4.4 2.4 1.71.71.71.7 Private 5.0 1.3 -0.1 4.4 2.4 1.61.61.61.6 Households7.4 3.4 3.9 3.9 2.7 5.25.25.25.2 Non-profit institutions serving household5.4 4.3 5.6 2.9 2.1 3.93.93.93.9 Government3.5 0.0 -13.5 15.8 1.4 -1.8-1.8-1.8-1.8 Gross capital formation4.2 -1.9 -1.0 5.8 -1.0 -1.7-1.7-1.7-1.7 Gross fixed capital formation1.4 -2.8 3.4 -3.7 -4.7 -2.2-2.2-2.2-2.2 Construction9.3 -1.0 -9.8 25.7 3.6 -1.9-1.9-1.9-1.9 Facilities Investment5.6 2.0 1.7 1.7 7.4 4.14.14.14.1 Intangible Fixed Assets
-28.1 82.7 -230.0 -82.9 -213.5 -10.8-10.8-10.8-10.8 Changesininventoriesandacquisition lessdisposalsofvaluables12.6 6.6 -1.2 14.7 9.1 4.24.24.24.2 Exports of goods and services11.7 4.4 -8.0 17.3 6.1 2.52.52.52.5 (less)Imports of goods and services
-54.0 -454.4 63.2 51.0 95.6 -57.6-57.6-57.6-57.6 Statistical discrepancy5.1 2.3 0.3 6.3 3.7 2.02.02.02.0 Expenditure on gross domestic product
Source : The Bank of Korea

ⅩⅦ . 전국통계664
15. 경제활동별 국내총생산 및 국민총소득(2-1)1)당해년가격
단위 : 10억원 국내총생산 총부가가치
(시장가격) (기초가격) 농림어업 광 공 업(A=B+C) (B) 광업 제조업
연 별
GRDP Gross value Agriculture, Mining Mining Manufac- at market added at forestry and and turing prices basic prices and manufac- quarrying fishing turing
2007 975,013.0 874,782.0 25,208.8 240,612.1 2,001.2 238,610.9
2008 1,026,451.8 919,688.0 24,686.0 258,545.5 2,336.0 256,209.4
2009 1,065,036.8 958,836.0 26,615.0 268,798.7 2,220.5 266,578.2
2010 1,173,274.9 1,053,932.6 27,832.1 321,498.4 2,223.2 319,275.2
2011 1,235,160.5 1,113,487.7 29,787.7 350,501.3 2,301.9 348,199.4
2012p2012p2012p2012p 1,272,459.5 1,272,459.5 1,272,459.5 1,272,459.5 1,145,970.9 1,145,970.9 1,145,970.9 1,145,970.9 30,247.8 30,247.8 30,247.8 30,247.8 358,153.3 358,153.3 358,153.3 358,153.3 2,317.8 2,317.8 2,317.8 2,317.8 355,835.5 355,835.5 355,835.5 355,835.5 자료 : 한국은행 국민소득팀
2) 연쇄 가격단위 : 10억원
국내총생산 총부가가치 (시장가격) (기초가격) 농림어업 광 공 업(A=B+C) (B) 광업 제조업
연 별
GRDP Gross value Agriculture, Mining Mining Manufac- at market added at forestry and and turing prices basic prices and manufac- quarrying fishing turing
2007 956,514.5 859,517.6 27,294.0 249,315.6 1,909.8 247,408.1
2008 978,498.8 881,436.8 28,826.9 256,382.8 1,922.1 254,466.7
2009 981,625.1 886,241.0 29,759.2 252,470.4 1,906.0 250,567.7
2010 1,043,666.3 941,179.8 28,443.8 289,074.5 1,743.0 287,376.9
2011 1,082,095.6 973,685.5 27,856.7 309,958.0 1,659.1 308,378.6
2012p2012p2012p2012p 1,104,214.7 1,104,214.7 1,104,214.7 1,104,214.7 994,081.5 994,081.5 994,081.5 994,081.5 27,687.0 27,687.0 27,687.0 27,687.0 316,800.1 316,800.1 316,800.1 316,800.1 1,680.1 1,680.1 1,680.1 1,680.1 315,205.1 315,205.1 315,205.1 315,205.1 자료 : 한국은행 국민소득팀

National Statistics 665
15. GROSS DOMESTIC PRODUCT BY KIND OF ECONOMIC ACTIVITYAND GROSS NATIONAL INCOME
1) At current pricesUnit : billion won
총부가가치 Gross value added at basic prices 전기가스및 건설업 서비스업 수도사업 도소매 및 운수 및 금융,
음식숙박업 보관업 보험업 Year
Electricity, Construc- Services Wholesale and Transport Financial gas and tion retail trade, and intermedi-
water supply restaurants storage ation and hotels
19,155.3 64,979.0 524,826.8 93,405.5 40,070.5 61,114.0 200712,298.6 64,612.2 559,545.8 100,419.3 41,613.1 65,132.2 200817,258.2 66,576.6 579,587.5 103,994.8 40,162.5 65,035.5 200921,473.6 66,156.6 616,971.9 114,858.5 44,213.6 71,846.9 201021,571.6 65,664.4 645,962.8 123,531.3 41,150.4 77,992.7 201123,514.8 23,514.8 23,514.8 23,514.8 66,862.2 66,862.2 66,862.2 66,862.2 667,192.8 667,192.8 667,192.8 667,192.8 125,667.3 125,667.3 125,667.3 125,667.3 41,883.9 41,883.9 41,883.9 41,883.9 76,163.6 76,163.6 76,163.6 76,163.6 2012p2012p2012p2012p
Source : The Bank of Korea
2) At 2005 pricesUnit : billion won
총부가가치 Gross value added at basic prices전기가스및 건설업 서비스업 수도사업 도소매 및 운수 및 금융,
음식숙박업 보관업 보험업 Electricity, Construc- Services Wholesale and Transport Financial Yeargas and tion retail trade, and intermedi-
water supply restaurants storage ation and hotels
19,026.2 62,134.9 501,958.6 90,291.3 39,136.8 61,614.4 200720,199.0 60,611.1 515,812.4 91,512.4 41,033.4 64,612.2 200821,023.6 61,716.0 521,785.7 90,725.7 38,666.2 67,425.2 200921,937.4 60,047.9 542,216.0 97,125.1 42,657.4 69,063.0 201022,575.7 57,467.3 556,248.2 101,841.9 44,327.3 70,188.7 201123,218.5 23,218.5 23,218.5 23,218.5 56,557.7 56,557.7 56,557.7 56,557.7 570,193.0 570,193.0 570,193.0 570,193.0 104,259.1 104,259.1 104,259.1 104,259.1 44,889.9 44,889.9 44,889.9 44,889.9 72,689.1 72,689.1 72,689.1 72,689.1 2012p2012p2012p2012p
Source : The Bank of Korea

ⅩⅦ . 전국통계666
15. 경제활동별 국내총생산 및 국민총소득(2-2)1) 당해년 가격
단위 : 10억원 총부가가치 Gross value added at basic prices 서 비 스 업 Services 부동산 및 정보통신업 사업서비스업 공공행정 교육 보건 및 임대업 및 국방 서비스업 사회복지연 별 서비스업 Real Information Business Public Education Health and estate and activities admini- sicial work and communication stration renting and defence
2007 69,435.7 39,198.1 45,056.0 55,515.9 55,554.4 35,451.6
2008 71,886.2 39,666.8 49,905.7 59,396.8 60,940.1 38,452.1
2009 74,361.1 41,225.0 51,001.9 63,706.6 63,448.7 43,092.1
2010 76,046.5 42,421.0 55,493.9 65,079.2 64,887.0 47,228.9
2011 77,562.8 43,561.7 58,663.8 69,212.7 67,174.0 50,297.4
2012p2012p2012p2012p 80,924.0 80,924.0 80,924.0 80,924.0 44,909.5 44,909.5 44,909.5 44,909.5 61,957.1 61,957.1 61,957.1 61,957.1 73,955.5 73,955.5 73,955.5 73,955.5 69,536.2 69,536.2 69,536.2 69,536.2 53,874.6 53,874.6 53,874.6 53,874.6 자료 : 한국은행 국민소득팀
2) 연쇄 가격
단위 : 10억원 총부가가치 Gross value added at basic prices 서 비 스 업 Services 부동산 및 정보통신업 사업서비스업 공공행정 교육 보건 및 임대업 및 국방 서비스업 사회복지
연 별 서비스업 Real Information Business Public Education Health and estate and activities admini- sicial work and communication stration renting and defence
2007 65,524.8 39,664.7 41,800.2 52,183.9 49,971.2 32,905.8 2008 66,491.6 41,024.7 42,990.6 52,903.0 51,619.6 34,197.6 2009 66,368.7 41,933.8 42,727.5 54,887.7 52,135.1 36,897.6 2010 67,210.4 43,589.1 44,047.8 55,767.5 52,752.5 39,395.4 2011 67,884.3 46,149.4 44,927.1 56,660.2 52,742.4 40,793.0 2012p2012p2012p2012p 67,985.4 67,985.4 67,985.4 67,985.4 48,097.5 48,097.5 48,097.5 48,097.5 46,150.0 46,150.0 46,150.0 46,150.0 58,509.7 58,509.7 58,509.7 58,509.7 52,825.5 52,825.5 52,825.5 52,825.5 43,514.6 43,514.6 43,514.6 43,514.6
자료 : 한국은행 국민소득팀
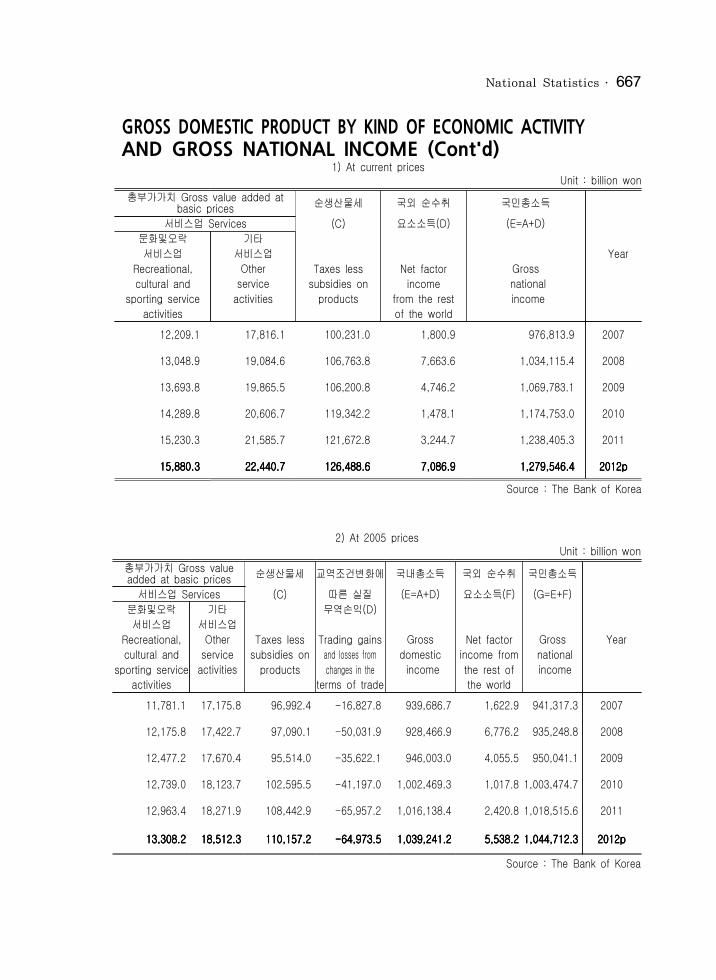
National Statistics 667
GROSS DOMESTIC PRODUCT BY KIND OF ECONOMIC ACTIVITYAND GROSS NATIONAL INCOME (Cont'd)
1) At current pricesUnit : billion won
총부가가치 Gross value added at basic prices 순생산물세 국외 순수취 국민총소득 서비스업 Services (C) 요소소득(D) (E=A+D)
문화및오락 기타 서비스업 서비스업 Year
Recreational, Other Taxes less Net factor Gross cultural and service subsidies on income national
sporting service activities products from the rest income activities of the world
12,209.1 17,816.1 100,231.0 1,800.9 976,813.9 200713,048.9 19,084.6 106,763.8 7,663.6 1,034,115.4 200813,693.8 19,865.5 106,200.8 4,746.2 1,069,783.1 200914,289.8 20,606.7 119,342.2 1,478.1 1,174,753.0 201015,230.3 21,585.7 121,672.8 3,244.7 1,238,405.3 201115,880.3 15,880.3 15,880.3 15,880.3 22,440.7 22,440.7 22,440.7 22,440.7 126,488.6 126,488.6 126,488.6 126,488.6 7,086.9 7,086.9 7,086.9 7,086.9 1,279,546.4 1,279,546.4 1,279,546.4 1,279,546.4 2012p2012p2012p2012p
Source : The Bank of Korea
2) At 2005 pricesUnit : billion won
총부가가치 Gross value added at basic prices 순생산물세 교역조건변화에 국내총소득 국외 순수취 국민총소득 서비스업 Services (C) 따른 실질 (E=A+D) 요소소득(F) (G=E+F)
문화및오락 기타 무역손익(D) 서비스업 서비스업
Recreational, Other Taxes less Trading gains Gross Net factor Gross Yearcultural and service subsidies on and losses from domestic income from national
sporting service activities products changes in the income the rest of income activities terms of trade the world
11,781.1 17,175.8 96,992.4 -16,827.8 939,686.7 1,622.9 941,317.3 200712,175.8 17,422.7 97,090.1 -50,031.9 928,466.9 6,776.2 935,248.8 200812,477.2 17,670.4 95,514.0 -35,622.1 946,003.0 4,055.5 950,041.1 200912,739.0 18,123.7 102,595.5 -41,197.0 1,002,469.3 1,017.8 1,003,474.7 201012,963.4 18,271.9 108,442.9 -65,957.2 1,016,138.4 2,420.8 1,018,515.6 201113,308.2 13,308.2 13,308.2 13,308.2 18,512.3 18,512.3 18,512.3 18,512.3 110,157.2 110,157.2 110,157.2 110,157.2 -64,973.5 -64,973.5 -64,973.5 -64,973.5 1,039,241.2 1,039,241.2 1,039,241.2 1,039,241.2 5,538.2 5,538.2 5,538.2 5,538.2 1,044,712.3 1,044,712.3 1,044,712.3 1,044,712.3 2012p2012p2012p2012p
Source : The Bank of Korea

ⅩⅦ . 전국통계668
16. 지역내 총생산
단위:10억원,%
시도별 당해년가격 Atcurrentprices
2006 2007 2008 2009 2010 2011201120112011 금 액 Amount
전 국 912,926 983,030 1,028,500 1,065,665 1,172,742 1,241,582 1,241,582 1,241,582 1,241,582 서울특별시 220,135 236,517 248,383 257,598 271,649 282,945 282,945 282,945 282,945 부산광역시 49,434 52,680 56,182 55,526 59,531 62,129 62,129 62,129 62,129 대구광역시 30,244 32,261 32,714 32,797 35,632 37,453 37,453 37,453 37,453 인천광역시 43,311 47,780 47,827 50,256 56,857 59,166 59,166 59,166 59,166 광주광역시 20,299 21,281 21,745 22,066 25,140 26,192 26,192 26,192 26,192 대전광역시 20,802 22,186 23,218 24,211 26,413 27,800 27,800 27,800 27,800 울산광역시 43,214 48,059 52,408 51,271 59,160 68,398 68,398 68,398 68,398 경 기 도 180,852 193,658 198,948 208,296 232,428 243,836 243,836 243,836 243,836 강 원 도 24,133 25,989 26,311 27,348 28,829 30,218 30,218 30,218 30,218 충청북도 27,997 30,001 30,105 32,175 36,233 38,758 38,758 38,758 38,758 충청남도 51,361 55,148 57,974 65,134 76,354 84,882 84,882 84,882 84,882 전라북도 26,488 28,586 29,471 31,855 34,643 37,985 37,985 37,985 37,985 전라남도 42,182 47,021 52,387 51,048 58,750 62,322 62,322 62,322 62,322 경상북도 62,643 63,969 67,712 69,223 78,314 81,322 81,322 81,322 81,322 경상남도 61,735 69,157 74,280 77,213 82,341 86,919 86,919 86,919 86,919 제 주 도 8,096 8,736 8,833 9,648 10,469 11,258 11,258 11,258 11,258
구 성 비 Composition ratio전 국 100.0 100.0 100.0 100.0 100.0 100.0 100.0 100.0 100.0
서울특별시 24.1 24.1 24.2 24.2 23.2 22.8 22.8 22.8 22.8 부산광역시 5.4 5.4 5.5 5.2 5.1 5.0 5.0 5.0 5.0 대구광역시 3.3 3.3 3.2 3.1 3.0 3.0 3.0 3.0 3.0 인천광역시 4.7 4.9 4.7 4.7 4.8 4.8 4.8 4.8 4.8 광주광역시 2.2 2.2 2.1 2.1 2.1 2.1 2.1 2.1 2.1 대전광역시 2.3 2.3 2.3 2.3 2.3 2.2 2.2 2.2 2.2 울산광역시 4.7 4.9 5.1 4.8 5.0 5.5 5.5 5.5 5.5 경 기 도 19.8 19.7 19.3 19.5 19.8 19.6 19.6 19.6 19.6 강 원 도 2.6 2.6 2.6 2.6 2.5 2.4 2.4 2.4 2.4 충청북도 3.1 3.1 2.9 3.0 3.1 3.1 3.1 3.1 3.1 충청남도 5.6 5.6 5.6 6.1 6.5 6.8 6.8 6.8 6.8 전라북도 2.9 2.9 2.9 3.0 3.0 3.1 3.1 3.1 3.1 전라남도 4.6 4.8 5.1 4.8 5.0 5.0 5.0 5.0 5.0 경상북도 6.9 6.5 6.6 6.5 6.7 6.5 6.5 6.5 6.5 경상남도 6.8 7.0 7.2 7.2 7.0 7.0 7.0 7.0 7.0 제 주 도 0.9 0.9 0.9 0.9 0.9 0.9 0.9 0.9 0.9
자료 : 통계청 지역소득통계팀

National Statistics 669
16. GROSS REGIONAL DOMESTICS PRODUCT
Unit : billion won, %2005년기준년가격 At 2005 constant prices
City & Province2006 2007 2008 2009 2010 2011201120112011
금 액 Amount 914,018 965,298 991,677 999,311 1,067,218 1,105,865 1,105,865 1,105,865 1,105,865 Whole Country 217,965 227,495 234,084 237,594 241,052 247,003 247,003 247,003 247,003 Seoul 49,726 52,098 52,739 51,349 53,407 55,897 55,897 55,897 55,897 Busan 29,883 31,244 31,666 30,151 32,590 33,125 33,125 33,125 33,125 Daegu 43,126 46,310 47,087 47,479 51,864 53,160 53,160 53,160 53,160 Incheon 20,127 20,831 20,668 20,671 22,544 23,073 23,073 23,073 23,073 Gwangju 20,713 21,361 21,643 21,763 23,250 23,501 23,501 23,501 23,501 Daejeon 42,483 44,265 44,622 43,191 46,413 49,503 49,503 49,503 49,503 Ulsan
182,399 193,615 201,696 203,627 227,660 241,537 241,537 241,537 241,537 Gyeonggi 24,155 25,300 25,530 25,360 26,431 27,346 27,346 27,346 27,346 Gangwon 27,766 29,380 29,963 31,079 33,828 34,888 34,888 34,888 34,888 Chungcheongbuk 53,505 57,563 61,569 67,055 75,607 79,456 79,456 79,456 79,456 Chungcheongnam 26,366 27,851 28,227 28,471 30,045 31,351 31,351 31,351 31,351 Jeonlabuk 43,557 46,466 47,303 48,008 51,303 51,719 51,719 51,719 51,719 Jeonlanam 62,566 67,990 68,527 66,239 68,701 69,494 69,494 69,494 69,494 Gyeongsangbuk 61,549 64,877 68,018 68,383 73,385 75,285 75,285 75,285 75,285 Gyeongsangnam 8,131 8,651 8,334 8,893 9,139 9,527 9,527 9,527 9,527 Jeju
증 감 률 Rate of change 5.1 5.6 2.7 0.8 6.8 3.6 3.6 3.6 3.6 Whole Country 4.3 4.4 2.9 1.5 1.5 2.5 2.5 2.5 2.5 Seoul 3.4 4.8 1.2 -2.6 4.0 4.7 4.7 4.7 4.7 Busan 3.9 4.6 1.4 -4.8 8.1 1.6 1.6 1.6 1.6 Daegu 6.8 7.4 1.7 0.8 9.2 2.5 2.5 2.5 2.5 Incheon 6.5 3.5 -0.8 0.0 9.1 2.3 2.3 2.3 2.3 Gwangju 3.4 3.1 1.3 0.6 6.8 1.1 1.1 1.1 1.1 Daejeon 1.9 4.2 0.8 -3.2 7.5 6.7 6.7 6.7 6.7 Ulsan 7.7 6.1 4.2 1.0 11.8 6.1 6.1 6.1 6.1 Gyeonggi 5.0 4.7 0.9 -0.7 4.2 3.5 3.5 3.5 3.5 Gangwon 3.9 5.8 2.0 3.7 8.8 3.1 3.1 3.1 3.1 Chungcheongbuk
12.6 7.6 7.0 8.9 12.8 5.1 5.1 5.1 5.1 Chungcheongnam 4.5 5.6 1.4 0.9 5.5 4.3 4.3 4.3 4.3 Jeonlabuk 1.7 6.7 1.8 1.5 6.9 0.8 0.8 0.8 0.8 Jeonlanam 1.3 8.7 0.8 -3.3 3.7 1.2 1.2 1.2 1.2 Gyeongsangbuk 5.7 5.4 4.8 0.5 7.3 2.6 2.6 2.6 2.6 Gyeongsangnam 2.1 6.4 -3.7 6.7 2.8 4.2 4.2 4.2 4.2 Jeju
Source : National statistical Office

ⅩⅦ . 전국통계670
17. 수출입총괄
단위:백만달러 수 출 Exports (A)
연 별 총 액 일 반 보세가공 기 타 L/C방식
월 별 Under L/C Bonded Total Ordinary processing Other
2007 371,489.0 335,514.9 68,434.5 29,351.9 6,622.3
2008 422,007.3 380,440.4 79,197.8 33,325.9 8,241.3
2009 363,533.4 322,867.9 59,269.2 33,614.2 7,051.5
2010 466,383.8 415,173.5 72,329.6 41,974.9 9,235.2
2011 555,213.7 501,403.0 82,966.4 43,660.6 10,150.3
2012201220122012 547,869.9 547,869.9 547,869.9 547,869.9 498,245.1 498,245.1 498,245.1 498,245.1 74,845.4 74,845.4 74,845.4 74,845.4 39,941.7 39,941.7 39,941.7 39,941.7 9,683.2 9,683.2 9,683.2 9,683.2
1 41,200.4 37,369.5 6,096.0 3,129.9 701.0
2 46,316.2 42,386.4 6,568.8 3,144.5 785.2
3 47,329.8 42,862.6 6,609.1 3,441.5 1,025.7
4 46,094.8 42,092.5 6,323.3 3,240.3 762.0
5 46,872.4 42,576.5 6,456.5 3,460.7 835.2
6 47,162.6 42,947.7 6,356.3 3,429.3 785.6
7 44,667.7 40,448.7 6,279.7 3,347.4 871.7
8 43,045.2 39,115.3 5,514.1 3,199.3 730.6
9 45,412.5 41,258.9 6,221.3 3,389.6 764.1
10 47,087.8 42,813.1 6,127.9 3,409.1 865.5
11 47,805.2 43,464.9 6,176.3 3,554.7 785.6
12 44,875.3 40,909.0 6,116.1 3,195.4 771.0 주 : 계상시점은통관면허일자기준. 수출은FOB, 수입은CIF 가격에 의함. 자료 : 관세청 / 자료출처:한국은행 [조사통계월보]

National Statistics 671
17. SUMMARY OF EXPORTS AND IMPORTS
Unit : million U.S. dollars수 입 Imports (B) 수출입초과
총 액 보유외환 차 관 기 타 (A-B) Year & Foreign Excess of exports Month
Total K.F.X. loans Other and imports(-) 356,845.8 330,384.0 761.9 25,651.0 14,643.2 2007
435,274.7 407,911.6 245.0 27,067.7 -13,267.4 2008
323,084.4 298,880.1 485.5 23,718.6 40,449.0 2009
425,212.2 394,077.0 146.2 30,988.6 41,171.6 2010
524,413.1 490,307.2 300.7 33,804.8 30,800.6 2011
519,584.4 519,584.4 519,584.4 519,584.4 485,986.8 485,986.8 485,986.8 485,986.8 431.8 431.8 431.8 431.8 33,165.7 33,165.7 33,165.7 33,165.7 28,285.5 28,285.5 28,285.5 28,285.5 2012201220122012
43,517.3 41,101.4 28.6 2,387.3 -2,316.9 Jan.
45,100.0 42,441.3 31.7 2,627.0 1,216.2 Feb.
45,053.4 42,382.5 35.5 2,635.3 2,276.4 Mar.
43,957.2 41,451.3 36.1 2,469.8 2,137.6 Apr.
44,480.3 41,868.9 20.8 2,590.7 2,392.1 May
41,993.6 39,093.4 20.9 2,879.2 5,169.0 June
41,976.9 38,937.8 31.5 3,007.7 2,690.8 July
41,115.7 38,210.3 72.2 2,833.1 1,929.5 Aug.
42,559.5 39,607.3 23.1 2,929.1 2,853.0 Sept.
43,379.9 40,278.2 12.6 3,089.0 3,707.9 Oct.
43,381.5 40,517.7 78.2 2,785.7 4,423.7 Nov.
43,069.1 40,096.7 40.6 2,931.8 1,806.2 Dec.
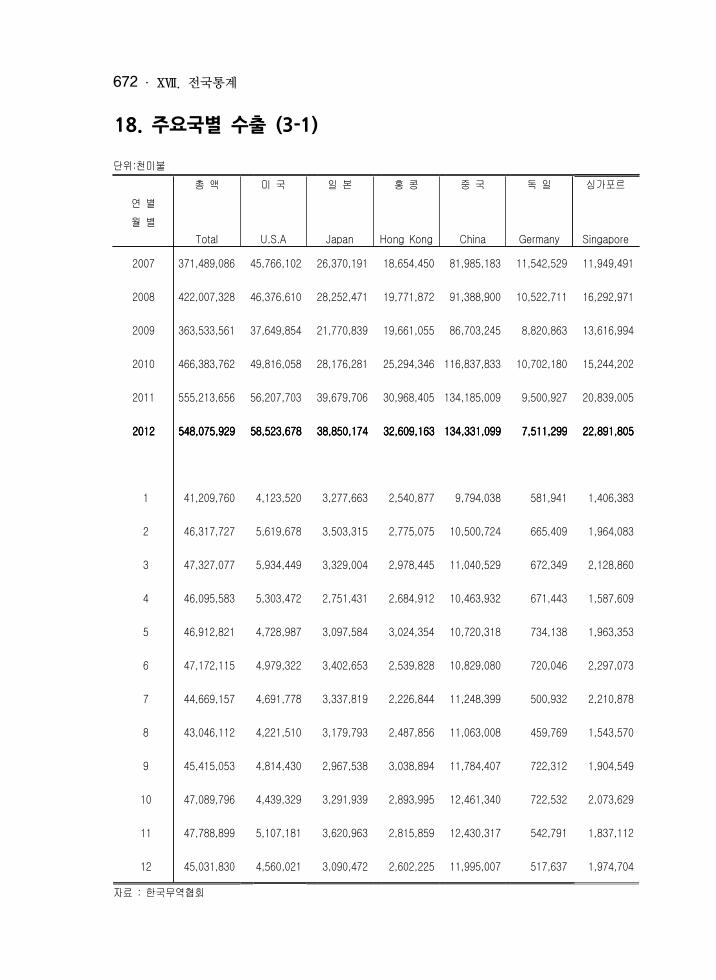
ⅩⅦ . 전국통계672
18. 주요국별 수출 (3-1)
단위:천미불 총 액 미 국 일 본 홍 콩 중 국 독 일 싱가포르
연 별 월 별
Total U.S.A Japan Hong Kong China Germany Singapore2007 371,489,086 45,766,102 26,370,191 18,654,450 81,985,183 11,542,529 11,949,491
2008 422,007,328 46,376,610 28,252,471 19,771,872 91,388,900 10,522,711 16,292,971
2009 363,533,561 37,649,854 21,770,839 19,661,055 86,703,245 8,820,863 13,616,994
2010 466,383,762 49,816,058 28,176,281 25,294,346 116,837,833 10,702,180 15,244,202
2011 555,213,656 56,207,703 39,679,706 30,968,405 134,185,009 9,500,927 20,839,005
2012201220122012 548,075,929548,075,929548,075,929548,075,929 58,523,67858,523,67858,523,67858,523,678 38,850,17438,850,17438,850,17438,850,174 32,609,16332,609,16332,609,16332,609,163 134,331,099134,331,099134,331,099134,331,099 7,511,2997,511,2997,511,2997,511,299 22,891,80522,891,80522,891,80522,891,805
1 41,209,760 4,123,520 3,277,663 2,540,877 9,794,038 581,941 1,406,383
2 46,317,727 5,619,678 3,503,315 2,775,075 10,500,724 665,409 1,964,083
3 47,327,077 5,934,449 3,329,004 2,978,445 11,040,529 672,349 2,128,860
4 46,095,583 5,303,472 2,751,431 2,684,912 10,463,932 671,443 1,587,609
5 46,912,821 4,728,987 3,097,584 3,024,354 10,720,318 734,138 1,963,353
6 47,172,115 4,979,322 3,402,653 2,539,828 10,829,080 720,046 2,297,073
7 44,669,157 4,691,778 3,337,819 2,226,844 11,248,399 500,932 2,210,878
8 43,046,112 4,221,510 3,179,793 2,487,856 11,063,008 459,769 1,543,570
9 45,415,053 4,814,430 2,967,538 3,038,894 11,784,407 722,312 1,904,549
10 47,089,796 4,439,329 3,291,939 2,893,995 12,461,340 722,532 2,073,629
11 47,788,899 5,107,181 3,620,963 2,815,859 12,430,317 542,791 1,837,112
12 45,031,830 4,560,021 3,090,472 2,602,225 11,995,007 517,637 1,974,704 자료 : 한국무역협회

National Statistics 673
18. EXPORTS BY MAJOR COUNTRY(DESTINATION)
Unit : thousand U.S. dollars대 만 인도네시아 파나마 태 국 영 국 리베리아 말레이지아 캐나다
Year & United Month
Taiwan Indonesia Panama Thailand Kingdom Liberia Malaysia Canada 13,027,109 5,770,618 3,145,006 4,488,400 6,870,038 2,511,026 5,704,248 3,506,423 2007
11,461,972 7,933,617 6,463,703 5,779,104 5,936,154 2,801,515 5,794,491 4,057,234 2008
9,501,115 5,999,880 4,476,617 4,528,169 3,796,553 4,884,557 4,324,822 3,439,570 2009
14,830,499 8,897,299 4,053,509 6,459,776 5,555,094 5,401,658 6,114,823 4,101,864 2010
18,205,965 13,564,498 3,798,253 8,458,966 4,969,095 7,389,345 6,275,131 4,927,656 2011
14,819,33714,819,33714,819,33714,819,337 13,945,84513,945,84513,945,84513,945,845 3,977,8833,977,8833,977,8833,977,883 8,216,9648,216,9648,216,9648,216,964 4,897,2764,897,2764,897,2764,897,276 3,803,6153,803,6153,803,6153,803,615 7,802,5517,802,5517,802,5517,802,551 4,828,2854,828,2854,828,2854,828,285 2012201220122012
1,213,915 1,220,001 734,645 543,509 310,025 220,270 573,541 303,498 Jan.
1,286,177 1,150,439 78,178 638,056 356,516 630,597 466,149 425,661 Feb.
1,331,385 1,198,966 269,442 700,839 419,193 282,067 623,425 490,209 Mar.
1,164,191 1,067,783 304,189 682,906 327,248 271,548 579,161 444,723 Apr.
1,356,876 1,150,434 329,074 701,506 306,116 584,621 579,127 482,616 May
1,209,641 1,265,223 296,702 673,814 289,722 654,887 618,051 487,734 June
1,119,234 928,465 218,358 668,985 378,621 109,748 691,475 428,319 July
1,276,175 1,134,548 187,088 675,458 500,691 143,632 492,380 349,484 Aug.
1,118,497 852,318 65,262 690,058 596,588 227,447 644,427 387,293 Sept.
1,186,446 1,279,402 958,411 744,367 609,225 38,127 835,067 346,339 Oct.
1,288,942 1,468,762 85,376 697,268 407,390 543,872 764,420 337,924 Nov.
1,267,858 1,229,504 451,159 800,199 395,940 96,798 935,328 344,485 Dec.Source : Korean Foreign Trade Association

ⅩⅦ . 전국통계674
18. 주요국별 수출 (3-2)
단위:천미불 멕시코 오스트레 필리핀 아랍에미 인도 네덜란드 베트남 프랑스
연 별 일리아 리트연합 월 별 United Arab
Mexico Australia Philippines Emirates India Netherlands Vietnam France2007 7,482,005 4,691,191 4,420,334 3,704,743 6,600,039 4,488,720 5,760,054 3,478,204
2008 9,089,949 5,171,339 5,016,255 5,748,540 8,977,063 6,405,586 7,804,817 3,495,521
2009 7,132,760 5,243,144 4,567,278 4,977,751 8,013,290 4,527,507 7,149,477 2,910,564
2010 8,845,549 6,641,624 5,837,983 5,487,047 11,434,596 5,306,208 9,652,073 3,004,291
2011 9,729,059 8,163,845 7,338,902 7,267,754 12,654,078 4,626,981 13,464,922 5,707,388
2012201220122012 9,041,3849,041,3849,041,3849,041,384 9,268,5729,268,5729,268,5729,268,572 8,229,1948,229,1948,229,1948,229,194 6,852,1136,852,1136,852,1136,852,113 11,921,07411,921,07411,921,07411,921,074 5,059,0225,059,0225,059,0225,059,022 15,954,02315,954,02315,954,02315,954,023 2,601,2232,601,2232,601,2232,601,223
1 652,143 636,346 655,348 521,353 971,677 201,197 1,061,334 176,483
2 745,378 726,504 596,784 560,393 962,735 335,620 1,259,405 248,763
3 771,306 842,711 663,174 597,521 1,093,013 320,680 1,251,894 241,175
4 756,238 820,057 810,478 551,993 1,075,680 326,615 1,237,806 208,704
5 750,986 746,440 776,534 594,712 1,022,821 786,898 1,289,596 208,459
6 713,160 783,816 645,203 681,533 943,568 475,432 1,369,094 185,004
7 784,216 764,891 763,074 635,136 1,076,561 599,974 1,352,030 169,723
8 752,077 720,175 567,080 482,362 889,475 668,258 1,380,824 178,819
9 845,679 822,336 646,772 586,582 1,155,667 459,764 1,340,669 220,560
10 867,219 784,440 717,729 555,389 877,683 193,012 1,378,581 255,877
11 734,148 780,812 697,868 549,762 999,647 218,120 1,531,325 260,875
12 668,834 840,044 689,150 535,377 852,547 473,452 1,501,465 246,780 자료 : 한국무역협회

National Statistics 675
18. EXPORTS BY MAJOR COUNTRY(DESTINATION)(Cont'd)
Unit : thousand U.S. dollars러시아 사우디 브라질 이탈리아 스페인 아르헨티나 방글라데시 벨기에
아라비아 Year & Saudi Arabia
MonthRussia Brazil Italy Spain Argentina Bangladesh Belgium
8,087,746 4,025,836 3,487,476 4,151,400 3,924,790 489,140 611,524 2,581,561 2007
9,747,957 5,253,426 5,925,866 3,545,580 3,192,486 578,207 1,095,016 3,233,909 2008
4,194,066 3,856,582 5,311,210 2,797,342 1,737,082 494,269 1,063,848 2,189,249 2009
7,759,836 4,556,673 7,752,579 3,569,135 1,857,955 909,449 1,554,317 2,028,477 2010
10,304,880 6,964,299 11,821,399 4,107,495 1,856,558 1,081,071 1,627,620 2,255,376 2011
11,098,72411,098,72411,098,72411,098,724 9,122,1449,122,1449,122,1449,122,144 10,287,97310,287,97310,287,97310,287,973 3,262,3643,262,3643,262,3643,262,364 1,668,5021,668,5021,668,5021,668,502 972,703972,703972,703972,703 1,459,1941,459,1941,459,1941,459,194 2,257,5552,257,5552,257,5552,257,555 2012201220122012
716,562 582,003 639,580 309,442 210,789 91,529 73,705 173,634 Jan.
873,144 587,568 1,335,238 303,407 154,834 76,358 250,243 344,566 Feb.
909,020 749,455 838,095 262,060 217,165 83,059 108,382 205,514 Mar.
973,518 783,544 717,364 372,614 146,812 72,504 214,644 217,034 Apr.
995,289 782,501 1,279,103 242,097 151,396 78,107 111,396 183,412 May
1,044,661 868,911 934,907 269,710 101,237 82,032 97,729 157,221 June
1,055,760 885,954 816,842 225,766 95,292 94,770 126,386 153,348 July
958,256 704,230 722,839 280,038 99,022 79,732 75,149 122,629 Aug.
973,109 741,025 798,006 289,809 108,567 90,135 95,517 188,629 Sept.
888,716 818,538 786,071 248,803 130,500 72,727 94,598 177,808 Oct.
982,051 792,287 723,517 215,709 137,487 70,796 86,363 189,093 Nov.
728,639 826,129 696,410 242,910 115,402 80,955 125,083 144,665 Dec.Source : Korean Foreign Trade Association

ⅩⅦ . 전국통계676
18. 주요국별 수출 (3-3)
단위:천미불 칠 레 파키스탄 이집트 스웨덴 남아프리 스리랑카 이스라엘 터 어 키 폴란드
연 별 카공화국 월 별 South
Chile Parkistan Egypt Sweden Africa Sri Lanka Israel Turkey Poland2007 3,115,103 678,115 1,166,579 950,046 1,752,811 186,117 969,774 4,087,436 3,508,775
2008 3,031,843 839,568 1,548,324 935,038 1,397,158 626,560 1,010,539 3,772,570 4,116,764
2009 2,229,062 729,814 1,528,199 472,105 1,082,071 170,323 725,818 2,660,688 4,146,741
2010 2,947,054 780,871 2,240,439 637,649 1,668,191 245,884 1,059,432 3,752,906 4,381,011
2011 2,381,457 818,096 1,726,874 1,042,835 2,254,760 343,615 1,817,867 5,070,997 4,100,788
2012201220122012 2,469,3472,469,3472,469,3472,469,347 847,283847,283847,283847,283 1,806,7651,806,7651,806,7651,806,765 788,779788,779788,779788,779 2,188,3112,188,3112,188,3112,188,311 320,507320,507320,507320,507 1,532,3841,532,3841,532,3841,532,384 4,552,3444,552,3444,552,3444,552,344 3,678,3113,678,3113,678,3113,678,311
1 178,108 58,213 129,413 56,599 235,924 39,426 170,049 316,414 329,718
2 199,704 59,958 134,283 62,318 197,165 26,376 117,618 439,831 312,714
3 198,446 60,075 150,924 60,253 172,153 31,644 106,075 499,247 303,992
4 255,952 75,165 153,683 64,988 215,928 22,000 132,734 418,756 292,677
5 198,733 71,512 150,863 80,379 189,703 24,196 109,465 366,376 321,340
6 178,434 69,618 151,738 61,745 187,875 30,335 183,407 365,958 292,206
7 181,844 80,508 157,372 62,411 159,145 27,354 117,282 364,821 276,737
8 164,367 61,689 97,779 57,177 136,289 20,595 139,830 321,077 326,335
9 225,507 75,931 151,397 69,066 203,454 24,283 124,585 339,298 354,253
10 233,885 75,710 163,050 66,537 181,912 23,245 121,032 419,926 292,937
11 234,475 61,269 196,033 80,030 141,762 27,481 123,435 345,621 326,632
12 219,892 97,635 170,229 67,276 167,002 23,572 86,873 355,020 248,769 자료 : 한국무역협회

National Statistics 677
18. EXPORTS BY MAJOR COUNTRY(DESTINATION)(Cont'd)
Unit : thousand U.S. dollars키프로스 이 란 우 즈 콜롬비아 스위스 오스트 노르웨이 시리아 포르투갈 덴 마 크
베키스탄 리아 Year & Month
Kyprus Iran Uzbekistan Colombia Switzerland Austria Norway Syria Portugal Denmark 1,073,077 3,265,621 748,302 1,120,657 483,804 770,672 596,278 607,746 414,133 462,624 2007
1,360,587 4,342,555 1,122,592 1,090,759 399,058 661,499 2,079,816 787,121 410,892 408,329 2008
1,170,901 3,991,897 1,149,783 797,029 341,404 643,020 1,606,344 960,167 430,795 478,704 2009
588,230 4,596,721 1,438,644 1,388,553 369,501 951,754 2,801,149 1,256,003 1,110,094 561,525 2010
899,681 6,068,276 1,718,758 1,613,984 1,130,414 838,490 666,394 841,930 713,258 437,664 2011
408,717408,717408,717408,717 6,262,1986,262,1986,262,1986,262,198 1,766,4791,766,4791,766,4791,766,479 1,468,0341,468,0341,468,0341,468,034 401,773401,773401,773401,773 838,481838,481838,481838,481 1,061,5171,061,5171,061,5171,061,517 433,384433,384433,384433,384 276,412276,412276,412276,412 349,814349,814349,814349,814 2012201220122012
35,373 568,253 83,651 122,472 20,458 58,568 80,041 46,832 18,698 25,697 Jan.
71,783 629,076 125,126 149,470 30,064 64,284 110,933 41,909 25,724 28,143 Feb.
2,616 506,582 153,870 130,332 33,309 76,178 14,526 42,401 26,630 29,226 Mar.
6,793 574,798 129,962 158,625 24,577 58,678 113,455 55,222 22,108 28,510 Apr.
73,230 625,838 180,902 122,939 61,479 79,311 12,455 42,867 20,633 33,942 May
2,639 498,003 197,135 129,549 57,885 60,638 85,482 25,375 19,162 30,745 June
3,675 538,771 146,143 130,911 28,152 46,316 108,572 14,609 15,066 30,436 July
65,137 462,950 118,594 89,860 23,812 75,351 154,532 10,820 21,534 40,610 Aug.
3,174 529,655 178,543 109,644 21,733 99,614 65,331 27,769 19,008 23,002 Sept.
2,909 524,506 119,842 95,442 54,621 99,877 149,158 41,315 21,558 24,126 Oct.
2,513 416,779 161,757 106,520 26,415 74,910 107,163 44,601 27,603 27,471 Nov.
138,875 386,986 170,954 122,268 19,268 44,756 59,869 39,665 38,687 27,905 Dec.Source : Korean Foreign Trade Association

ⅩⅦ . 전국통계678
19. 주요국별 수입(4-1)
단위:천미불 총 액 일 본 미 국 중 국 독 일 사우디
연 별 아라비아 월 별 Saudi
Total Japan U.S.A China Germany Arabia2007 356,845,733 56,250,126 37,219,301 63,027,802 13,534,323 21,163,501
2008 435,274,737 60,956,391 38,364,783 76,930,272 14,769,118 33,781,495
2009 323,084,521 49,427,515 29,039,451 54,246,056 12,298,461 19,736,848
2010 425,212,160 64,296,117 40,402,691 71,573,603 14,304,896 26,820,002
2011 524,413,090 68,320,170 44,569,029 86,432,238 16,962,579 36,972,612
2012201220122012 519,581,584519,581,584519,581,584519,581,584 64,350,83764,350,83764,350,83764,350,837 43,337,40243,337,40243,337,40243,337,402 80,777,79180,777,79180,777,79180,777,791 17,640,70317,640,70317,640,70317,640,703 39,722,35839,722,35839,722,35839,722,358
1 43,502,104 5,242,299 3,694,504 6,832,463 1,371,676 3,445,835
2 45,073,049 5,698,000 4,142,833 6,107,073 1,300,108 3,348,421
3 45,048,151 5,881,588 3,979,329 7,090,144 1,555,807 3,613,612
4 43,964,269 5,496,136 3,950,630 6,915,459 1,433,169 3,434,276
5 44,487,396 5,291,346 3,826,514 7,090,895 1,488,960 3,652,652
6 42,003,003 5,094,421 3,765,138 6,449,970 1,402,241 2,923,120
7 41,972,687 5,267,046 3,604,658 6,643,345 1,516,234 2,833,715
8 41,095,233 5,099,935 3,231,256 6,541,736 1,425,805 3,304,003
9 42,547,912 5,328,261 3,275,450 6,676,329 1,491,187 2,931,920
10 43,394,856 5,369,166 3,657,046 7,094,369 1,437,673 3,605,738
11 43,384,157 5,341,162 3,160,110 6,914,207 1,488,982 3,448,194
12 43,108,764 5,241,478 3,049,934 6,421,801 1,728,860 3,180,871 자료 : 한국무역협회
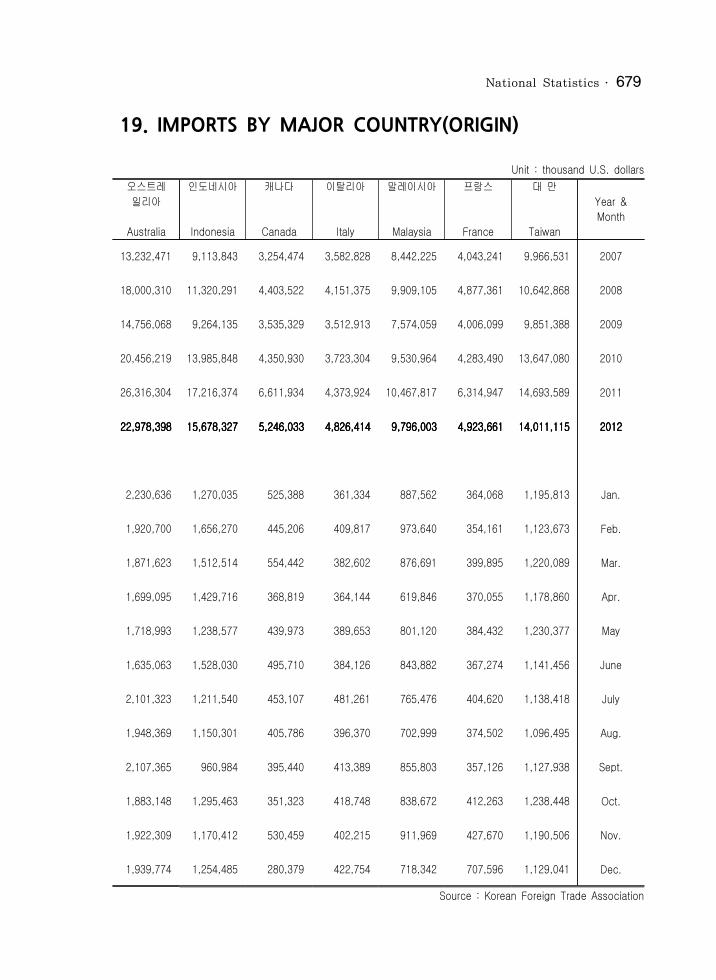
National Statistics 679
19. IMPORTS BY MAJOR COUNTRY(ORIGIN)
Unit : thousand U.S. dollars오스트레 인도네시아 캐나다 이탈리아 말레이시아 프랑스 대 만일리아 Year &
MonthAustralia Indonesia Canada Italy Malaysia France Taiwan
13,232,471 9,113,843 3,254,474 3,582,828 8,442,225 4,043,241 9,966,531 2007
18,000,310 11,320,291 4,403,522 4,151,375 9,909,105 4,877,361 10,642,868 2008
14,756,068 9,264,135 3,535,329 3,512,913 7,574,059 4,006,099 9,851,388 2009
20,456,219 13,985,848 4,350,930 3,723,304 9,530,964 4,283,490 13,647,080 2010
26,316,304 17,216,374 6,611,934 4,373,924 10,467,817 6,314,947 14,693,589 2011
22,978,39822,978,39822,978,39822,978,398 15,678,32715,678,32715,678,32715,678,327 5,246,0335,246,0335,246,0335,246,033 4,826,4144,826,4144,826,4144,826,414 9,796,0039,796,0039,796,0039,796,003 4,923,6614,923,6614,923,6614,923,661 14,011,11514,011,11514,011,11514,011,115 2012201220122012
2,230,636 1,270,035 525,388 361,334 887,562 364,068 1,195,813 Jan.
1,920,700 1,656,270 445,206 409,817 973,640 354,161 1,123,673 Feb.
1,871,623 1,512,514 554,442 382,602 876,691 399,895 1,220,089 Mar.
1,699,095 1,429,716 368,819 364,144 619,846 370,055 1,178,860 Apr.
1,718,993 1,238,577 439,973 389,653 801,120 384,432 1,230,377 May
1,635,063 1,528,030 495,710 384,126 843,882 367,274 1,141,456 June
2,101,323 1,211,540 453,107 481,261 765,476 404,620 1,138,418 July
1,948,369 1,150,301 405,786 396,370 702,999 374,502 1,096,495 Aug.
2,107,365 960,984 395,440 413,389 855,803 357,126 1,127,938 Sept.
1,883,148 1,295,463 351,323 418,748 838,672 412,263 1,238,448 Oct.
1,922,309 1,170,412 530,459 402,215 911,969 427,670 1,190,506 Nov.
1,939,774 1,254,485 280,379 422,754 718,342 707,596 1,129,041 Dec.Source : Korean Foreign Trade Association

ⅩⅦ . 전국통계680
19. 주요국별 수입(4-2)
단위:천미불 베트남 영 국 싱가포르 이 란 러시아 아랍에미리트 브라질
연 별 월 별 United United Arab
Vietnam Kingdom Singapore Iran Russia Emirates Brazil2007 1,391,588 3,580,764 6,859,677 6,481,826 6,977,477 12,656,189 2,793,711
2008 2,037,075 3,637,133 8,361,769 8,223,057 8,340,060 19,248,495 4,380,460
2009 2,369,970 2,895,758 7,871,779 5,745,749 5,788,759 9,310,021 3,743,503
2010 3,330,815 3,265,544 7,849,530 6,940,236 9,899,456 12,170,134 4,712,085
2011 5,084,246 3,818,089 8,966,683 11,358,379 10,852,171 14,759,366 6,342,934
2012201220122012 5,718,0175,718,0175,718,0175,718,017 6,359,6686,359,6686,359,6686,359,668 9,675,4669,675,4669,675,4669,675,466 8,531,1778,531,1778,531,1778,531,177 11,355,07311,355,07311,355,07311,355,073 15,115,89515,115,89515,115,89515,115,895 6,084,0486,084,0486,084,0486,084,048
1 453,312 290,673 776,662 979,212 997,228 1,623,609 690,158
2 326,316 735,308 766,336 1,043,480 912,177 1,298,918 694,477
3 420,276 450,350 909,078 872,229 808,028 1,149,544 412,499
4 450,692 449,619 879,951 1,118,166 684,487 1,039,929 408,727
5 366,409 787,410 742,370 655,308 1,089,368 1,648,126 464,737
6 468,957 485,046 787,854 847,193 747,047 1,152,591 450,722
7 388,327 631,495 825,835 557,499 755,208 1,061,953 375,455
8 596,044 489,154 769,662 52,547 1,000,884 992,910 532,087
9 585,004 767,632 885,007 106,628 1,111,601 1,126,908 426,881
10 657,035 402,642 801,821 790,710 1,260,594 1,260,784 601,415
11 539,055 293,212 773,816 821,739 1,140,497 1,431,284 511,833
12 466,589 577,127 757,075 686,468 847,953 1,329,338 515,056 자료 : 한국무역협회
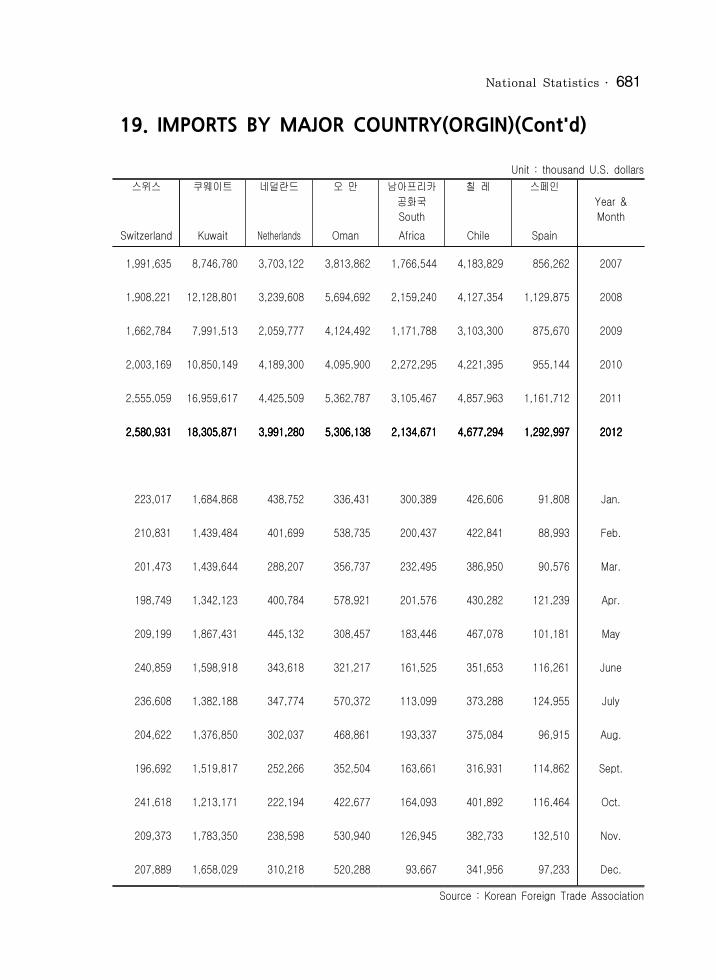
National Statistics 681
19. IMPORTS BY MAJOR COUNTRY(ORGIN)(Cont'd)
Unit : thousand U.S. dollars스위스 쿠웨이트 네덜란드 오 만 남아프리카 칠 레 스페인
공화국 Year & South Month
Switzerland Kuwait Netherlands Oman Africa Chile Spain 1,991,635 8,746,780 3,703,122 3,813,862 1,766,544 4,183,829 856,262 2007
1,908,221 12,128,801 3,239,608 5,694,692 2,159,240 4,127,354 1,129,875 2008
1,662,784 7,991,513 2,059,777 4,124,492 1,171,788 3,103,300 875,670 2009
2,003,169 10,850,149 4,189,300 4,095,900 2,272,295 4,221,395 955,144 2010
2,555,059 16,959,617 4,425,509 5,362,787 3,105,467 4,857,963 1,161,712 2011
2,580,9312,580,9312,580,9312,580,931 18,305,87118,305,87118,305,87118,305,871 3,991,2803,991,2803,991,2803,991,280 5,306,1385,306,1385,306,1385,306,138 2,134,6712,134,6712,134,6712,134,671 4,677,2944,677,2944,677,2944,677,294 1,292,9971,292,9971,292,9971,292,997 2012201220122012
223,017 1,684,868 438,752 336,431 300,389 426,606 91,808 Jan.
210,831 1,439,484 401,699 538,735 200,437 422,841 88,993 Feb.
201,473 1,439,644 288,207 356,737 232,495 386,950 90,576 Mar.
198,749 1,342,123 400,784 578,921 201,576 430,282 121,239 Apr.
209,199 1,867,431 445,132 308,457 183,446 467,078 101,181 May
240,859 1,598,918 343,618 321,217 161,525 351,653 116,261 June
236,608 1,382,188 347,774 570,372 113,099 373,288 124,955 July
204,622 1,376,850 302,037 468,861 193,337 375,084 96,915 Aug.
196,692 1,519,817 252,266 352,504 163,661 316,931 114,862 Sept.
241,618 1,213,171 222,194 422,677 164,093 401,892 116,464 Oct.
209,373 1,783,350 238,598 530,940 126,945 382,733 132,510 Nov.
207,889 1,658,029 310,218 520,288 93,667 341,956 97,233 Dec.Source : Korean Foreign Trade Association

ⅩⅦ . 전국통계682
19. 주요국별 수입(4-3)
단위:천미불 뉴질랜드 홍 콩 태 국 스웨덴 파나마 인 도
연 별 월 별
New Zealand Hong Kong Thailand Sweden Panama India2007 1,171,198 2,142,324 3,769,191 1,192,797 333,926 4,624,421
2008 1,121,669 2,222,720 4,281,655 1,299,336 872,781 6,581,241
2009 879,361 1,487,173 3,238,628 1,169,497 1,090,543 4,141,622
2010 1,175,909 1,945,933 4,168,786 1,414,899 573,460 5,674,456
2011 1,474,143 2,315,073 5,413,360 2,143,525 393,860 7,893,573
2012201220122012 1,336,3751,336,3751,336,3751,336,375 2,058,6002,058,6002,058,6002,058,600 5,352,0255,352,0255,352,0255,352,025 1,455,6691,455,6691,455,6691,455,669 594,848594,848594,848594,848 6,923,8686,923,8686,923,8686,923,868
1 110,496 132,659 367,313 145,927 4,268 551,205
2 110,583 192,743 380,617 115,191 78,629 511,943
3 110,227 176,037 481,063 115,166 15,916 623,302
4 111,437 167,150 477,393 121,583 8,943 671,150
5 120,156 213,036 471,785 112,259 40,719 553,655
6 120,962 153,736 481,780 109,937 50,301 621,775
7 125,973 178,156 420,374 165,817 79,117 413,854
8 102,022 166,975 454,903 110,815 2,296 517,394
9 93,691 177,604 500,041 107,775 137,019 645,194
10 102,490 179,820 447,840 109,685 16,990 622,938
11 108,883 168,490 446,755 130,934 121,580 599,339
12 119,454 152,195 422,161 110,580 39,069 592,118 자료 : 한국무역협회

National Statistics 683
19. IMPORTS BY MAJOR COUNTRY(ORGIN)(Cont'd)
Unit : thousand U.S. dollars예 멘 벨 기 에 필리핀 핀란드 덴마크 에콰도르 오스트리아
Year & Month
Yemen Belgium Philippines Finland Denmark Ecuador Austria 255,357 1,180,116 2,438,257 963,456 701,528 23,277 873,309 2007
64,145 1,314,367 3,099,488 1,046,719 709,087 25,957 979,042 2008
52,734 892,681 2,651,633 850,893 586,303 10,053 862,709 2009
420,695 1,154,766 3,488,104 1,003,799 574,507 12,254 1,014,709 2010
1,126,526 1,450,330 3,571,472 935,224 714,520 30,634 1,330,007 2011
1,106,3491,106,3491,106,3491,106,349 1,389,8991,389,8991,389,8991,389,899 3,282,1603,282,1603,282,1603,282,160 1,052,2431,052,2431,052,2431,052,243 748,511748,511748,511748,511 39,50739,50739,50739,507 1,261,8651,261,8651,261,8651,261,865 2012201220122012
66,138 103,075 290,424 66,824 50,463 2,971 100,666 Jan.
122,272 95,189 295,036 87,856 55,477 3,069 96,515 Feb.
86,920 154,837 265,808 99,375 61,326 1,886 90,754 Mar.
70,040 113,953 326,892 70,560 56,005 2,878 99,680 Apr.
1,463 141,258 267,654 68,031 73,356 2,684 124,715 May
62,451 97,295 297,441 85,887 56,589 2,694 120,996 June
205,893 121,949 253,239 107,265 74,617 3,341 119,469 July
64,063 116,694 234,561 77,232 57,590 2,935 110,109 Aug.
34,670 80,153 251,226 104,030 65,536 3,618 98,540 Sept.
110,380 103,936 319,744 120,358 57,386 4,504 106,563 Oct.
115,858 106,017 259,329 72,928 72,029 4,240 95,090 Nov.
166,201 155,542 220,805 91,898 68,139 4,684 98,771 Dec.Source : Korean Foreign Trade Association
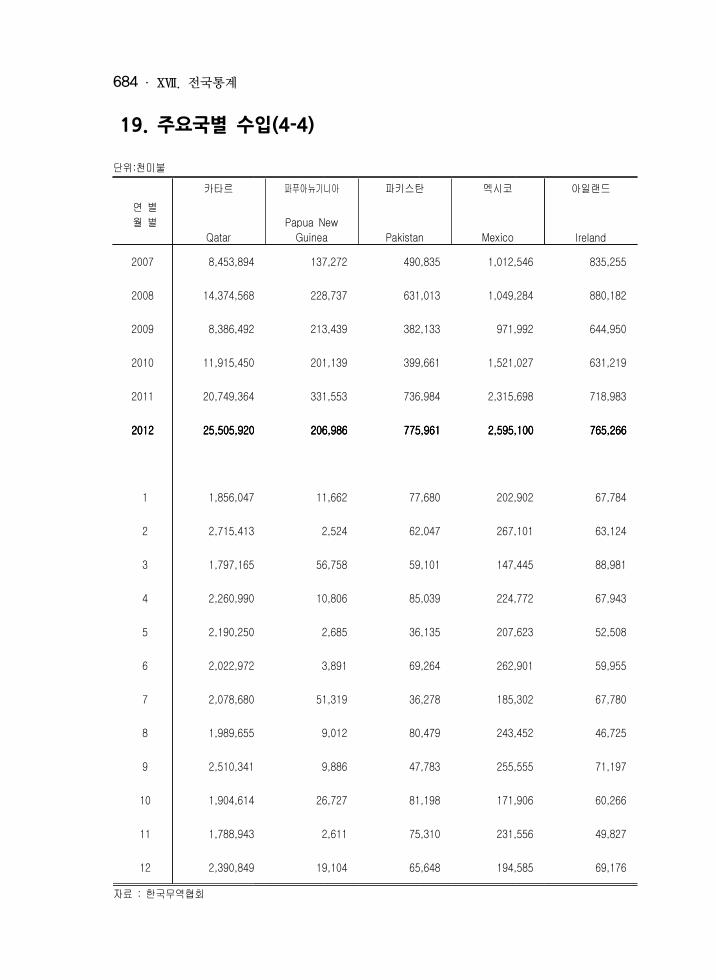
ⅩⅦ . 전국통계684
19. 주요국별 수입(4-4)
단위:천미불 카타르 파푸아뉴기니아 파키스탄 멕시코 아일랜드
연 별 월 별 Papua New
Qatar Guinea Pakistan Mexico Ireland2007 8,453,894 137,272 490,835 1,012,546 835,255
2008 14,374,568 228,737 631,013 1,049,284 880,182
2009 8,386,492 213,439 382,133 971,992 644,950
2010 11,915,450 201,139 399,661 1,521,027 631,219
2011 20,749,364 331,553 736,984 2,315,698 718,983
2012201220122012 25,505,92025,505,92025,505,92025,505,920 206,986206,986206,986206,986 775,961775,961775,961775,961 2,595,1002,595,1002,595,1002,595,100 765,266765,266765,266765,266
1 1,856,047 11,662 77,680 202,902 67,784
2 2,715,413 2,524 62,047 267,101 63,124
3 1,797,165 56,758 59,101 147,445 88,981
4 2,260,990 10,806 85,039 224,772 67,943
5 2,190,250 2,685 36,135 207,623 52,508
6 2,022,972 3,891 69,264 262,901 59,955
7 2,078,680 51,319 36,278 185,302 67,780
8 1,989,655 9,012 80,479 243,452 46,725
9 2,510,341 9,886 47,783 255,555 71,197
10 1,904,614 26,727 81,198 171,906 60,266
11 1,788,943 2,611 75,310 231,556 49,827
12 2,390,849 19,104 65,648 194,585 69,176 자료 : 한국무역협회

National Statistics 685
19. IMPORTS BY MAJOR COUNTRY(ORGIN)(Cont'd)
Unit : thousand U.S. dollars바레인 이집트 이스라엘 노르웨이 터 키
Year & Month
Bahrain Egypt Israel Norway Turkey 320,217 613,806 736,515 1,535,687 281,570 2007
292,645 1,330,925 894,993 2,202,471 361,913 2008
317,953 462,978 691,180 2,868,704 434,435 2009
589,233 937,560 769,140 3,673,025 516,290 2010
656,042 690,854 683,496 2,594,863 804,624 2011
801,808801,808801,808801,808 811,252811,252811,252811,252 861,223861,223861,223861,223 5,094,8255,094,8255,094,8255,094,825 672,300672,300672,300672,300 2012201220122012
85,674 148,590 92,251 169,806 73,861 Jan.
62,725 90,199 55,148 262,943 66,626 Feb.
67,759 49,008 54,129 569,486 64,006 Mar.
69,904 56,814 86,798 585,146 63,442 Apr.
48,800 10,496 75,100 478,946 46,451 May
37,060 117,177 74,745 307,154 72,328 June
59,460 35,626 76,484 817,111 60,465 July
59,088 110,379 96,190 331,119 48,787 Aug.
84,122 26,147 52,826 492,683 48,105 Sept.
118,717 3,476 57,232 302,318 25,928 Oct.
70,633 37,647 75,063 315,734 43,075 Nov.
37,865 125,694 65,257 462,379 59,228 Dec.Source : Korean Foreign Trade Association

ⅩⅦ . 전국통계686
20. 자 동 차 등 록
단위:대 총 계 승용차 승합차
연 별 관용 자가용 영업용 관용 자가용 영업용 관용시도별 Gover- Passenger Gover- Gover-
Total nment Private Business car nment Private Business Bus nment2007 16,428,177 60,684 15,496,374 871,119 12,099,779 20,714 11,674,085 404,980 1,104,949 12,6502008 16,794,219 62,302 15,820,627 911,290 12,483,809 21,388 12,025,715 436,706 1,096,698 13,2692009 17,325,210 64,484 16,330,410 930,316 13,023,819 22,267 12,551,833 449,719 1,080,687 14,1772010 17,941,356 66,272 16,901,013 974,071 13,631,769 22,872 13,124,972 483,925 1,049,725 15,0392011 18,437,373 68,689 17,357,232 1,011,452 14,136,478 24,244 13,601,821 510,413 1,015,391 15,6672012201220122012 18,870,53318,870,53318,870,53318,870,533 71,115 71,115 71,115 71,115 17,747,328 17,747,328 17,747,328 17,747,328 1,052,090 1,052,090 1,052,090 1,052,090 14,577,193 14,577,193 14,577,193 14,577,193 25,295 25,295 25,295 25,295 14,010,618 14,010,618 14,010,618 14,010,618 541,280 541,280 541,280 541,280 986,833 986,833 986,833 986,833 16,428 16,428 16,428 16,428
서 울 2,969,184 10,858 2,759,567 198,759 2,447,876 4,130 2,317,853 125,893 162,723 2,769 부 산 1,175,205 3,878 1,090,244 81,083 921,034 1,364 883,429 36,241 58,725 911 대 구 1,010,065 2,453 959,750 47,862 806,027 753 781,157 24,117 41,969 604 인 천 1,049,444 3,098 934,398 111,948 822,007 1,273 746,115 74,619 58,127 758 광 주 550,821 1,634 518,270 30,917 437,486 573 420,012 16,901 26,192 401 대 전 594,786 1,664 565,762 27,360 482,050 578 466,852 14,620 27,369 413 울 산 470,410 1,330 449,996 19,084 384,426 470 376,168 7,788 17,724 302 세 종 47,760 208 45,875 1,677 34,923 59 34,514 350 2,477 42 경 기 4,402,396 13,030 4,189,858 199,508 3,453,701 5,224 3,374,929 73,548 249,366 2,583 강 원 630,860 4,361 601,869 24,630 459,307 1,463 444,915 12,929 34,974 955 충 북 653,610 2,839 621,634 29,137 478,529 888 465,210 12,431 35,608 693 충 남 855,751 4,094 815,832 35,825 615,770 1,282 600,050 14,438 46,751 806 전 북 755,456 3,866 711,566 40,024 545,830 1,226 523,987 20,617 37,808 869 전 남 766,704 4,707 718,775 43,222 512,127 1,549 494,040 16,538 42,206 1,174 경 북 1,172,860 5,768 1,121,971 45,121 833,310 1,984 815,767 15,559 57,216 1,324 경 남 1,470,733 5,684 1,381,038 84,011 1,131,988 1,889 1,079,876 50,223 68,663 1,512 제 주 294,488 1,643 260,923 31,922 210,802 590 185,744 24,468 18,935 312
자료 : 국토해양부

National Statistics 687
20. NUMBER OF REGISTERED MOTOR VEHICLES
Unit : vehicle 화물차 특수차
자가용 영업용 관용 자가용 영업용 관용 자가용 영업용 Year & Gover- Special Gover- City
Private Business Truck nment Private Business Car nment Private Business ,Province999,807 92,492 3,171,351 25,230 2,811,537 334,584 52,098 2,090 10,945 39,063 2007987,448 95,981 3,160,338 25,535 2,796,092 338,711 53,374 2,110 11,372 39,892 2008967,890 98,620 3,166,512 25,970 2,798,797 341,745 54,192 2,070 11,890 40,232 2009931,740 102,946 3,203,808 26,306 2,831,697 345,805 56,054 2,055 12,604 41,395 2010893,717 106,007 3,226,421 26,680 2,848,544 351,197 59,083 2,098 13,150 43,835 2011860,074 860,074 860,074 860,074 110,331 110,331 110,331 110,331 3,243,924 3,243,924 3,243,924 3,243,924 27,177 27,177 27,177 27,177 2,862,737 2,862,737 2,862,737 2,862,737 354,010 354,010 354,010 354,010 62,583 62,583 62,583 62,583 2,215 2,215 2,215 2,215 13,899 13,899 13,899 13,899 46,469 46,469 46,469 46,469 2012201220122012
142,335 17,619 353,905 3,617 298,079 52,209 4,680 342 1,300 3,038 Seoul51,955 5,859 186,946 1,492 154,130 31,324 8,500 111 730 7,659 Busan37,217 4,148 160,327 1,023 140,938 18,366 1,742 73 438 1,231 Daegu49,746 7,623 164,447 975 137,738 25,734 4,863 92 799 3,972 Incheon23,423 2,368 85,427 607 74,481 10,339 1,716 53 354 1,309 Gwangju24,988 1,968 83,923 611 73,482 9,830 1,444 62 440 942 Daejeon15,717 1,705 66,164 511 57,781 7,872 2,096 47 330 1,719 Ulsan2,257 178 10,247 98 9,054 1,095 113 9 50 54 Sejong
216,757 30,026 688,600 4,825 595,650 88,125 10,729 398 2,522 7,809 Gyeonggi31,004 3,015 134,838 1,801 125,255 7,782 1,741 142 695 904 Gangwon31,305 3,610 136,850 1,167 124,517 11,166 2,623 91 602 1,930 Chungcheongbuk40,906 5,039 190,331 1,869 174,121 14,341 2,899 137 755 2,007 Chungcheongnam32,849 4,090 169,357 1,649 153,921 13,787 2,461 122 809 1,530 Jeonlabuk35,799 5,233 207,028 1,836 187,608 17,584 5,343 148 1,328 3,867 Jeonlanam50,830 5,062 276,931 2,280 254,097 20,554 5,403 180 1,277 3,946 Gyeongsangbuk58,787 8,364 264,509 2,140 241,196 21,173 5,573 143 1,179 4,251 Gyeongsangnam14,199 4,424 64,094 676 60,689 2,729 657 65 291 301 Jeju
Source : Ministry of construction Transportation
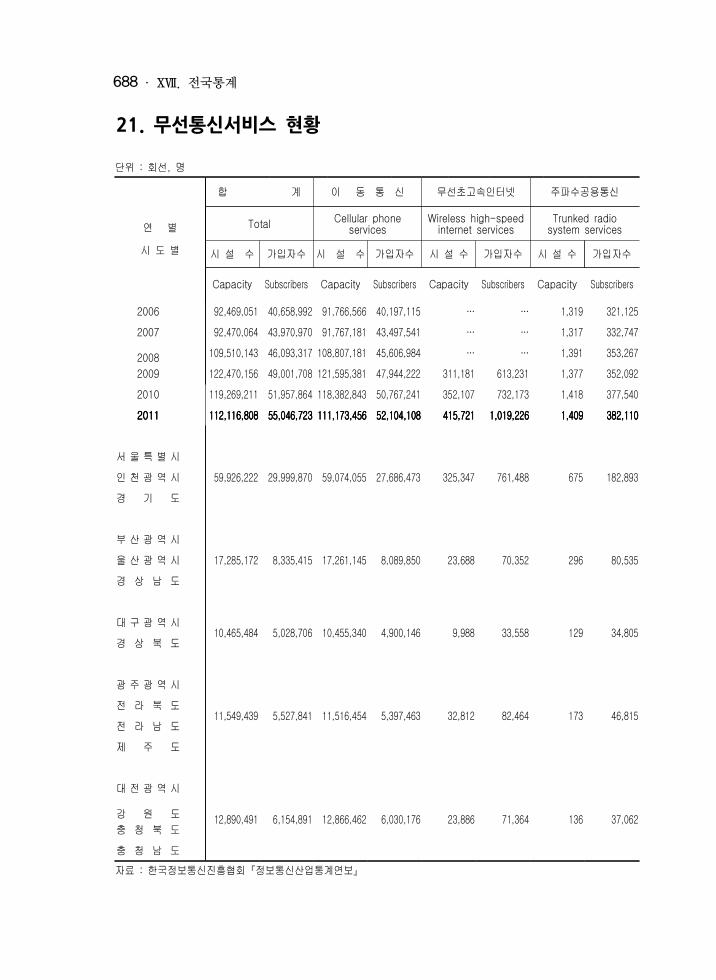
ⅩⅦ . 전국통계688
21. 무선통신서비스 현황
단위 : 회선, 명
연 별시 도 별
합 계 이 동 통 신 무선초고속인터넷 주파수공용통신
Total Cellular phone services Wireless high-speed internet services Trunked radiosystem services시 설 수 가입자수 시 설 수 가입자수 시 설 수 가입자수 시 설 수 가입자수
Capacity Subscribers Capacity Subscribers Capacity Subscribers Capacity Subscribers2006 92,469,051 40,658,992 91,766,566 40,197,115 … … 1,319 321,1252007 92,470,064 43,970,970 91,767,181 43,497,541 … … 1,317 332,7472008 109,510,143 46,093,317 108,807,181 45,606,984 … … 1,391 353,2672009 122,470,156 49,001,708 121,595,381 47,944,222 311,181 613,231 1,377 352,0922010 119,269,211 51,957,864 118,382,843 50,767,241 352,107 732,173 1,418 377,5402011201120112011 112,116,808112,116,808112,116,808112,116,808 55,046,72355,046,72355,046,72355,046,723 111,173,456111,173,456111,173,456111,173,456 52,104,10852,104,10852,104,10852,104,108 415,721415,721415,721415,721 1,019,2261,019,2261,019,2261,019,226 1,4091,4091,4091,409 382,110382,110382,110382,110
서 울 특 별 시
59,926,222 29,999,870 59,074,055 27,686,473 325,347 761,488 675 182,893인 천 광 역 시경 기 도
부 산 광 역 시
17,285,172 8,335,415 17,261,145 8,089,850 23,688 70,352 296 80,535울 산 광 역 시경 상 남 도
대 구 광 역 시 10,465,484 5,028,706 10,455,340 4,900,146 9,988 33,558 129 34,805경 상 북 도
광 주 광 역 시
11,549,439 5,527,841 11,516,454 5,397,463 32,812 82,464 173 46,815전 라 북 도전 라 남 도제 주 도
대 전 광 역 시
12,890,491 6,154,891 12,866,462 6,030,176 23,886 71,364 136 37,062강 원 도충 청 북 도충 청 남 도자료 : 한국정보통신진흥협회『정보통신산업통계연보』

National Statistics 689
21. LAND MOBILE TELECOMMUNICATIONS SERVICES
Unit : line, person무선데이타 통신 무 선 호 출 및 메시징 기타 이동통신 Wireless data communication service
Pager & messaging services Other mobile communication services Year &
시 설 수 가 입 자 수 시 설 수 가 입 자 수 시 설 수 가 입 자 수 City,ProvinceCapacity Subscribers Capacity Subscribers Capacity Subscribers
401 97,272 700,165 42,690 600 790 2006401 100,354 700,165 39,328 1,000 1,000 2007406 90,984 700,165 41,082 1,000 1,000 2008722 62,334 560,132 21,066 1,363 8,763 2009718 61,993 532,125 18,917 1,390 8,938 2010682682682682 1,513,9131,513,9131,513,9131,513,913 524,143524,143524,143524,143 18,33918,33918,33918,339 1,3971,3971,3971,397 9,0279,0279,0279,027 2011201120112011
605 1,341,650 524,143 18,339 1,397 9,027Seoul
IncheonGyeonggi
43 94,678 - - - - BusanUlsan
Gyeongsangnam
27 60,197 - - - - DaeguGyeongsangbuk
- 1,099 - - - - Gwangju
JeonlabukJeonlanam
Jeju
7 16,289 - - - - Daejeon
GangwonChungcheongbukChungcheongnam
Source : Korea Association of Information & Telecommunication