
Statistics and Machine Learning Fall, 2005 鮑興國 and 李育杰 National Taiwan University of...
30
Statistics and Machine Learning Fall, 2005 鮑鮑鮑 and 鮑鮑鮑 National Taiwan University of Science and Technology
-
date post
20-Dec-2015 -
Category
Documents
-
view
230 -
download
0
Transcript of Statistics and Machine Learning Fall, 2005 鮑興國 and 李育杰 National Taiwan University of...
Statistics and Machine LearningFall, 2005
鮑興國 and 李育杰
National Taiwan University ofScience and Technology

Software Packages & Datasets
• MLC++• Machine learning library in C++• http://www.sgi.com/tech/mlc/
• WEKA• http://www.cs.waikato.ac.nz/ml/weka/
• Stalib• Data, software and news from the statistics community• http://lib.stat.cmu.edu
• GALIB• MIT GALib in C++• http://lancet.mit.edu/ga
• Delve• Data for Evaluating Learning in Valid Experiments• http://www.cs.utoronto.ca/~delve
• UCI• Machine Learning Data Repository UC Irvine• http://www.ics.uci.edu/~mlearn/MLRepository.html
• UCI KDD Archive• http://kdd.ics.uci.edu/summary.data.application.html

Major conferences in ML
ICML (International Conference on Machine Learning)
ECML (European Conference on Machine Learning)
UAI (Uncertainty in Artificial Intelligence) NIPS (Neural Information Processing
Systems) COLT (Computational Learning Theory) IJCAI (International Joint Conference on
Artificial Intelligence) MLSS (Machine Learning Summer School)

Choosing a Hypothesis
Empirical Error: proportion of training instances where predictions of h do not match the training set
E(hjX ) =P
t=1
N1(h(xt) 6= yt)

Goal of Learning Algorithms
The early learning algorithms were designed to find such an accurate fit to the data.
The ability of a classifier to correctly classify data not in the training set is known as its generalization.
Bible code? 1994 Taipei Mayor election? Predict the real future NOT fitting the data in y
our hand or predict the desired results
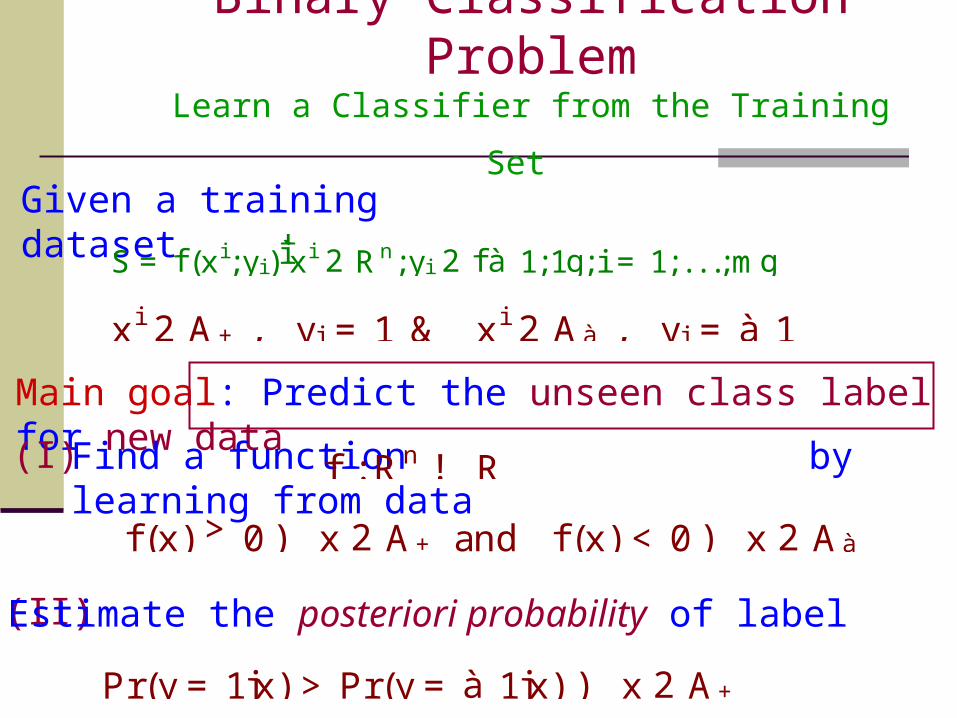
Binary Classification ProblemLearn a Classifier from the Training Set
Given a training dataset
Main goal: Predict the unseen class label for new data
xi 2 A+ , yi = 1 & xi 2 Aà , yi = à 1
S = f (xi;yi)ììxi 2 Rn;yi 2 f à 1;1g; i = 1; . . .;mg
Find a function by learning from data
f : Rn ! R
f (x) > 0) x 2 A+ and f (x) < 0) x 2 Aà
(I)
(II)Estimate the posteriori probability of label
Pr(y = 1jx) > Pr(y = à 1jx) ) x 2 A+

Binary Classification ProblemLinearly Separable Case
A-
A+
x0w+ b= à 1
wx0w+ b= + 1x0w+ b= 0
Malignant
Benign

Probably Approximately Correct Learningpac Model
Key assumption:
Training and testing data are generated i.i.d.according to a fixed but unknown distribution D
We call such measure risk functional and denote
D
it as Derr(h) =D
f (x;y) 2 X â f 1;à 1gj h(x)6=yg
Evaluate the “quality” of a hypothesis (classifier)h 2 H should take the unknown distribution
error” made by the )h 2 H
( i.e. “average error” or “expectedinto account
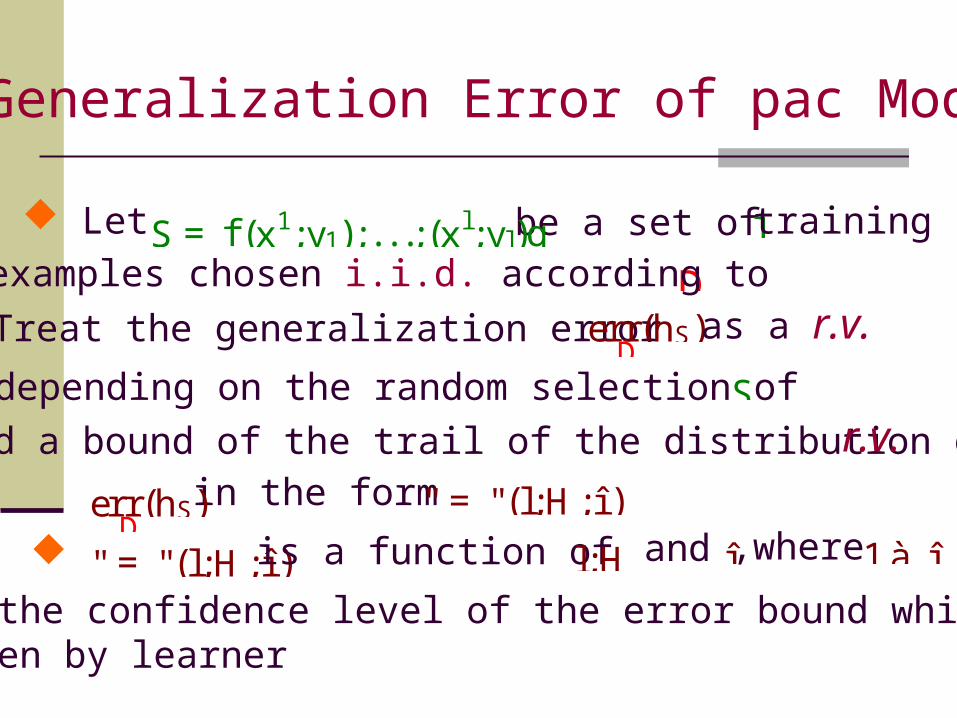
Generalization Error of pac Model
Let be a set ofS = f (x1;y1);. . .;(xl;yl)g l training
Dexamples chosen i.i.d. according to Treat the generalization error err(hS)
Das a r.v.
depending on the random selection of S Find a bound of the trail of the distribution of
in the formr.v.
err(hS)D
" = "(l;H;î )
" = "(l;H;î ) is a function ofl;H and î,where1à î
is the confidence level of the error bound which isgiven by learner
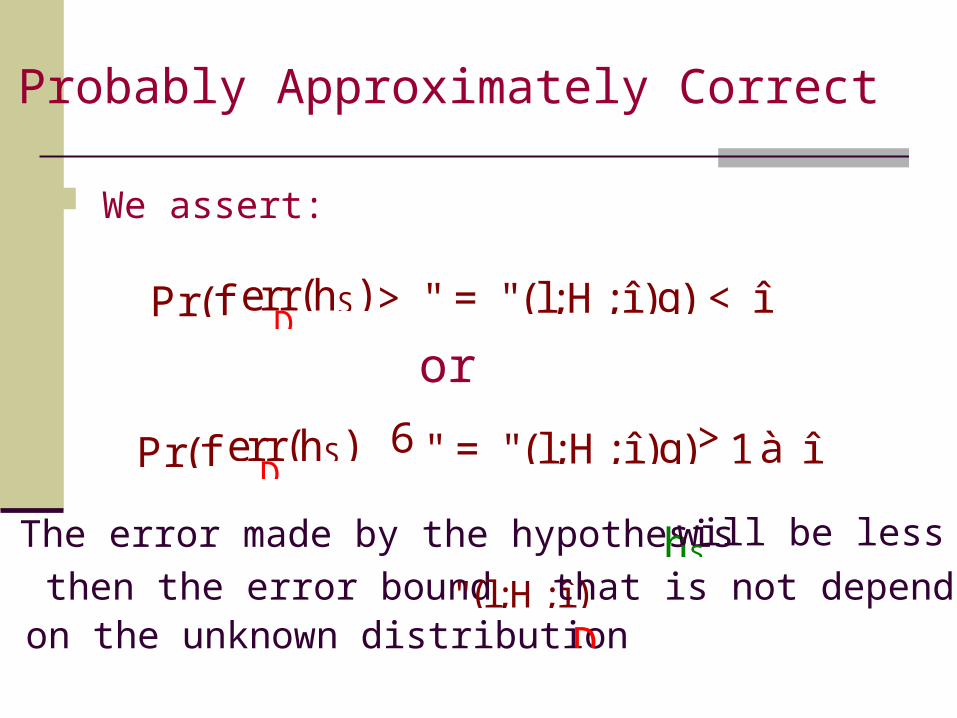
Probably Approximately Correct
We assert:
Pr(f err(hS)D
> " = "(l;H; î )g) < î
The error made by the hypothesisthen the error bound
hs will be less
"(l;H;î )that is not dependon the unknown distributionD
Pr(f err(hS)D
6" = "(l;H; î )g)>1à î
or
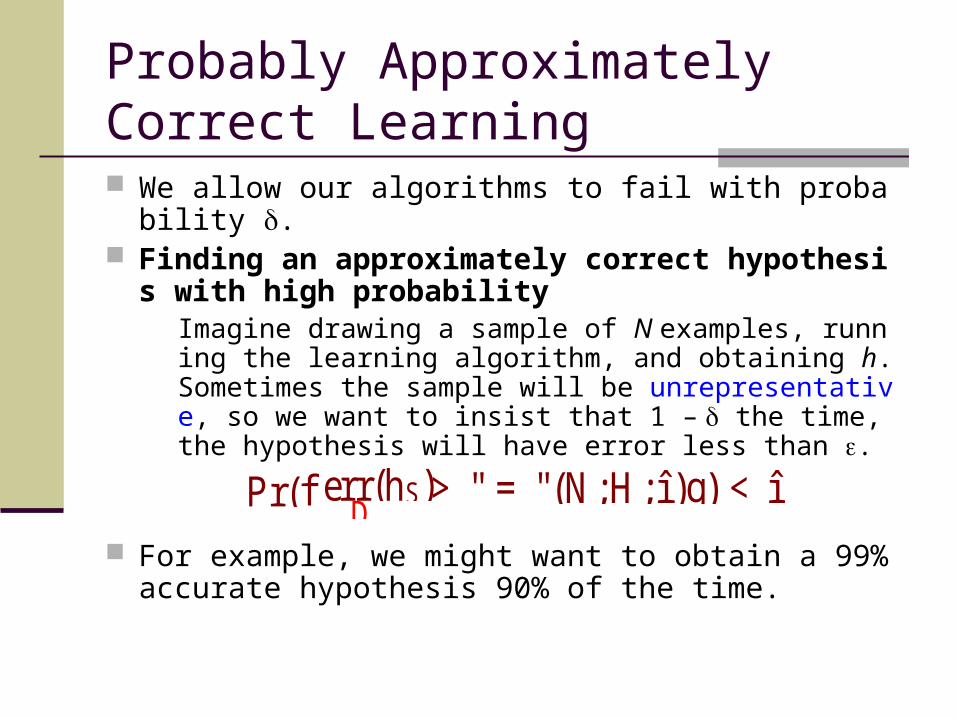
Probably Approximately Correct Learning We allow our algorithms to fail with probability . Finding an approximately correct hypothesis with
high probabilityImagine drawing a sample of N examples, running the learning algorithm, and obtaining h. Sometimes the sample will be unrepresentative, so we want to insist that 1 – the time, the hypothesis will have error less than .
For example, we might want to obtain a 99% accurate hypothesis 90% of the time.
Pr(f err(hS)D
> " = "(N;H;î )g) < î
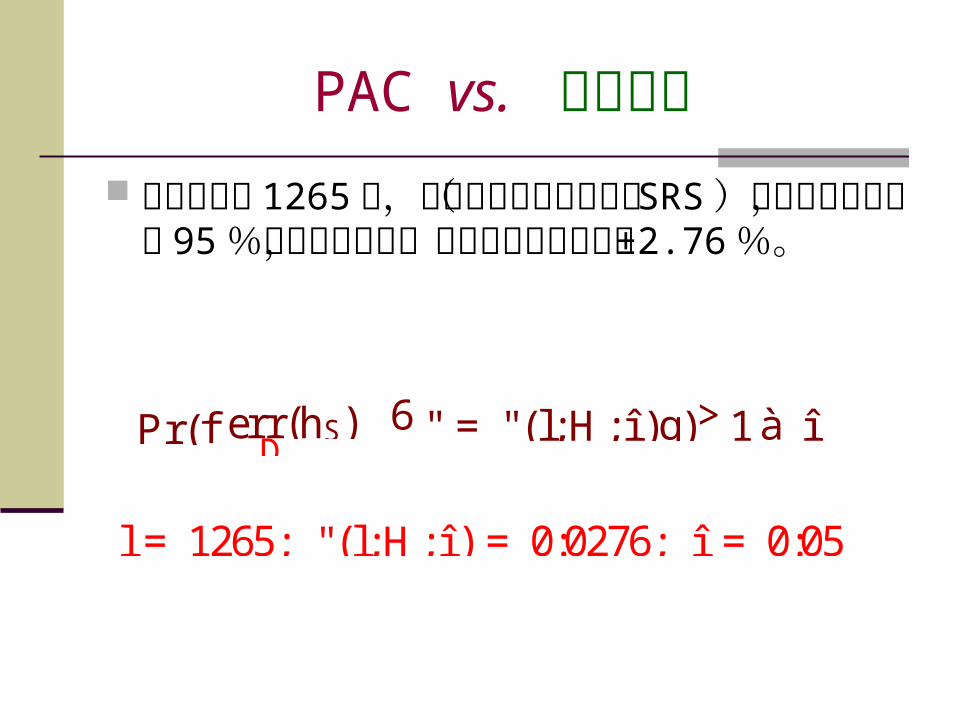
PAC vs. 民意調查 成功樣本為 1265 個,以單純隨機抽樣方式
( SRS )估計抽樣誤差,在 95 %的信心水準下,其最大誤差應不超過 ±2.76 %。
Pr(f err(hS)D
6" = "(l;H; î )g)>1à î
l = 1265; "(l;H; î ) = 0:0276; î = 0:05

Find the Hypothesis with MinimumExpected Risk?
LetS = f (x1;y1);. . .;(xl;yl)gò X â f à 1;1gthe training Dexamples chosen i.i.d. according towiththe probability densityp(x;y)
be
The expected misclassification error made byh 2 His
R[h] =8;
X â f à 1;1g21jh(x) à yjdp(x;y)
The ideal hypothesis hãoptshould has the smallest
expected riskR[hãopt]6 R[h]; 8h 2 H
Unrealistic !!!

Empirical Risk Minimization (ERM)
Find the hypothesishãempwith the smallest empirical
risk Remp[hãemp]6 Remp[h]; 8h 2 H
D p(x;y)and are not needed)(
Replace the expected risk over by an p(x;y)average over the training example
Remp[h] = l1 P
i=1
l
21 jh(xi) à yij The empirical risk:
Only focusing on empirical risk will cause overfitting

VC ConfidenceRemp[h] & R[h](The Bound between )
R[h]6Remp[h]+ lv(log(2l=v)+1)à log(î =4)
q
The following inequality will be held with probability1à î
C. J. C. Burges, A tutorial on support vector machines for pattern recognition,Data Mining and Knowledge Discovery 2 (2) (1998), p.121-167
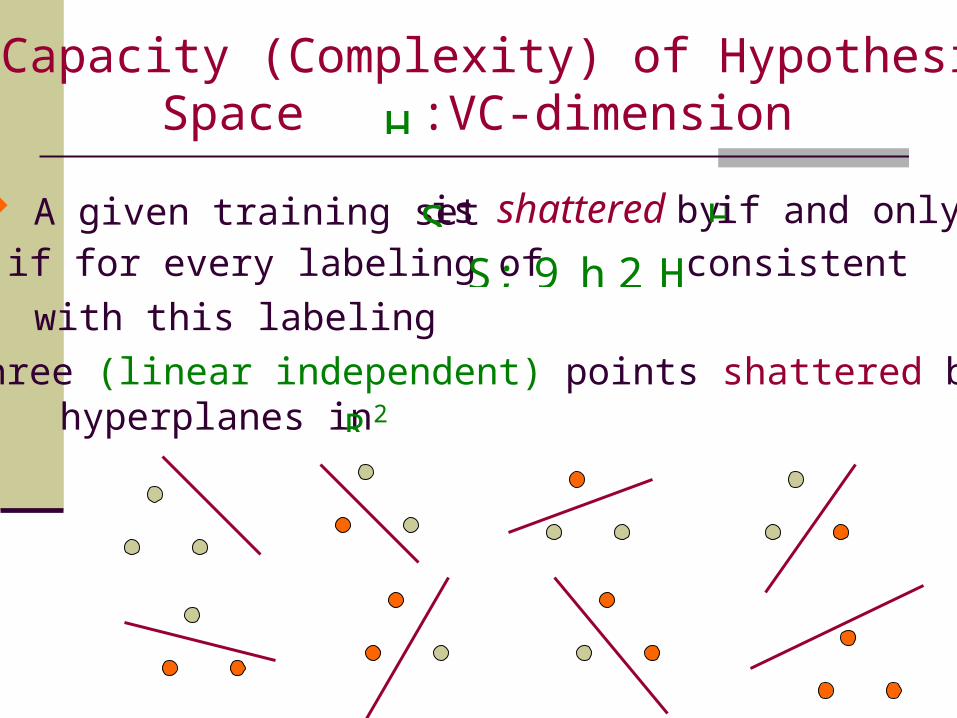
Capacity (Complexity) of Hypothesis Space :VC-dimension
H
A given training set is shattered byif for every labeling of
with this labeling
S H if and only
S; 9 h 2 H consistent
Three (linear independent) points shattered by ahyperplanes inR2

Shattering Points with Hyperplanesin Rn
Theorem: Consider some set of m points inRn. Choosea point as origin. Then the m points can be shattered
by oriented hyperplanes if and only if the positionvectors of the rest points are linearly independent.
Can you always shatter three points with a line inR2?

Definition of VC-dimension H(A Capacity Measure of Hypothesis Space )
The Vapnik-Chervonenkis dimension,VC(H), ofhypothesis spaceHdefined over the input spaceXis the size of the (existent) largest finite subset
Xshattered byH If arbitrary large finite set of Xcan be shattered
byH, then VC(H) ñ 1
of
Let H = fall hyperplanes in Rngthen
VC(H) = n + 1

Example I
x R, H = interval on line There exists two points that can be shattered No set of three points can be shattered VC(H) = 2
An example of three points (and a labeling) that cannot be shattered
+ – +
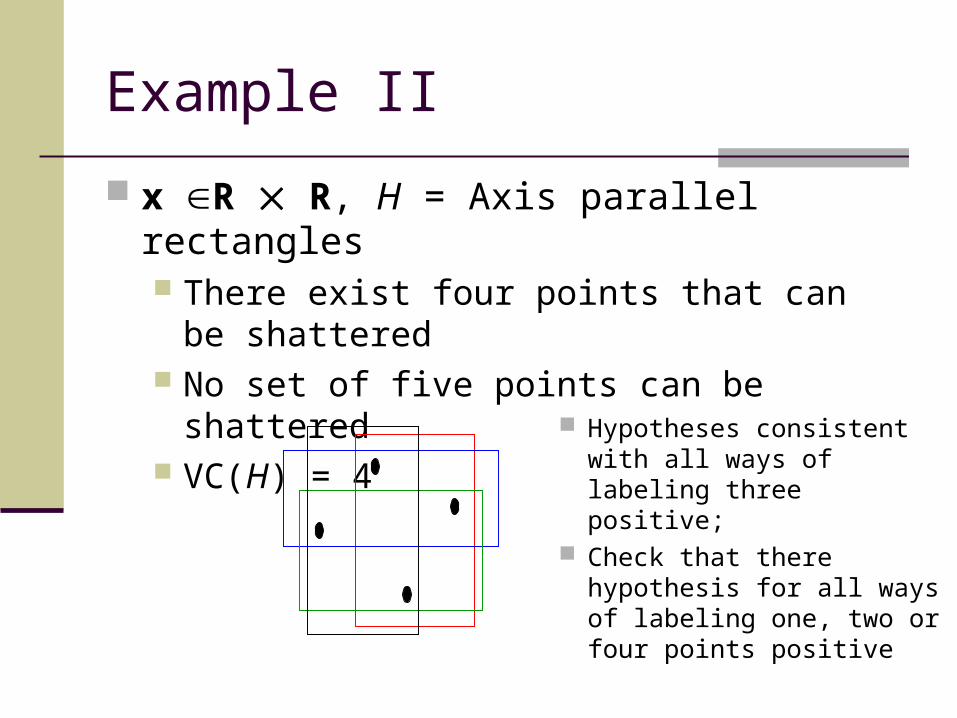
Example II
x R R, H = Axis parallel rectangles There exist four points that can be shattered No set of five points can be shattered VC(H) = 4
Hypotheses consistent with all ways of labeling three positive;
Check that there hypothesis for all ways of labeling one, two or four points positive
Comments
VC dimension is distribution-free; it is independent of the probability distribution from which the instances are drawn
In this sense, it gives us a worse case complexity (pessimistic) In real life, the world is smoothly changing, instances cl
ose by most of the time have the same labels, no worry about all possible labelings
However, this is still useful for providing bounds, such as the sample complexity of a hypothesis class.
In general, we will see that there is a connection between the VC dimension (which we would like to minimize) and the error on the training set (empirical risk)

Summary: Learning Theory
The complexity of a hypothesis space is measured by the VC-dimension
There is a tradeoff between , and N

Noise
Noise: unwanted anomaly in the data Another reason we can’t always have a
perfect hypothesis error in sensor readings for input teacher noise: error in labeling the data additional attributes which we have not taken
into account. These are called hidden or latent because they are unobserved.

When there is noise…
There may not have a simple boundary between the positive and negative instances
Zero (training) misclassification error may not be possible

Something about Simple Models
Easier to classify a new instance Easier to explain Fewer parameters, means it is easier to train. The sa
mple complexity is lower. Lower variance. A small change in the training sampl
es will not result in a wildly different hypothesis High bias. A simple model makes strong assumptions
about the domain; great if we’re right, a disaster if we are wrong.optimality?: min (variance + bias)
May have better generalization performance, especially if there is noise.
Occam’s razor: simpler explanations are more plausible

Model Selection
Learning problem is ill-posed Need inductive bias
assuming a hypothesis class example: sports car problem, assuming most specific r
ectangle but different hypothesis classes will have different capa
cities higher capacity, better able to fit the data but goal is not to fit the data, it’s to generalize
how do we measure? cross-validation: Split data into training and validation set; use training set to find hypothesis and validation set to test generalization. With enough data, the hypothesis that is most accurate on validation set is the best.
choosing the right bias: model selection

Underfitting and Overfitting
Matching the complexity of the hypothesis with the complexity of the target function if the hypothesis is less complex than the funct
ion, we have underfitting. In this case, if we increase the complexity of the model, we will reduce both training error and validation error.
if the hypothesis is too complex, we may have overfitting. In this case, the validation error may go up even the training error goes down. For example, we fit the noise, rather than the target function.

Tradeoffs
(Dietterich 2003) complexity/capacity of the hypothesis amount of training data generalization error on new examples

Take Home Remarks
What is the hardest part of machine learning? selecting attributes (representation) deciding the hypothesis (assumption) space:
big one or small one, that’s the question! Training is relatively easy
DT, NN, SVM, (KNN), … The usual way of learning in real life not supervised, not unsupervised, but semi-
supervised, even with some taste of reinforcement learning

Take Home Remarks
Learning == Search in Hypothesis Space Inductive Learning Hypothesis: Generalization is
possible. If a machine performs well on most training data AND
it is not too complex, it will probably do well on similar test data.
Amazing fact: in many cases this can actually be proven. In other words, if our hypothesis space is not too complicated/flexible (has a low capacity in some formal sense), and if our training set is large enough then we can bound the probability of performing much worse on test data than on training data.
The above statement is carefully formalized in 40 years of research in the area of learning theory.


![Weak Lensing and Dark Energy Cosmology Tong-Jie Zhang[ 张同杰 ] Department of Astronomy, Beijing Normal University Cosmology Workshop Institute of High Energy.](https://static.fdocument.pub/doc/165x107/56649f575503460f94c7c2d3/weak-lensing-and-dark-energy-cosmology-tong-jie-zhang-department.jpg)