Multi-scale methodology to assess wind loads on building ...
10
8 th International Colloquium on Bluff Body Aerodynamics and Applications Northeastern University, Boston, Massachusetts, USA June 7 - 11, 2016 BBAA VIII Multi-scale methodology to assess wind loads on building louvers D. Rocchi a , T. Argentini a , A. Allsop b , L. Amerio a , L. Bernini a , S. Racco a a Politecnico di Milano, Milan, Italy, [email protected] a Politecnico di Milano, Milan, Italy, [email protected] a Politecnico di Milano, Milan, Italy, [email protected] a Politecnico di Milano, Milan, Italy, [email protected] a Politecnico di Milano, Milan, Italy, [email protected] b ARUP, London, United Kingdom, [email protected] SUMMARY: The work presents a multi-scale wind tunnel test methodology to assess wind loads on façade louvers, an architectural sun- shielding component more and more frequently adopted on modern buildings. The methodology consists in performing three different wind tunnel tests using models with decreasing scale factor. A small scale model (1:70) is initially used to reproduce the effects induced by the whole building geometry, the ABL and the surrounding. A 1:4 model of a building corner, that is designed according to boundary conditions obtained from 1:70 results, is used to assess the dependency of the loads on the louver’s shape, the local flow characteristics and on the porosity of the supporting frame. Two sectional models (1:4, 1:1) of a single louver are then designed to study the Reynolds dependency and to scale the loads to the full scale. The methodology, that was tested on a real building case study, proved to be able to investigate static and dynamic loading conditions, and to provide the necessary information to the building designer for a cost effective dimensioning of the supporting system. Keywords: multi-scale approach, wind tunnel test, louvers; wind loads 1. INTRODUCTION Nowadays louvers (or brise-soleil) are becoming a distinctive element of the new era of sustainable high- rise buildings since they combine simultaneously technical aspects like sun shielding, natural ventilation and noise reduction around corners with aesthetic aspects exploited by architects. The C&D International Tower (Xiamen, 2013), the Baltyk Tower (Poznań, 2014), and the 20 Fenchurch Street - Walkie Talkie (London, 2014) are examples of this trend. Wind loads on louvers should accurately be assessed, since the dimensioning of both louvers and supporting structures may significantly influence the cost of the project. On the one hand, a uniform dimensioning, based on the most critical load, may lead to a large over dimensioning and cost drawbacks. On the other hand, a non-uniform dimensioning is only feasible if the wind loads on the louvers on the building façade are well known. Several factors influence the wind loads on louvers: globally, the boundary layer characteristics, the geometry of the building, and the presence of surrounding buildings; locally, the façade characteristics (dimensions, sharp or smooth edges, presence of walkways, etc.), and the shape and pattern of the louvers themselves (that may generate wake or shielding effects). Each one of these aspects may be critical and has to be accounted for by wind tunnel tests to define the wind loads. Since different scales are involved, a wind tunnel multi-scale methodology is required to achieve this task. In fact, wind tunnel tests on small-scale models (the one usually adopted in building aerodynamics) can simulate global effects, but are critical in the reproduction of the pressure distributions around the louvers, in hosting the instrumentation on/in the louvers and in the large uncertainty and low reliability
Transcript of Multi-scale methodology to assess wind loads on building ...
8th International Colloquium on Bluff Body Aerodynamics and Applications Northeastern University, Boston, Massachusetts, USA
June 7 - 11, 2016
BBAA VIII
Multi-scale methodology to assess wind loads on building louvers
D. Rocchia, T. Argentinia, A. Allsopb, L. Amerioa, L. Berninia, S. Raccoa
aPolitecnico di Milano, Milan, Italy, [email protected] aPolitecnico di Milano, Milan, Italy, [email protected]
aPolitecnico di Milano, Milan, Italy, [email protected] aPolitecnico di Milano, Milan, Italy, [email protected]
aPolitecnico di Milano, Milan, Italy, [email protected] bARUP, London, United Kingdom, [email protected]
SUMMARY:
The work presents a multi-scale wind tunnel test methodology to assess wind loads on façade louvers, an architectural sun-
shielding component more and more frequently adopted on modern buildings. The methodology consists in performing three
different wind tunnel tests using models with decreasing scale factor. A small scale model (1:70) is initially used to reproduce
the effects induced by the whole building geometry, the ABL and the surrounding. A 1:4 model of a building corner, that is
designed according to boundary conditions obtained from 1:70 results, is used to assess the dependency of the loads on the
louver’s shape, the local flow characteristics and on the porosity of the supporting frame. Two sectional models (1:4, 1:1) of
a single louver are then designed to study the Reynolds dependency and to scale the loads to the full scale. The methodology,
that was tested on a real building case study, proved to be able to investigate static and dynamic loading conditions, and to
provide the necessary information to the building designer for a cost effective dimensioning of the supporting system.
Keywords: multi-scale approach, wind tunnel test, louvers; wind loads
1. INTRODUCTION
Nowadays louvers (or brise-soleil) are becoming a distinctive element of the new era of sustainable high-
rise buildings since they combine simultaneously technical aspects like sun shielding, natural ventilation
and noise reduction around corners with aesthetic aspects exploited by architects. The C&D International
Tower (Xiamen, 2013), the Baltyk Tower (Poznań, 2014), and the 20 Fenchurch Street - Walkie Talkie
(London, 2014) are examples of this trend. Wind loads on louvers should accurately be assessed, since
the dimensioning of both louvers and supporting structures may significantly influence the cost of the
project. On the one hand, a uniform dimensioning, based on the most critical load, may lead to a large
over dimensioning and cost drawbacks. On the other hand, a non-uniform dimensioning is only feasible
if the wind loads on the louvers on the building façade are well known.
Several factors influence the wind loads on louvers: globally, the boundary layer characteristics, the
geometry of the building, and the presence of surrounding buildings; locally, the façade characteristics
(dimensions, sharp or smooth edges, presence of walkways, etc.), and the shape and pattern of the louvers
themselves (that may generate wake or shielding effects). Each one of these aspects may be critical and
has to be accounted for by wind tunnel tests to define the wind loads.
Since different scales are involved, a wind tunnel multi-scale methodology is required to achieve this
task. In fact, wind tunnel tests on small-scale models (the one usually adopted in building aerodynamics)
can simulate global effects, but are critical in the reproduction of the pressure distributions around the
louvers, in hosting the instrumentation on/in the louvers and in the large uncertainty and low reliability
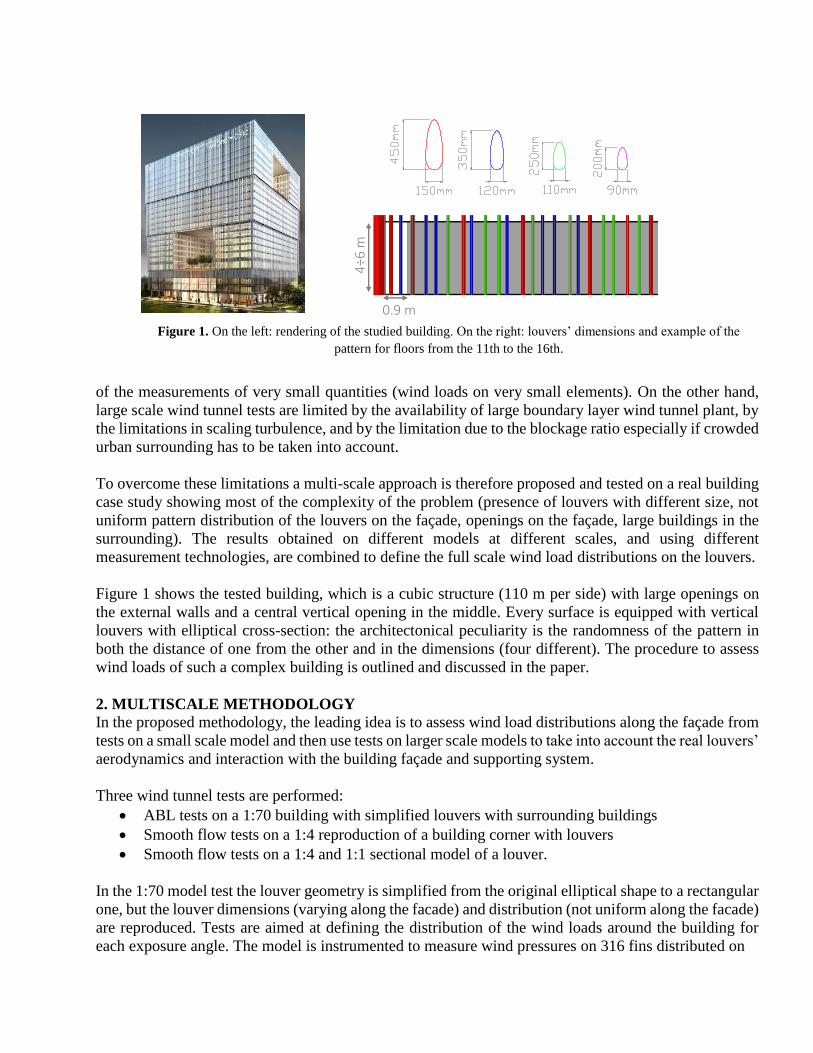
Figure 1. On the left: rendering of the studied building. On the right: louvers’ dimensions and example of the
pattern for floors from the 11th to the 16th.
of the measurements of very small quantities (wind loads on very small elements). On the other hand,
large scale wind tunnel tests are limited by the availability of large boundary layer wind tunnel plant, by
the limitations in scaling turbulence, and by the limitation due to the blockage ratio especially if crowded
urban surrounding has to be taken into account.
To overcome these limitations a multi-scale approach is therefore proposed and tested on a real building
case study showing most of the complexity of the problem (presence of louvers with different size, not
uniform pattern distribution of the louvers on the façade, openings on the façade, large buildings in the
surrounding). The results obtained on different models at different scales, and using different
measurement technologies, are combined to define the full scale wind load distributions on the louvers.
Figure 1 shows the tested building, which is a cubic structure (110 m per side) with large openings on
the external walls and a central vertical opening in the middle. Every surface is equipped with vertical
louvers with elliptical cross-section: the architectonical peculiarity is the randomness of the pattern in
both the distance of one from the other and in the dimensions (four different). The procedure to assess
wind loads of such a complex building is outlined and discussed in the paper.
2. MULTISCALE METHODOLOGY
In the proposed methodology, the leading idea is to assess wind load distributions along the façade from
tests on a small scale model and then use tests on larger scale models to take into account the real louvers’
aerodynamics and interaction with the building façade and supporting system.
Three wind tunnel tests are performed:
ABL tests on a 1:70 building with simplified louvers with surrounding buildings
Smooth flow tests on a 1:4 reproduction of a building corner with louvers
Smooth flow tests on a 1:4 and 1:1 sectional model of a louver.
In the 1:70 model test the louver geometry is simplified from the original elliptical shape to a rectangular
one, but the louver dimensions (varying along the facade) and distribution (not uniform along the facade)
are reproduced. Tests are aimed at defining the distribution of the wind loads around the building for
each exposure angle. The model is instrumented to measure wind pressures on 316 fins distributed on
4÷6
m
0.9 m

Figure 2. Pictures and measures of the three models (1:70, 1:4, 1:1) in the wind tunnel section
the entire building and to measure also the pressure distribution on the building external façade (195
pressure taps). Additionally, the louvers’ wind loads are measured using the FBGS (Fibre Bragg Grating
Sensors) glued on 46 steel fins assembled in a cantilever configuration with a span of two floors (see
pictures in Figure 3). And so, two different types of measurement on the louvers are used:
Punctual measurements of the net pressure on the louvers (pressure taps on each side).
Global measurements of the wind loads on the louvers (Fiber Bragg Grating Sensors, FBGS).
Results of both kinds of measurements will be compared in terms of equivalent net pressures coefficient
(Cp), to investigate their capability to study static and dynamic loads.
The 1:4 model consists of a reproduction of a building corner with louvers and supporting system, in a
region where the flow around the corner shows a 2D behavior and the louvers are critically loaded.
The model is initially equipped with rectangular louvers to match the 1:70 results, and then it is tested
with louvers having the real elliptical shape to include the shape factor in the wind load estimation and
to study the domino effect in case of collapse of a single louver. Thanks to the greater dimension of the
louvers it is possible to refine the measure using multiple pressure taps (a ring of 16 pressure taps) as
well as 6 component force balances at the extremities. Results are used to extend the 1:70 results
including the local flow effects and the real louver geometry. Since the 1:4 corner model is a partial
reproduction of the 1:70 model, wind tunnel tests are designed and performed according to a fluid-
dynamic similarity between 1:70 and 1:4 flow conditions.
Figure 3. Pictures showing the louvers with the pressure taps (left) and FBGS (right) in the 1:70 model scale.
6.4 mm
40
÷ 6
0 m
m
12
0 m
m
1:70 1:4 1:1
FBGS
Finally, a sectional model of a real shape louver in 1:4 scale was tested to study its aerodynamic force
coefficients and pressure distributions in stand-alone configuration. The real louver roughness obtained
with strips on the louvers’ surface was reproduced in 1:4 scale and tests were performed in a range of
Reynolds numbers from 1.18 104 to 2.95 104 (Re are computed using the louver chord as dimension).
Tests were repeated on a 1:1 sectional model of the real louver, instrumented with a ring of 32 pressure
taps and a force balance, to consider the real aerodynamics and Reynolds effects up to Re=1.18 105.
3. EXPERIMENTAL RESULTS
3.1. Results of 1:70 model
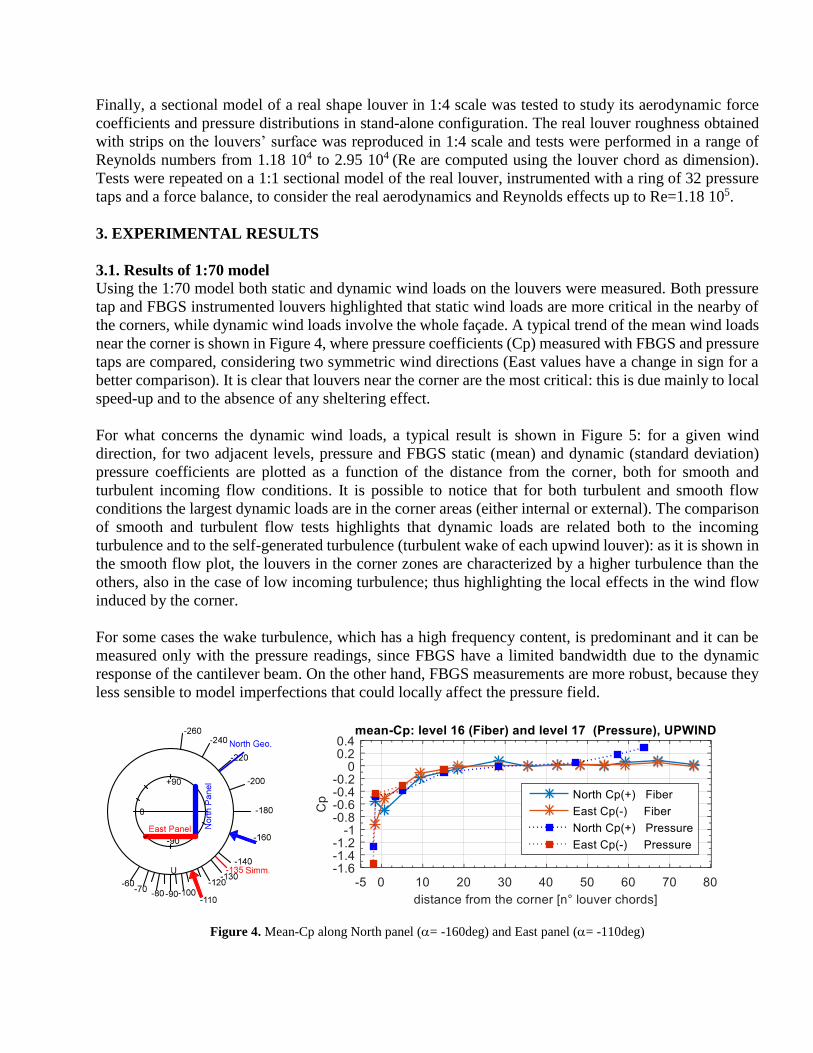
Using the 1:70 model both static and dynamic wind loads on the louvers were measured. Both pressure
tap and FBGS instrumented louvers highlighted that static wind loads are more critical in the nearby of
the corners, while dynamic wind loads involve the whole façade. A typical trend of the mean wind loads
near the corner is shown in Figure 4, where pressure coefficients (Cp) measured with FBGS and pressure
taps are compared, considering two symmetric wind directions (East values have a change in sign for a
better comparison). It is clear that louvers near the corner are the most critical: this is due mainly to local
speed-up and to the absence of any sheltering effect.
For what concerns the dynamic wind loads, a typical result is shown in Figure 5: for a given wind
direction, for two adjacent levels, pressure and FBGS static (mean) and dynamic (standard deviation)
pressure coefficients are plotted as a function of the distance from the corner, both for smooth and
turbulent incoming flow conditions. It is possible to notice that for both turbulent and smooth flow
conditions the largest dynamic loads are in the corner areas (either internal or external). The comparison
of smooth and turbulent flow tests highlights that dynamic loads are related both to the incoming
turbulence and to the self-generated turbulence (turbulent wake of each upwind louver): as it is shown in
the smooth flow plot, the louvers in the corner zones are characterized by a higher turbulence than the
others, also in the case of low incoming turbulence; thus highlighting the local effects in the wind flow
induced by the corner.
For some cases the wake turbulence, which has a high frequency content, is predominant and it can be
measured only with the pressure readings, since FBGS have a limited bandwidth due to the dynamic
response of the cantilever beam. On the other hand, FBGS measurements are more robust, because they
less sensible to model imperfections that could locally affect the pressure field.
Figure 4. Mean-Cp along North panel (= -160deg) and East panel (= -110deg)
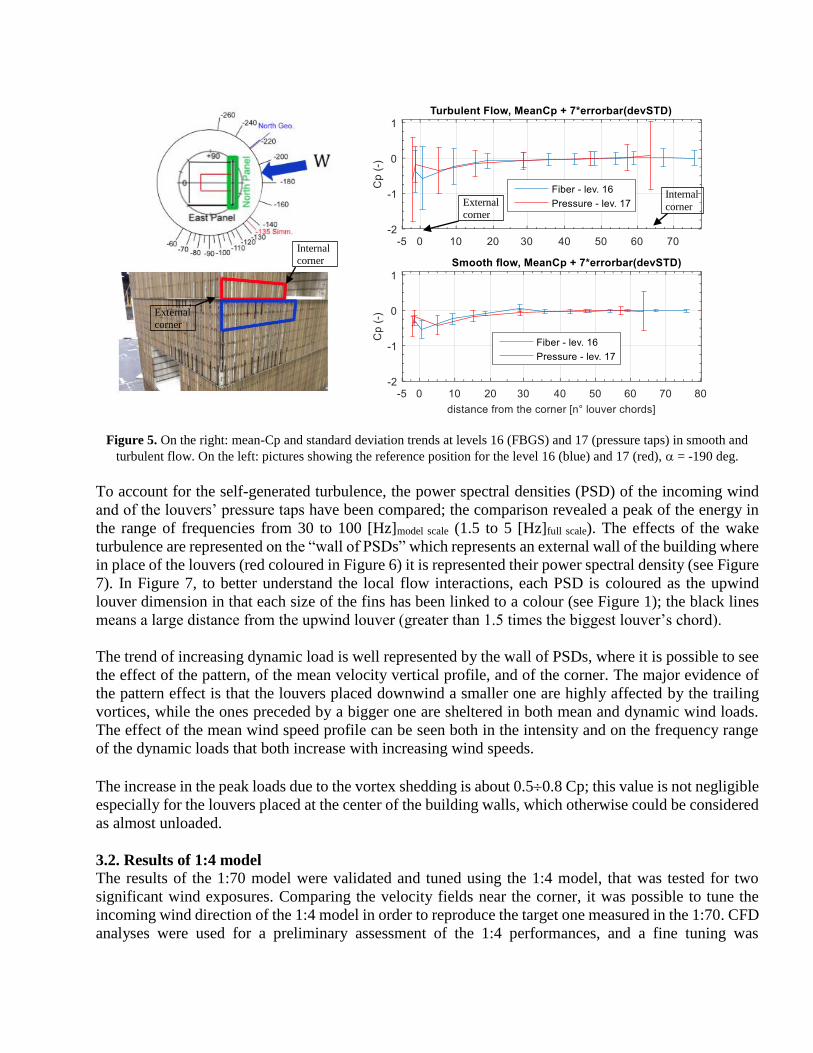
Figure 5. On the right: mean-Cp and standard deviation trends at levels 16 (FBGS) and 17 (pressure taps) in smooth and
turbulent flow. On the left: pictures showing the reference position for the level 16 (blue) and 17 (red), = -190 deg.
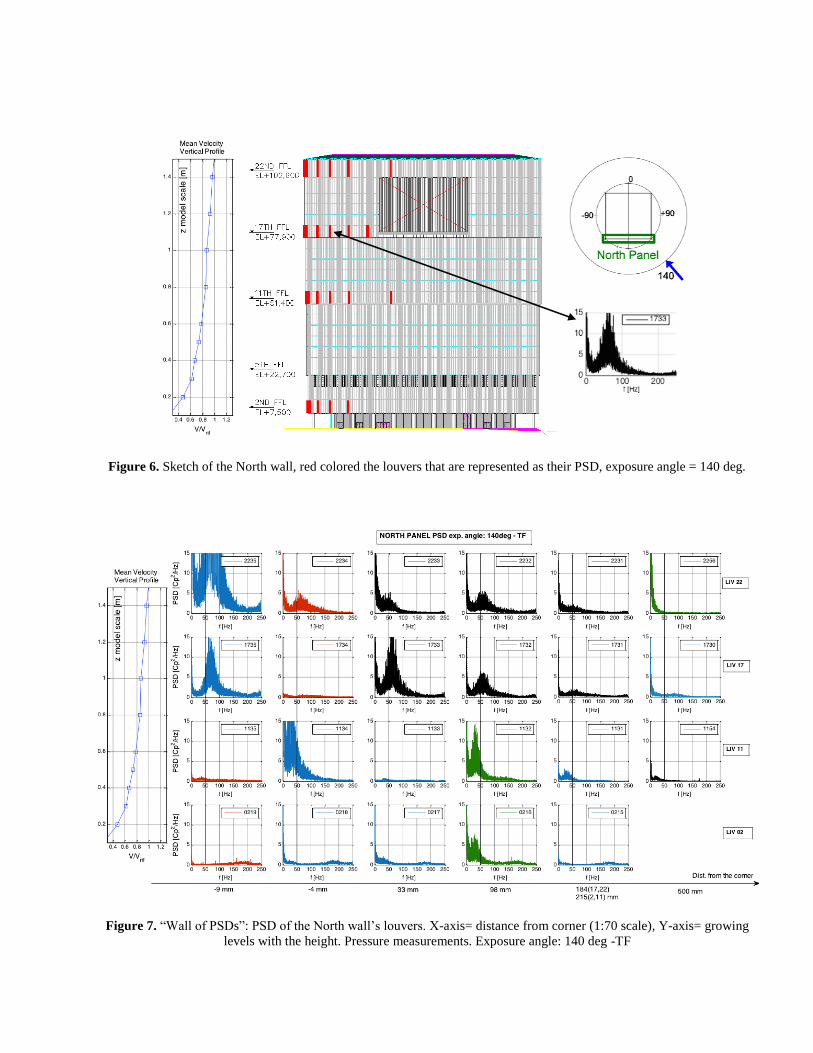
To account for the self-generated turbulence, the power spectral densities (PSD) of the incoming wind
and of the louvers’ pressure taps have been compared; the comparison revealed a peak of the energy in
the range of frequencies from 30 to 100 [Hz]model scale (1.5 to 5 [Hz]full scale). The effects of the wake
turbulence are represented on the “wall of PSDs” which represents an external wall of the building where
in place of the louvers (red coloured in Figure 6) it is represented their power spectral density (see Figure
7). In Figure 7, to better understand the local flow interactions, each PSD is coloured as the upwind
louver dimension in that each size of the fins has been linked to a colour (see Figure 1); the black lines
means a large distance from the upwind louver (greater than 1.5 times the biggest louver’s chord).
The trend of increasing dynamic load is well represented by the wall of PSDs, where it is possible to see
the effect of the pattern, of the mean velocity vertical profile, and of the corner. The major evidence of
the pattern effect is that the louvers placed downwind a smaller one are highly affected by the trailing
vortices, while the ones preceded by a bigger one are sheltered in both mean and dynamic wind loads.
The effect of the mean wind speed profile can be seen both in the intensity and on the frequency range
of the dynamic loads that both increase with increasing wind speeds.
The increase in the peak loads due to the vortex shedding is about 0.50.8 Cp; this value is not negligible
especially for the louvers placed at the center of the building walls, which otherwise could be considered
as almost unloaded.
3.2. Results of 1:4 model
The results of the 1:70 model were validated and tuned using the 1:4 model, that was tested for two
significant wind exposures. Comparing the velocity fields near the corner, it was possible to tune the
incoming wind direction of the 1:4 model in order to reproduce the target one measured in the 1:70. CFD
analyses were used for a preliminary assessment of the 1:4 performances, and a fine tuning was
External
corner
Internal
corner
Internal
corner External
corner
performed
Figure 6. Sketch of the North wall, red colored the louvers that are represented as their PSD, exposure angle = 140 deg.
Figure 7. “Wall of PSDs”: PSD of the North wall’s louvers. X-axis= distance from corner (1:70 scale), Y-axis= growing
levels with the height. Pressure measurements. Exposure angle: 140 deg -TF
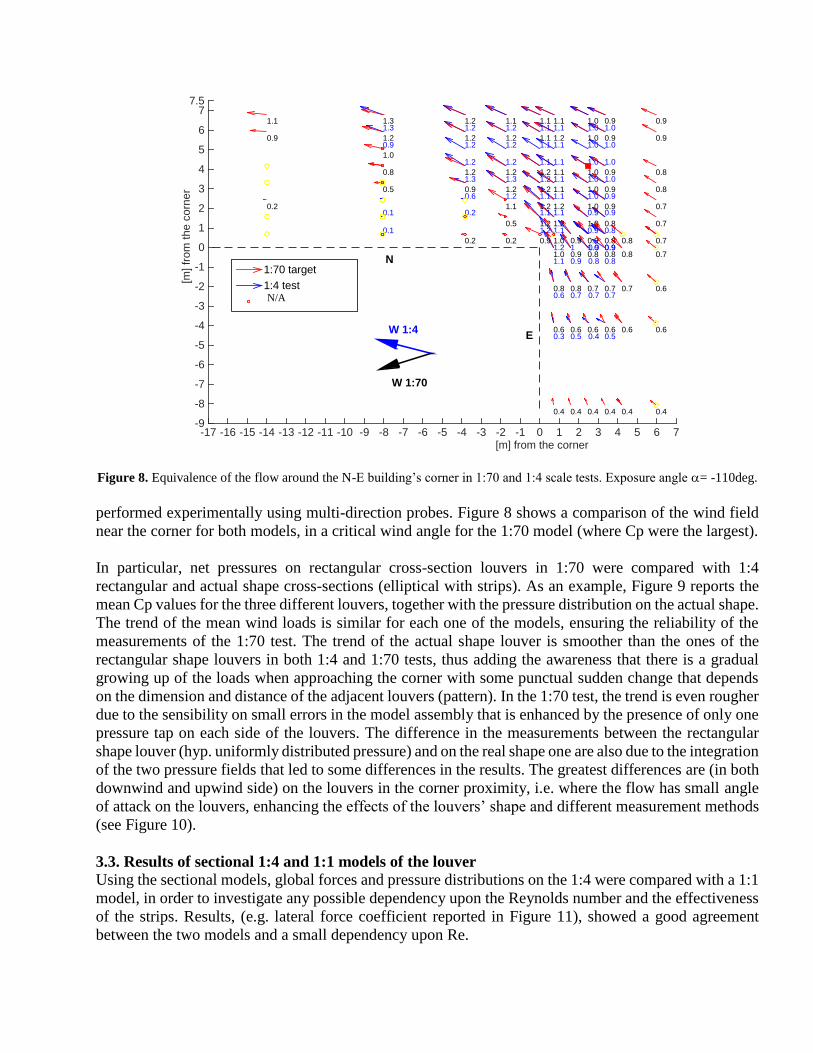
Figure 8. Equivalence of the flow around the N-E building’s corner in 1:70 and 1:4 scale tests. Exposure angle = -110deg.
performed experimentally using multi-direction probes. Figure 8 shows a comparison of the wind field
near the corner for both models, in a critical wind angle for the 1:70 model (where Cp were the largest).
In particular, net pressures on rectangular cross-section louvers in 1:70 were compared with 1:4
rectangular and actual shape cross-sections (elliptical with strips). As an example, Figure 9 reports the
mean Cp values for the three different louvers, together with the pressure distribution on the actual shape.
The trend of the mean wind loads is similar for each one of the models, ensuring the reliability of the
measurements of the 1:70 test. The trend of the actual shape louver is smoother than the ones of the
rectangular shape louvers in both 1:4 and 1:70 tests, thus adding the awareness that there is a gradual
growing up of the loads when approaching the corner with some punctual sudden change that depends
on the dimension and distance of the adjacent louvers (pattern). In the 1:70 test, the trend is even rougher
due to the sensibility on small errors in the model assembly that is enhanced by the presence of only one
pressure tap on each side of the louvers. The difference in the measurements between the rectangular
shape louver (hyp. uniformly distributed pressure) and on the real shape one are also due to the integration
of the two pressure fields that led to some differences in the results. The greatest differences are (in both
downwind and upwind side) on the louvers in the corner proximity, i.e. where the flow has small angle
of attack on the louvers, enhancing the effects of the louvers’ shape and different measurement methods
(see Figure 10).
3.3. Results of sectional 1:4 and 1:1 models of the louver
Using the sectional models, global forces and pressure distributions on the 1:4 were compared with a 1:1
model, in order to investigate any possible dependency upon the Reynolds number and the effectiveness
of the strips. Results, (e.g. lateral force coefficient reported in Figure 11), showed a good agreement
between the two models and a small dependency upon Re.
[m] from the corner-17 -16 -15 -14 -13 -12 -11 -10 -9 -8 -7 -6 -5 -4 -3 -2 -1 0 1 2 3 4 5 6 7
[m]
from
the
co
rne
r
-9
-8
-7
-6
-5
-4
-3
-2
-1
0
1
2
3
4
5
6
77.5
0.4
0.6
0.6
0.7
0.9
0.8
0.9
0.7
0.7
0.7
0.8
0.8
0.6
0.8
0.4
0.7
0.4
0.6
0.7
0.8
0.9
0.8
0.9
0.8
0.9
0.9
0.9
0.9
0.9
0.8
0.9
1.0
1.0
1.0
1.0
0.5
0.7
0.8
0.9
0.4
0.7
0.8
0.9
1.0
1.0
1.0
1.0
1.0
0.4
0.8
1.0
1.0
1.0
1.0
1.0
0.9
0.9
1.0
0.6
0.9
1.0
0.7
0.4
0.9
0.5
0.70.8
0.6
0.9
0.91
1.1
1.1
1.2
0.4
1.0
1.1
1.1
1.2
1.1
1.1
1.1
1.21.0
1.2
1.1
1.1
1.1
1,1
0.6
0.8
0.3
0.6
1.2
1.2
1.1
0.9
1.2
1.1
1.11.2
1.1
1.2
1.2
1.1
1.1
1.1
1.2
1.1
0.2
1.2
0.5
1.1
1.2
1.2
1.3
1.2
1.2
1.21.2
0.6
0.2
0.9
1.2
1.2
0.2
1.2
1.2
1.2
1.3
1.3
0.8
0.1
0.1
1.0
0.5
0.9
1.3
1.2
0.2
0.9
1.1
1:70 target
1:4 test
failed acquisitions
W 1:70
N
EW 1:4
N/A
corner
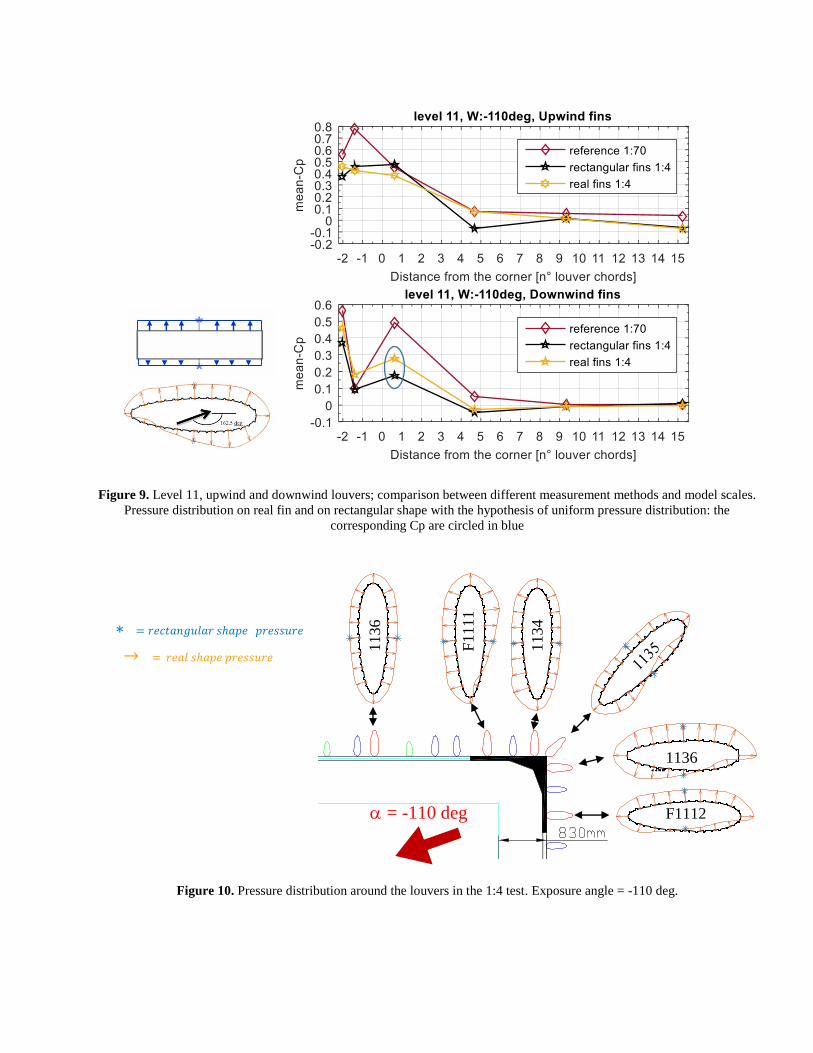
Figure 9. Level 11, upwind and downwind louvers; comparison between different measurement methods and model scales.
Pressure distribution on real fin and on rectangular shape with the hypothesis of uniform pressure distribution: the
corresponding Cp are circled in blue
Figure 10. Pressure distribution around the louvers in the 1:4 test. Exposure angle = -110 deg.
∗ = 𝑟𝑒𝑐𝑡𝑎𝑛𝑔𝑢𝑙𝑎𝑟 𝑠ℎ𝑎𝑝𝑒 𝑝𝑟𝑒𝑠𝑠𝑢𝑟𝑒
→ = 𝑟𝑒𝑎𝑙 𝑠ℎ𝑎𝑝𝑒 𝑝𝑟𝑒𝑠𝑠𝑢𝑟𝑒
34
42
34
42
33
F1112
1136
35
1134
F1111
1136
= -110 deg

Figure 11. Force coefficients in the direction perpendicular to the louver chord, assessed with the sectional tests on the 1:4
and 1:1 louvers at different Reynolds numbers as a function of the angle of attack.
The comparison between the sectional test on the 1:4 louvers and the pressure distribution of the louvers
placed on the corner of the building made possible to assess the angle of attack on each louver (e.g. those
in Figure 10). It results that the first louvers from the corner (the corner louver plus two in each direction)
have angles of attack that are often smaller than 40 deg, thus for those louvers it is not recommended to
apply the loads reduction factor that comes from the 1:1 and 1:4 tests, since in Figure 11 it is shown that,
in the range 50 deg < 𝛼 < 130 deg, the force coefficient CFy is lower in the full scale louver than in the
1:4 scale ones (CFy,1:1 ≈ 0.84 CFy,1:4). Instead, for the more distant louvers it is possible to apply a load
reduction factor when scaling the results to the full scale.
3.4. Final remarks
Collecting the results of the three tests it has been possible to properly compute the design values; as
aforesaid the distribution of the loads assessed on the 1:70 model has been recognized to be of a suitable
accuracy. Both the envelopes of the mean and peak values suggest the corner areas as the most loaded,
but the increases in the peak loads coming from the incoming wind’s turbulence and the self-generated
one fixed a lower limit of 1.5 Cp in the design values. In Figure 12 it is shown that taking into account
only the mean values it would have been neglected all the dynamic loads that affect the center of the
facades or the internal openings, inducing bad computations of the wind loads.
That distribution has been then refined by the 1:4 test’s results, removing the sudden changes that were
amenable to the local flow discrepancies of a such small scale test and confirming the gradual increase
in the corner area. The 1:4 test made also possible to study the effect of the collapse of a single louver
near the corner; it results that removing one louver the nearest one would become less sheltered, thus
affected by a great wind loads increase. Thus, it is recommended to use the same design values for the
corner louver and the adjacent ones to avoid any possible domino effect (see Figure 13). The wind loads
on the louvers (except from the first three at each corner) have been then reduced taking into account the
comparison of the sectional models.
6. CONCLUSIONS
A multi-scale methodology for the assessment of distributed wind loads was applied with success on a
complex building with a random pattern of louvers. Using three different models at three different
geometrical scales, several local and global factors relevant for an accurate estimate of wind loads were
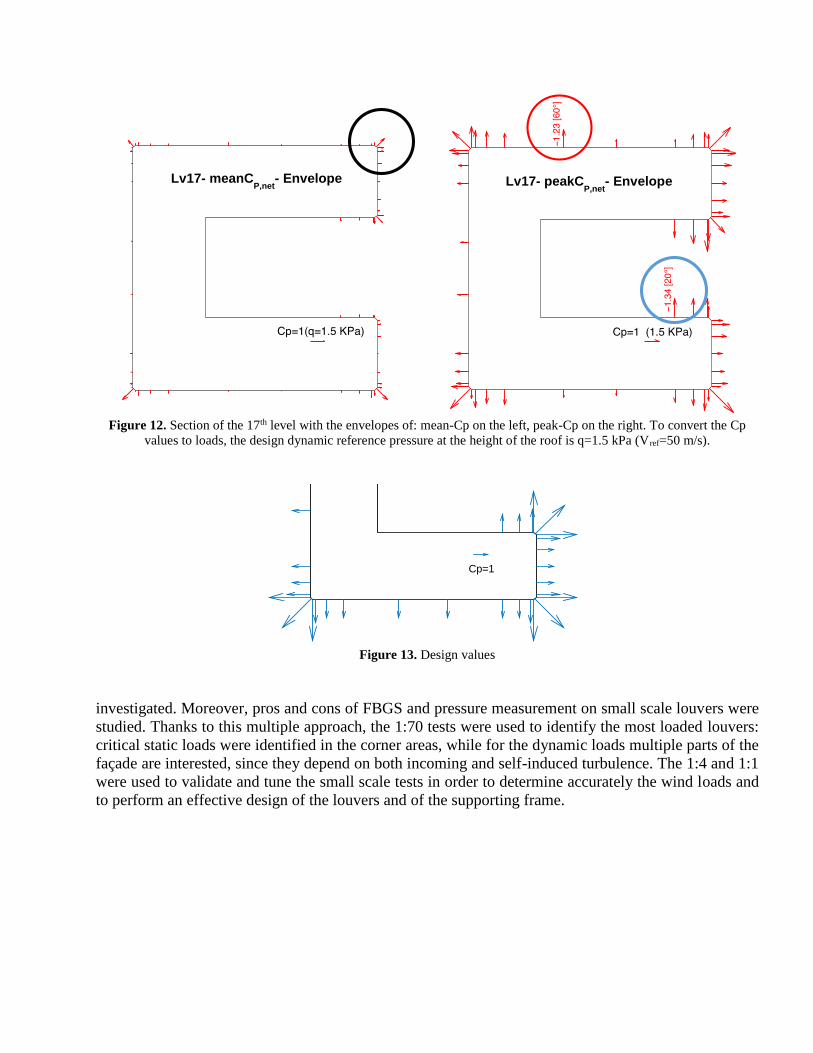
Figure 12. Section of the 17th level with the envelopes of: mean-Cp on the left, peak-Cp on the right. To convert the Cp
values to loads, the design dynamic reference pressure at the height of the roof is q=1.5 kPa (Vref=50 m/s).
Figure 13. Design values
investigated. Moreover, pros and cons of FBGS and pressure measurement on small scale louvers were
studied. Thanks to this multiple approach, the 1:70 tests were used to identify the most loaded louvers:
critical static loads were identified in the corner areas, while for the dynamic loads multiple parts of the
façade are interested, since they depend on both incoming and self-induced turbulence. The 1:4 and 1:1
were used to validate and tune the small scale tests in order to determine accurately the wind loads and
to perform an effective design of the louvers and of the supporting frame.
Cp=1
Lv 17 - Design peakCp values
Lv17- meanCP,net
- Envelope Lv17- peakCP,net
- Envelope