Monitoring Program - Home Page | California State Status and trends monitoring program ... rip...
41
CHaMP Applying Twenty-First Century Technology to Solve Fish Management Questions at Multiple Scales Columbia Habitat Monitoring Program Presenter: Steve Fortney Collaborators: Chris Beasley, Boyd Bouwes, Nick Bouwes, Andrew Hill, Chris Jordan, Mike Ward, Joe Wheaton, Carol Volk, Sarah Walker
Transcript of Monitoring Program - Home Page | California State Status and trends monitoring program ... rip...

CHaMPApplying Twenty-First Century Technology to Solve
Fish Management Questions at Multiple Scales
Columbia HabitatMonitoring Program
Presenter: Steve Fortney
Collaborators: Chris Beasley, Boyd Bouwes, Nick Bouwes, Andrew Hill, Chris Jordan, Mike Ward, Joe Wheaton, Carol Volk, Sarah Walker

Funders and More Collaborators
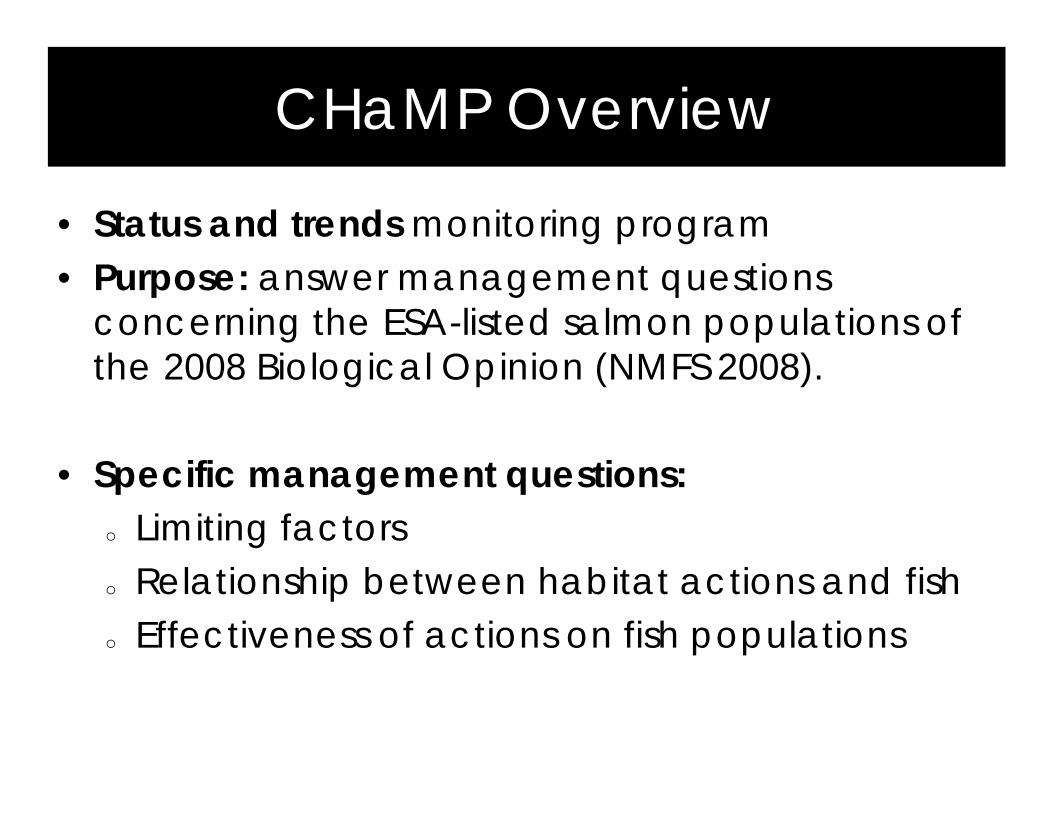
CHaMP Overview
• Status and trends monitoring program • Purpose: answer management questions
concerning the ESA-listed salmon populations of the 2008 Biological Opinion (NMFS 2008).
• Specific management questions:o Limiting factorso Relationship between habitat actions and fisho Effectiveness of actions on fish populations

Geographic Area
0 500 1,000250 Kilometers
Methow
Entiat
Wenatchee
Lemhi
Yankee Fork
South Fork Salmon
Upper Grande Ronde
John Day
Minam
Tucannon Asotin
Big, Navarro
Battle Creek
IMW
CHaMP watershed
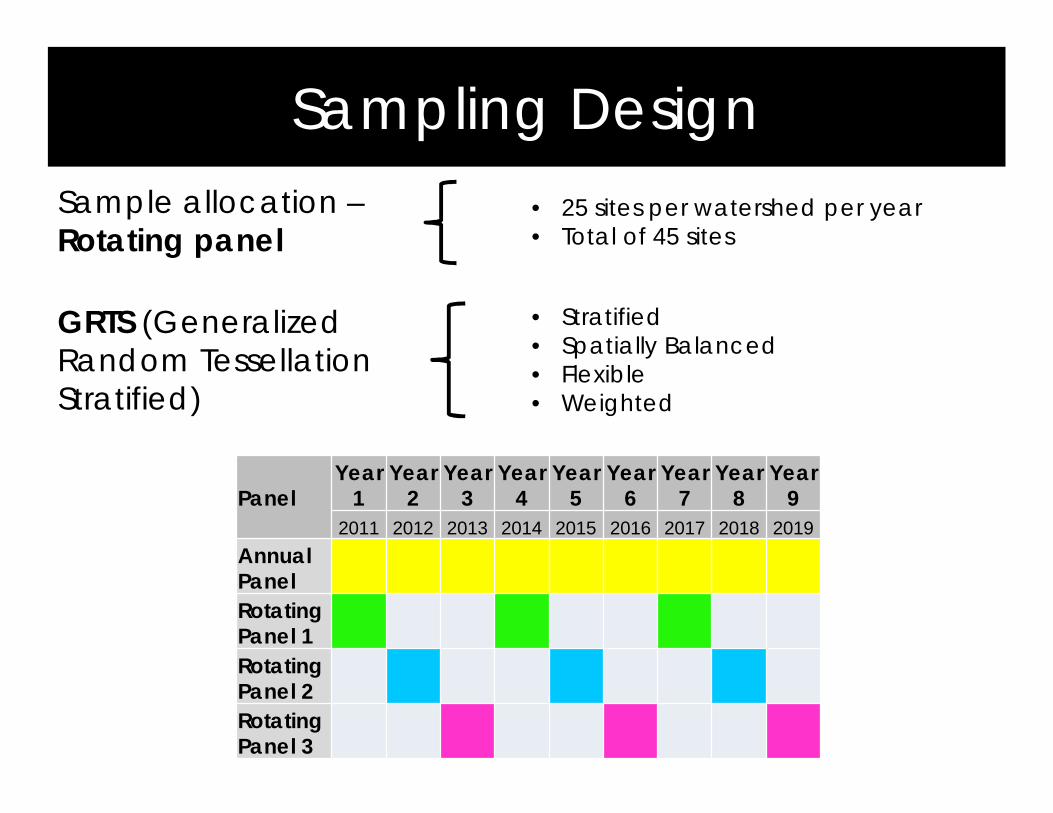
Sampling Design
PanelYear
1Year
2Year
3Year
4Year
5Year
6Year
7Year
8Year
92011 2012 2013 2014 2015 2016 2017 2018 2019
Annual PanelRotating Panel 1Rotating Panel 2Rotating Panel 3
• 25 sites per watershed per year • Total of 45 sites
• Stratified• Spatially Balanced• Flexible• Weighted
GRTS (Generalized Random Tessellation Stratified)
Sample allocation –Rotating panel

Sampling Design: Upper Columbia
0 100 20050 Kilometers
N=53
0 10 205 Kilometers
N=106
0 10 205 Kilometers
Legend!( Annual
!( RP 1
!( RP 2
!( RP 3
Status and Trends Status and Trends +
Effectiveness
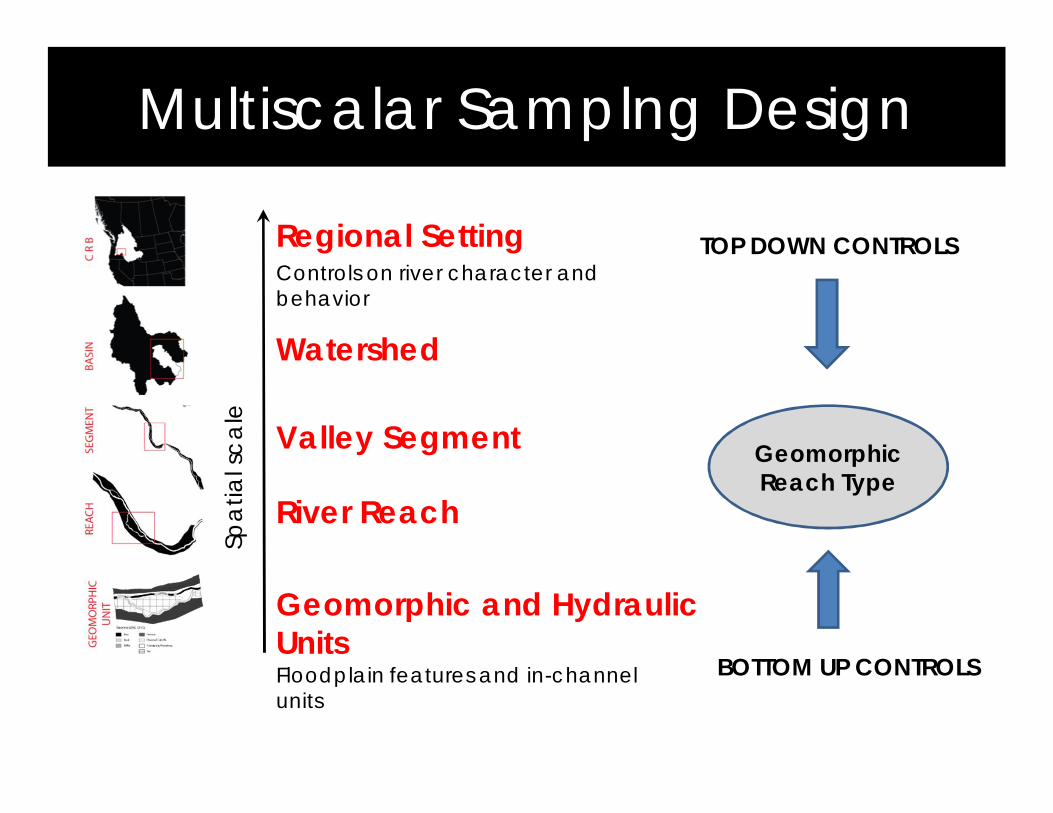
Multiscalar Samplng Design
Spat
ial s
cale
Geomorphic Reach Type
Valley Segment
River Reach
TOP DOWN CONTROLSRegional SettingControls on river character and behavior
Watershed
BOTTOM UP CONTROLS
Geomorphic and Hydraulic UnitsFloodplain features and in-channel units

Different Scales For Different Needs4
Watershed / population
Microhabitat (HSI)
Habitat metric e.g., pool frequency
BASIN
Network-Scale Habitat Condition
AREMP
ODFWPIBO
EMAP R1/R4
AEM
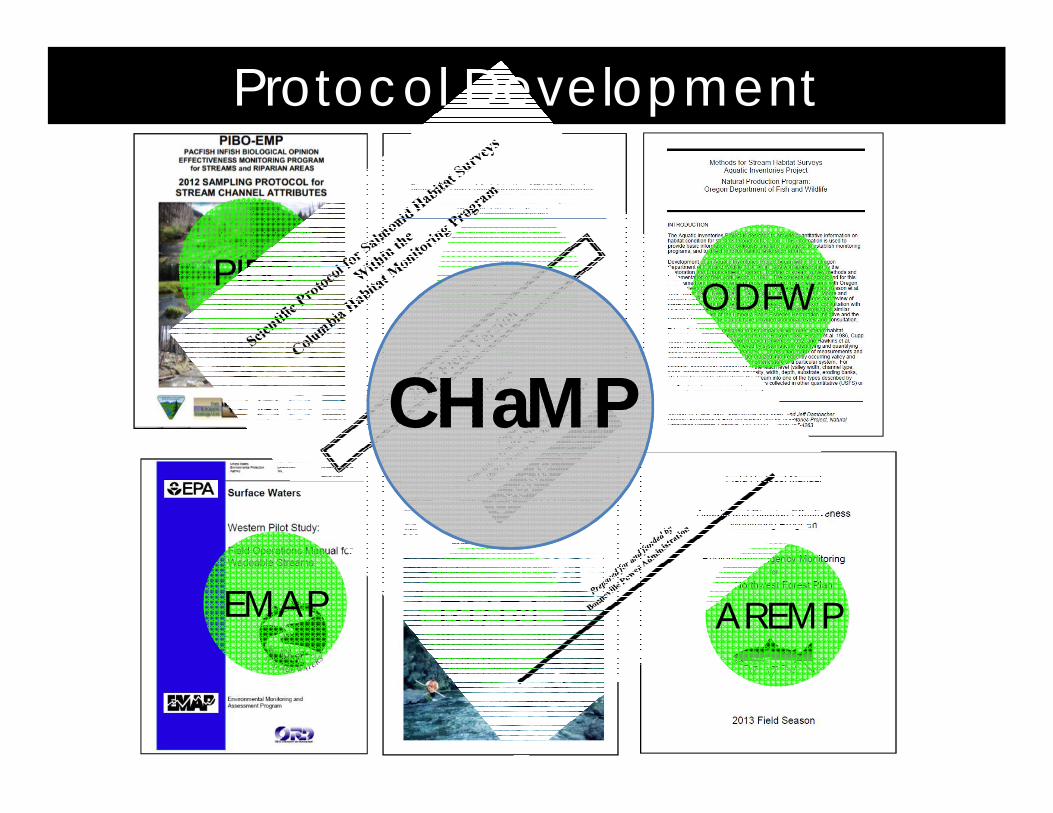
Protocol Development
CHaMPCHaMPCHaMP

Topographic Survey

River Bathymetry Toolkit (RBT)
Raw DEM Detrended DEM
Elev
atio
n (m
)
Distance (m)
Elev
atio
n (m
)
Distance (m)
Left edge of water
Right edge of water
Detrended Digital Elevation Model
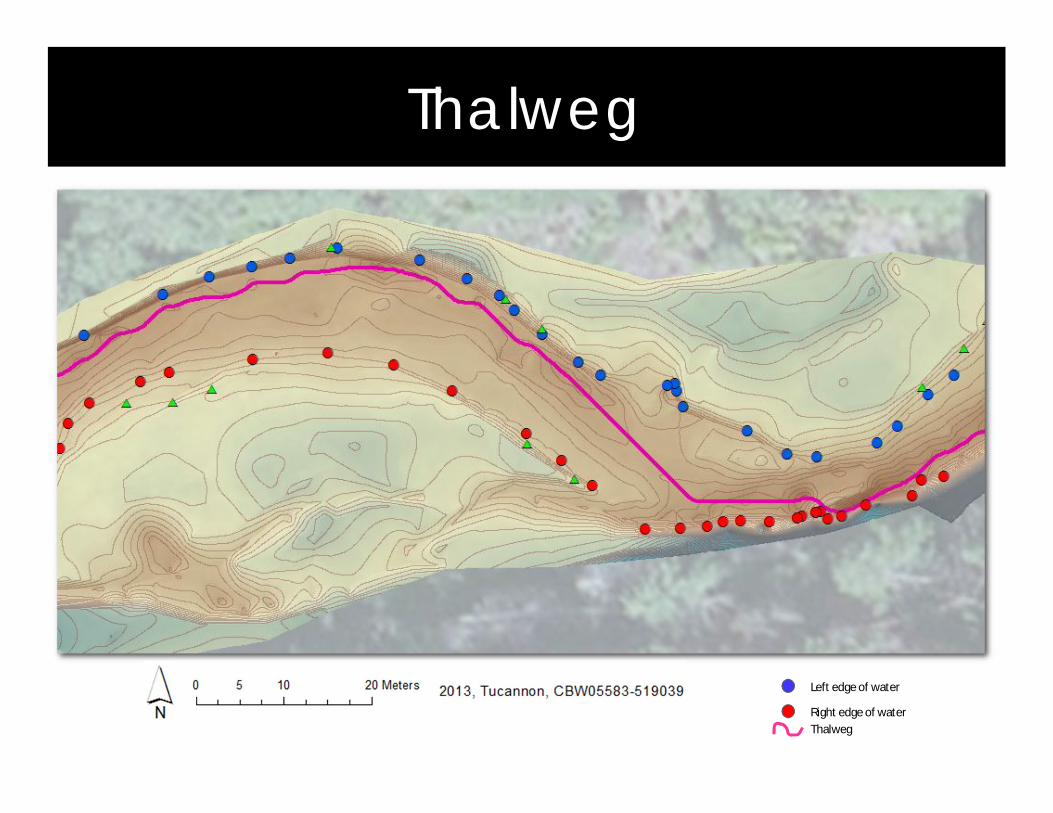
Thalweg
Thalweg
Left edge of water
Right edge of water
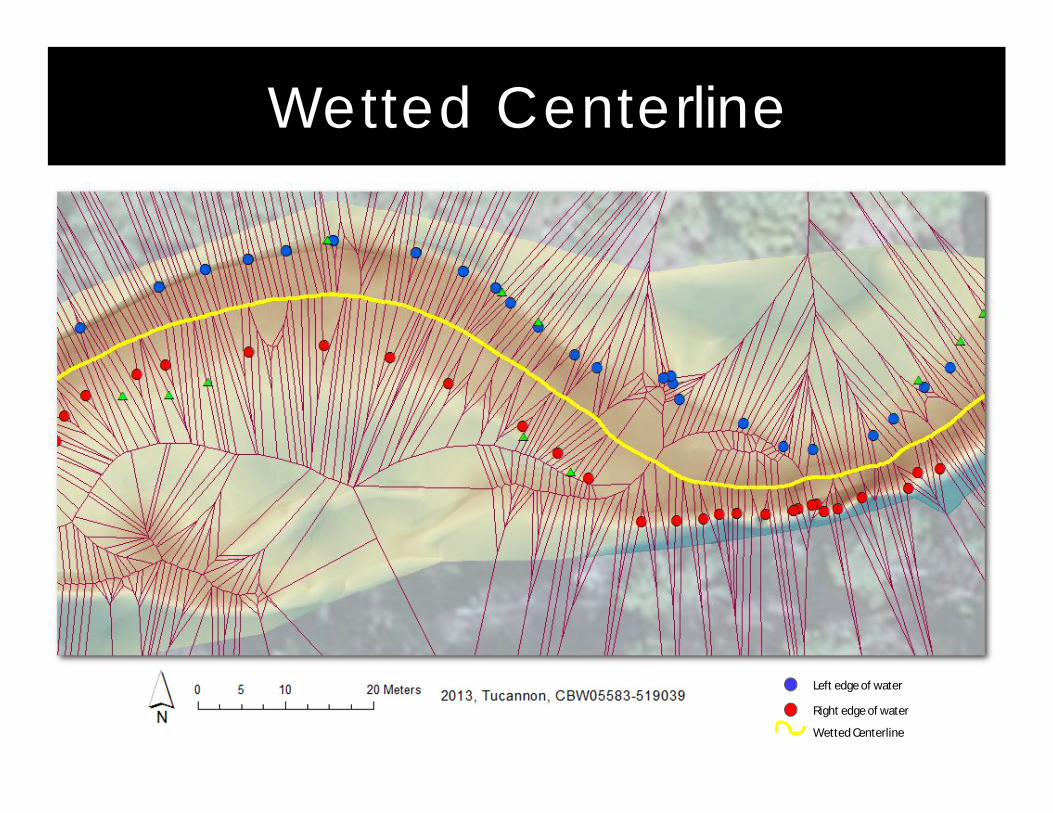
Wetted Centerline
Wetted Centerline
Left edge of water
Right edge of water
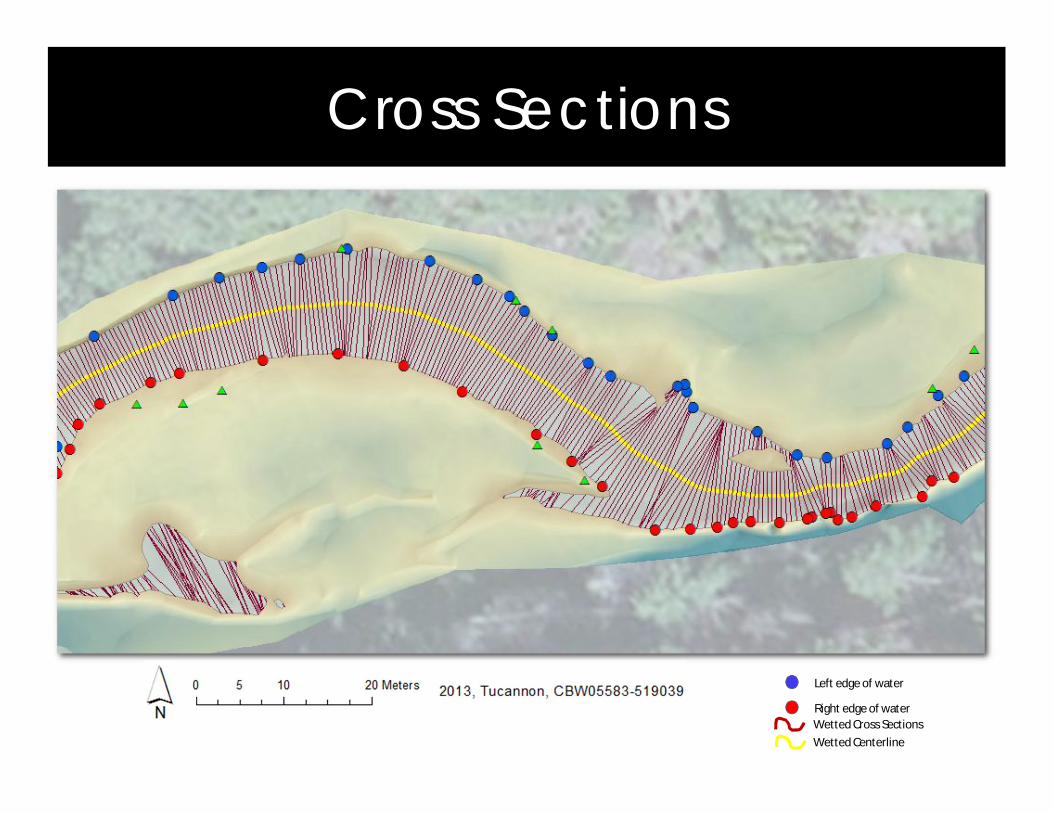
Cross SectionsCross Sections
Wetted CenterlineWetted Cross Sections
Left edge of water
Right edge of water
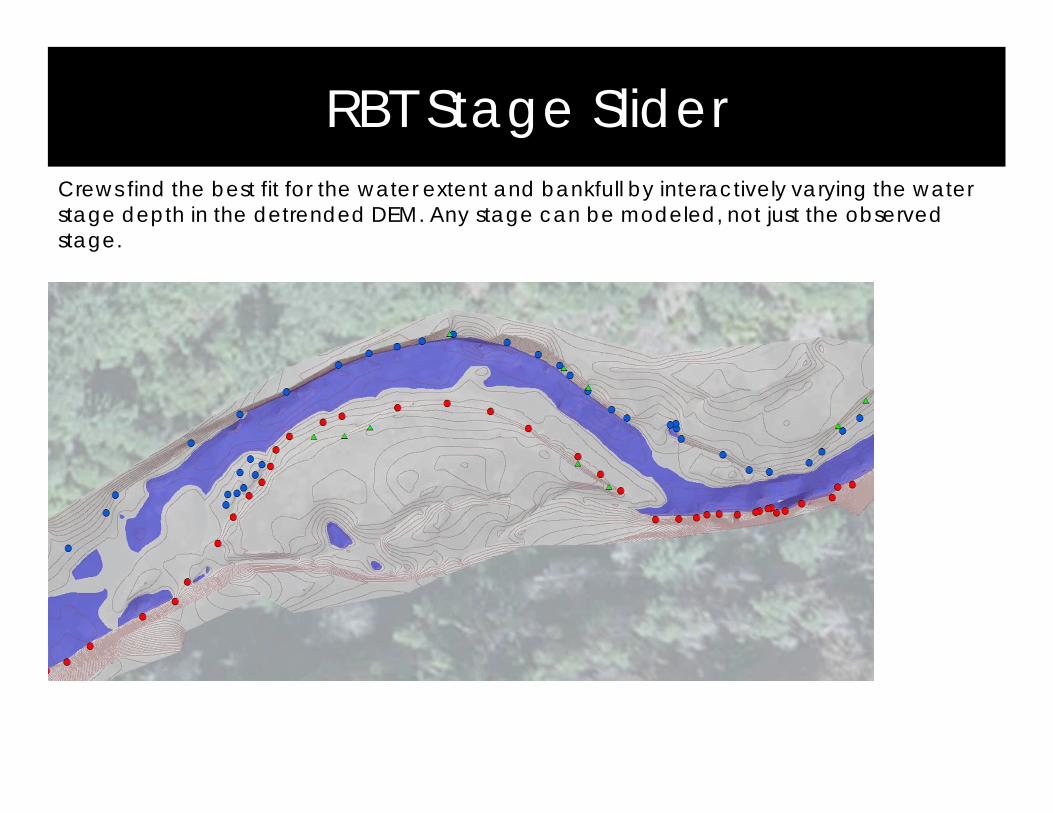
RBT Stage SliderCrews find the best fit for the water extent and bankfull by interactively varying the waterstage depth in the detrended DEM. Any stage can be modeled, not just the observed stage.
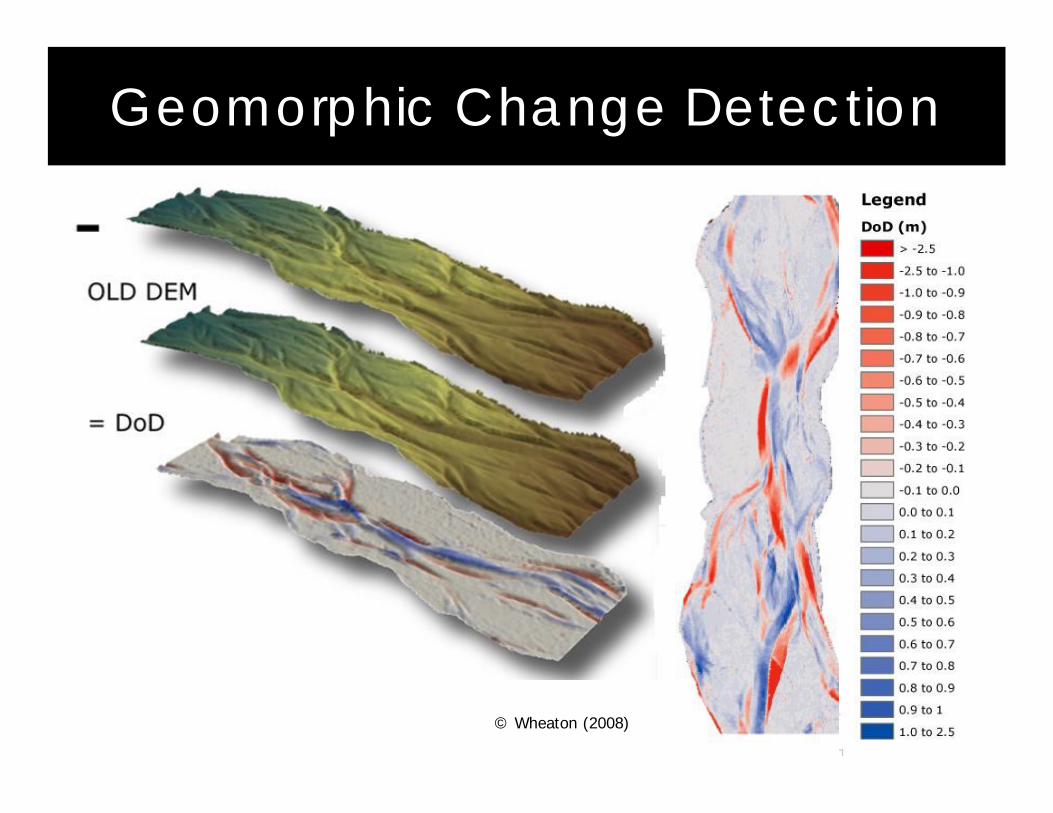
© Wheaton (2008)
Geomorphic Change Detection

Geomorphic Change Results
(m)
(m3 )
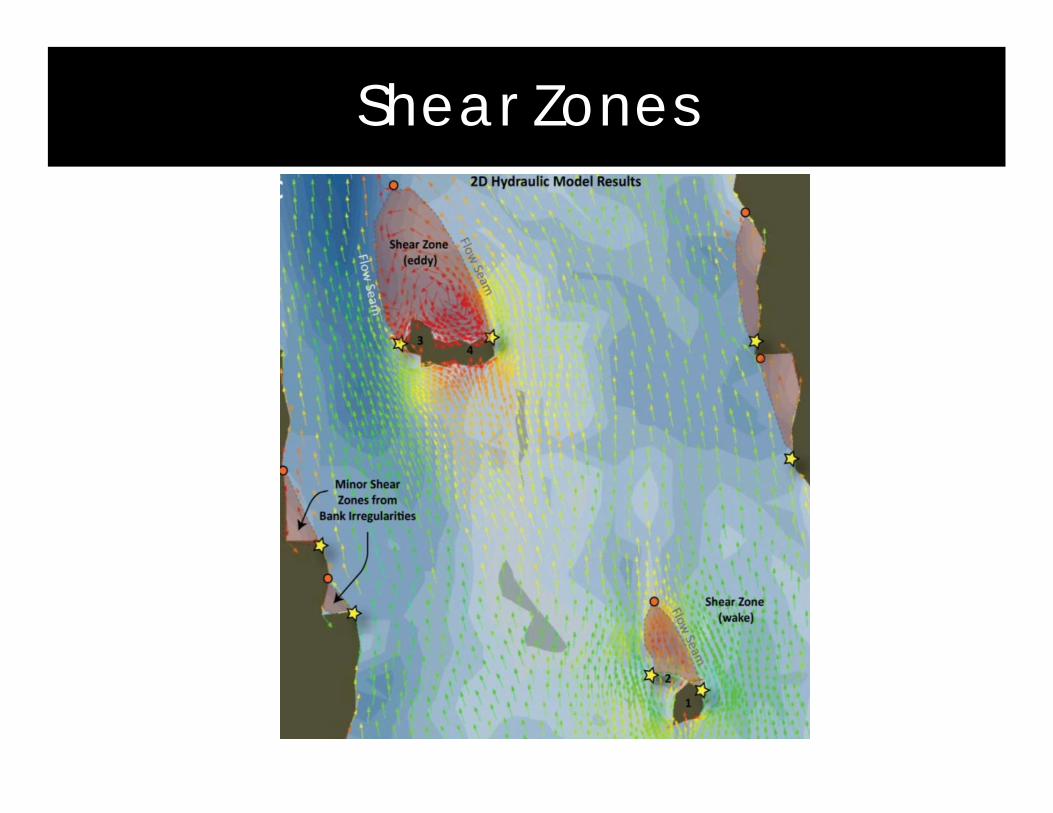
Shear Zones
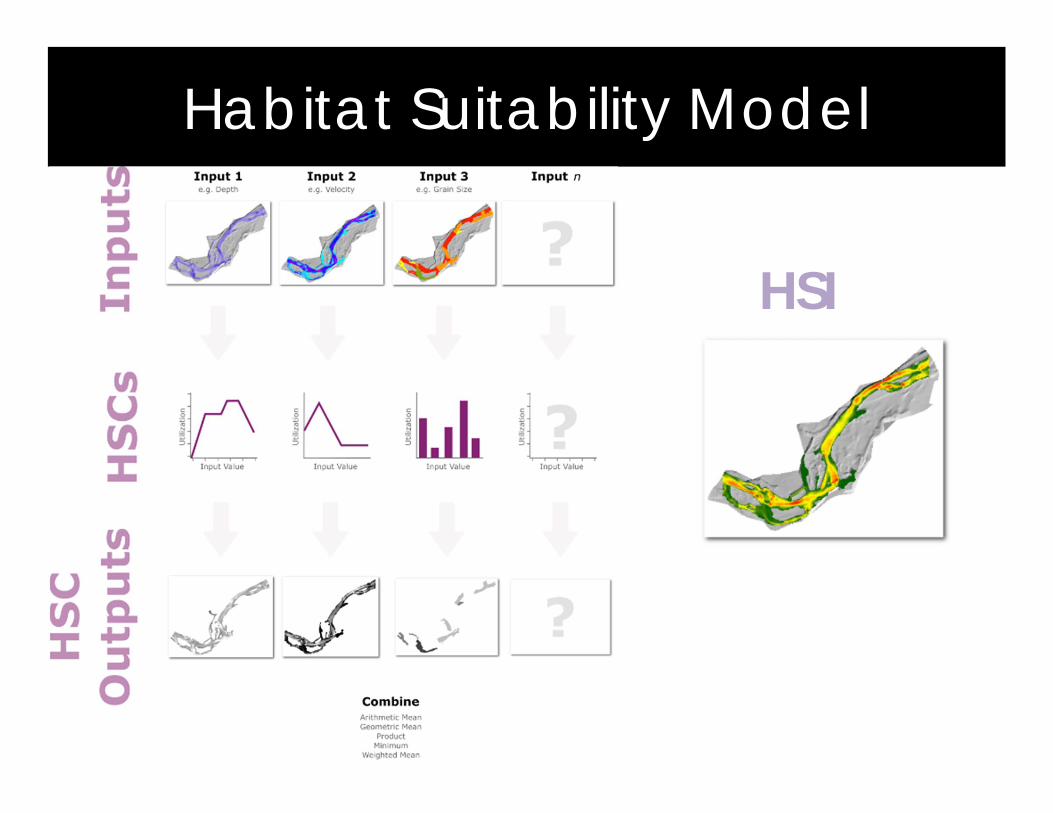
Habitat Suitability Model
HSI

Habitat Suitability Curves
Source: http://pubs.usgs.gov/sir/2004/5173/data/habitat_curves/EA Engineering, Science and Technology Inc., 1991 a, 1991b; Rubin et al.,1991; R2 Resource Consultants, 2004
Maret TR, Hortness JE, and Ott DS. 2006. Instream flow characterization of upper Salmon River Basin streams, central Idaho, 2005: US Geological survey Scientific Investigations Report 2006-5230, 110 p
Chinook Spawners
00.10.20.30.40.50.60.70.80.9
1
0 2 4 6 8Velocity (fps)
00.10.20.30.40.50.60.70.80.9
1
0 5 10Depth (ft)
00.10.20.30.40.50.60.70.80.9
1
codes below)1 2 3 4 5 6 7 8
Substrate

Habitat Suitability Model
HSI

2 m
0 40 8020 Meters
Legend1.9.8.7.6.5.4.3.2.10
.2 m
ENT00001-2C1
WUA= ∑퐻푆퐼 × 푎푟푒푎
Capacity = WUA / territory size (4* redd area)
Spatially Explicit Habitat Suitability
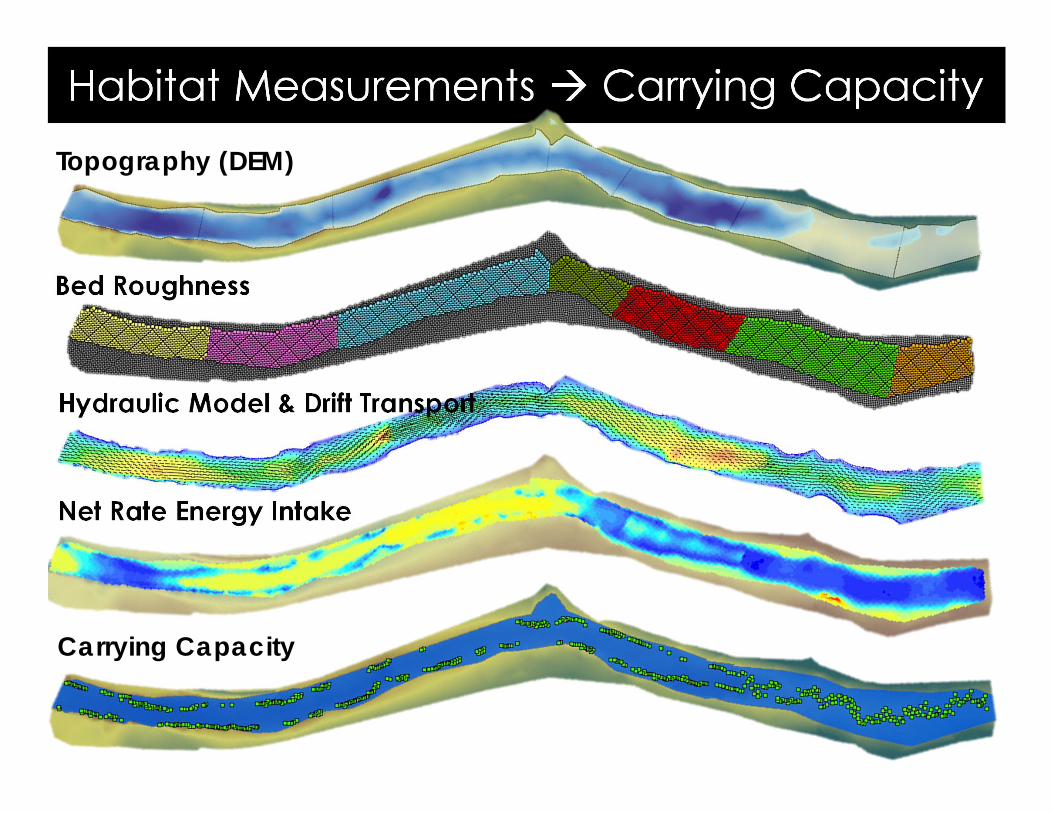
Habitat Measurements Carrying Capacity
Bed Roughness
Hydraulic Model & Drift Transport
Net Rate Energy Intake
Carrying Capacity
Topography (DEM)
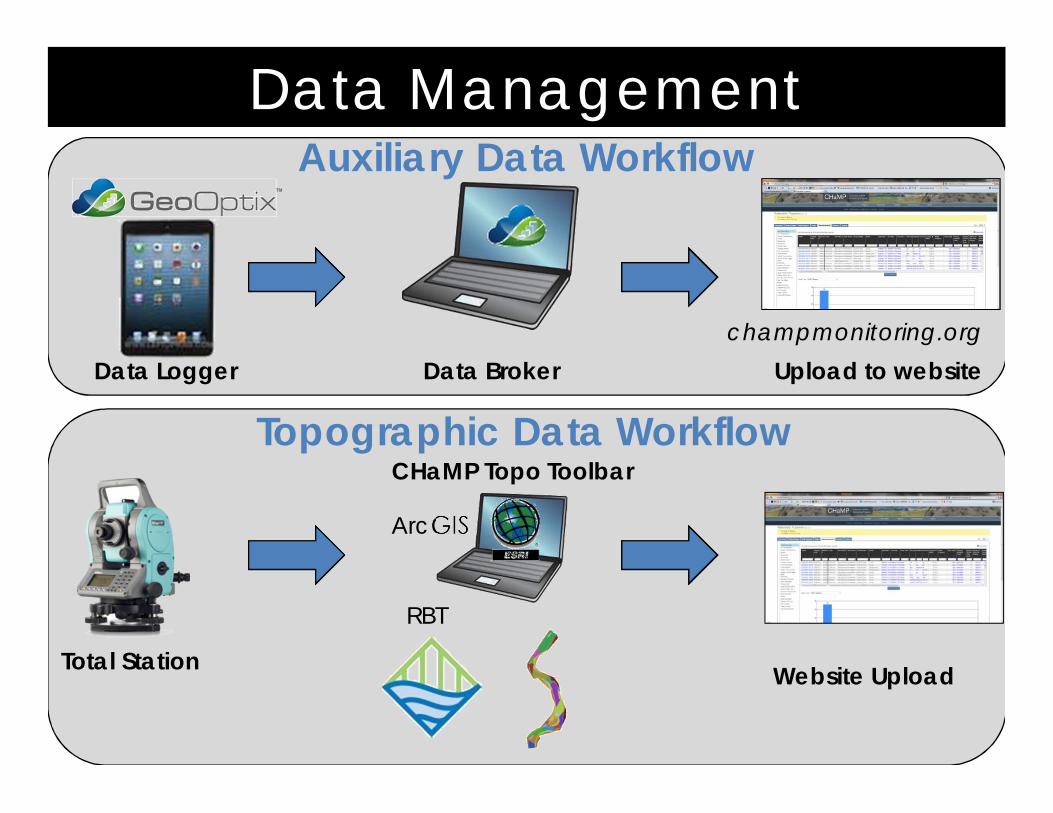
Total Station
CHaMP Topo Toolbar
ArcGIS
Website Upload
RBT
Auxiliary Data Workflow
Data BrokerData Logger Upload to website
Topographic Data Workflow
Data Management
champmonitoring.org
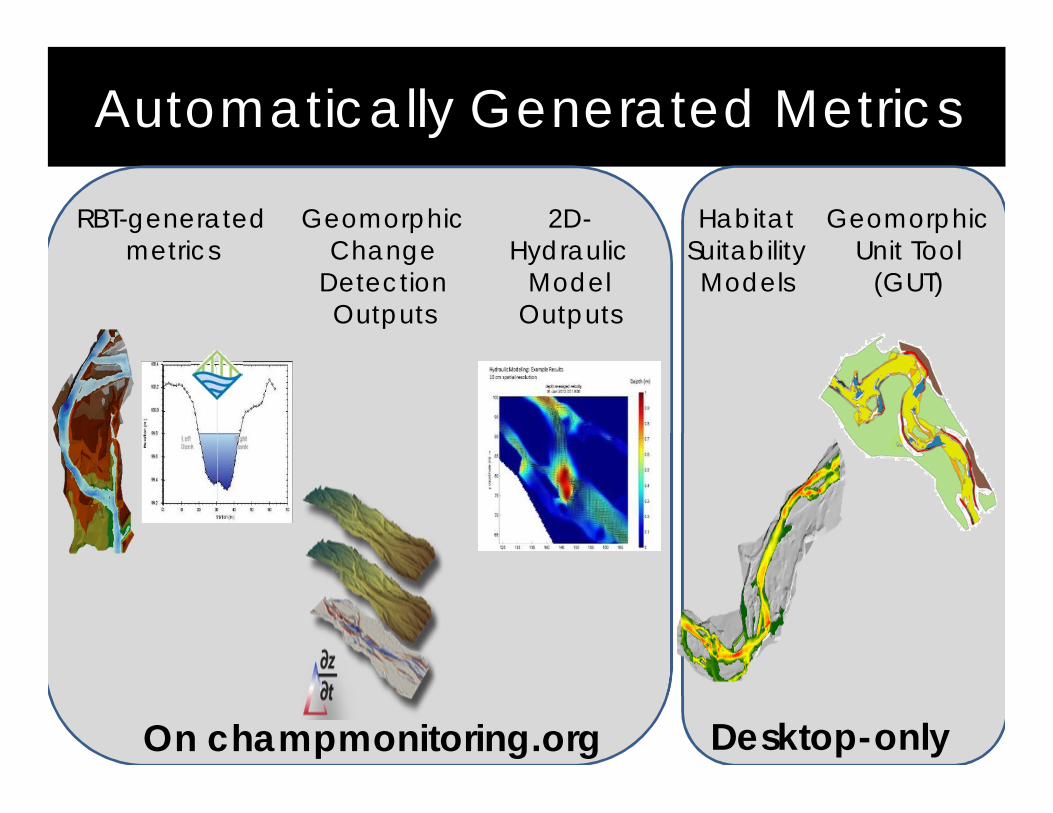
Automatically Generated Metrics
RBT-generated metrics
Geomorphic Change
Detection Outputs
Habitat Suitability Models
2D-Hydraulic
ModelOutputs
Geomorphic Unit Tool
(GUT)
On champmonitoring.org Desktop-only
Metric Assessment• variance decomposition is conducted
annually to assess metric capability
• Other CHaMP metric assessment tools: o 10% repeat surveyso Crew variability study to quantify biaso Comparison of metrics shared with those
of other regional monitoring programs
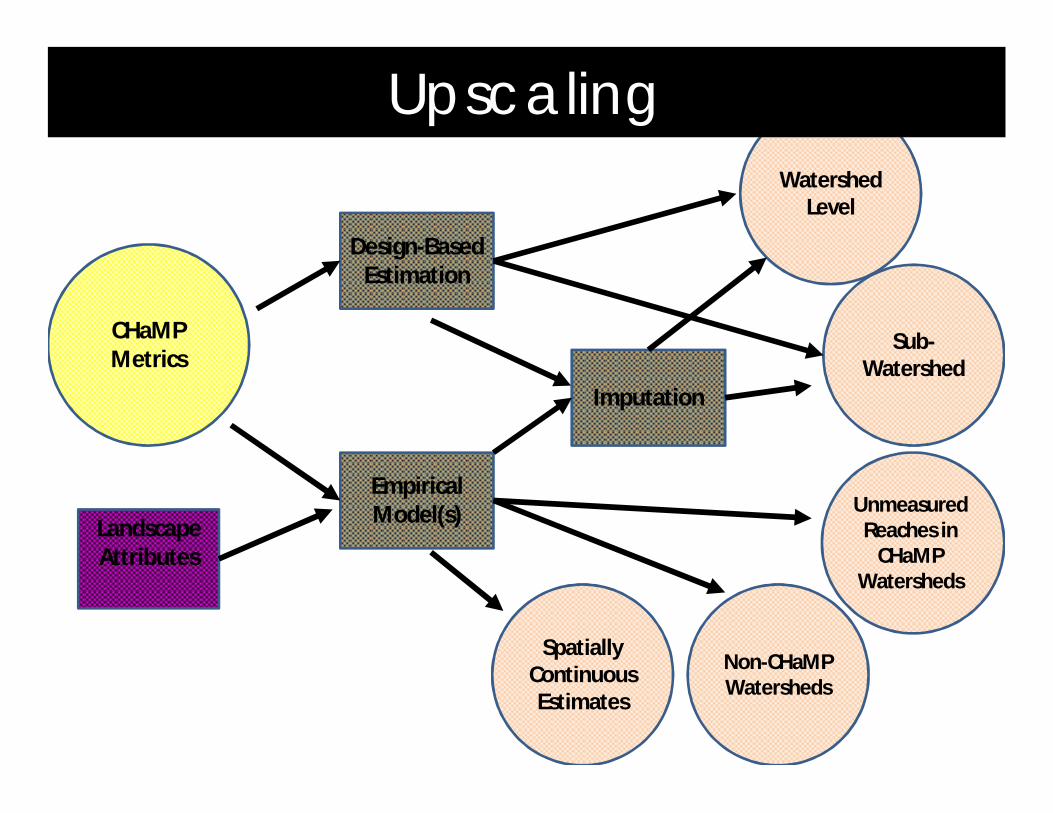
Watershed Level
Sub-Watershed
Unmeasured Reaches in
CHaMP Watersheds
Empirical Model(s)
Design-Based Estimation
Non-CHaMP Watersheds
Imputation
Landscape Attributes
From Sites to Populations
CHaMP Metrics
Spatially Continuous Estimates
Upscaling
0 10 205 Kilometers
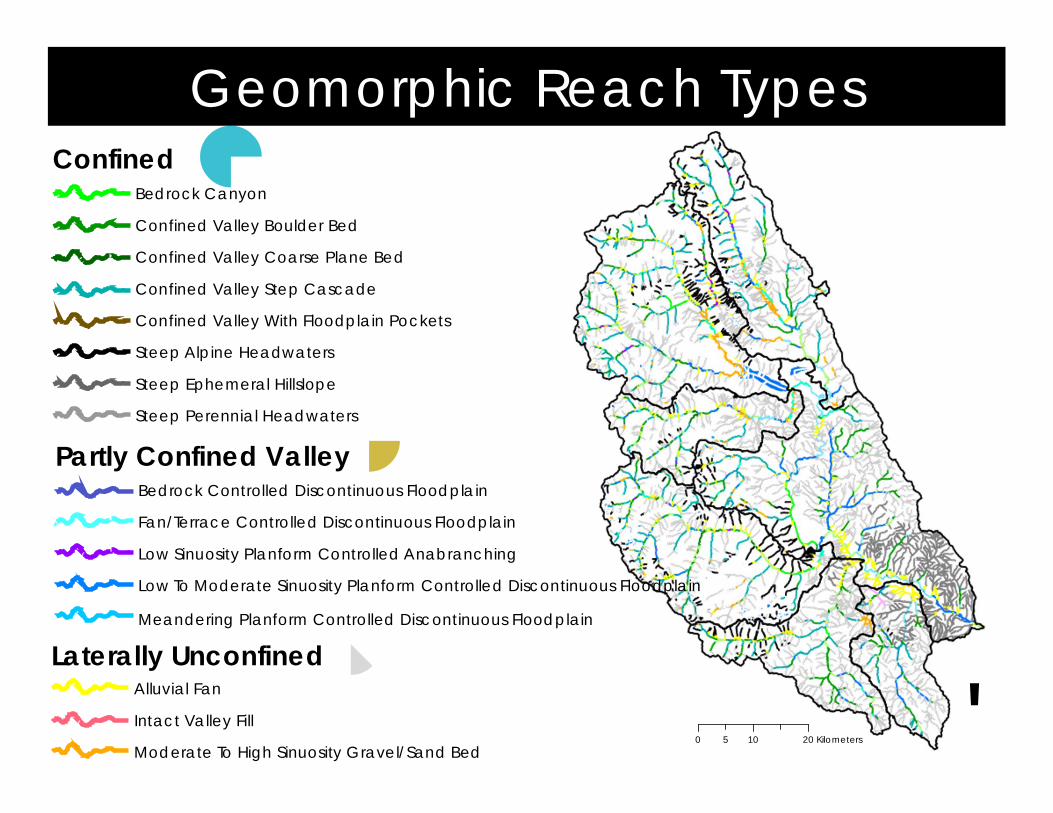
Bedrock Controlled Discontinuous Floodplain
Fan/Terrace Controlled Discontinuous Floodplain
Low Sinuosity Planform Controlled Anabranching
Low To Moderate Sinuosity Planform Controlled Discontinuous Floodplain
Meandering Planform Controlled Discontinuous Floodplain
Alluvial Fan
Intact Valley Fill
Moderate To High Sinuosity Gravel/Sand Bed
Bedrock Canyon
Confined Valley Boulder Bed
Confined Valley Coarse Plane Bed
Confined Valley Step Cascade
Confined Valley With Floodplain Pockets
Steep Alpine Headwaters
Steep Ephemeral Hillslope
Steep Perennial Headwaters
Partly Confined Valley
Confined
Laterally Unconfined
"
Geomorphic Reach Types

Valley Confinement
(2L + 2R)/2*stream Length
Confined Partly Confined Laterally Unconfined

Capacity for Adjustment
O’Brien, 2014
Confined Valley Setting Laterally Unconfined Valley Setting
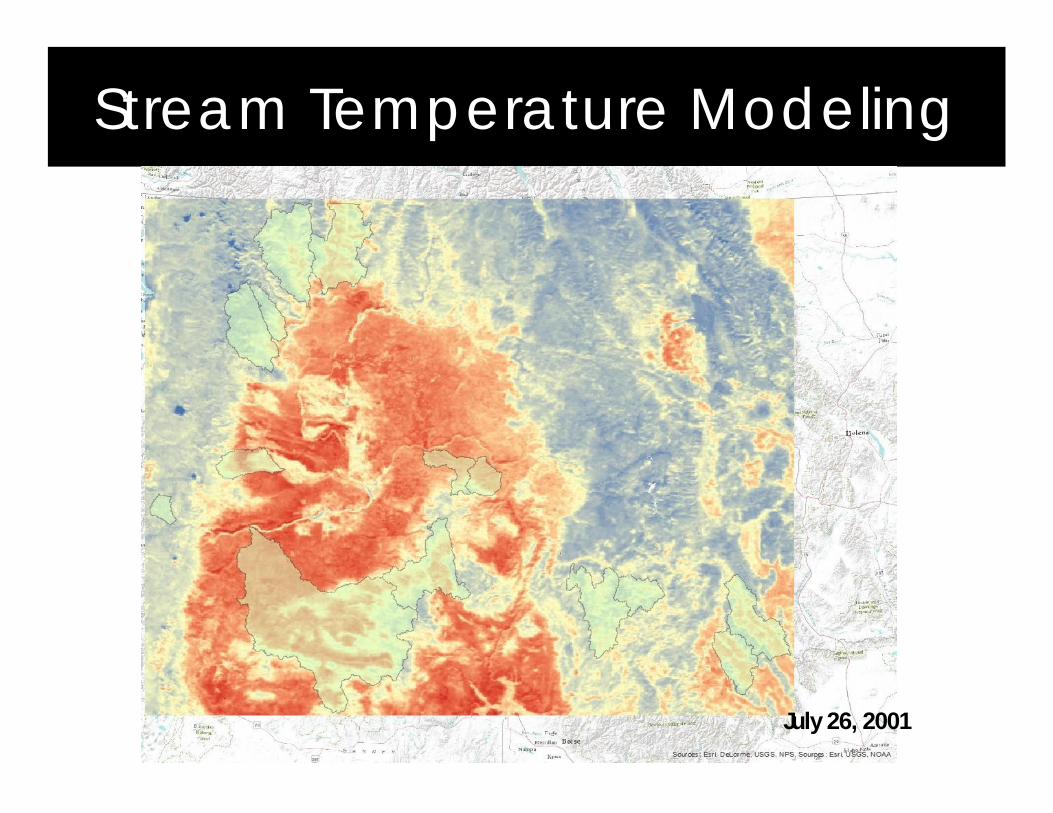
Stream Temperature Modeling
July 26, 2001
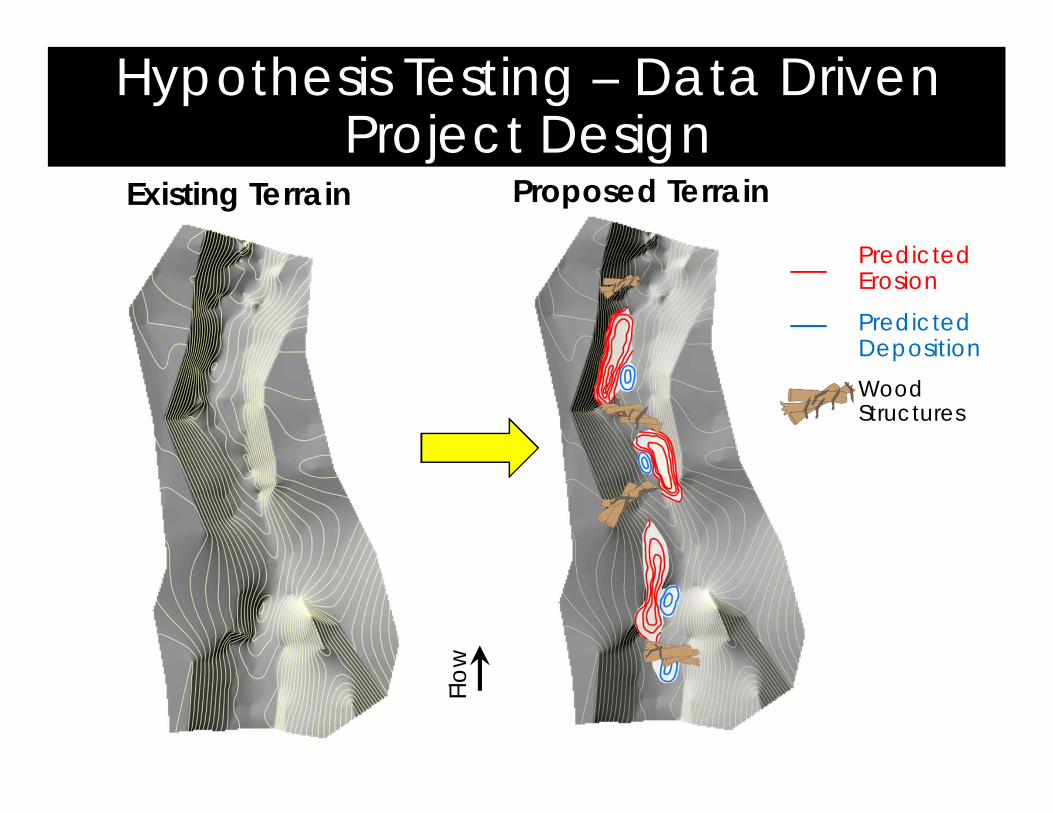
Proposed Terrain
Hypothesis Testing – Data Driven Project Design
Existing Terrain
PredictedErosion
WoodStructures
PredictedDeposition
Flow
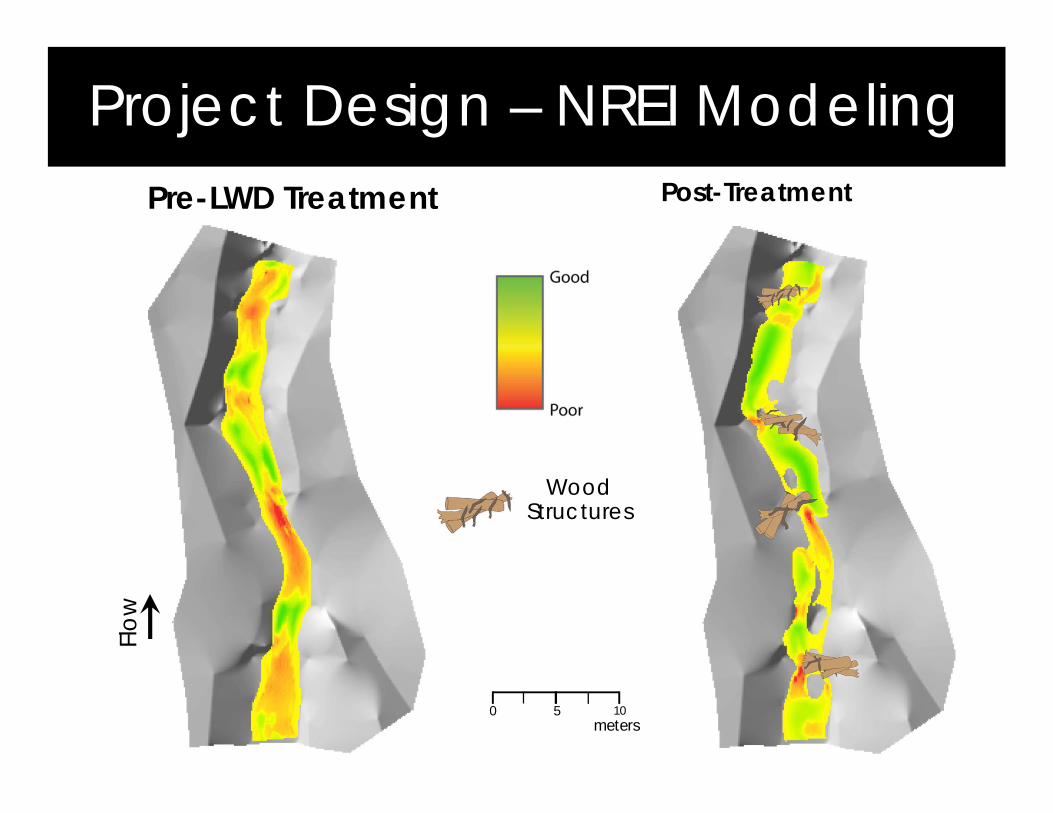
Post-Treatment
Project Design – NREI Modeling
WoodStructures
0 5 10meters
Flow
Pre-LWD Treatment
Jody White, Quantitative Consultants, Inc. Acknowledgements ContributorsPhilip Bailey, North Arrow Research Sara Bangen, Utah State University Chris Beasley, Quantitative Consultants, Inc. Boyd Bouwes, Watershed Solutions, Inc. Nicolaas Bouwes, Eco Logical Research, Inc. Stephen Fortney, Terraqua, Inc. Jeremiah Heitke, Blue Heron Consulting Andrew Hill, Eco Logical Research, Inc. Chris Horn, Oregon Department of Fish and WildlifeMartha Jensen, Utah State University Chris E. Jordan, Northwest Fisheries Science Center, NOAA-FisheriesCasey Justice, Columbia InterTribal Fish CommissionDavid P. Larsen, Pacific States Marine Fisheries Commission Kristina McNyset, NOAA-FisheriesMatt Nahorniak, South Fork Research, Inc.
Pamela Nelle, Terraqua, Inc. Gary O’Brian, Utah State University Shubha Pandit, Terraqua Inc. Carl Saunders, Utah State University Edwin R. Sedell, Oregon Department of Fish and WildlifeKevin E. See, Quantitative Consultants, Inc. Keith van den Broek, Terraqua, Inc. Carol Volk, South Fork Research, Inc. Eric Wall, Utah State University Michael B. Ward, Terraqua, Inc.Nicholas Weber, Eco Logical Research, Inc. Seth White, Columbia InterTribal Fish CommissionJoe Wheaton, Utah State University
Thank you!
Questions?
Backup slides
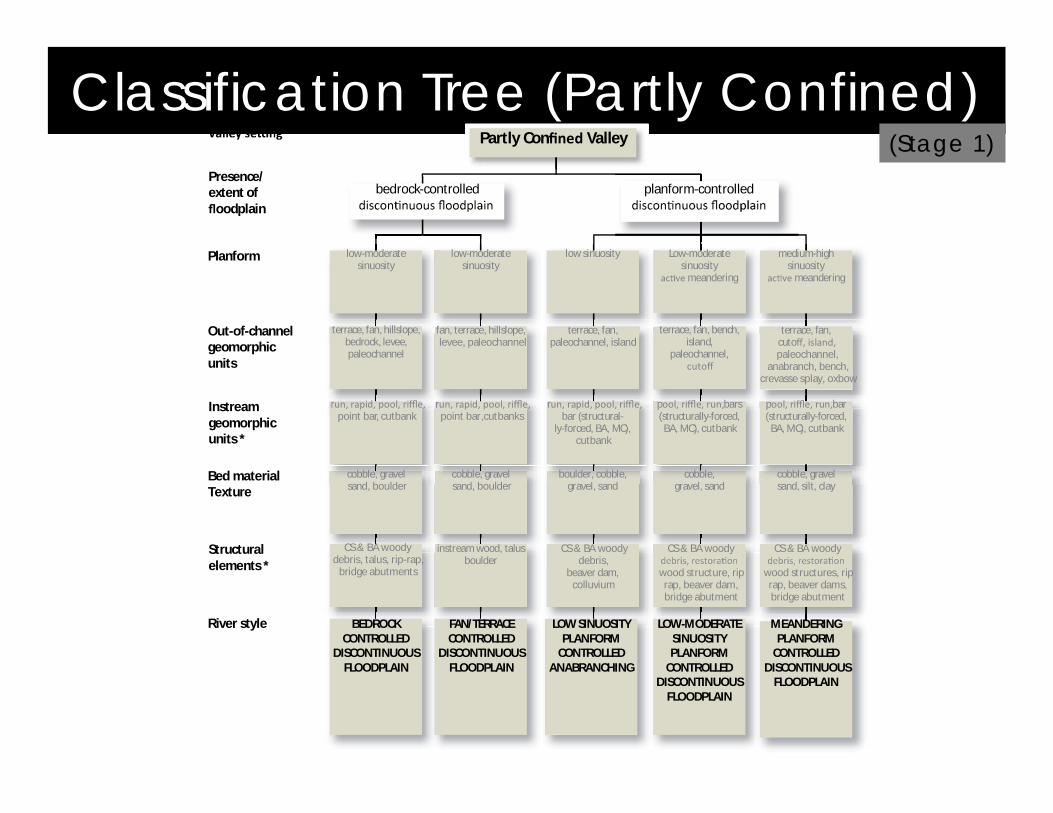
Classification Tree (Partly Confined)
Planform
Instreamgeomorphicunits *
Bed materialTexture
River style
Out-of-channelgeomorphicunits
Presence/extent offloodplain
Structuralelements *
CS & BA woody
wood structures, riprap, beaver dams,bridge abutment
medium-highsinuosity
meandering
cobble, gravelsand, silt, clay
pool, riffle, run,bar(structurally-forced,
BA, MC), cutbank
cobble,gravel, sand
CS & BA woody
wood structure, riprap, beaver dam,bridge abutment
pool, riffle, run,bars(structurally-forced,BA, MC), cutbank
Low-moderatesinuosity
meandering
run, rapid, pool, riffle,bar (structural-
ly-forced, BA, MC),cutbank
CS & BA woodydebris,
beaver dam,colluvium
boulder, cobble,gravel, sand
low sinuosity
run, rapid, pool, riffle,point bar,cutbanks
cobble, gravelsand, boulder
instream wood, talusboulder
low-moderatesinuosity
run, rapid, pool, riffle,point bar, cutbank
CS & BA woodydebris, talus, rip-rap,
bridge abutments
low-moderatesinuosity
cobble, gravelsand, boulder
terrace, fan, hillslope,bedrock, levee,paleochannel
fan, terrace, hillslope,levee, paleochannel
terrace, fan,paleochannel, island
terrace, fan, bench,island,
paleochannel,cutoff
terrace, fan,cutoff, island,paleochannel,
anabranch, bench,crevasse splay, oxbow
LOW-MODERATESINUOSITYPLANFORM
CONTROLLEDDISCONTINUOUS
FLOODPLAIN
LOW SINUOSITYPLANFORM
CONTROLLEDANABRANCHING
FAN/TERRACECONTROLLED
DISCONTINUOUSFLOODPLAIN
BEDROCKCONTROLLED
DISCONTINUOUSFLOODPLAIN
MEANDERINGPLANFORM
CONTROLLEDDISCONTINUOUS
FLOODPLAIN
Partly Confined Valley
planform-controlled bedrock-controlled
(Stage 1)

• Site Length (centerline)• Site Length (Thalweg)• Sinuosity• Wetted width• Bankfull width• Bankfull Channel Capacity• Area Sum• RP100• Pool tail crest depth
average• Pool max depth average• Average Bankfull elevation• Average channel capacity• Average cross section area• Average rectangular cross
section area• Site topographic gradient• Site water surface gradient• Site area wetted• Site area bankfull• Wetted volume• Bankfull volume• Detrended DEM standard
deviation• Water depth standard
deviation
• For Each Channel Unit• Area• Volume• Count• Frequency• Spacing• Percent of site• Average Max Depth• Average Depth at
Thalweg Exit• Average Residual Depth
• For Each Tier 1 and Tier 2 Channel Unit Type
• Area• Volume• Count• Frequency• Spacing• Percent of site• Average Max Depth• Average Depth at
Thalweg Exit• Average Residual Depth
• Raw area of erosion• Thresholded area of erosion• Percent of area of interest
with detectable change• Total net volume of difference• Total net volume of difference
+/- error• Average net thickness of
difference• Average net thickeness of
difference +/- error• Average net thickness of
difference with detectable change
• Average net thickness of difference with detectable change +/- error
RBT metricsGCD metrics
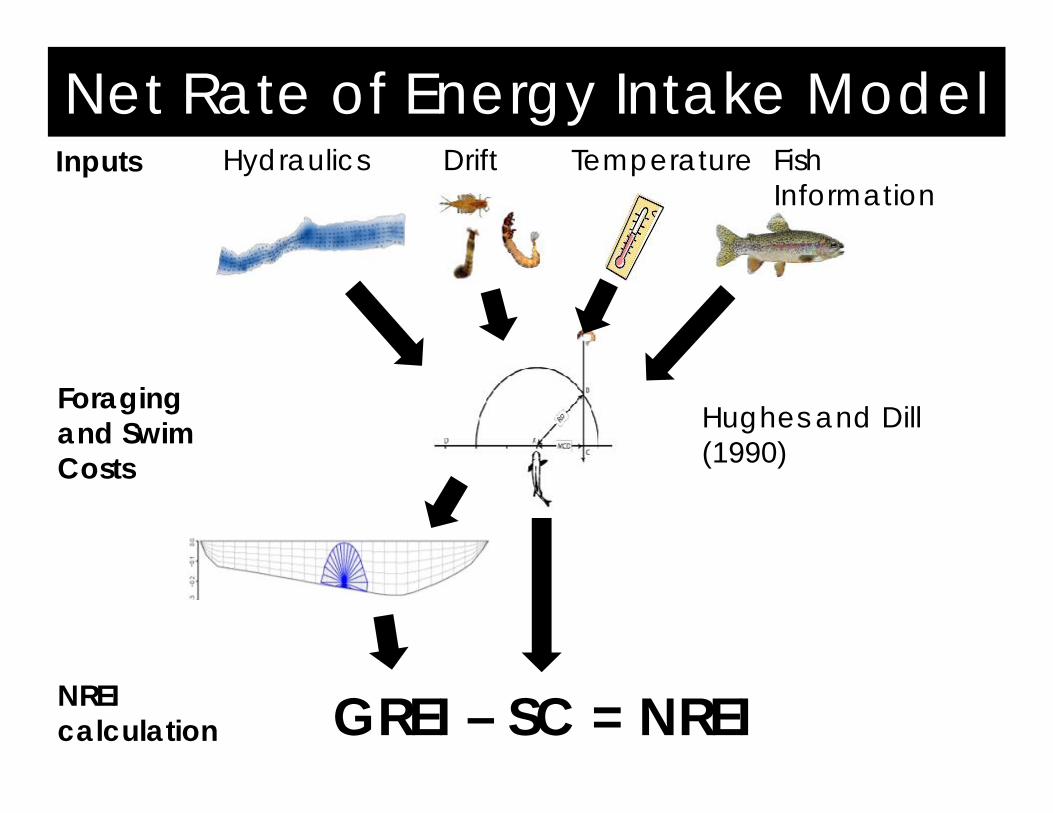
Net Rate of Energy Intake Model
Foraging and Swim Costs
Inputs
NREI calculation
Hughes and Dill (1990)
Hydraulics Drift Temperature Fish Information
GREI – SC = NREI

GrowthGrowth
FoodFood
TemperatureTemperature
ActivityActivity
ProductionProduction
FitnessFitness
GrowthGrowth
SurvivalSurvival
Reproduction Reproduction
Populations(abundance) Populations(abundance)
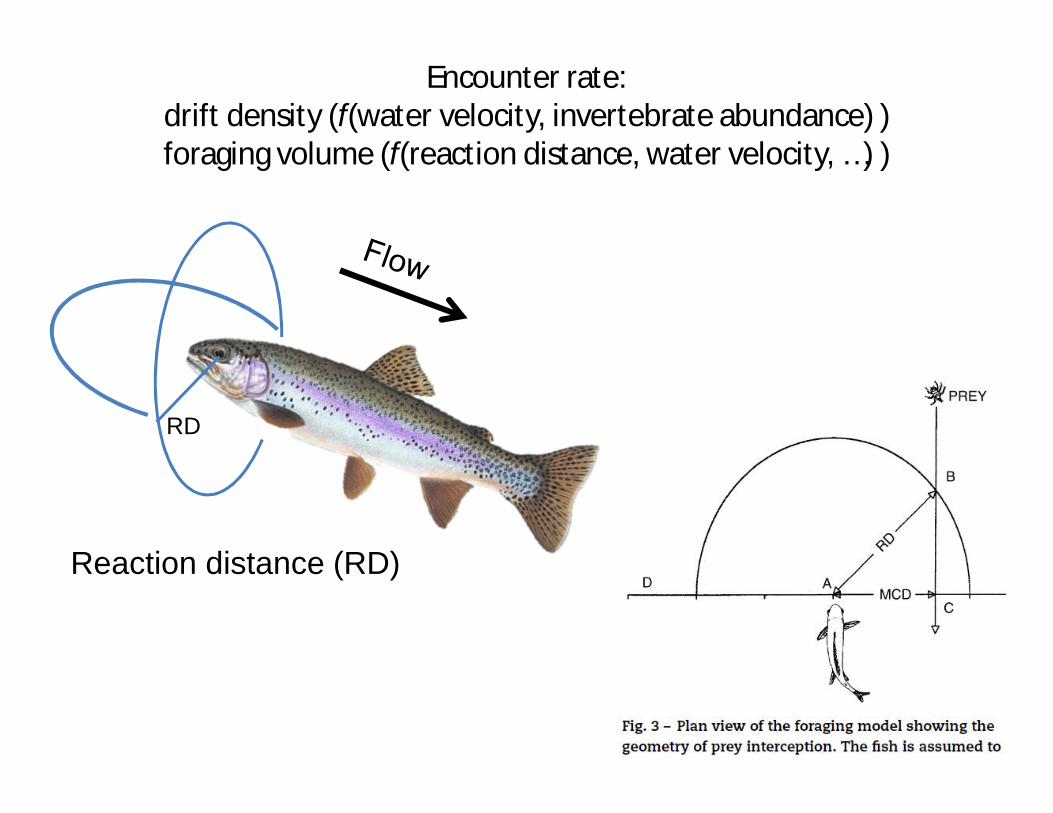
Reaction distance (RD)
RD
Encounter rate: drift density (f(water velocity, invertebrate abundance) ) foraging volume (f(reaction distance, water velocity, …) )


![- [width=10cm,height=2cm]logocimac.png Análisis en ...](https://static.fdocument.pub/doc/165x107/61d07949ad20a11006073b94/-width10cmheight2cm-anlisis-en-.jpg)