Migration Behavior Changes of Juvenile North Pacific … · Migration Behavior Changes of Juvenile...
24
Migration Behavior Changes of Juvenile North Pacific Albacore linking to Environmental Variability Southwest Fisheries Science Center PICES 2015 Annual Meeting Qingdao, China, October 15 th , 2015 Yi Xu, Steven Teo, Stephanie Snyder, and Suzanne Kohin Email: [email protected] 长鳍金枪鱼(Thunnus alalunga)
Transcript of Migration Behavior Changes of Juvenile North Pacific … · Migration Behavior Changes of Juvenile...

Migration Behavior Changes of Juvenile North Pacific Albacore linking to
Environmental Variability
Southwest Fisheries Science Center
PICES 2015 Annual Meeting Qingdao, China, October 15th, 2015
Yi Xu, Steven Teo, Stephanie Snyder, and Suzanne Kohin
Email: [email protected]
长鳍金枪鱼(Thunnus alalunga)

Southwest Fisheries Science Center La Jolla, California, USA
About us
We generate science necessary for the conservation and management of living marine resources in the California Current, Pacific Ocean and in Antarctica.
About the Species • Highly migratory • Juvenile age2-5, size 57-110cm • Good omega-3 sources • Sushi/sashimi • Canning • Currently healthy stock status

Background & Objectives • The albacore surface fishery (troll and pole-and-line) is the most important
commercial tuna fishery on the US and Canada West Coast.
• Previous research study showed that albacore distribution is associated with sea surface temperature gradient and SST front over large spatial (northeast Pacific) and temporal scales (30 years, 1982-2011). Higher CPUE were observed at places with greater SST gradient longitudinally. (Xu et al., 2015, Progress in Oceanography, In Press)
• Our objective is to study albacore behavior changes (movement, diving, ambient water and body temperature changes, etc) in different study areas identified by SST gradients and fronts, using archival tagging data.
Longitudinal Distribution Xu et al., 2015
Results Climatological mean conditions
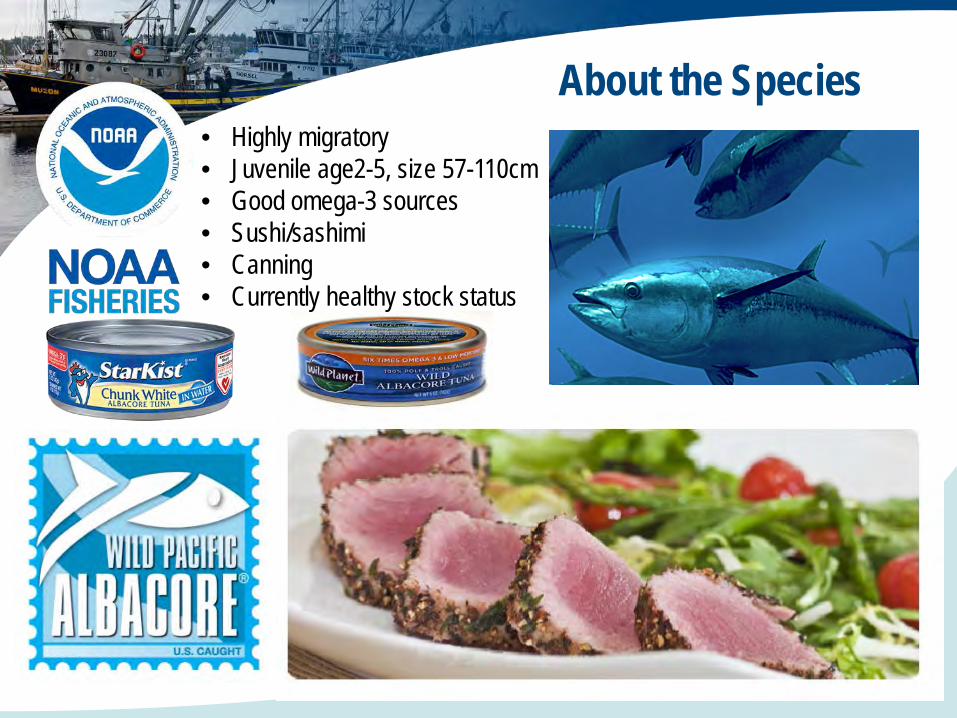
Longitudinal changes in mean SST gradient & CPUE
SST gradient decrease from west to east, reaching min@130W, before rapidly increase near the coast. Albacore CPUE generally has higher value in the transition zone, and reaching min@132-135W, and rapidly increase near the coast.

Data • Archival tags (manufactured by
Wildlife Computers, USA and Lotek Wireless, Canada) • 920 tags were deployed in 2004-
2014 (123 tags in 2015) • 29 recoveries (recover rate 3.2%) • 13 albacore crossed all interested
regions • Time, light level, depth, body
temperature, and water temperature were measured and recorded from the tags.

Raw Data
Depth
Body Temperature
Water Temperature
Light Level
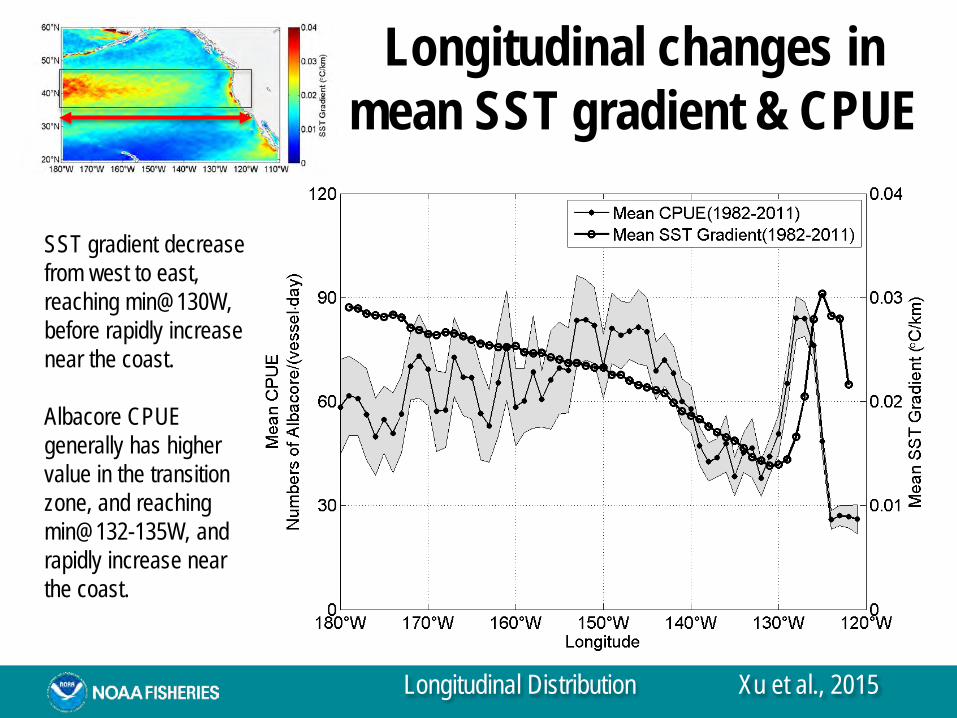
Estimate Sunrise/Sunset from Light level 𝑠𝑠𝑠𝑠𝑠𝑠𝑠𝑠𝑠𝑠𝑠𝑠𝑠𝑠: max
𝑑𝑑𝑑𝑑𝑠𝑠𝑑𝑑𝑑𝑑𝑑𝑑𝑑𝑠𝑠𝑑𝑑𝑠𝑠𝑑𝑑𝐷𝐷𝑑𝑑
𝑠𝑠𝑠𝑠𝑠𝑠𝑠𝑠𝑠𝑠𝑑𝑑: min𝑑𝑑𝑑𝑑𝑠𝑠𝑑𝑑𝑑𝑑𝑑𝑑𝑑𝑠𝑠𝑑𝑑𝑠𝑠𝑑𝑑
𝐷𝐷𝑑𝑑
Day
Night
Dawn
Dusk
Day

Summary of tags Tag number Type Release Recover Days at
liberty Date Latitude Longitude Date Latitude Longitude B2381 Lotek 2004/07/01 44.53 -125.63 2005/09/01 45.53 -125.97 428 B2398 Lotek 2004/07/01 44.52 125.62 2005/09/19 45.85 -126.50 446 B2393 Lotek 2004/06/30 44.71 -125.76 2006/05/27 30.30 -144.58 697 0490306 Wildlife 2004/09/13 45.03 -125.28 2005/12/06 33.70 -167.83 450 0690063 Wildlife 2006/08/07 46.10 -124.87 2007/06/29 32.00 -117.92 327 0690065 Wildlife 2006/08/07 46.07 -124.87 2007/05/27 32.5* -140.1* 294 0690078 Wildlife 2006/10/06 46.11 -125.14 2008/06/26 13 -172 630 D1045 Lotek 2006/08/06 46.02 -124.95 2008/06/16 31.21 -139.34 681 A0394 Lotek 2011/08/03 44.82 -126.35 2012/08/15 46.77 -125.22 379 1090269 Wildlife 2011/08/04 44.85 -126.34 2013/06/26 35.23 143.68 693 A0396 Lotek 2011/08/03 44.89 -126.38 2013/06/16 35.25 145.25 684 1090251 Wildlife 2011/08/03 44.80 -126.35 2013/08/24 46.06 -126.41 753 1190241 Wildlife 2011/10/08 46.51 -124.99 2014/09/03 N/A N/A 1061
(N=13)

Daily Estimated Geolocations
West Region Middle Region East Region
(N=11)
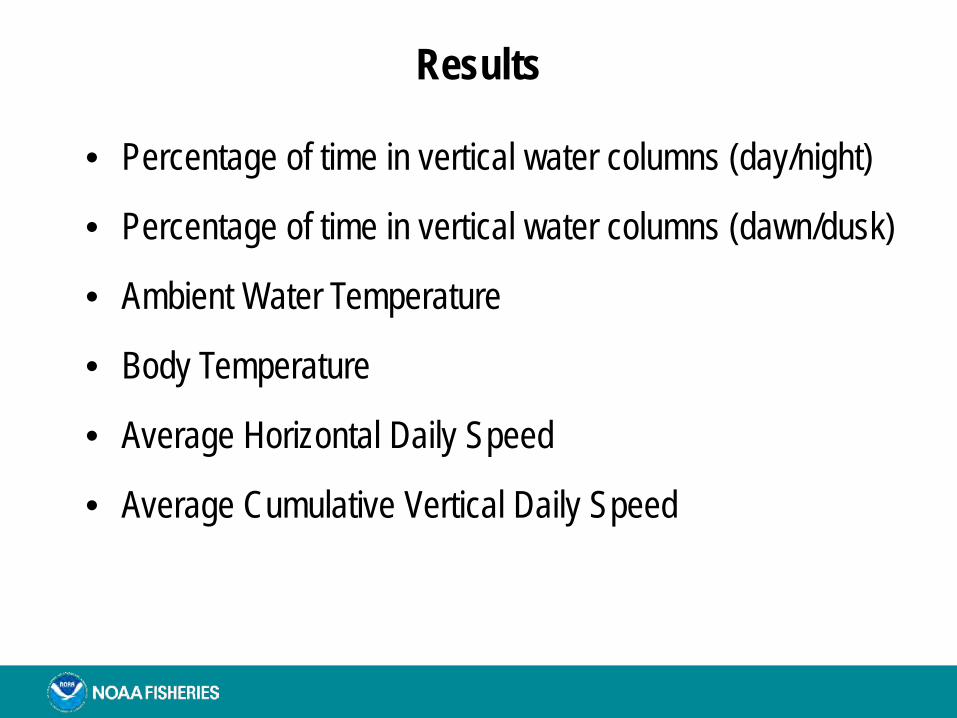
Results
• Percentage of time in vertical water columns (day/night)
• Percentage of time in vertical water columns (dawn/dusk)
• Ambient Water Temperature
• Body Temperature
• Average Horizontal Daily Speed
• Average Cumulative Vertical Daily Speed

n=11
Mean Percentage of Time Spent at Depth during Day/Night
West East Middle

Mean Percentage of Time Spent at Depth during Dawn/Dusk
West Middle East

Ambient Water Temperature
West Middle East
n=10

Body Temperature
West Middle East
n=10

Average Water & Body Temperature
Temperature (°C) Mean±SD
West of 145W (West)
130W to 145W (Middle)
East of 130W (East)
Water (daytime) 15.28±2.00 13.89±2.57 16.67±3.41
Water (nighttime) 16.14±1.57 15.29±1.20 17.41±2.55
Body (daytime) 18.61±1.83 17.05±1.75 19.52±2.30
Body (nighttime) 17.92±1.65 17.07±1.30 18.78±1.69
• The average ambient water temperature is cooler in the middle
region.
• The averaged body temperature in the middle region is cooler than western and eastern region.

Horizontal Daily Speed Region West of 145W (West) 130W to 145W(Middle) East of 130W(East)
Average Horizontal Speed (km/day) Mean±SD 50.45±10.31 80.31±16.40 32.70±8.96
(n=11)

Data Analysis Fit data to generalized linear mixed-effects model (GLME)
Model Formula Intercept Area_mid
Area_ east AIC BIC
Log Likelihood
Deviance Dispersion
All Fish log(speed)~1+area+fish 3.98 0.42 -0.35 10922 11011 -5446.9 10894 0.86
All Fish log(speed)~ 1+area+fish+area:fish
3.99 0.28 -0.34 10811 11028 -5371.6 10743 0.85
All Fish log(speed)~1+area+ (1|fish) 3.75 0.42 -0.35 10946 10977 -5467.8 10936 0.86
All Fish log(speed)~1+area+ (area|fish) 3.78 0.40 -0.41 10857 10921 -5418.7 10837 0.85
All the model showed similar results. Model log(speed)~ 1+area+fish+area:fish shows the minimum AIC and maximum log-likelihood.
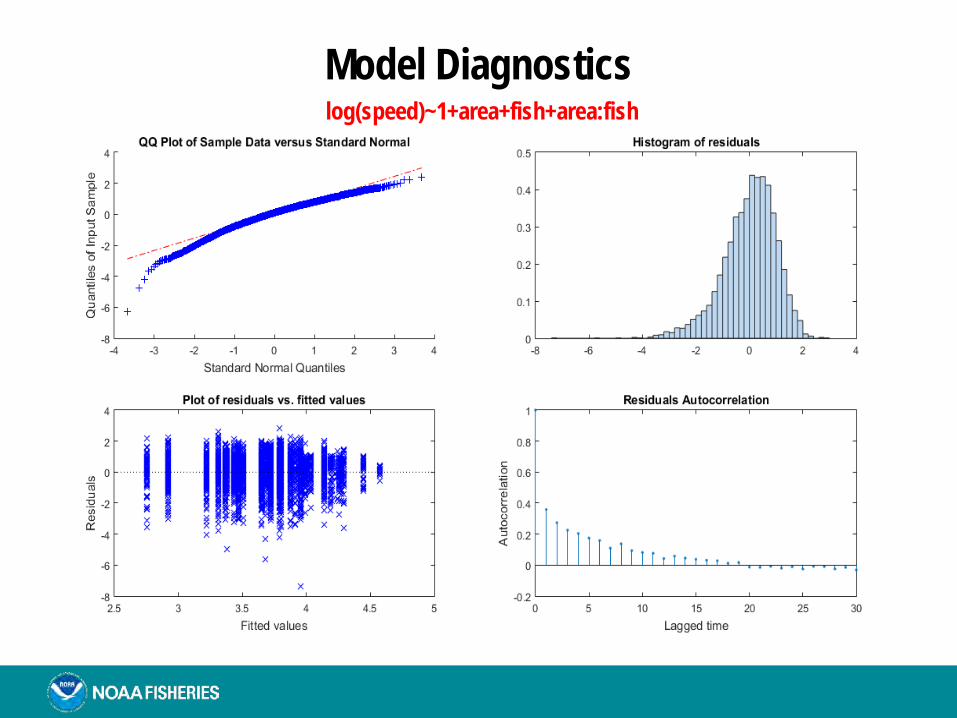
Model Diagnostics log(speed)~1+area+fish+area:fish
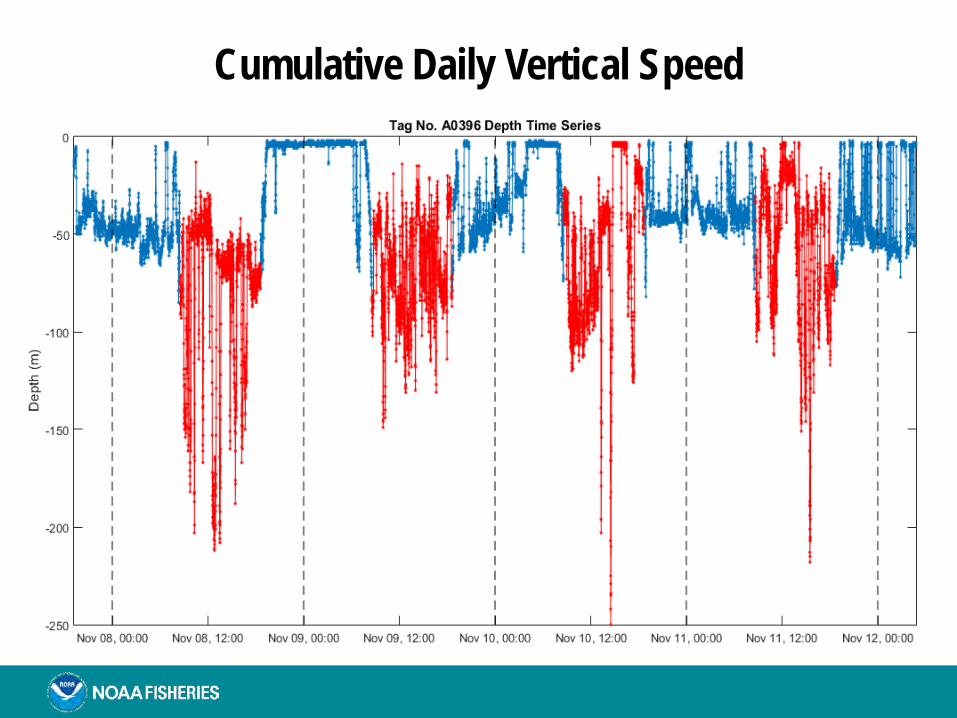
Cumulative Daily Vertical Speed
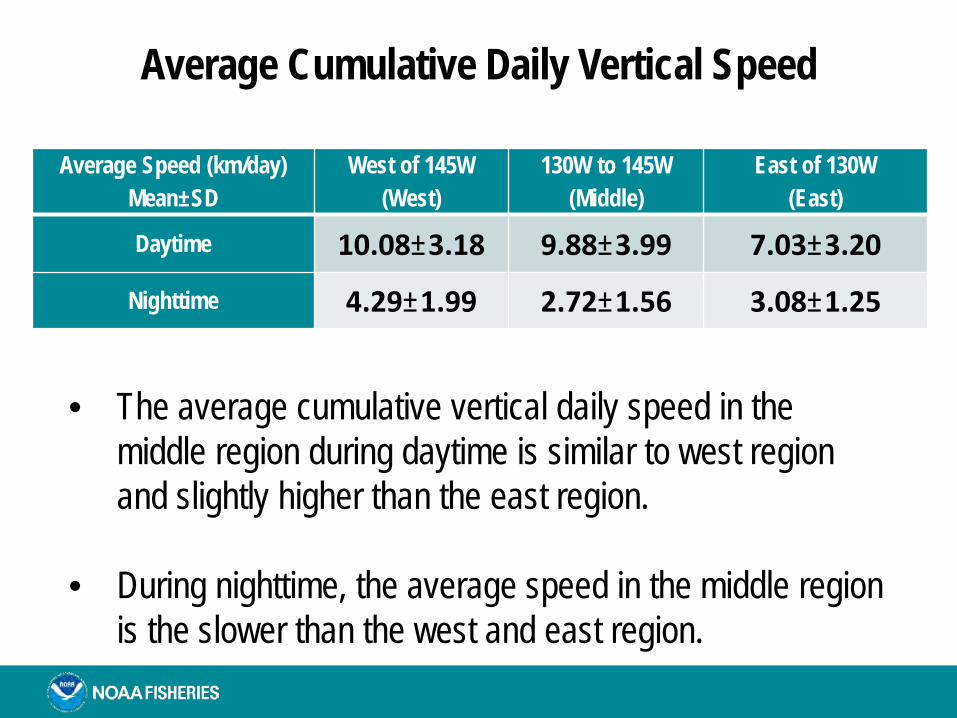
Average Cumulative Daily Vertical Speed
Average Speed (km/day) Mean±SD
West of 145W (West)
130W to 145W (Middle)
East of 130W (East)
Daytime 10.08±3.18 9.88±3.99 7.03±3.20
Nighttime 4.29±1.99 2.72±1.56 3.08±1.25
• The average cumulative vertical daily speed in the middle region during daytime is similar to west region and slightly higher than the east region.
• During nighttime, the average speed in the middle region is the slower than the west and east region.

Summary Middle region characteristics:
• Albacore spent more time in surface waters during night. During daytime, albacore spend more time than the east region, and less time than the west region.
• Ambient water temperature is cooler at night. During daytime, bigger proportion in cold water may due to long distance diving.
• Body and water temperature is cooler both daytime and nighttime. • The horizontal daily speed is faster than west and east region. • Cumulative vertical speed during nighttime is slower.
Future work: • Update geolocation information • Statistical analyses • Publication

Acknowledgement • NOAA-Southwest Fisheries Science Center • National Research Council Research Associate Program • Project funded by NOAA-Fisheries • Travel grant funded by NSF(Dr. Enrique Curchitser)
through PICES • Technical support by Dr. Shangping Xie’s modeling group
at UCSD-SIO
Email: [email protected] PICES 2015 Annual Meeting
Qingdao, China, October 15th, 2015
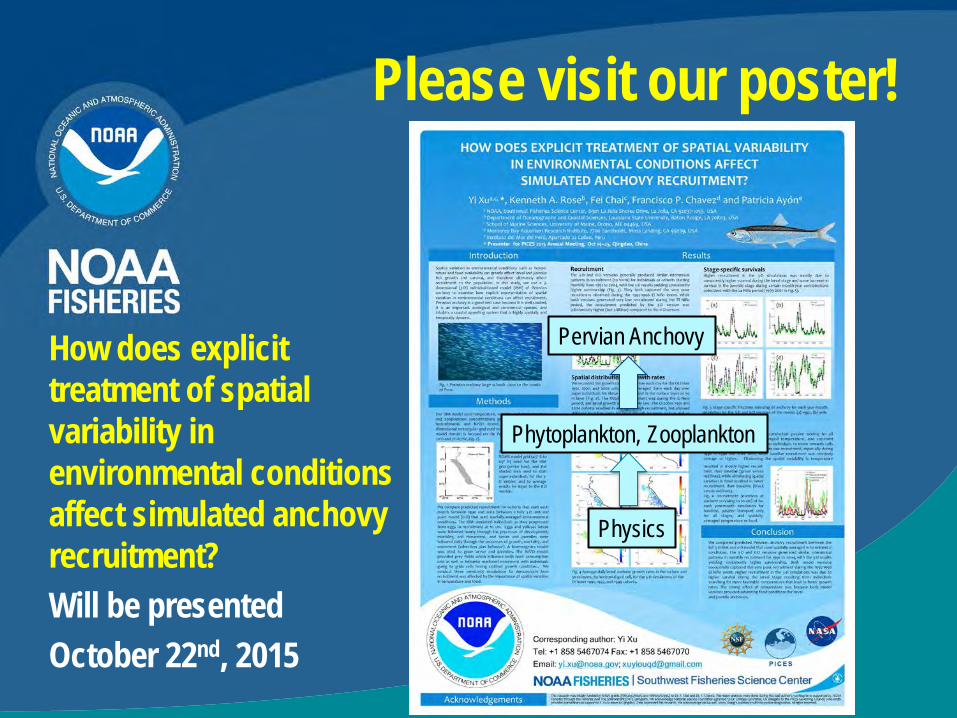
Please visit our poster!
How does explicit treatment of spatial variability in environmental conditions affect simulated anchovy recruitment? Will be presented October 22nd, 2015
Physics
Phytoplankton, Zooplankton
Pervian Anchovy