Medicare: a Single Payer system in “crisis”? A Comparison to other U.S. Health Insurance Systems...
16
Medicare: a Single Payer system in “crisis”? A Comparison to other U.S. Health Insurance Systems Oliver Fein, M.D. Chair, New York Metro Chapter Physicians for a National Health Program Professor of Clinical Medicine and Health Policy Associate Dean (Affiliations) Weill Cornell Medical College ([email protected] ) Workshop PNHP National Meeting New Orleans, LA November 15, 2014
-
Upload
giles-malone -
Category
Documents
-
view
216 -
download
2
Transcript of Medicare: a Single Payer system in “crisis”? A Comparison to other U.S. Health Insurance Systems...
Medicare: a Single Payer system in “crisis”?A Comparison to other U.S. Health Insurance
Systems
Oliver Fein, M.D.
Chair, New York Metro Chapter
Physicians for a National Health Program
Professor of Clinical Medicine and Health Policy
Associate Dean (Affiliations)
Weill Cornell Medical College
Workshop
PNHP National Meeting
New Orleans, LA
November 15, 2014

DISCLOSURES
Dr. Oliver Fein has no relevant financial relationships with commercial interests
Dr. Oliver Fein is Chair of the NY-Metro Chapter and past President of Physicians for a National Health Program (PNHP), a non-profit educational and advocacy organization. He receives no financial compensation from PNHP.

PRESENTATION OUTLINE
1. Macroeconomics of Health Care
2. Medicare in Comparison to other
U.S. Health Insurance Programs
3. Comparing Traditional Medicare
to Medicare Advantage

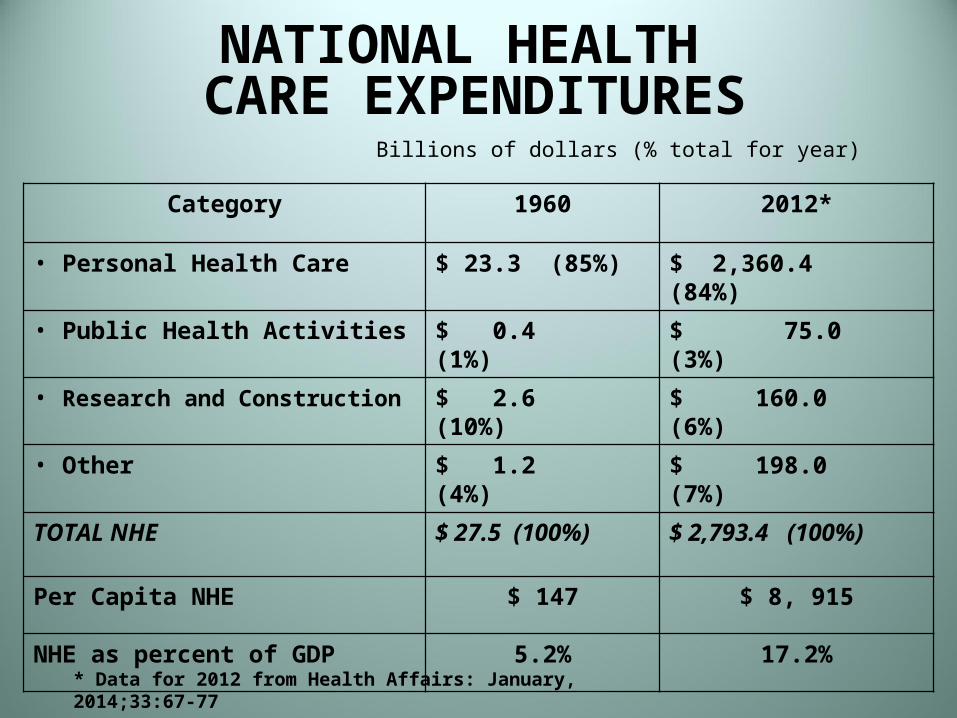
NATIONAL HEALTH CARE EXPENDITURES
Billions of dollars (% total for year)
Category 1960 2012*
• Personal Health Care $ 23.3 (85%) $ 2,360.4 (84%)
• Public Health Activities $ 0.4 (1%) $ 75.0 (3%)
• Research and Construction $ 2.6 (10%) $ 160.0 (6%)
• Other $ 1.2 (4%) $ 198.0 (7%)
TOTAL NHE $ 27.5 (100%) $ 2,793.4 (100%)
Per Capita NHE $ 147 $ 8, 915
NHE as percent of GDP 5.2% 17.2%
* Data for 2012 from Health Affairs: January, 2014;33:67-77
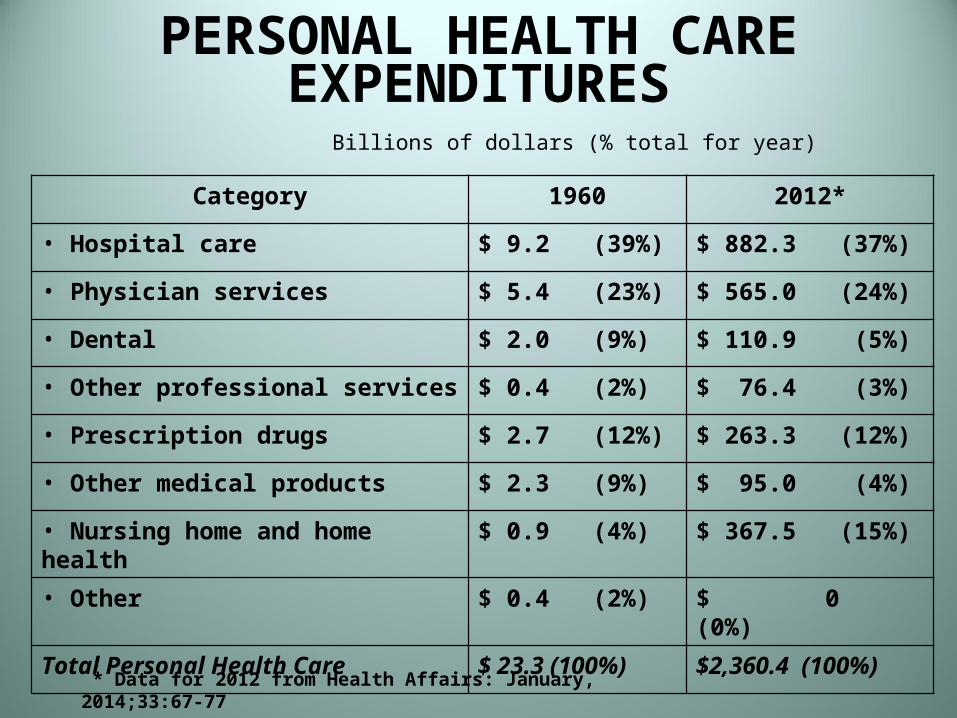
PERSONAL HEALTH CARE EXPENDITURES
Billions of dollars (% total for year)
Category 1960 2012*
• Hospital care $ 9.2 (39%) $ 882.3 (37%)
• Physician services $ 5.4 (23%) $ 565.0 (24%)
• Dental $ 2.0 (9%) $ 110.9 (5%)
• Other professional services $ 0.4 (2%) $ 76.4 (3%)
• Prescription drugs $ 2.7 (12%) $ 263.3 (12%)
• Other medical products $ 2.3 (9%) $ 95.0 (4%)
• Nursing home and home health $ 0.9 (4%) $ 367.5 (15%)
• Other $ 0.4 (2%) $ 0 (0%)
Total Personal Health Care $ 23.3 (100%) $2,360.4 (100%)
* Data for 2012 from Health Affairs: January, 2014;33:67-77

WHO PAYS FOR HEALTH CARE?1
Category Billions of Dollars % of Total
NHE (minus investments - $160B) $ 2,633.4 (100%)
Private Funds $ 882.1 (34%)
Private health insurance $ 553.9 (12%)
Out of pocket payments $ 328.2 (13%)
Public Funds $ 1,751.4 (66%)
Medicare $ 572.5 (22%)
Medicaid $ 421.2 (16%)
Other Federal** $ 103.8 (4%)
Other Federal and State*** $ 290.8 (11%)
Public Employee health benefits $ 167.6 (6%)
Tax Subsidies $ 195.5 (7%)
Tax-Financed ($ per capita) $ 5,590*Data for 2012 from Health Affairs: January, 2014, using the methodology described in Health Affairs 2002;21:88-98
**Includes VA, DOD, CHIP
*** Includes IHS, federal public health, Worker’s Comp., SAMSA, School health, etc.
1 Woolhandler S, Himmelstein, DU. Paying for National Health Insurance—and Not Getting It. Health Affairs. 2002:21;88-98
CONCLUSION #1
We are more than half way to a government financed health care system!
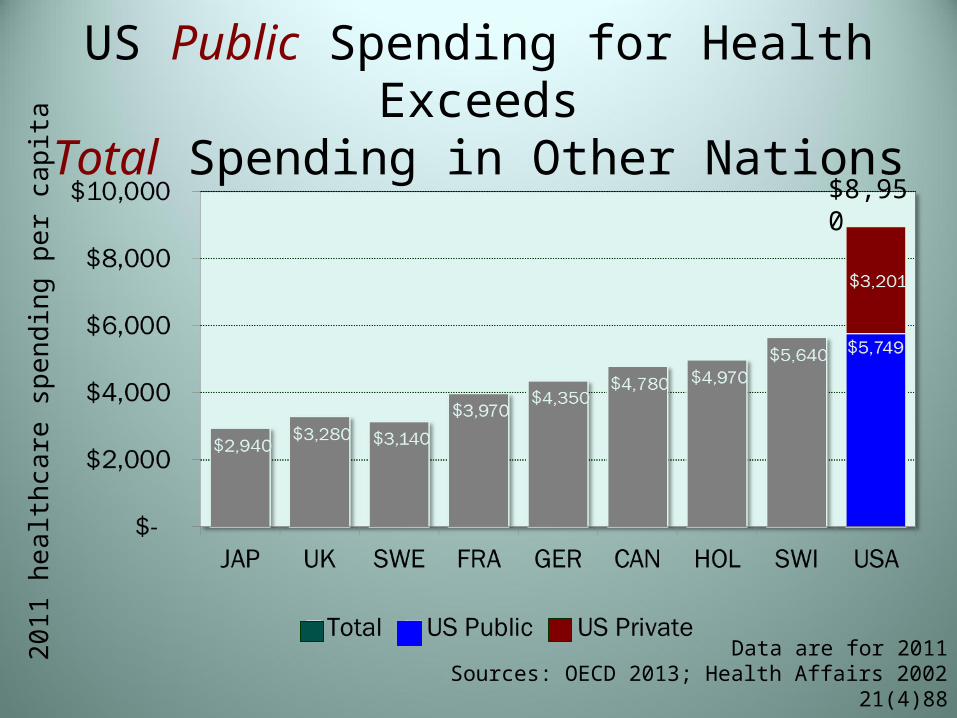
US Public Spending for Health ExceedsTotal Spending in Other Nations
Data are for 2011Sources: OECD 2013; Health Affairs 2002 21(4)88
20
11
healt
hca
re s
pen
din
g p
er
cap
ita
$8,950
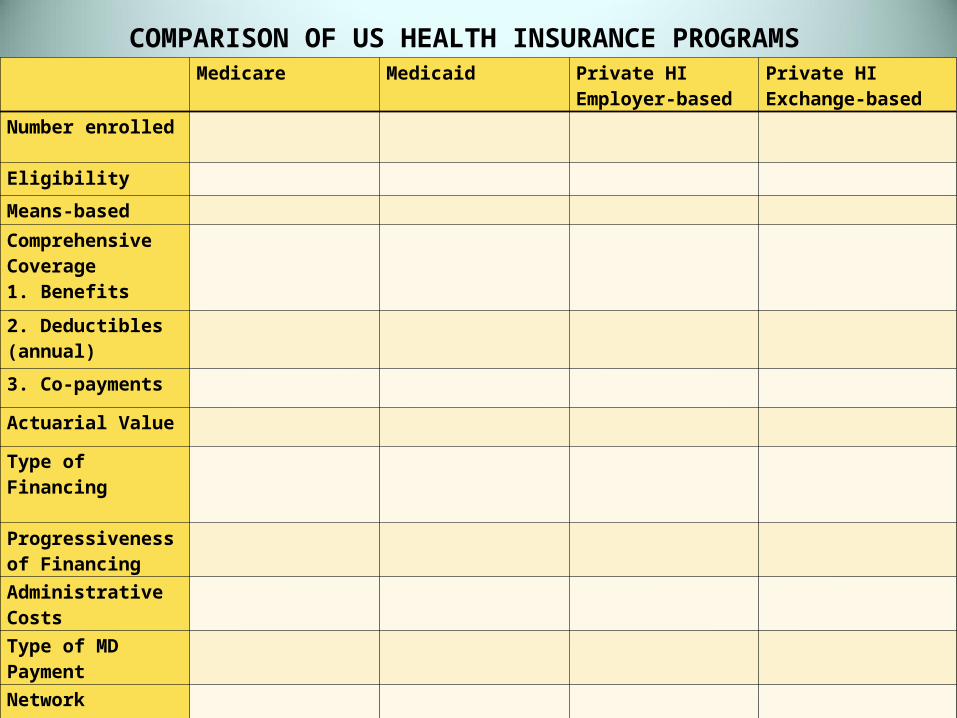
Medicare Medicaid Private HIEmployer-based
Private HIExchange-based
Number enrolled
Eligibility
Means-based
Comprehensive Coverage1. Benefits
2. Deductibles (annual)
3. Co-payments
Actuarial Value
Type of Financing
Progressiveness of Financing
Administrative Costs
Type of MD Payment
Network Narrowness
COMPARISON OF US HEALTH INSURANCE PROGRAMS
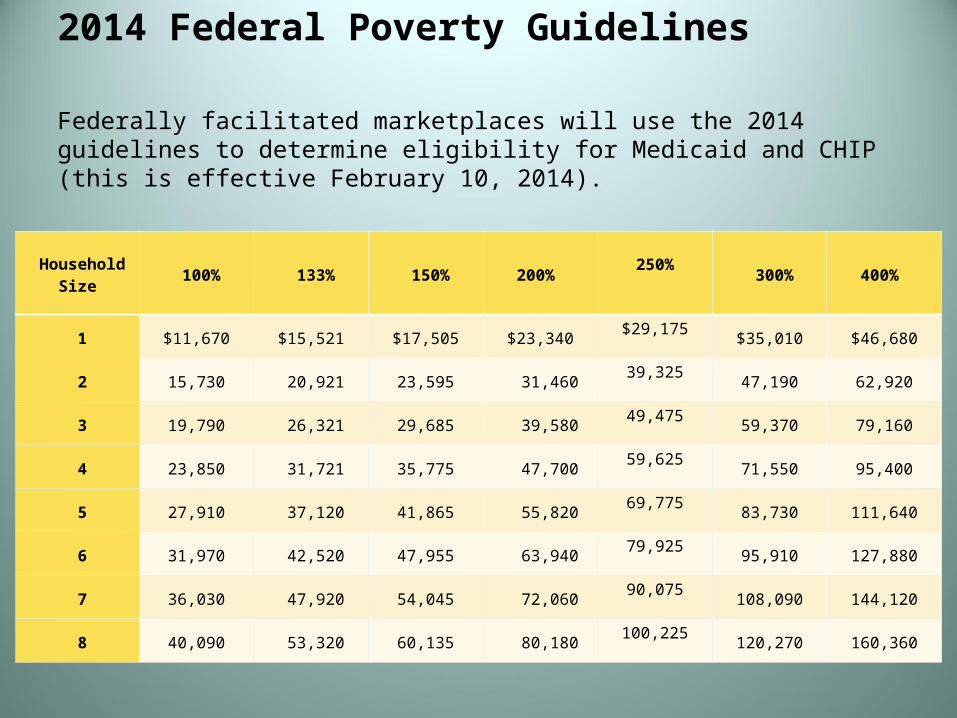
2014 Federal Poverty Guidelines
Federally facilitated marketplaces will use the 2014 guidelines to determine eligibility for Medicaid and CHIP (this is effective February 10, 2014).
Household Size
100% 133% 150% 200% 250%
300% 400%
1 $11,670 $15,521 $17,505 $23,340$29,175
$35,010 $46,680
2 15,730 20,921 23,595 31,46039,325
47,190 62,920
3 19,790 26,321 29,685 39,58049,475
59,370 79,160
4 23,850 31,721 35,775 47,70059,625
71,550 95,400
5 27,910 37,120 41,865 55,82069,775
83,730 111,640
6 31,970 42,520 47,955 63,94079,925
95,910 127,880
7 36,030 47,920 54,045 72,06090,075
108,090 144,120
8 40,090 53,320 60,135 80,180100,225
120,270 160,360
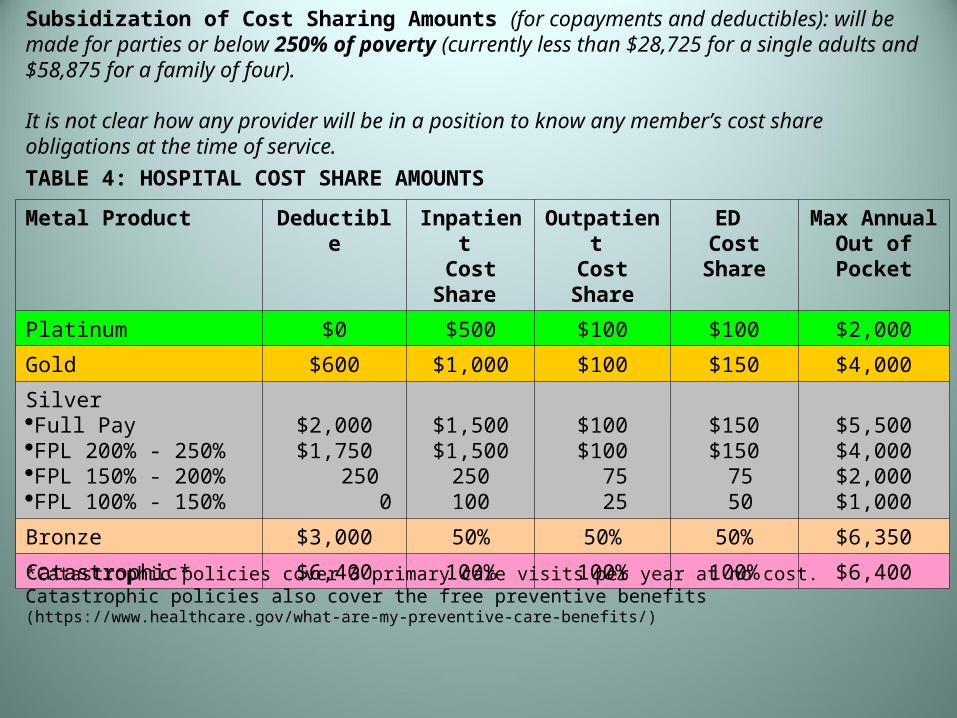
Metal Product Deductible Inpatient Cost
Share
Outpatient Cost Share
ED Cost
Share
Max Annual Out of Pocket
Platinum $0 $500 $100 $100 $2,000
Gold $600 $1,000 $100 $150 $4,000
SilverFull PayFPL 200% - 250%FPL 150% - 200%FPL 100% - 150%
$2,000$1,750 250 0
$1,500$1,500
250100
$100$100 75 25
$150$150 75 50
$5,500$4,000$2,000$1,000
Bronze $3,000 50% 50% 50% $6,350
Catastrophic* $6,400 100% 100% 100% $6,400
TABLE 4: HOSPITAL COST SHARE AMOUNTS
Subsidization of Cost Sharing Amounts (for copayments and deductibles): will be made for parties or below 250% of poverty (currently less than $28,725 for a single adults and $58,875 for a family of four).
It is not clear how any provider will be in a position to know any member’s cost share obligations at the time of service.
*Catastrophic policies cover 3 primary care visits per year at no cost. Catastrophic policies also cover the free preventive benefits (https://www.healthcare.gov/what-are-my-preventive-care-benefits/)

Metal Product Primary Care MD
Specialist MD
Surgeon MD
Platinum $15 $35 $100
Gold $25 $40 $100
SilverFull PayFPL 200% - 250%FPL 150% - 200%FPL 100% - 150%
$30$30$15$10
$50$50$35$20
$100$100$ 75$ 25
Bronze 50% 50% 50%
Catastrophic 100% 100% 100%
TABLE 4A: PHYSICIAN SERVICES COST SHARE AMOUNTS

CONCLUSION #2
U.S. Health Insurance system
is very complex
COMPARISON
• Traditional Medicare
• Medicare Advantage
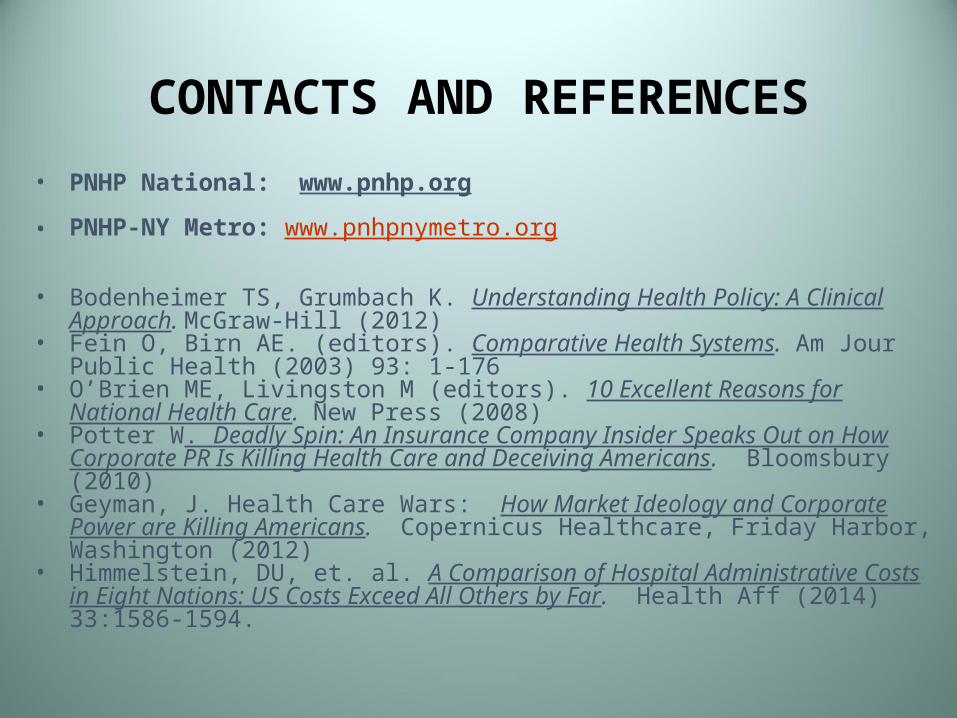
CONTACTS AND REFERENCES
• PNHP National: www.pnhp.org
• PNHP-NY Metro: www.pnhpnymetro.org
• Bodenheimer TS, Grumbach K. Understanding Health Policy: A Clinical Approach. McGraw-Hill (2012)
• Fein O, Birn AE. (editors). Comparative Health Systems. Am Jour Public Health (2003) 93: 1-176
• O’Brien ME, Livingston M (editors). 10 Excellent Reasons for National Health Care. New Press (2008)
• Potter W. Deadly Spin: An Insurance Company Insider Speaks Out on How Corporate PR Is Killing Health Care and Deceiving Americans. Bloomsbury (2010)
• Geyman, J. Health Care Wars: How Market Ideology and Corporate Power are Killing Americans. Copernicus Healthcare, Friday Harbor, Washington (2012)
• Himmelstein, DU, et. al. A Comparison of Hospital Administrative Costs in Eight Nations: US Costs Exceed All Others by Far. Health Aff (2014) 33:1586-1594.