Mass variation in outcome to high production activity in ...
11
Earth Planets Space, 63, 1157–1167, 2011 Mass variation in outcome to high production activity in Kamojang Geothermal Field, Indonesia: A reservoir monitoring with relative and absolute gravimetry Yayan Sofyan 1,2 , Yustin Kamah 3 , Jun Nishijima 4 , Yasuhiro Fujimitsu 4 , Sachio Ehara 4 , Yoichi Fukuda 5 , and Makoto Taniguchi 6 1 Aso Volcanological Laboratory, Graduate School of Science, Kyoto University, Minami Aso, Aso, Kumamoto 869-1404, Japan 2 Department of Physics, Faculty of Mathematics and Natural Sciences, University of Indonesia, Depok, Indonesia 3 PERTAMINA, Indonesia 4 Department of Earth Resources Engineering, Faculty of Engineering, Kyushu University, 744 Motooka, Nishi-ku, Fukuoka 819-0395, Japan 5 Graduate School of Science, Kyoto University, Kitashirakawa, Oiwake-cho, Kyoto 606-8502, Japan 6 Research Institute for Humanity and Nature (RIHN) (Received March 2, 2011; Revised June 27, 2011; Accepted July 8, 2011; Online published February 14, 2012) The Kamojang Geothermal Field (KGF) is a typical vapor dominated hydrothermal system in west Java, Indonesia. This geothermal eld is the oldest exploited geothermal eld in Indonesia. From 1983 to 2005, more than 160 million tons of steam has been exploited from the KGF and more than 30 million tons of condensed water and river water were injected to the reservoir system. Regarding to the electricity demand, installed capacity of KGF increased from 30 MWe to 140 MWe in 1987 and 200 MWe in 2007. Mass variation in the geothermal reservoir can be measured by using the map of the gravity changes. Gravity changes observed in the KGF between 1999 and 2005 at 51 benchmarks are interpreted in terms of a change of mass. Concerning to the production mass increase, gravity changes also observed between 1999 and 2008 at 30 benchmarks. The recent gravity measurement was conducted using absolute gravimeter in 2009 and 2010 at 12 gravity benchmarks. Mass variation in the reservoir was caused by production and injection activities. Mass variation in KGF from 1999 to 2005 is about −3.34 Mt/year while is about −3.78 Mt/year from 1999 to 2008. Another period between 2009 and 2010, mass variation decreased about −8.24 Mt. According to the history of production and injection, natural recharge to the KGF’s reservoir is estimated at about 2.77 Mt/year from 1999 to 2005 and 2.75 Mt/year from 1999 to 2008. Between 2009 and 2010, KGF has a bigger mass de ciency rate throughout 200 MWe maintain production. Key words: Mass variation, gravity changes, Kamojang Geothermal Field, Indonesia. 1. Introduction Kamojang Geothermal Field in the Garut region of west Java, about 40 km from the city of Bandung, is a vapor- dominated system with a reservoir depth of about 600 to 2000 m. The KGF is located on the geographical coordinate of 07 ◦ 11 02 –07 ◦ 06 08 S and 107 ◦ 44 36 –107 ◦ 49 30 E. The Kamojang geothermal system resulted from the com- plex interaction between active volcanoes and tectonic pro- cesses and it is in uenced by two important faults named the Kendang fault and the Citepus fault (Sudarman et al., 1995; Kamah et al., 2005). The area of the KGF is about 21 km 2 and it has altitude of about 1400–1800 m above sea level (Fig. 1). The Kamojang geothermal reservoir is cov- ered by the cap rock that consists of prophylitic altered vol- canic rock of which thickness is about 500–600 m but seems to be only 200–300 m thick toward to the northern and eastern parts. The productive geothermal reservoir, which has high porosity, high permeability, high temperature, and Copyright c The Society of Geomagnetism and Earth, Planetary and Space Sci- ences (SGEPSS); The Seismological Society of Japan; The Volcanological Society of Japan; The Geodetic Society of Japan; The Japanese Society for Planetary Sci- ences; TERRAPUB. doi:10.5047/eps.2011.07.005 lled with suf cient steam, is located between 600–2000 m in depth. Reservoir consists of the strongly altered andesitic rocks and some volcanic pyroclastics (Sumintadireja et al., 2000). Geothermal exploration in the KGF has begun in the early 20th century by The Dutch. In the 1920, the shal- low test wells at Kamojang were drilled successfully. The rst electrical power at Kamojang was generated in 1978 when a small (mono block 250 kWe), free exhaust-type tur- bine was installed and then the design of the rst large-scale geothermal power plant was completed in 1979 (Hochstein and Sudarman, 2008). In late 1982, production of 30 MWe (Unit I) was started in KGF. Development drilling contin- ued and two 55 MWe units (Units II and III) were added in 1987. In the end of 2007, a 60 MWe (unit IV) was added to complete a 200 MWe installed capacity in KGF (Sofyan et al., 2010). Pertamina has drilled wells with bottom holes temperatures ranging from 115 to 245 ◦ C (Moeljanto, 2004). The three to ve deep unproductive wells, situated in the center of the eld, have been used as injection wells. Con- cerning to the evaluation of the steam production in the KGF, the decline of steam ow rate notably occurred at some production wells. Doddy et al. (2000) explained the 1157
Transcript of Mass variation in outcome to high production activity in ...
Earth Planets Space, 63, 1157–1167, 2011
Mass variation in outcome to high production activity in KamojangGeothermal Field, Indonesia: A reservoir monitoring
with relative and absolute gravimetry
Yayan Sofyan1,2, Yustin Kamah3, Jun Nishijima4, Yasuhiro Fujimitsu4, Sachio Ehara4, Yoichi Fukuda5, and Makoto Taniguchi6
1Aso Volcanological Laboratory, Graduate School of Science, Kyoto University, Minami Aso, Aso, Kumamoto 869-1404, Japan2Department of Physics, Faculty of Mathematics and Natural Sciences, University of Indonesia, Depok, Indonesia
3PERTAMINA, Indonesia4Department of Earth Resources Engineering, Faculty of Engineering, Kyushu University,
744 Motooka, Nishi-ku, Fukuoka 819-0395, Japan5Graduate School of Science, Kyoto University, Kitashirakawa, Oiwake-cho, Kyoto 606-8502, Japan
6Research Institute for Humanity and Nature (RIHN)
(Received March 2, 2011; Revised June 27, 2011; Accepted July 8, 2011; Online published February 14, 2012)
The Kamojang Geothermal Field (KGF) is a typical vapor dominated hydrothermal system in west Java,Indonesia. This geothermal eld is the oldest exploited geothermal eld in Indonesia. From 1983 to 2005, morethan 160 million tons of steam has been exploited from the KGF and more than 30 million tons of condensedwater and river water were injected to the reservoir system. Regarding to the electricity demand, installed capacityof KGF increased from 30 MWe to 140 MWe in 1987 and 200 MWe in 2007. Mass variation in the geothermalreservoir can be measured by using the map of the gravity changes. Gravity changes observed in the KGFbetween 1999 and 2005 at 51 benchmarks are interpreted in terms of a change of mass. Concerning to theproduction mass increase, gravity changes also observed between 1999 and 2008 at 30 benchmarks. The recentgravity measurement was conducted using absolute gravimeter in 2009 and 2010 at 12 gravity benchmarks. Massvariation in the reservoir was caused by production and injection activities. Mass variation in KGF from 1999 to2005 is about −3.34 Mt/year while is about −3.78 Mt/year from 1999 to 2008. Another period between 2009 and2010, mass variation decreased about −8.24 Mt. According to the history of production and injection, naturalrecharge to the KGF’s reservoir is estimated at about 2.77 Mt/year from 1999 to 2005 and 2.75 Mt/year from1999 to 2008. Between 2009 and 2010, KGF has a bigger mass de ciency rate throughout 200 MWe maintainproduction.Key words: Mass variation, gravity changes, Kamojang Geothermal Field, Indonesia.
1. IntroductionKamojang Geothermal Field in the Garut region of west
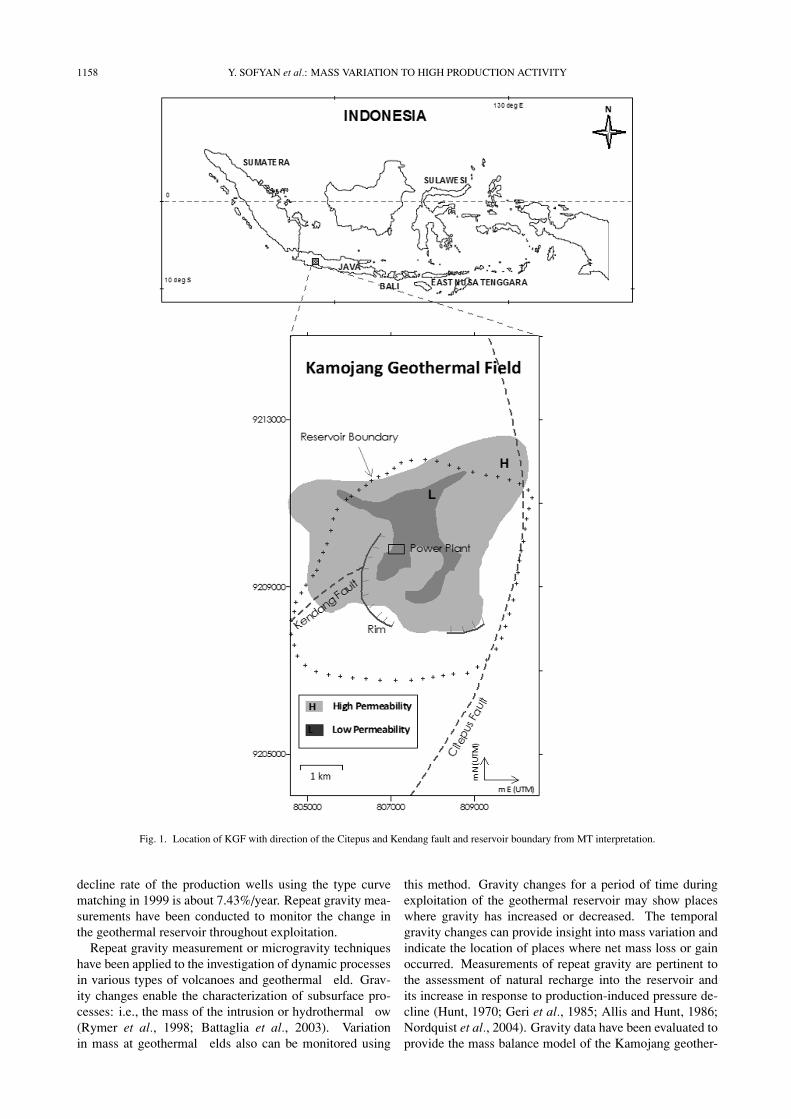
Java, about 40 km from the city of Bandung, is a vapor-dominated system with a reservoir depth of about 600 to2000 m. The KGF is located on the geographical coordinateof 07◦11′02′′–07◦06′08′′S and 107◦44′36′′–107◦49′30′′E.The Kamojang geothermal system resulted from the com-plex interaction between active volcanoes and tectonic pro-cesses and it is in uenced by two important faults namedthe Kendang fault and the Citepus fault (Sudarman et al.,1995; Kamah et al., 2005). The area of the KGF is about21 km2 and it has altitude of about 1400–1800 m above sealevel (Fig. 1). The Kamojang geothermal reservoir is cov-ered by the cap rock that consists of prophylitic altered vol-canic rock of which thickness is about 500–600 m but seemsto be only 200–300 m thick toward to the northern andeastern parts. The productive geothermal reservoir, whichhas high porosity, high permeability, high temperature, and
Copyright c© The Society of Geomagnetism and Earth, Planetary and Space Sci-ences (SGEPSS); The Seismological Society of Japan; The Volcanological Societyof Japan; The Geodetic Society of Japan; The Japanese Society for Planetary Sci-ences; TERRAPUB.
doi:10.5047/eps.2011.07.005
lled with suf cient steam, is located between 600–2000 min depth. Reservoir consists of the strongly altered andesiticrocks and some volcanic pyroclastics (Sumintadireja et al.,2000).
Geothermal exploration in the KGF has begun in theearly 20th century by The Dutch. In the 1920, the shal-low test wells at Kamojang were drilled successfully. The
rst electrical power at Kamojang was generated in 1978when a small (mono block 250 kWe), free exhaust-type tur-bine was installed and then the design of the rst large-scalegeothermal power plant was completed in 1979 (Hochsteinand Sudarman, 2008). In late 1982, production of 30 MWe(Unit I) was started in KGF. Development drilling contin-ued and two 55 MWe units (Units II and III) were added in1987. In the end of 2007, a 60 MWe (unit IV) was addedto complete a 200 MWe installed capacity in KGF (Sofyanet al., 2010). Pertamina has drilled wells with bottom holestemperatures ranging from 115 to 245◦C (Moeljanto, 2004).The three to ve deep unproductive wells, situated in thecenter of the eld, have been used as injection wells. Con-cerning to the evaluation of the steam production in theKGF, the decline of steam ow rate notably occurred atsome production wells. Doddy et al. (2000) explained the
1157
1158 Y. SOFYAN et al.: MASS VARIATION TO HIGH PRODUCTION ACTIVITY
Fig. 1. Location of KGF with direction of the Citepus and Kendang fault and reservoir boundary from MT interpretation.
decline rate of the production wells using the type curvematching in 1999 is about 7.43%/year. Repeat gravity mea-surements have been conducted to monitor the change inthe geothermal reservoir throughout exploitation.
Repeat gravity measurement or microgravity techniqueshave been applied to the investigation of dynamic processesin various types of volcanoes and geothermal eld. Grav-ity changes enable the characterization of subsurface pro-cesses: i.e., the mass of the intrusion or hydrothermal ow(Rymer et al., 1998; Battaglia et al., 2003). Variationin mass at geothermal elds also can be monitored using
this method. Gravity changes for a period of time duringexploitation of the geothermal reservoir may show placeswhere gravity has increased or decreased. The temporalgravity changes can provide insight into mass variation andindicate the location of places where net mass loss or gainoccurred. Measurements of repeat gravity are pertinent tothe assessment of natural recharge into the reservoir andits increase in response to production-induced pressure de-cline (Hunt, 1970; Geri et al., 1985; Allis and Hunt, 1986;Nordquist et al., 2004). Gravity data have been evaluated toprovide the mass balance model of the Kamojang geother-
Y. SOFYAN et al.: MASS VARIATION TO HIGH PRODUCTION ACTIVITY 1159
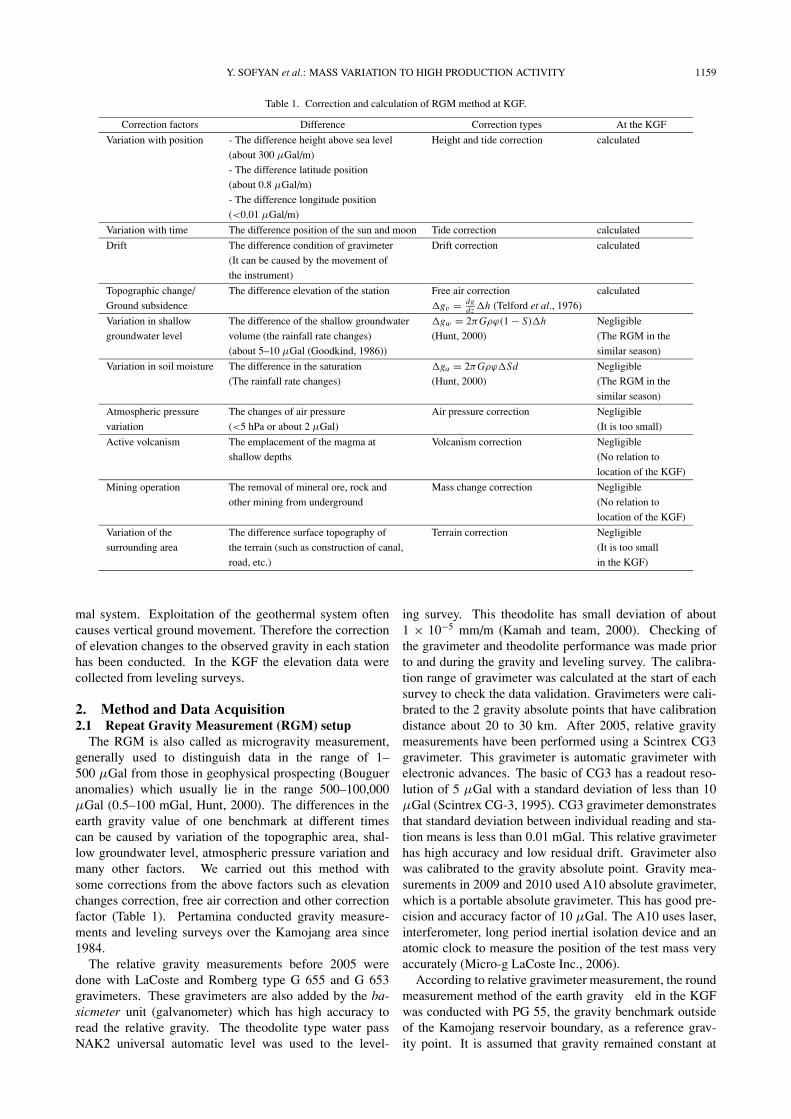
Table 1. Correction and calculation of RGM method at KGF.
Correction factors Difference Correction types At the KGF
Variation with position - The difference height above sea level Height and tide correction calculated
(about 300 μGal/m)
- The difference latitude position
(about 0.8 μGal/m)
- The difference longitude position
(<0.01 μGal/m)
Variation with time The difference position of the sun and moon Tide correction calculated
Drift The difference condition of gravimeter Drift correction calculated
(It can be caused by the movement of
the instrument)
Topographic change/ The difference elevation of the station Free air correction calculated
Ground subsidence �gv = dgdz �h (Telford et al., 1976)
Variation in shallow The difference of the shallow groundwater �gw = 2πGρϕ(1 − S)�h Negligible
groundwater level volume (the rainfall rate changes) (Hunt, 2000) (The RGM in the
(about 5–10 μGal (Goodkind, 1986)) similar season)
Variation in soil moisture The difference in the saturation �ga = 2πGρϕ�Sd Negligible
(The rainfall rate changes) (Hunt, 2000) (The RGM in the
similar season)
Atmospheric pressure The changes of air pressure Air pressure correction Negligible
variation (<5 hPa or about 2 μGal) (It is too small)
Active volcanism The emplacement of the magma at Volcanism correction Negligible
shallow depths (No relation to
location of the KGF)
Mining operation The removal of mineral ore, rock and Mass change correction Negligible
other mining from underground (No relation to
location of the KGF)
Variation of the The difference surface topography of Terrain correction Negligible
surrounding area the terrain (such as construction of canal, (It is too small
road, etc.) in the KGF)
mal system. Exploitation of the geothermal system oftencauses vertical ground movement. Therefore the correctionof elevation changes to the observed gravity in each stationhas been conducted. In the KGF the elevation data werecollected from leveling surveys.
2. Method and Data Acquisition2.1 Repeat Gravity Measurement (RGM) setup
The RGM is also called as microgravity measurement,generally used to distinguish data in the range of 1–500 μGal from those in geophysical prospecting (Bougueranomalies) which usually lie in the range 500–100,000μGal (0.5–100 mGal, Hunt, 2000). The differences in theearth gravity value of one benchmark at different timescan be caused by variation of the topographic area, shal-low groundwater level, atmospheric pressure variation andmany other factors. We carried out this method withsome corrections from the above factors such as elevationchanges correction, free air correction and other correctionfactor (Table 1). Pertamina conducted gravity measure-ments and leveling surveys over the Kamojang area since1984.
The relative gravity measurements before 2005 weredone with LaCoste and Romberg type G 655 and G 653gravimeters. These gravimeters are also added by the ba-sicmeter unit (galvanometer) which has high accuracy toread the relative gravity. The theodolite type water passNAK2 universal automatic level was used to the level-
ing survey. This theodolite has small deviation of about1 × 10−5 mm/m (Kamah and team, 2000). Checking ofthe gravimeter and theodolite performance was made priorto and during the gravity and leveling survey. The calibra-tion range of gravimeter was calculated at the start of eachsurvey to check the data validation. Gravimeters were cali-brated to the 2 gravity absolute points that have calibrationdistance about 20 to 30 km. After 2005, relative gravitymeasurements have been performed using a Scintrex CG3gravimeter. This gravimeter is automatic gravimeter withelectronic advances. The basic of CG3 has a readout reso-lution of 5 μGal with a standard deviation of less than 10μGal (Scintrex CG-3, 1995). CG3 gravimeter demonstratesthat standard deviation between individual reading and sta-tion means is less than 0.01 mGal. This relative gravimeterhas high accuracy and low residual drift. Gravimeter alsowas calibrated to the gravity absolute point. Gravity mea-surements in 2009 and 2010 used A10 absolute gravimeter,which is a portable absolute gravimeter. This has good pre-cision and accuracy factor of 10 μGal. The A10 uses laser,interferometer, long period inertial isolation device and anatomic clock to measure the position of the test mass veryaccurately (Micro-g LaCoste Inc., 2006).
According to relative gravimeter measurement, the roundmeasurement method of the earth gravity eld in the KGFwas conducted with PG 55, the gravity benchmark outsideof the Kamojang reservoir boundary, as a reference grav-ity point. It is assumed that gravity remained constant at
1160 Y. SOFYAN et al.: MASS VARIATION TO HIGH PRODUCTION ACTIVITY
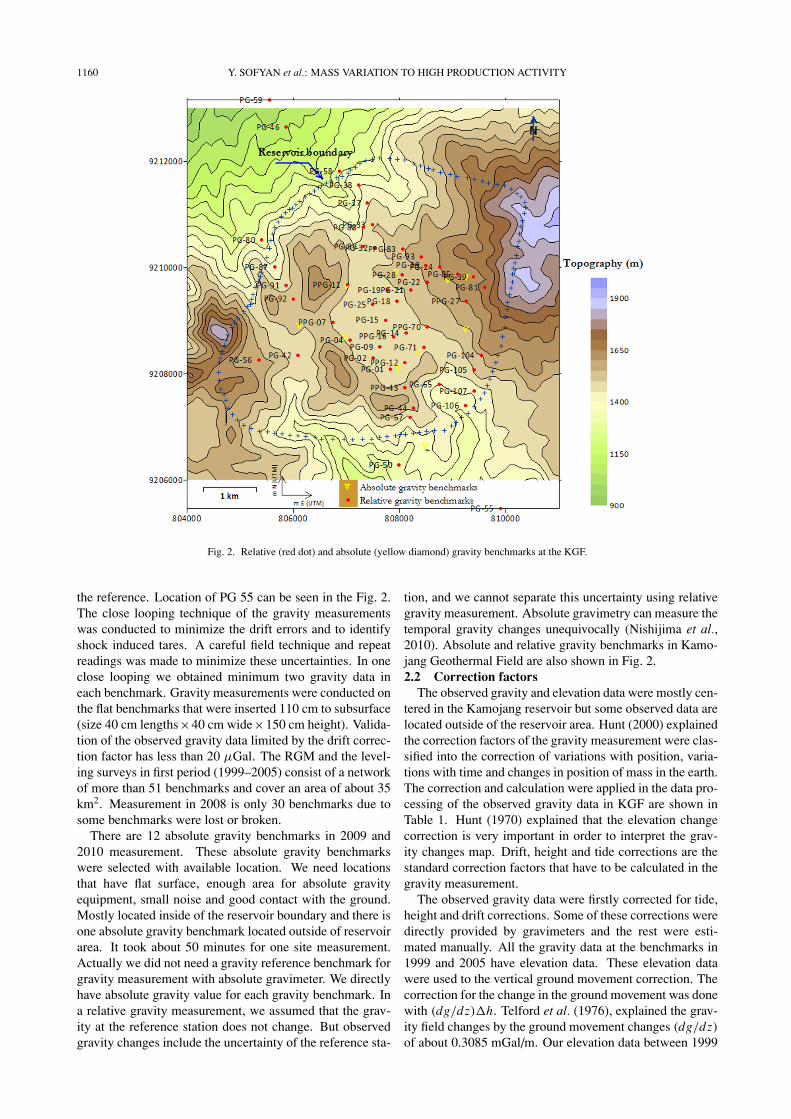
Fig. 2. Relative (red dot) and absolute (yellow diamond) gravity benchmarks at the KGF.
the reference. Location of PG 55 can be seen in the Fig. 2.The close looping technique of the gravity measurementswas conducted to minimize the drift errors and to identifyshock induced tares. A careful field technique and repeatreadings was made to minimize these uncertainties. In oneclose looping we obtained minimum two gravity data ineach benchmark. Gravity measurements were conducted onthe flat benchmarks that were inserted 110 cm to subsurface(size 40 cm lengths×40 cm wide×150 cm height). Valida-tion of the observed gravity data limited by the drift correc-tion factor has less than 20 μGal. The RGM and the level-ing surveys in first period (1999–2005) consist of a networkof more than 51 benchmarks and cover an area of about 35km2. Measurement in 2008 is only 30 benchmarks due tosome benchmarks were lost or broken.
There are 12 absolute gravity benchmarks in 2009 and2010 measurement. These absolute gravity benchmarkswere selected with available location. We need locationsthat have flat surface, enough area for absolute gravityequipment, small noise and good contact with the ground.Mostly located inside of the reservoir boundary and there isone absolute gravity benchmark located outside of reservoirarea. It took about 50 minutes for one site measurement.Actually we did not need a gravity reference benchmark forgravity measurement with absolute gravimeter. We directlyhave absolute gravity value for each gravity benchmark. Ina relative gravity measurement, we assumed that the grav-ity at the reference station does not change. But observedgravity changes include the uncertainty of the reference sta-
tion, and we cannot separate this uncertainty using relativegravity measurement. Absolute gravimetry can measure thetemporal gravity changes unequivocally (Nishijima et al.,2010). Absolute and relative gravity benchmarks in Kamo-jang Geothermal Field are also shown in Fig. 2.2.2 Correction factors
The observed gravity and elevation data were mostly cen-tered in the Kamojang reservoir but some observed data arelocated outside of the reservoir area. Hunt (2000) explainedthe correction factors of the gravity measurement were clas-sified into the correction of variations with position, varia-tions with time and changes in position of mass in the earth.The correction and calculation were applied in the data pro-cessing of the observed gravity data in KGF are shown inTable 1. Hunt (1970) explained that the elevation changecorrection is very important in order to interpret the grav-ity changes map. Drift, height and tide corrections are thestandard correction factors that have to be calculated in thegravity measurement.
The observed gravity data were firstly corrected for tide,height and drift corrections. Some of these corrections weredirectly provided by gravimeters and the rest were esti-mated manually. All the gravity data at the benchmarks in1999 and 2005 have elevation data. These elevation datawere used to the vertical ground movement correction. Thecorrection for the change in the ground movement was donewith (dg/dz)�h. Telford et al. (1976), explained the grav-ity field changes by the ground movement changes (dg/dz)of about 0.3085 mGal/m. Our elevation data between 1999
Y. SOFYAN et al.: MASS VARIATION TO HIGH PRODUCTION ACTIVITY 1161
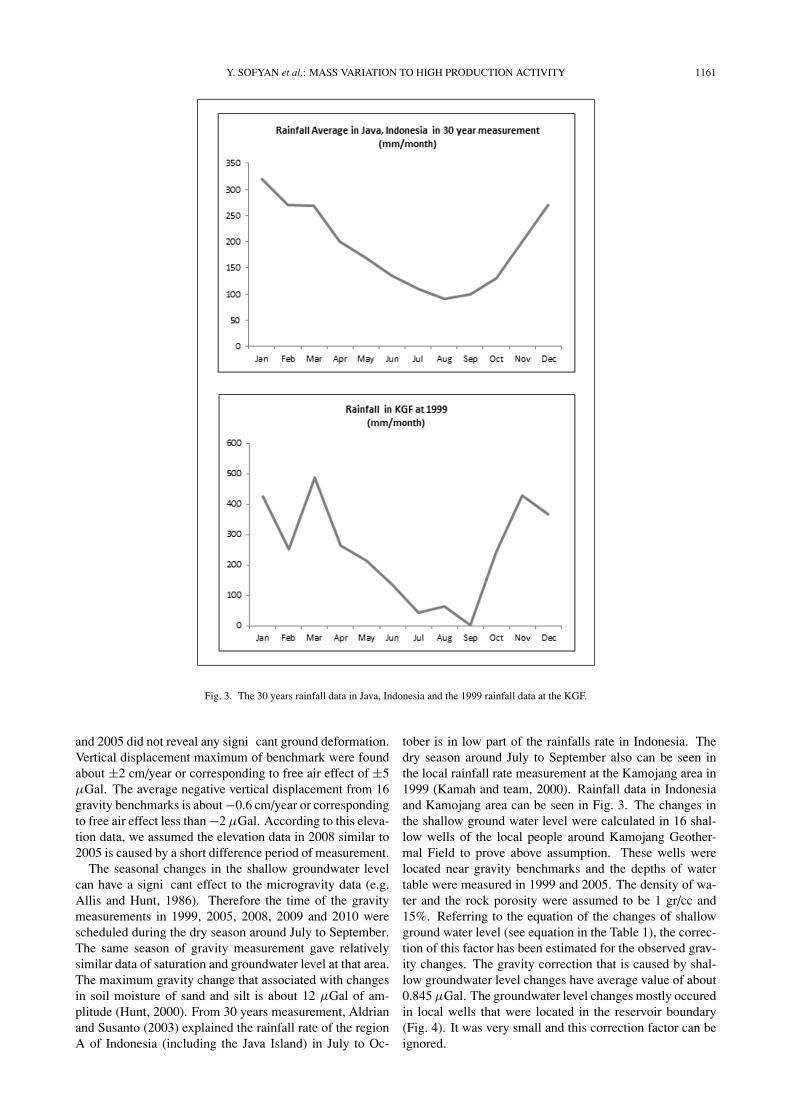
Fig. 3. The 30 years rainfall data in Java, Indonesia and the 1999 rainfall data at the KGF.
and 2005 did not reveal any signi cant ground deformation.Vertical displacement maximum of benchmark were foundabout ±2 cm/year or corresponding to free air effect of ±5μGal. The average negative vertical displacement from 16gravity benchmarks is about −0.6 cm/year or correspondingto free air effect less than −2 μGal. According to this eleva-tion data, we assumed the elevation data in 2008 similar to2005 is caused by a short difference period of measurement.
The seasonal changes in the shallow groundwater levelcan have a signi cant effect to the microgravity data (e.g.Allis and Hunt, 1986). Therefore the time of the gravitymeasurements in 1999, 2005, 2008, 2009 and 2010 werescheduled during the dry season around July to September.The same season of gravity measurement gave relativelysimilar data of saturation and groundwater level at that area.The maximum gravity change that associated with changesin soil moisture of sand and silt is about 12 μGal of am-plitude (Hunt, 2000). From 30 years measurement, Aldrianand Susanto (2003) explained the rainfall rate of the regionA of Indonesia (including the Java Island) in July to Oc-
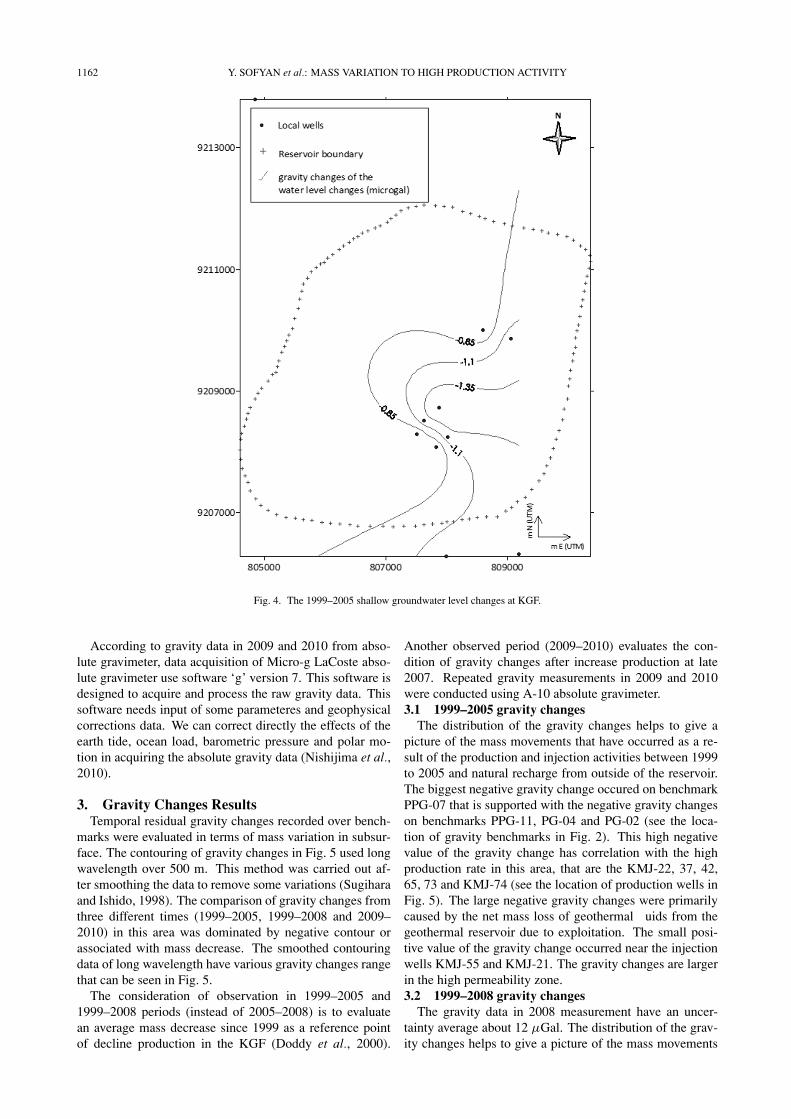
tober is in low part of the rainfalls rate in Indonesia. Thedry season around July to September also can be seen inthe local rainfall rate measurement at the Kamojang area in1999 (Kamah and team, 2000). Rainfall data in Indonesiaand Kamojang area can be seen in Fig. 3. The changes inthe shallow ground water level were calculated in 16 shal-low wells of the local people around Kamojang Geother-mal Field to prove above assumption. These wells werelocated near gravity benchmarks and the depths of watertable were measured in 1999 and 2005. The density of wa-ter and the rock porosity were assumed to be 1 gr/cc and15%. Referring to the equation of the changes of shallowground water level (see equation in the Table 1), the correc-tion of this factor has been estimated for the observed grav-ity changes. The gravity correction that is caused by shal-low groundwater level changes have average value of about0.845 μGal. The groundwater level changes mostly occuredin local wells that were located in the reservoir boundary(Fig. 4). It was very small and this correction factor can beignored.
1162 Y. SOFYAN et al.: MASS VARIATION TO HIGH PRODUCTION ACTIVITY
Fig. 4. The 1999–2005 shallow groundwater level changes at KGF.
According to gravity data in 2009 and 2010 from abso-lute gravimeter, data acquisition of Micro-g LaCoste abso-lute gravimeter use software ‘g’ version 7. This software isdesigned to acquire and process the raw gravity data. Thissoftware needs input of some parameteres and geophysicalcorrections data. We can correct directly the effects of theearth tide, ocean load, barometric pressure and polar mo-tion in acquiring the absolute gravity data (Nishijima et al.,2010).
3. Gravity Changes ResultsTemporal residual gravity changes recorded over bench-
marks were evaluated in terms of mass variation in subsur-face. The contouring of gravity changes in Fig. 5 used longwavelength over 500 m. This method was carried out af-ter smoothing the data to remove some variations (Sugiharaand Ishido, 1998). The comparison of gravity changes fromthree different times (1999–2005, 1999–2008 and 2009–2010) in this area was dominated by negative contour orassociated with mass decrease. The smoothed contouringdata of long wavelength have various gravity changes rangethat can be seen in Fig. 5.
The consideration of observation in 1999–2005 and1999–2008 periods (instead of 2005–2008) is to evaluatean average mass decrease since 1999 as a reference pointof decline production in the KGF (Doddy et al., 2000).
Another observed period (2009–2010) evaluates the con-dition of gravity changes after increase production at late2007. Repeated gravity measurements in 2009 and 2010were conducted using A-10 absolute gravimeter.3.1 1999–2005 gravity changes
The distribution of the gravity changes helps to give apicture of the mass movements that have occurred as a re-sult of the production and injection activities between 1999to 2005 and natural recharge from outside of the reservoir.The biggest negative gravity change occured on benchmarkPPG-07 that is supported with the negative gravity changeson benchmarks PPG-11, PG-04 and PG-02 (see the loca-tion of gravity benchmarks in Fig. 2). This high negativevalue of the gravity change has correlation with the highproduction rate in this area, that are the KMJ-22, 37, 42,65, 73 and KMJ-74 (see the location of production wells inFig. 5). The large negative gravity changes were primarilycaused by the net mass loss of geothermal uids from thegeothermal reservoir due to exploitation. The small posi-tive value of the gravity change occurred near the injectionwells KMJ-55 and KMJ-21. The gravity changes are largerin the high permeability zone.3.2 1999–2008 gravity changes
The gravity data in 2008 measurement have an uncer-tainty average about 12 μGal. The distribution of the grav-ity changes helps to give a picture of the mass movements

Y. SOFYAN et al.: MASS VARIATION TO HIGH PRODUCTION ACTIVITY 1163
Fig.
5.D
istr
ibut
ion
ofth
e19
99–2
005,
1999
–200
8an
d20
09–2
010
grav
itych
ange
sat
KG
F.

1164 Y. SOFYAN et al.: MASS VARIATION TO HIGH PRODUCTION ACTIVITY
that have occurred as a result of the production and injec-tion activities between 1999 and 2008 and natural rechargefrom outside of the reservoir. The gravity changes in thisperiod is larger than that is obtained in the previous period.This is caused by the longer period and increase produc-tion capacity at 2007. Some make up wells were added andsome stand by wells were reactivated according to this in-clined production. In this period, the biggest negative grav-ity change also occured on bechmark PPG-07 that corre-lated to high production zone. Some strike-slip faults fromgeology data in the north-east area at KGF are also corre-lated to the gravity changes distribution between 1999 and2008. This area has a boundary between positive and nega-tive gravity changes.3.3 2009–2010 gravity changes
Gravity measurement using absolute gravimetry in 2009and 2010 indicated small scattered data and uncertainty fac-tor. Mostly uncertainties of the data are close to 10 μGal asaccuracy of the A10 absolute gravimeter. There are twogravity data have uncertainty bigger than 12 μGal. Accord-ing to this condition, we reduced gravity data of these twobenchmarks in the interpretation and mass change calcu-lation. The distribution of the gravity changes in this pe-riod is look similar trend with the previous period in 1999to 2008 gravity change. The positive gravity changes lo-cated in the northern part of the reservoir area at KamojangGeothermal Field. Reservoir area with many productionwells have negative gravity changes. The gravity changesin this period is the largest compared to the gravity changesaverage rate of two previous periods. This is caused bythe production capacity at this period is bigger than them.Some make up wells were continue added and some standby wells were reactivated according to this high produc-tion demand. The distributions of these gravity changes inthree periods (1999–2005, 1999–2008 and 2009–2010) areshown in Fig. 5.
4. Mass BalanceA mass balance or material balance is an application
of the mass conservation to the analysis of physical sys-tems. The mass balance is used to analyze and to count themass that enters or leaves the system. The mass balancein the geothermal reservoir is regulated by the amount ofproduction, injection and natural recharge. Gauss’s theory(Hammer, 1945; Hunt, 2000) explains the mass variationsare obtained by gravity changes:
�m = 1
2πG�(�g.�A) (1)
where �m = the mass changes (kg), �g = the gravitychanges (mGal), �A = Area concerned (km2), G = thegravitational constant 6.672×10⁻¹¹ N m2 kg−2. The gravitychange �g for each grid as calculated below:
1�g = dgi, j + dgi+1, j + dgi, j+1 + dgi+1, j+1
4(2)
where (dgi, j , dgi+1, j , dgi, j+1, dgi+1, j+1) are the gravitychange at one grid square.
This method has advantage in the way of averaging grav-ity changes in each grid area. It means that these results
will also averaging and reducing some uncertainty factorsof these gravity data. In the simple error propagation analy-sis, uncertainty in some observed variables can be combinedbecome nal result. The nal result determines a smalleruncertainty than total error. Error propagation δR in gen-eral functions R can be written as:
δR =√(
∂ R
∂ XδX
)2
+(
∂ R
∂YδY
)2
+ · · · (3)
R is a function of variables X , Y and other variables(R(X, Y, . . .)).
In this mass variation analyses at KGF by applyingGauss’s potential theorem to gravity change data, we couldnot avoid “error in tailing off” and “error in gravity datum”(Hammer, 1945; Sugihara and Ishido, 1998). Gravity mea-surement at KGF could not cover the whole area, particu-larly in NE and SW part. This is very hard areas to accessfor conducting gravity monitoring regarding to the moun-tainous and steep area. Previous gravity data covered smallarea only about 25 km2. According to this analysis, wemake assumption to manage these problems. We expectedthat gravity changes data in larger area will make a closeloop of Gaussian method.4.1 Mass balance result
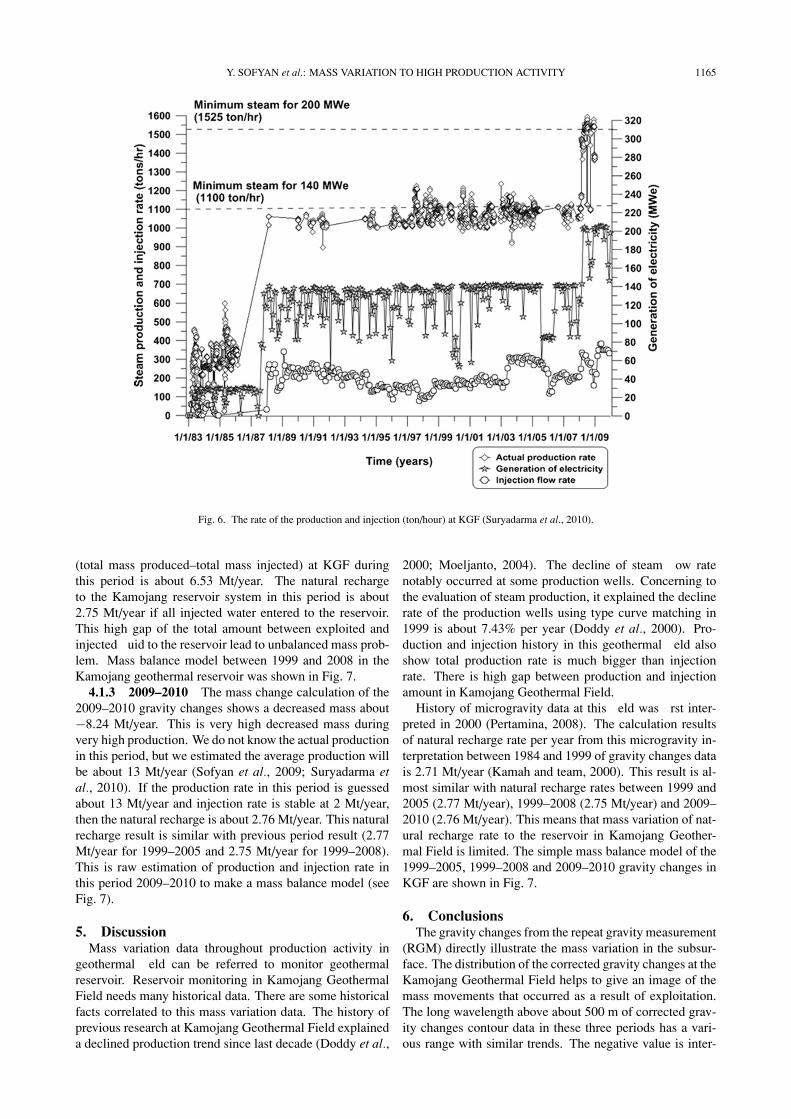
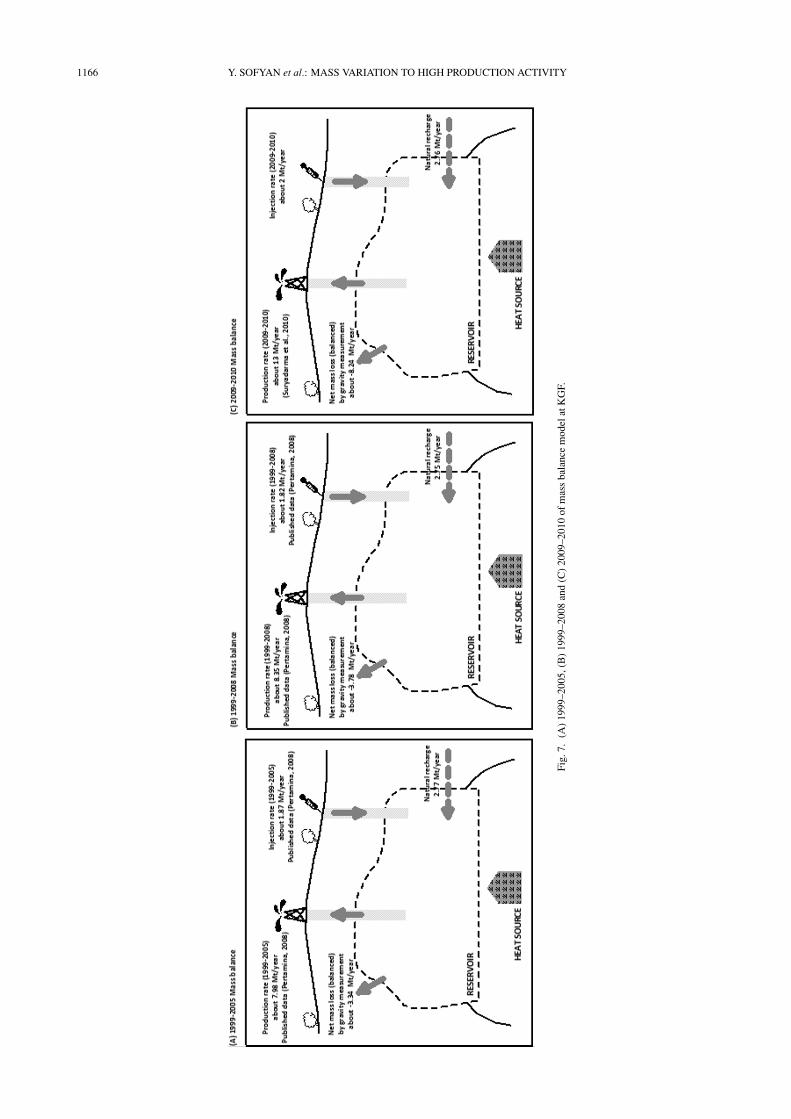
4.1.1 1999–2005 The corrected gravity changes mapwas divided into grids. From the above calculation, themass changes of the 1999–2005 gravity changes show de-crease about −20.07 Mt (Million ton) for 6 years period orequal to −3.34 Mt/year. Since 1983 to 2005, more than160 × 106 tons of steam has been exploited from KGFand more than 30 × 106 tons of water has been injectedto KGF. More than 30 production wells, including stand-by wells, supplied steam to the three units. The total pro-duction rate from the eld has remained relatively constant.History of the production and injection rate at KGF can beseen in Fig. 6. The average of total production rate fromthe 1999–2005 is about 7.98 Mt/year. It is bigger thanthe average of the 1999–2005 total injection rates of 1.87Mt/year (Pertamina, 2008). The net mass produced (totalmass produced–total mass injected) at the KGF during thisperiod is about 6.11 Mt/year. Assuming all the injected wa-ter entered to the reservoir, the estimation of the total rateof the natural recharge to the Kamojang reservoir system isabout 2.77 Mt/year. The recharge rate to KGF of about 45%of the net mass produced has occurred from the natural owand lateral aquifers. Mass balance model between 1999 and2005 in the Kamojang geothermal reservoir was shown inFig. 7.
4.1.2 1999–2008 Regarding same method to the pre-vious mass changes calculation, during 1999 to 2008, themass variation is equal to a −3.78 Mt/year. Mass changein this period is bigger than previous period throughout in-crease production. In 2007, the Kamojang production ca-pacity was improved during the increased install capacity to200 MWe. More than 40 production wells supplied steamconstantly (Sanyal et al., 2000). The average of the 1999–2008 total production rates per year increased to about 8.35Mt/year. In this period, the injection rate decreased to1.82 Mt/year (Pertamina, 2008). The net mass produced
Y. SOFYAN et al.: MASS VARIATION TO HIGH PRODUCTION ACTIVITY 1165
Fig. 6. The rate of the production and injection (ton/hour) at KGF (Suryadarma et al., 2010).
(total mass produced–total mass injected) at KGF duringthis period is about 6.53 Mt/year. The natural rechargeto the Kamojang reservoir system in this period is about2.75 Mt/year if all injected water entered to the reservoir.This high gap of the total amount between exploited andinjected uid to the reservoir lead to unbalanced mass prob-lem. Mass balance model between 1999 and 2008 in theKamojang geothermal reservoir was shown in Fig. 7.
4.1.3 2009–2010 The mass change calculation of the2009–2010 gravity changes shows a decreased mass about−8.24 Mt/year. This is very high decreased mass duringvery high production. We do not know the actual productionin this period, but we estimated the average production willbe about 13 Mt/year (Sofyan et al., 2009; Suryadarma etal., 2010). If the production rate in this period is guessedabout 13 Mt/year and injection rate is stable at 2 Mt/year,then the natural recharge is about 2.76 Mt/year. This naturalrecharge result is similar with previous period result (2.77Mt/year for 1999–2005 and 2.75 Mt/year for 1999–2008).This is raw estimation of production and injection rate inthis period 2009–2010 to make a mass balance model (seeFig. 7).
5. DiscussionMass variation data throughout production activity in
geothermal eld can be referred to monitor geothermalreservoir. Reservoir monitoring in Kamojang GeothermalField needs many historical data. There are some historicalfacts correlated to this mass variation data. The history ofprevious research at Kamojang Geothermal Field explaineda declined production trend since last decade (Doddy et al.,
2000; Moeljanto, 2004). The decline of steam ow ratenotably occurred at some production wells. Concerning tothe evaluation of steam production, it explained the declinerate of the production wells using type curve matching in1999 is about 7.43% per year (Doddy et al., 2000). Pro-duction and injection history in this geothermal eld alsoshow total production rate is much bigger than injectionrate. There is high gap between production and injectionamount in Kamojang Geothermal Field.
History of microgravity data at this eld was rst inter-preted in 2000 (Pertamina, 2008). The calculation resultsof natural recharge rate per year from this microgravity in-terpretation between 1984 and 1999 of gravity changes datais 2.71 Mt/year (Kamah and team, 2000). This result is al-most similar with natural recharge rates between 1999 and2005 (2.77 Mt/year), 1999–2008 (2.75 Mt/year) and 2009–2010 (2.76 Mt/year). This means that mass variation of nat-ural recharge rate to the reservoir in Kamojang Geother-mal Field is limited. The simple mass balance model of the1999–2005, 1999–2008 and 2009–2010 gravity changes inKGF are shown in Fig. 7.
6. ConclusionsThe gravity changes from the repeat gravity measurement
(RGM) directly illustrate the mass variation in the subsur-face. The distribution of the corrected gravity changes at theKamojang Geothermal Field helps to give an image of themass movements that occurred as a result of exploitation.The long wavelength above about 500 m of corrected grav-ity changes contour data in these three periods has a vari-ous range with similar trends. The negative value is inter-
1166 Y. SOFYAN et al.: MASS VARIATION TO HIGH PRODUCTION ACTIVITY
Fig.
7.(A
)19
99–2
005,
(B)
1999
–200
8an
d(C
)20
09–2
010
ofm
ass
bala
nce
mod
elat
KG
F.
Y. SOFYAN et al.: MASS VARIATION TO HIGH PRODUCTION ACTIVITY 1167
preted in terms of net mass loss of production and the pos-itive value is interpreted in terms of net mass gain of waterinjection and natural recharge. Large negative anomaly typ-ically occured at the gravity benchmarks that located nearto medium or high production wells. This large negativegravity changes were primarily caused by the net mass lossof steam from the geothermal reservoir due to exploitation.The small positive value of the gravity change occurrednear the injection wells KMJ-55 and KMJ-21. The grav-ity changes is larger in the high permeability zone.
In the six years production period (1999–2005), theKamojang Geothermal Field has mass decrease of about−3.34 Mt/year. The 1999–2005 net mass produced (to-tal mass produced–total mass injected) from this period isabout 6.11 Mt/year. Assuming all the injected water en-ters to the reservoir, the total rate of the natural recharge tothe Kamojang reservoir system is about 2.77 Mt/year. Af-ter the produced capacity increased to 200 MWe at 2007at KGF, repeat gravity measurement was conducted in theend of 2008 that was compared to 1999. The estimatedmass changes rate from the 1999–2008 gravity changes datais decreased mass of about −3.78 Mt/year. The net massproduced at KGF during this period is about 6.53 Mt/year.The natural recharge to the Kamojang reservoir system inthis period is about 2.75 Mt/year if all injected water en-tered to the reservoir. Mass change calculation of the 2009–2010 gravity changes shows a decreased mass about −8.24Mt/year.
Three gravity comparison between the 1999–2005,1999–2008 and 2009–2010 have different situation of theproduction capacity. Gravity changes rate during 2009–2010 period is the biggest one. This is caused by the largestproduction capacity if it is compared to previous periods.During the increase production, the net mass loss will con-tinue increase and affect an unsustainable production.
Acknowledgments. I would like to thank PERTAMINA for hispermission in monitoring study of his area at Kamojang Geother-mal Field. We also thank to Research Institute for Humanity andNature (RIHN) for gravity measurement using Absolute gravime-ter. I acknowledge the nancial support of KAKENHI (Grant-in-Aid for Scienti c Research by Japan Society for the Promotion ofScience) Category B (No. 21404018) for gravity measurement inKamojang Geothermal Field.
ReferencesAldrian, E. and D. Susanto, Identi cation of three dominant rainfall re-
gions within Indonesia and their relationship to sea surface temperature,Int. J. Climatol., 23, 1435–1452, 2003.
Allis, R. G. and T. M. Hunt, Analysis of exploitation-induced grav-ity changes at Wairakei geothermal eld, Geophysics, 51, 1647–1660,1986.
Battaglia, M., P. Segall, and C. Roberts, The mechanics of unrest at LongValley caldera, California: 2. Constraining the nature of the source usinggeodetic and micro-gravity data, J. Volcanol. Geotherm. Res., 127, 219–245, 2003.
Doddy, S., I. K. Sujata, and U. Komaruddin, Evaluation of steam pro-duction decline trends in the Kamojang Geothermal Field, ProceedingsWorld Geothermal Congress 2000, Kyushu, Japan, 2857–2862, 2000.
Geri, G., I. Marson, A. Ross, and B. Toro, Crustal deformation and gravitychanges during the rst ten years of exploitation of the new travaleRadicondoli geothermal eld, Italy, Geothermics, 14, 273–285, 1985.
Goodkind, J. M., Continuous Measurement of non-tidal variations of grav-ity, J. Geophys. Res., 91, 9125-9134, 1986.
Hammer, S., Estimating ore masses in gravity prospecting, Geophysics,10, 50–62, 1945.
Hochstein, M. and P. Sudarman, History of geothermal exploration inIndonesia from 1970 to 2000, Geothermics, 37, 220–266, 2008.
Hunt, T. M., Gravity changes at Wairakei geothermal eld, New Zealand,Geol. Soc. Am. Bull., 81, 529–536, 1970.
Hunt, T. M., Five lectures on environmental effect of geothermal uti-lization, Geothermal Training Programme United Nations University,104 pp., 2000.
Kamah, M. Y., T. Dwikorianto, A. A. Zuhro, D. Sunaryo, and A. Hasibuan,The productive feed zones identi ed based on spinner data and applica-tion in the reservoir potential review of Kamojang Geothermal Area, In-donesia, Proceedings World Geothermal Congress, 2005, Turkey, 6 pp.,2005.
Kamah, M. Y. and team, Gravity Survey Report 99-00 Kamojang Geother-mal Field, Jawa barat. OPS Eksplorasi Panasbumi, Divisi panasbumiDit. EP—PERTAMINA, 93 pp., 2000.
Micro-g LaCoste Inc., A10 Portable Gravimeter User’s Manual, 7 pp.,2006.
Moeljanto, Evaluation of the environmental impact at the KamojangGeothermal Field in Indonesia applying the ems of iso 14001, Reportof Geothermal Training Programme, 209–238, The United Nation Uni-versity, Iceland, 2004.
Nishijima, J., H. Saibi, Y. Sofyan, S. Shimose, Y. Fujimitsu, S. Ehara, Y.Fukuda, T. Hasegawa, and M. Taniguchi, Reservoir monitoring usinghybrid micro-gravity measurement in the Takigami Geothermal Field,Central Kyushu, Japan, Proceedings World Geothermal Congress 2010,Bali, Indonesia, 6 pp., 2010.
Nordquist, G., J. A. P. Protacio, and A. Acuna, Precision gravity monitor-ing of the Bulalo geothermal eld, Philippines: Independent checks andconstraints on numerical simulation, Geothermics, 33, 37–56, 2004.
Pertamina, Kamojang, West Java Indonesia, from beginning until now,International Geothermal Sustainability Modeling Workshop, NewZealand, 10 pp., 2008.
Rymer, H., J. Cassidy, C. A. Locke, and F. Sigmundsson, Post-eruptivegravity changes from 1990 to 1996 at Kra a volcano, Iceland, J. Vol-canol. Geotherm. Res., 87, 141–149, 1998.
Sanyal, S. K., A. Robertson-Tait, S. J. Butler, J. W. Lovekin, P. J. Brown, S.Sudarman, and S. Sulaiman, Assessment of steam supply for the expan-sion of generation capacity from 140 to 200 MW, Kamojang Geother-mal Field, West Java, Indonesia, Proceedings of World GeothermalCongress 2000, Japan, 2195–2200, 2000.
Scintrex CG-3/3M Autograv, Automated Gravity Meter Operator Manual,198 pp., 1995.
Sofyan, Y., Y. Daud, Y. Kamah, J. Nishijima, Y. Fujimitsu, and S. Ehara,Sustainable production plan in the geothermal energy development—a case study of Kamojang Geothermal Field, Indonesia, Proceedingsthe 4th International Symposium on Novel Carbon Resource Sciences,Shanghai, 141–147, 2009.
Sofyan, Y., Y. Daud, Y. Kamah, H. Saibi, J. Nishijima, Y. Fujimitsu, and S.Ehara, Monitoring of mass balance model during production capacityincrease at Kamojang Geothermal Field, Indonesia, Proceedings 35thWorkshop on Geothermal Reservoir Engineering, Stanford, 431–437,2010.
Sudarman, S., M. Boedihardi, and K. Pudyastuti, Bardan, KamojangGeothermal Field 10 year experience, Proceedings World GeothermalCongress 1995, Florence, 1773–1777, 1995.
Sugihara, M. and T. Ishido, Gravity monitoring at the Sumikawa Geother-mal Field, Japan, Geothermal Resources Council Transactions, Vol. 22,191–195, 1998.
Sumintadireja, P., S. Sudarman, H. Mizunaga, and K. Ushijima, Misse-a-la-masse and gravity data survey at the Kamojang Geothermal Field,Proceedings World Geothermal Congress 2000, Kyushu, Japan, 1777–1784, 2000.
Suryadarma, T. Dwikorianto, A. Zuhro, and A. Yani, Sustainable devel-opment of the Kamojang geothermal eld, Geothermics, 39, 391–399,2010.
Telford, W. M., L. P. Geldart, R. C. Sheriff, and D. A. Keys, Applied Geo-physics, 770 pp, Cambridge University Press., Cambridge New York,1976.
Y. Sofyan (e-mail: [email protected]), Y. Kamah, J.Nishijima, Y. Fujimitsu, S. Ehara, Y. Fukuda, and M. Taniguchi