
les5e_ptb_07
19
7/26/2019 les5e_ptb_07 http://slidepdf.com/reader/full/les5eptb07 1/19 Ch. 7 Hypothesis Testing with One Sample 7.1 Introduction to Hypothesis Testing 1 State a Null and Alternative Hypothesis SHORT ANSWER. Write the word or phrase that best completes each statement or answers the question. Provide an appropriate response. 1) The mean age of bus drivers in Chicago is 48.5 years. Write the null and alternative hypotheses. 2) The mean IQ of statistics teachers is greater than 110. Write the null and alternative hypotheses. 3) The mean score for all NBA games during a particular season was less than 101 points per game. Write the null and alternative hypotheses. 4) A candidate for governor of a particular state claims to be favored by at least half of the voters. Write the null and alternative hypotheses. 5) The dean of a major university claims that the mean time for students to earn a Masterʹs degree is at most 4.9 years. Write the null and alternative hypotheses. 6) The buyer of a local hiking club store recommends against buying the new digital altimeters because they vary more than the old altimeters, which had a standard deviation of one yard. Write the null and alternative hypotheses. 7) The mean age of bus drivers in Chicago is 53.7 years. State this claim mathematically. Write the null and alternative hypotheses. Identify which hypothesis is the claim. 8) The mean IQ of statistics teachers is greater than 120. State this claim mathematically. Write the null and alternative hypotheses. Identify which hypothesis is the claim. 9) The mean score for all NBA games during a particular season was less than 101 points per game. State this claim mathematically. Write the null and alternative hypotheses. Identify which hypothesis is the claim. 10) A candidate for governor of a particular state claims to be favored by at least half of the voters. State this claim mathematically. Write the null and alternative hypotheses. Identify which hypothesis is the claim. 11) The dean of a major university claims that the mean time for students to earn a Masterʹs degree is at most 3.3 years. State this claim mathematically. Write the null and alternative hypotheses. Identify which hypothesis is the claim. 12) The buyer of a local hiking club store recommends against buying the new digital altimeters because they vary more than the old altimeters, which had a standard deviation of one yard. State this claim mathematically. Write the null and alternative hypotheses. Identify which hypothesis is the claim. 2 Identify Whether to Use a One - tailed or Two - tailed Test MULTIPLE CHOICE. Choose the one alternative that best completes the statement or answers the question. Provide an appropriate response. 13) Given H 0 : p ≥ 80% and H a : p < 80%, determine whether the hypothesis test is left -tailed, right-tailed, or two-tailed. A) left -tailed B) right-tailed C) two-tailed Page 132 Copyright © 2012 Pearson Education, Inc.
-
Upload
jiger-shah -
Category
Documents
-
view
213 -
download
0
Transcript of les5e_ptb_07

7/26/2019 les5e_ptb_07
http://slidepdf.com/reader/full/les5eptb07 1/19
Ch. 7 Hypothesis Testing with One Sample
7.1 Introduction to Hypothesis Testing
1 State a Null and Alternative Hypothesis
SHORT ANSWER. Write the word or phrase that best completes each statement or answers the question.
Provide an appropriate response.
1) The mean age of bus drivers in Chicago is 48.5 years. Write the null and alternative hypotheses.
2) The mean IQ of statistics teachers is greater than 110. Write the null and alternative hypotheses.
3) The mean score for all NBA games during a particular season was less than 101 points per game. Write the null
and alternative hypotheses.
4) A candidate for governor of a particular state claims to be favored by at least half of the voters. Write the null
and alternative hypotheses.
5) The dean of a major university claims that the mean time for students to earn a Masterʹs degree is at most 4.9
years. Write the null and alternative hypotheses.
6) The buyer of a local hiking club store recommends against buying the new digital altimeters because they vary
more than the old altimeters, which had a standard deviation of one yard. Write the null and alternative
hypotheses.
7) The mean age of bus drivers in Chicago is 53.7 years. State this claim mathematically. Write the null and
alternative hypotheses. Identify which hypothesis is the claim.
8) The mean IQ of statistics teachers is greater than 120. State this claim mathematically. Write the null and
alternative hypotheses. Identify which hypothesis is the claim.
9) The mean score for all NBA games during a particular season was less than 101 points per game. State this
claim mathematically. Write the null and alternative hypotheses. Identify which hypothesis is the claim.
10) A candidate for governor of a particular state claims to be favored by at least half of the voters. State this claim
mathematically. Write the null and alternative hypotheses. Identify which hypothesis is the claim.
11) The dean of a major university claims that the mean time for students to earn a Masterʹs degree is at most 3.3
years. State this claim mathematically. Write the null and alternative hypotheses. Identify which hypothesis is
the claim.
12) The buyer of a local hiking club store recommends against buying the new digital altimeters because they vary
more than the old altimeters, which had a standard deviation of one yard. State this claim mathematically.
Write the null and alternative hypotheses. Identify which hypothesis is the claim.
2 Identify
Whether
to
Use
a
One-
tailed
or
Two-
tailed
Test
MULTIPLE CHOICE. Choose the one alternative that best completes the statement or answers the question.
Provide an appropriate response.
13) Given H0: p ≥ 80% and Ha: p < 80%, determine whether the hypothesis test is left-tailed, right-tailed, or
two-tailed.
A) left-tailed B) right-tailed C) two-tailed
Page 132
Copyright © 2012 Pearson Education, Inc.
7/26/2019 les5e_ptb_07
http://slidepdf.com/reader/full/les5eptb07 2/19
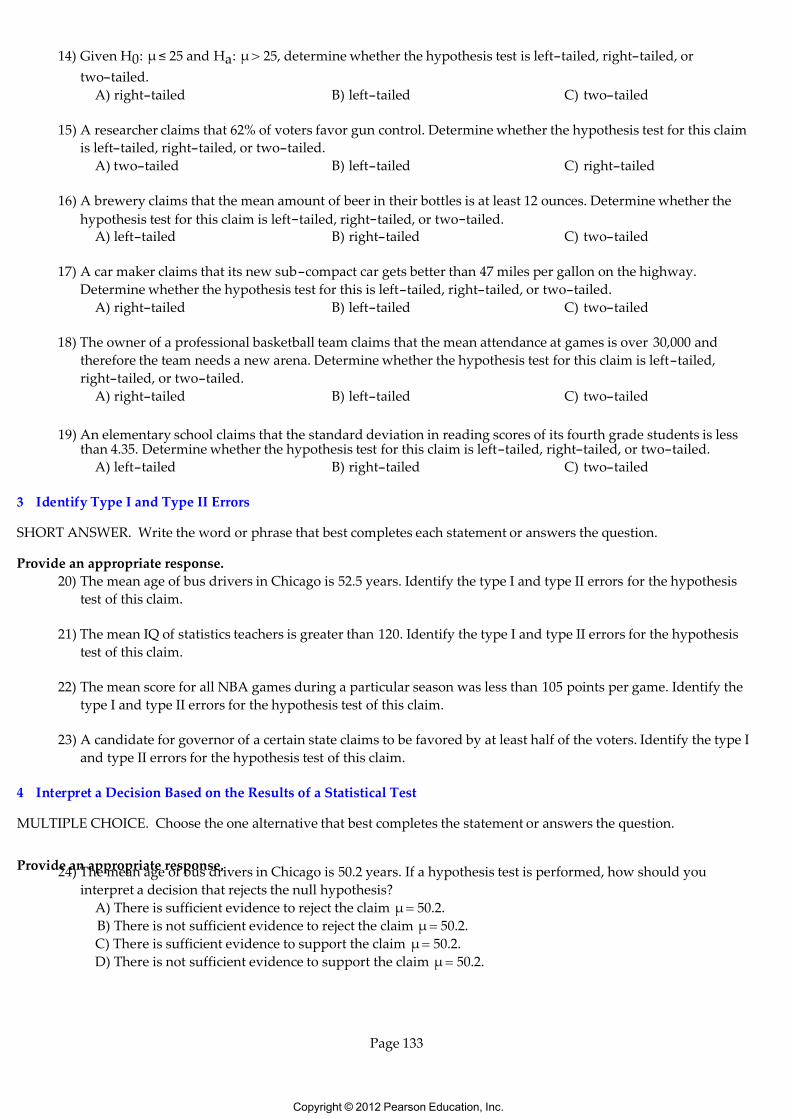
14) Given H0: μ≤ 25 and Ha: μ > 25, determine whether the hypothesis test is left-tailed, right-tailed, or
two-tailed.
A) right-tailed B) left-tailed C) two-tailed
15) A researcher claims that 62% of voters favor gun control. Determine whether the hypothesis test for this claim
is left-tailed, right-tailed, or two-tailed.
A) two-tailed B) left-tailed C) right-tailed
16) A brewery claims that the mean amount of beer in their bottles is at least 12 ounces. Determine whether the
hypothesis test for this claim is left-tailed, right-tailed, or two-tailed.A) left-tailed B) right-tailed C) two-tailed
17) A car maker claims that its new sub-compact car gets better than 47 miles per gallon on the highway.
Determine whether the hypothesis test for this is left-tailed, right-tailed, or two-tailed.
A) right-tailed B) left-tailed C) two-tailed
18) The owner of a professional basketball team claims that the mean attendance at games is over 30,000 and
therefore the team needs a new arena. Determine whether the hypothesis test for this claim is left -tailed,
right-tailed, or two-tailed.
A) right-tailed B) left-tailed C) two-tailed
19) An elementary school claims that the standard deviation in reading scores of its fourth grade students is lessthan 4.35. Determine whether the hypothesis test for this claim is left-tailed, right-tailed, or two-tailed.
A) left-tailed B) right-tailed C) two-tailed
3 Identify Type I and Type II Errors
SHORT ANSWER. Write the word or phrase that best completes each statement or answers the question.
Provide an appropriate response.
20) The mean age of bus drivers in Chicago is 52.5 years. Identify the type I and type II errors for the hypothesis
test of this claim.
21) The mean IQ of statistics teachers is greater than 120. Identify the type I and type II errors for the hypothesis
test of this claim.
22) The mean score for all NBA games during a particular season was less than 105 points per game. Identify the
type I and type II errors for the hypothesis test of this claim.
23) A candidate for governor of a certain state claims to be favored by at least half of the voters. Identify the type I
and type II errors for the hypothesis test of this claim.
4 Interpret a Decision Based on the Results of a Statistical Test
MULTIPLE CHOICE. Choose the one alternative that best completes the statement or answers the question.
Provide
an
appropriate
response.24) The mean age of bus drivers in Chicago is 50.2 years. If a hypothesis test is performed, how should you
interpret a decision that rejects the null hypothesis?
A) There is sufficient evidence to reject the claim μ = 50.2.
B) There is not sufficient evidence to reject the claim μ = 50.2.
C) There is sufficient evidence to support the claim μ= 50.2.
D) There is not sufficient evidence to support the claim μ = 50.2.
Page 133
Copyright © 2012 Pearson Education, Inc.

7/26/2019 les5e_ptb_07
http://slidepdf.com/reader/full/les5eptb07 3/19
25) The mean age of bus drivers in Chicago is 59.3 years. If a hypothesis test is performed, how should you
interpret a decision that fails to reject the null hypothesis?
A) There is not sufficient evidence to reject the claim μ = 59.3.
B) There is sufficient evidence to reject the claim μ = 59.3.
C) There is sufficient evidence to support the claim μ= 59.3.
D) There is not sufficient evidence to support the claim μ = 59.3.
26) The mean age of bus drivers in Chicago is greater than 57.8 years. If a hypothesis test is performed, how should
you interpret a decision that rejects the null hypothesis?
A) There is sufficient evidence to support the claim μ> 57.8.B) There is sufficient evidence to reject the claim μ > 57.8.
C) There is not sufficient evidence to reject the claim μ > 57.8.
D) There is not sufficient evidence to support the claim μ > 57.8.
27) The mean age of bus drivers in Chicago is greater than 47.6 years. If a hypothesis test is performed, how should
you interpret a decision that fails to reject the null hypothesis?
A) There is not sufficient evidence to support the claim μ > 47.6.
B) There is sufficient evidence to reject the claim μ > 47.6.
C) There is not sufficient evidence to reject the claim μ > 47.6.
D) There is sufficient evidence to support the claim μ > 47.6.
28) The mean IQ of statistics teachers is greater than 160. If a hypothesis test is performed, how should youinterpret a decision that rejects the null hypothesis?
A) There is sufficient evidence to support the claim μ> 160.
B) There is sufficient evidence to reject the claim μ > 160.
C) There is not sufficient evidence to reject the claim μ > 160.
D) There is not sufficient evidence to support the claim μ > 160.
29) The mean IQ of statistics teachers is greater than 150. If a hypothesis test is performed, how should you
interpret a decision that fails to reject the null hypothesis?
A) There is not sufficient evidence to support the claim μ > 150.
B) There is sufficient evidence to reject the claim μ > 150.
C) There is not sufficient evidence to reject the claim μ > 150.
D) There is sufficient evidence to support the claim μ> 150.
30) The mean score for all NBA games during a particular season was less than 92 points per game. If a hypothesis
test is performed, how should you interpret a decision that rejects the null hypothesis?
A) There is sufficient evidence to support the claim μ< 92.
B) There is sufficient evidence to reject the claim μ < 92.
C) There is not sufficient evidence to reject the claim μ < 92.
D) There is not sufficient evidence to support the claim μ < 92.
31) The mean score for all NBA games during a particular season was less than 100 points per game. If a
hypothesis test is performed, how should you interpret a decision that fails to reject the null hypothesis?
A) There is not sufficient evidence to support the claim μ < 100.
B) There is sufficient evidence to reject the claim μ < 100.C) There is not sufficient evidence to reject the claim μ < 100.
D) There is sufficient evidence to support the claim μ< 100.
Page 134
Copyright © 2012 Pearson Education, Inc.

7/26/2019 les5e_ptb_07
http://slidepdf.com/reader/full/les5eptb07 4/19
32) A candidate for governor of a certain state claims to be favored by at least half of the voters. If a hypothesis test
is performed, how should you interpret a decision that rejects the null hypothesis?
A) There is sufficient evidence to reject the claim ρ ≥ 0.5.
B) There is not sufficient evidence to reject the claim ρ ≥ 0.5.
C) There is sufficient evidence to support the claim ρ ≥ 0.5.
D) There is not sufficient evidence to support the claim ρ ≥ 0.5.
33) A candidate for governor of a certain state claims to be favored by at least half of the voters. If a hypothesis test
is performed, how should you interpret a decision that fails to reject the null hypothesis?
A) There is not sufficient evidence to reject the claim ρ ≥ 0.5.B) There is sufficient evidence to reject the claim ρ ≥ 0.5.
C) There is sufficient evidence to support the claim ρ ≥ 0.5.
D) There is not sufficient evidence to support the claim ρ ≥ 0.5.
34) The dean of a major university claims that the mean time for students to earn a Masterʹs degree is at most 5.8
years. If a hypothesis test is performed, how should you interpret a decision that rejects the null hypothesis?
A) There is sufficient evidence to reject the claim μ≤ 5.8.
B) There is not sufficient evidence to reject the claim μ≤ 5.8.
C) There is sufficient evidence to support the claim μ≤ 5.8.
D) There is not sufficient evidence to support the claim μ≤ 5.8.
35) The dean of a major university claims that the mean time for students to earn a Masterʹs degree is at most 5.1years. If a hypothesis test is performed, how should you interpret a decision that fails to reject the null
hypothesis?
A) There is not sufficient evidence to reject the claim μ≤ 5.1.
B) There is sufficient evidence to reject the claim μ≤ 5.1.
C) There is sufficient evidence to support the claim μ≤ 5.1.
D) There is not sufficient evidence to support the claim μ≤ 5.1.
5 Use Confidence Intervals to Make Decisions
MULTIPLE CHOICE. Choose the one alternative that best completes the statement or answers the question.
Provide an appropriate response.
36) Given H0: μ≤ 12, for which confidence interval should you reject H0?
A) (13, 16) B) (11.5, 12.5) C) (10, 13)
37) Given H0: p ≥ 0.45, for which confidence interval should you reject H0?
A) (0.32, 0.40) B) (0.40, 0.50) C) (0.42, 0.47)
6 Concepts
MULTIPLE CHOICE. Choose the one alternative that best completes the statement or answers the question.
Provide an appropriate response.
38) Given H0: p = 0.85 and α = 0.10, which level of confidence should you use to test the claim?
A) 90% B) 95% C) 99% D) 80%
39) Given H0: μ≥ 23.5 and α= 0.05, which level of confidence should you use to test the claim?
A) 90% B) 99% C) 80% D) 95%
Page 135
Copyright © 2012 Pearson Education, Inc.

7/26/2019 les5e_ptb_07
http://slidepdf.com/reader/full/les5eptb07 5/19
7.2 Hypothesis Testing for the Mean (Large Samples)
1 Find P-values
MULTIPLE CHOICE. Choose the one alternative that best completes the statement or answers the question.
Provide an appropriate response.
1) Suppose you are using α = 0.05 to test the claim that μ > 14 using a P-value. You are given the sample statistics
n = 50, x = 14.3, and s = 1.2. Find the P-value.
A) 0.0384 B) 0.1321 C) 0.0128 D) 0.0012
2) Suppose you are using α = 0.05 to test the claim that μ≠ 14 using a P-value. You are given the sample statistics
n = 35, x = 13.1, and s = 2.7. Find the P-value.
A) 0.0488 B) 0.0591 C) 0.1003 D) 0.0244
3) Suppose you are using α = 0.01 to test the claim that μ≤ 32 using a P-value. You are given the sample statistics
n = 40, x = 33.8, and s = 4.3. Find the P-value.
A) 0.0040 B) 0.9960 C) 0.0211 D) 0.1030
4) Suppose you are using α = 0.01 to test the claim that μ = 1620 using a P-value. You are given the sample
statistics n = 35, x = 1590, and s = 82. Find the P-value.
A) 0.0308 B) 0.0154 C) 0.3169 D) 0.0077
2 Test a Claim About a Mean Using P-values
MULTIPLE CHOICE. Choose the one alternative that best completes the statement or answers the question.
Provide an appropriate response.
5) Given H0: μ = 25, Ha: μ≠ 25, and P = 0.034. Do you reject or fail to reject H0 at the 0.01 level of significance?
A) fail to reject H0
B) reject H0
C) not sufficient information to decide
6) Given H0: μ≥ 18 and P = 0.070. Do you reject or fail to reject H0 at the 0.05 level of significance?A) fail to reject H0
B) reject H0
C) not sufficient information to decide
7) Given Ha: μ > 85 and P = 0.007. Do you reject or fail to reject H0 at the 0.01 level of significance?
A) reject H0
B) fail to reject H0
C) not sufficient information to decide
SHORT ANSWER. Write the word or phrase that best completes each statement or answers the question.
8) A fast food outlet claims that the mean waiting time in line is less than 3.4 minutes. A random sample of 60
customers has a mean of 3.3 minutes with a standard deviation of 0.6 minute. If α = 0.05, test the fast food
outletʹs claim.
Page 136
Copyright © 2012 Pearson Education, Inc.

7/26/2019 les5e_ptb_07
http://slidepdf.com/reader/full/les5eptb07 6/19
9) A local school district claims that the number of school days missed by its teachers due to illness is below the
national average of 5. A random sample of 40 teachers provided the data below. At α = 0.05, test the districtʹs
claim using P-values.
0 3 6 3 3 5 4 1 3 5
7 3 1 2 3 3 2 4 1 6
2 5 2 8 3 1 2 5 4 1
1 1 2 1 5 7 5 4 9 3
3 Find
Critical
Values
MULTIPLE CHOICE. Choose the one alternative that best completes the statement or answers the question.
Provide an appropriate response.
10) Find the critical value for a right-tailed test with α = 0.01 and n = 75.
A) 2.33 B) 2.575 C) 1.645 D) 1.96
11) Find the critical value for a two-tailed test with α = 0.01 and n = 30.
A) ±2.575 B) ±2.33 C) ±1.645 D) ±1.96
12) Find the critical value for a left-tailed test with α = 0.05 and n = 48.
A) -1.645 B) -2.33 C) -2.575 D) -1.96
13) Find the critical value for a two-tailed test with α = 0.10 and n = 100.
A) ±1.645 B) ±2.33 C) ±2.575 D) ±1.96
14) Find the critical value for a left-tailed test with α = 0.025 and n = 50.
A) -1.96 B) -2.33 C) -2.575 D) -1.645
15) Find the critical value for a two-tailed test with α = 0.07 and n = 36.
A) ±1.81 B) ±2.33 C) ±2.575 D) ±1.96
4 Test a Claim About a Mean
MULTIPLE CHOICE. Choose the one alternative that best completes the statement or answers the question.
Provide an appropriate response.
16) You wish to test the claim that μ> 32 at a level of significance of α = 0.05 and are given sample statistics n = 50,
x = 32.3, and s = 1.2. Compute the value of the standardized test statistic. Round your answer to two decimal
places.
A) 1.77 B) 2.31 C) 0.98 D) 3.11
17) You wish to test the claim that μ≠ 22 at a level of significance of α = 0.05 and are given sample statistics n = 35,
x = 21.1, and s = 2.7. Compute the value of the standardized test statistic. Round your answer to two decimal
places.
A) -1.97 B) -3.12 C) -2.86 D) -1.83
18) You wish to test the claim that μ≤ 38 at a level of significance of α = 0.01 and are given sample statistics n = 40,
x = 39.8, and s = 4.3. Compute the value of the standardized test statistic. Round your answer to two decimal
places.
A) 2.65 B) 3.51 C) 2.12 D) 1.96
Page 137
Copyright © 2012 Pearson Education, Inc.
7/26/2019 les5e_ptb_07
http://slidepdf.com/reader/full/les5eptb07 7/19
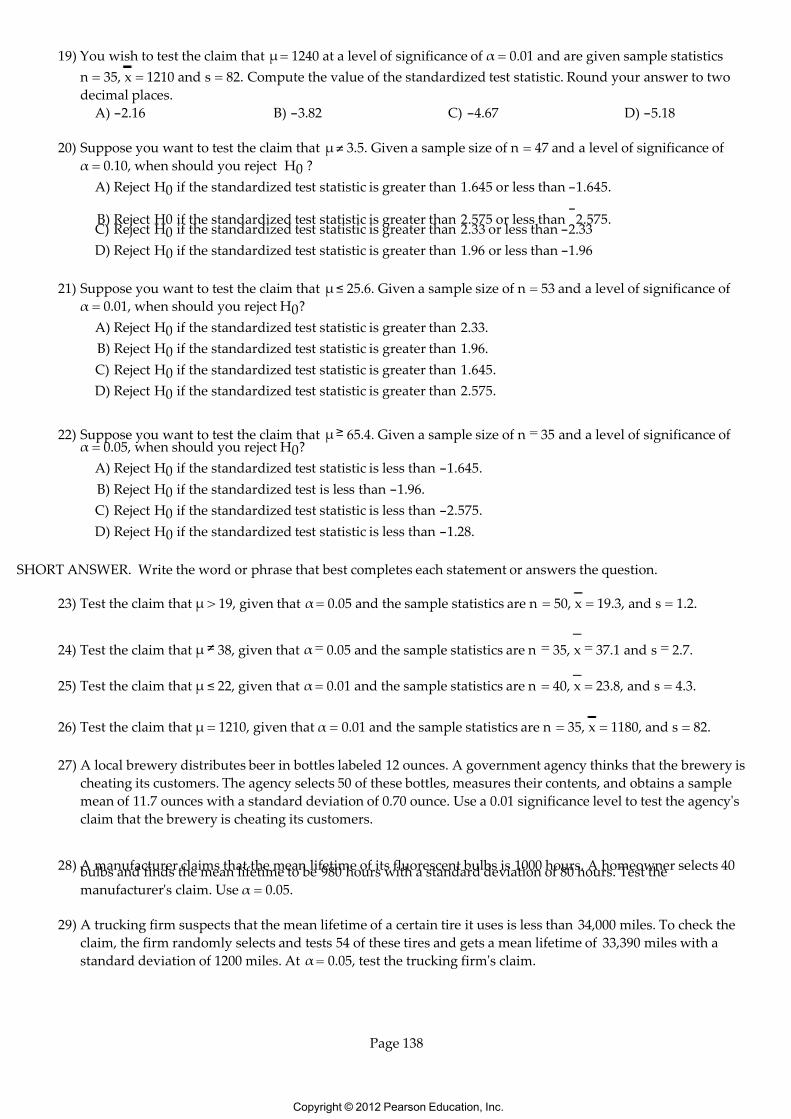
19) You wish to test the claim that μ= 1240 at a level of significance of α = 0.01 and are given sample statistics
n = 35, x = 1210 and s = 82. Compute the value of the standardized test statistic. Round your answer to two
decimal places.
A) -2.16 B) -3.82 C) -4.67 D) -5.18
20) Suppose you want to test the claim that μ≠ 3.5. Given a sample size of n = 47 and a level of significance of
α = 0.10, when should you reject H0 ?
A) Reject H0 if the standardized test statistic is greater than 1.645 or less than -1.645.
B) Reject H0 if the standardized test statistic is greater than 2.575 or less than -
2.575.C) Reject H0 if the standardized test statistic is greater than 2.33 or less than -2.33
D) Reject H0 if the standardized test statistic is greater than 1.96 or less than -1.96
21) Suppose you want to test the claim that μ≤ 25.6. Given a sample size of n = 53 and a level of significance of
α = 0.01, when should you reject H0?
A) Reject H0 if the standardized test statistic is greater than 2.33.
B) Reject H0 if the standardized test statistic is greater than 1.96.
C) Reject H0 if the standardized test statistic is greater than 1.645.
D) Reject H0 if the standardized test statistic is greater than 2.575.
22) Suppose you want to test the claim that μ≥ 65.4. Given a sample size of n = 35 and a level of significance ofα = 0.05, when should you reject H0?
A) Reject H0 if the standardized test statistic is less than -1.645.
B) Reject H0 if the standardized test is less than -1.96.
C) Reject H0 if the standardized test statistic is less than -2.575.
D) Reject H0 if the standardized test statistic is less than -1.28.
SHORT ANSWER. Write the word or phrase that best completes each statement or answers the question.
23) Test the claim that μ > 19, given that α= 0.05 and the sample statistics are n = 50, x = 19.3, and s = 1.2.
24) Test the claim that μ ≠ 38, given that α = 0.05 and the sample statistics are n = 35, x = 37.1 and s = 2.7.
25) Test the claim that μ ≤ 22, given that α = 0.01 and the sample statistics are n = 40, x = 23.8, and s = 4.3.
26) Test the claim that μ = 1210, given that α = 0.01 and the sample statistics are n = 35, x = 1180, and s = 82.
27) A local brewery distributes beer in bottles labeled 12 ounces. A government agency thinks that the brewery is
cheating its customers. The agency selects 50 of these bottles, measures their contents, and obtains a sample
mean of 11.7 ounces with a standard deviation of 0.70 ounce. Use a 0.01 significance level to test the agencyʹs
claim that the brewery is cheating its customers.
28) A manufacturer claims that the mean lifetime of its fluorescent bulbs is 1000 hours. A homeowner selects 40 bulbs and finds the mean lifetime to be 980 hours with a standard deviation of 80 hours. Test the
manufacturerʹs claim. Use α = 0.05.
29) A trucking firm suspects that the mean lifetime of a certain tire it uses is less than 34,000 miles. To check the
claim, the firm randomly selects and tests 54 of these tires and gets a mean lifetime of 33,390 miles with a
standard deviation of 1200 miles. At α= 0.05, test the trucking firmʹs claim.
Page 138
Copyright © 2012 Pearson Education, Inc.

7/26/2019 les5e_ptb_07
http://slidepdf.com/reader/full/les5eptb07 8/19
30) A local politician, running for reelection, claims that the mean prison time for car thieves is less than the
required 4 years. A sample of 80 convicted car thieves was randomly selected, and the mean length of prison
time was found to be 3 years and 6 months, with a standard deviation of 1 year and 3 months. At α = 0.05, test
the politicianʹs claim.
31) A local group claims that the police issue at least 60 speeding tickets a day in their area. To prove their point,
they randomly select one month. Their research yields the number of tickets issued for each day. The data are
listed below. At α = 0.01, test the groupʹs claim.
70 48 41 68 69 55 70 57 60 8332 60 72 58 88 48 59 60 56 65
66 60 68 42 57 59 49 70 75 63
44
32) A fast food outlet claims that the mean waiting time in line is less than 3.5 minutes. A random sample of 60
customers has a mean of 3.6 minutes with a standard deviation of 0.6 minute. If α= 0.05, test the fast food
outletʹs claim using critical values and rejection regions.
33) A fast food outlet claims that the mean waiting time in line is less than 3.5 minutes. A random sample of 60
customers has a mean of 3.6 minutes with a standard deviation of 0.6 minute. If α= 0.05, test the fast food
outletʹs claim using confidence intervals.
34) A local school district claims that the number of school days missed by teachers due to illness is below the
national average of 5 days. A random sample of 40 teachers provided the data below. At α = 0.05, test the
districtʹs claim using critical values and rejection regions.
0 3 6 3 3 5 4 1 3 5
7 3 1 2 3 3 2 4 1 6
2 5 2 8 3 1 2 5 4 1
1 1 2 1 5 7 5 4 9 3
35) A local school district claims that the number of school days missed by teachers due to illness is below the
national average of 5. A random sample of 40 teachers provided the data below. At α = 0.05, test the districtʹs
claim using confidence intervals.
0 3 6 3 3 5 4 1 3 5
7 3 1 2 3 3 2 4 1 6
2 5 2 8 3 1 2 5 4 1
1 1 2 1 5 7 5 4 9 3
7.3 Hypothesis Testing for the Mean (Small Samples)
1 Find Critical Values in a t-distribution
MULTIPLE CHOICE. Choose the one alternative that best completes the statement or answers the question.
Provide
an
appropriate
response.1) Find the critical values for a sample with n = 15 and α = 0.05 if H0: μ≤ 20.
A) 1.761 B) 2.977 C) 2.625 D) 1.345
Page 139
Copyright © 2012 Pearson Education, Inc.

7/26/2019 les5e_ptb_07
http://slidepdf.com/reader/full/les5eptb07 9/19
2 Test a Claim About a Mean
MULTIPLE CHOICE. Choose the one alternative that best completes the statement or answers the question.
Provide an appropriate response.
2) Find the standardized test statistic t for a sample with n = 12, x = 22.2, s = 2.2, and α= 0.01 if H0: μ = 21. Round
your answer to three decimal places.
A) 1.890 B) 1.991 C) 2.132 D) 2.001
3) Find the standardized test statistic t for a sample with n = 10, x = 9.7, s = 1.3, and α = 0.05 if H0: μ≥ 10.6. Roundyour answer to three decimal places.
A) -2.189 B) -3.186 C) -3.010 D) -2.617
4) Find the standardized test statistic t for a sample with n = 15, x = 7.4, s = 0.8, and α = 0.05 if H0: μ≤ 7.1. Round
your answer to three decimal places.
A) 1.452 B) 1.728 C) 1.631 D) 1.312
5) Find the standardized test statistic t for a sample with n = 20, x = 13, s = 2.0, and α= 0.05 if Ha: μ < 13.4. Round
your answer to three decimal places.
A) -0.894 B) -0.872 C) -1.265 D) -1.233
6) Find the standardized test statistic t for a sample with n = 25, x = 36, s = 3, and α = 0.005 if Ha: μ > 35. Round
your answer to three decimal places.
A) 1.667 B) 1.997 C) 1.452 D) 1.239
7) Find the standardized test statistic t for a sample with n = 12, x = 18.8, s = 2.1, and α= 0.01 if Ha: μ≠ 19.3.
Round your answer to three decimal places.
A) -0.825 B) -0.008 C) -0.037 D) -0.381
SHORT ANSWER. Write the word or phrase that best completes each statement or answers the question.
8) Use a t-test to test the claim μ = 16 at α = 0.01, given the sample statistics n = 12, x = 17.2, and s = 2.2.
9) Use a t-test to test the claim μ≥ 10.2 at α = 0.05, given the sample statistics n = 10, x = 9.3, and s = 1.3.
10) Use a t-test to test the claim μ≤ 8.8 at α = 0.05, given the sample statistics n = 15, x = 9.1, and s = 0.8.
11) Use a t-test to test the claim μ< 11 at α = 0.10, given the sample statistics n = 20, x = 10.6, and s = 2.0.
12) Use a t-test to test the claim μ > 39 at α = 0.005, given the sample statistics n = 25, x = 40, and s = 3.
13) Use a t-test to test the claim μ = 23.3 at α = 0.01, given the sample statistics n = 12, x = 22.8, and s = 2.1.
14) The Metropolitan Bus Company claims that the mean waiting time for a bus during rush hour is less than 10
minutes. A random sample of 20 waiting times has a mean of 8.6 minutes with a standard deviation of 2.1
minutes. At α = 0.01, test the bus companyʹs claim. Assume the distribution is normally distributed.
15) A local brewery distributes beer in bottles labeled 12 ounces. A government agency thinks that the brewery is
cheating its customers. The agency selects 20 of these bottles, measures their contents, and obtains a sample
mean of 11.7 ounces with a standard deviation of 0.7 ounce. Use a 0.01 significance level to test the agencyʹs
claim that the brewery is cheating its customers.
Page 140
Copyright © 2012 Pearson Education, Inc.

7/26/2019 les5e_ptb_07
http://slidepdf.com/reader/full/les5eptb07 10/19
16) A local group claims that the police issue more than 60 speeding tickets a day in their area. To prove their
point, they randomly select two weeks. Their research yields the number of tickets issued for each day. The
data are listed below. At α= 0.01, test the groupʹs claim.
70 48 41 68 69 55 70
57 60 83 32 60 72 58
17) A local group claims that the police issue more than 60 speeding tickets a day in their area. To prove their
point, they randomly select two weeks. Their research yields the number of tickets issued for each day. Thedata are listed below. At α = 0.02, test the groupʹs claim using confidence intervals.
70 48 41 68 69 55 70
57 60 83 32 60 72 58
18) A manufacturer claims that the mean lifetime of its fluorescent bulbs is 1100 hours. A homeowner selects 25
bulbs and finds the mean lifetime to be 1070 hours with a standard deviation of 80 hours. Test the
manufacturerʹs claim. Use α = 0.05.
19) A manufacturer claims that the mean lifetime of its fluorescent bulbs is 1000 hours. A homeowner selects 25
bulbs and finds the mean lifetime to be 980 hours with a standard deviation of 80 hours. If α = 0.05, test themanufacturerʹs claim using confidence intervals.
20) A trucking firm suspects that the mean life of a certain tire it uses is less than 35,000 miles. To check the claim,
the firm randomly selects and tests 18 of these tires and gets a mean lifetime of 34,400 miles with a standard
deviation of 1200 miles. At α = 0.05, test the trucking firmʹs claim.
3 Test a Claim About a Mean Using a P-value
SHORT ANSWER. Write the word or phrase that best completes each statement or answers the question.
Provide an appropriate response.
21) A local group claims that the police issue more than 60 speeding tickets a day in their area. To prove their
point, they randomly select two weeks. Their research yields the number of tickets issued for each day. The
data are listed below. At α = 0.01, test the groupʹs claim using P-values.
70 48 41 68 69 55 70
57 60 83 32 60 72 58
22) A manufacturer claims that the mean lifetime of its fluorescent bulbs is 1000 hours. A homeowner selects 25
bulbs and finds the mean lifetime to be 980 hours with a standard deviation of 80 hours. If α = 0.05, test the
manufacturerʹs claim using P-values.
23) A fast food outlet claims that the mean waiting time in line is less than 3.3 minutes. A random sample of 20
customers has a mean of 3.1 minutes with a standard deviation of 0.8 minute. If α = 0.05, test the fast foodoutletʹs claim using P-values.
Page 141
Copyright © 2012 Pearson Education, Inc.

7/26/2019 les5e_ptb_07
http://slidepdf.com/reader/full/les5eptb07 11/19
24) A local school district claims that the number of school days missed by its teachers due to illness is below the
national average of μ = 5. A random sample of 28 teachers provided the data below. At α = 0.05, test the
districtʹs claim using P-values.
0 3 6 3 3 5 4 1 3 5
7 3 1 2 3 3 2 4 1 6
2 5 2 8 3 1 2 5
7.4 Hypothesis Testing for Proportions
1 Test a Claim About a Proportion
MULTIPLE CHOICE. Choose the one alternative that best completes the statement or answers the question.
Provide an appropriate response.
1) Determine whether the normal sampling distribution can be used. The claim is p < 0.25 and the sample size is
n = 18.
A) Do not use the normal distribution. B) Use the normal distribution.
2) Determine whether the normal sampling distribution can be used. The claim is p ≥ 0.325 and the sample size is
n = 42.
A) Use the normal distribution. B) Do not use the normal distribution.
3) Determine the critical value, z0 , to test the claim about the population proportion p = 0.250 given n = 48
and p^ = 0.231. Use α = 0.01.
A) ±2.575 B) ±1.96 C) ±1.645 D) ±2.33
4) Determine the standardized test statistic, z, to test the claim about the population proportion p = 0.250 given
n = 48 and p^ = 0.231. Use α = 0.01.
A) -0.304 B) -1.18 C) -0.23 D) -2.87
SHORT ANSWER. Write the word or phrase that best completes each statement or answers the question.
5) Test the claim about the population proportion p ≠ 0.325 given n = 42 and p = 0.247. Use α = 0.05.
6) Fifty-five percent of registered voters in a congressional district are registered Democrats. The Republican
candidate takes a poll to assess his chances in a two -candidate race. He polls 1200 potential voters and finds
that 621 plan to vote for the Republican candidate. Does the Republican candidate have a chance to win? Use
α = 0.05.
7) An airline claims that the no-show rate for passengers is less than 5%. In a sample of 420 randomly selected
reservations, 19 were no-shows. At α= 0.01, test the airlineʹs claim.
8) A recent study claimed that at least 15% of junior high students are overweight. In a sample of 160 students, 18
were found to be overweight. At α = 0.05, test the claim.
9) A recent study claimed that at least 15% of junior high students are overweight. In a sample of 160 students, 18
were found to be overweight. If α = 0.05, test the claim using P-values.
10) A recent study claimed that at least 15% of junior high students are overweight. In a sample of 160 students, 18
were found to be overweight. If α = 0.05, test the claim using confidence intervals.
11) The engineering school at a major university claims that 20% of its graduates are women. In a graduating class
of 210 students, 58 were women. Does this suggest that the school is believable? Use α = 0.05.
Page 142
Copyright © 2012 Pearson Education, Inc.

7/26/2019 les5e_ptb_07
http://slidepdf.com/reader/full/les5eptb07 12/19
12) A coin is tossed 1000 times and 570 heads appear. At α = 0.05, test the claim that this is not a biased coin. Does
this suggest the coin is fair?
13) A telephone company claims that 20% of its customers have at least two telephone lines. The company selects a
random sample of 500 customers and finds that 88 have two or more telephone lines. At α = 0.05, does the data
support the claim? Use a P-value.
14) A telephone company claims that 20% of its customers have at least two telephone lines. The company selects
a random sample of 500 customers and finds that 88 have two or more telephone lines. If α = 0.05, test the
companyʹs claim using critical values and rejection regions.
15) A telephone company claims that 20% of its customers have at least two telephone lines. The company selects
a random sample of 500 customers and finds that 88 have two or more telephone lines. If α = 0.05, test the
companyʹs claim using confidence intervals.
16) A coin is tossed 1000 times and 530 heads appear. At α = 0.05, test the claim that this is not a biased coin. Use a
P-value. Does this suggest the coin is fair?
7.5 Hypothesis Testing for Variance and Standard Deviation
1 Find Critical Values
MULTIPLE CHOICE. Choose the one alternative that best completes the statement or answers the question.
Provide an appropriate response.
1) Find the critical X2 -values to test the claim σ2 = 4.3 if n = 12 and α = 0.05.
A) 3.816, 21.920 B) 2.603, 26.757 C) 3.053, 24.725 D) 4.575, 19.675
2) Find the critical X2 -value to test the claim σ2 ≥ 1.8 if n = 15 and α = 0.05.
A) 6.571 B) 4.075 C) 4.660 D) 5.629
3) Find the critical X2 -value to test the claim σ2 ≤ 3.2 if n = 20 and α = 0.01.
A) 36.191 B) 27.204 C) 30.144 D) 32.852
4) Find the critical X2 -value to test the claim σ2 > 1.9 if n = 18 and α = 0.01.
A) 33.409 B) 27.587 C) 30.181 D) 35.718
5) Find the critical X2 -value to test the claim σ2 < 5.6 if n = 28 and α = 0.10.
A) 18.114 B) 14.573 C) 16.151 D) 36.741
6) Find the critical X2 -values to test the claim σ2 ≠ 6.8 if n = 10 and α = 0.01.
A) 1.735, 23.589 B) 2.088, 21.666 C) 2.700, 19.023 D) 3.325, 16.919
2 Test Claims About Variances and Standard Deviations
MULTIPLE CHOICE. Choose the one alternative that best completes the statement or answers the question.
Provide an appropriate response.
7) Compute the standardized test statistic, X2 , to test the claim σ2 = 21.5 if n = 12, s2 = 18, and α = 0.05.
A) 9.209 B) 12.961 C) 18.490 D) 0.492
8) Compute the standardized test statistic, X2 , to test the claim σ2 ≥ 14.4 if n = 15, s2 = 12, and α = 0.05.
A) 11.667 B) 8.713 C) 12.823 D) 23.891
Page 143
Copyright © 2012 Pearson Education, Inc.
7/26/2019 les5e_ptb_07
http://slidepdf.com/reader/full/les5eptb07 13/19
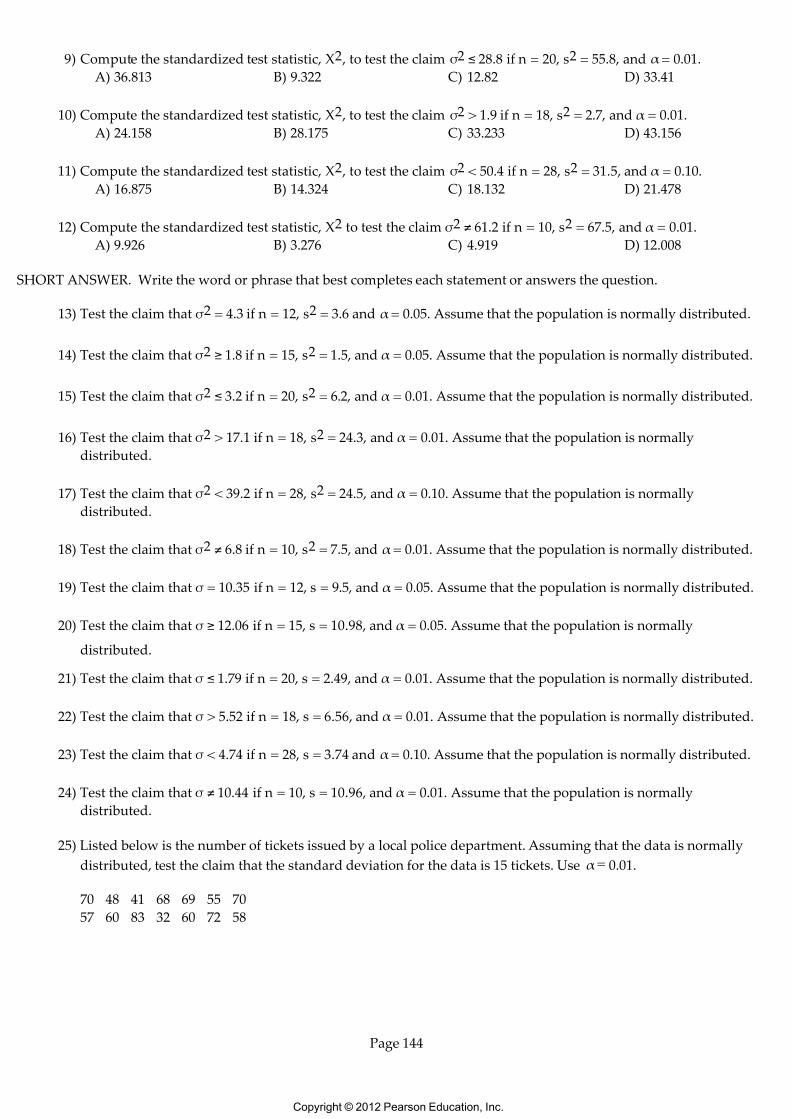
9) Compute the standardized test statistic, X2 , to test the claim σ2 ≤ 28.8 if n = 20, s2 = 55.8, and α = 0.01.
A) 36.813 B) 9.322 C) 12.82 D) 33.41
10) Compute the standardized test statistic, X2 , to test the claim σ2 > 1.9 if n = 18, s2 = 2.7, and α = 0.01.
A) 24.158 B) 28.175 C) 33.233 D) 43.156
11) Compute the standardized test statistic, X2 , to test the claim σ2 < 50.4 if n = 28, s2 = 31.5, and α = 0.10.
A) 16.875 B) 14.324 C) 18.132 D) 21.478
12) Compute the standardized test statistic, X2 to test the claim σ2 ≠ 61.2 if n = 10, s2 = 67.5, and α = 0.01.
A) 9.926 B) 3.276 C) 4.919 D) 12.008
SHORT ANSWER. Write the word or phrase that best completes each statement or answers the question.
13) Test the claim that σ2 = 4.3 if n = 12, s2 = 3.6 and α = 0.05. Assume that the population is normally distributed.
14) Test the claim that σ2 ≥ 1.8 if n = 15, s2 = 1.5, and α = 0.05. Assume that the population is normally distributed.
15) Test the claim that σ2 ≤ 3.2 if n = 20, s2 = 6.2, and α = 0.01. Assume that the population is normally distributed.
16) Test the claim that σ2 > 17.1 if n = 18, s2 = 24.3, and α = 0.01. Assume that the population is normally
distributed.
17) Test the claim that σ2 < 39.2 if n = 28, s2 = 24.5, and α = 0.10. Assume that the population is normally
distributed.
18) Test the claim that σ2 ≠ 6.8 if n = 10, s2 = 7.5, and α = 0.01. Assume that the population is normally distributed.
19) Test the claim that σ = 10.35 if n = 12, s = 9.5, and α = 0.05. Assume that the population is normally distributed.
20) Test the claim that σ ≥ 12.06 if n = 15, s = 10.98, and α = 0.05. Assume that the population is normally
distributed.
21) Test the claim that σ ≤ 1.79 if n = 20, s = 2.49, and α = 0.01. Assume that the population is normally distributed.
22) Test the claim that σ > 5.52 if n = 18, s = 6.56, and α = 0.01. Assume that the population is normally distributed.
23) Test the claim that σ < 4.74 if n = 28, s = 3.74 and α = 0.10. Assume that the population is normally distributed.
24) Test the claim that σ ≠ 10.44 if n = 10, s = 10.96, and α = 0.01. Assume that the population is normally
distributed.
25) Listed below is the number of tickets issued by a local police department. Assuming that the data is normally
distributed, test the claim that the standard deviation for the data is 15 tickets. Use α= 0.01.
70 48 41 68 69 55 70
57 60 83 32 60 72 58
Page 144
Copyright © 2012 Pearson Education, Inc.

7/26/2019 les5e_ptb_07
http://slidepdf.com/reader/full/les5eptb07 14/19
26) The heights (in inches) of 20 randomly selected adult males are listed below. Test the claim that the variance is
less than 6.25. Use α = 0.05. Assume the population is normally distributed.
70 72 71 70 69 73 69 68 70 71
67 71 70 74 69 68 71 71 71 72
27) The heights (in inches) of 20 randomly selected adult males are listed below. Test the claim that the variance is
less than 6.25. Assume the population is normally distributed. Use α= 0.05 and confidence intervals.
70 72 71 70 69 73 69 68 70 7167 71 70 74 69 68 71 71 71 72
28) A trucking firm suspects that the variance for a certain tire is greater than 1,000,000. To check the claim, the
firm puts 101 of these tires on its trucks and gets a standard deviation of 1200 miles. At α = 0.05, test the
trucking firmʹs claim.
29) A trucking firm suspects that the variance for a certain tire is greater than 1,000,000. To check the claim, the
firm puts 101 of these tires on its trucks and gets a standard deviation of 1200 miles. If α = 0.05, test the
trucking firmʹs claim using confidence intervals.
30) A local bank needs information concerning the standard deviation of the checking account balances of itscustomers. From previous information it was assumed to be $250. A random sample of 61 accounts was
checked. The standard deviation was $286.20. At α = 0.01, test the bankʹs assumption. Assume that the account
balances are normally distributed.
31) In one area, monthly incomes of college graduates have a standard deviation of $650. It is believed that the
standard deviation of monthly incomes of non -college graduates is higher. A sample of 71 non-college
graduates are randomly selected and found to have a standard deviation of $950. Test the claim that
non-college graduates have a higher standard deviation. Use α= 0.05.
32) A statistics professor at an all-womenʹs college determined that the standard deviation of womenʹs heights is
2.5 inches. The professor then randomly selected 41 male students from a nearby all -male college and found
the standard deviation to be 2.9 inches. Test the professorʹs claim that the standard deviation of male heights isgreater than 2.5 inches. Use α = 0.01.
3 Test Claims About Variances and Standard Deviations Using a P -value
SHORT ANSWER. Write the word or phrase that best completes each statement or answers the question.
Provide an appropriate response.
33) The heights (in inches) of 20 randomly selected adult males are listed below. Test the claim that the variance is
less than 6.25. Assume the population is normally distributed. Use α= 0.05 and P-values.
70 72 71 70 69 73 69 68 70 71
67 71 70 74 69 68 71 71 71 72
34) A trucking firm suspects that the variance for a certain tire is greater than 1,000,000. To check the claim, the
firm puts 101 of these tires on its trucks and gets a standard deviation of 1200 miles. If α = 0.05, test the
trucking firmʹs claim using P-values.
Page 145
Copyright © 2012 Pearson Education, Inc.
7/26/2019 les5e_ptb_07
http://slidepdf.com/reader/full/les5eptb07 15/19
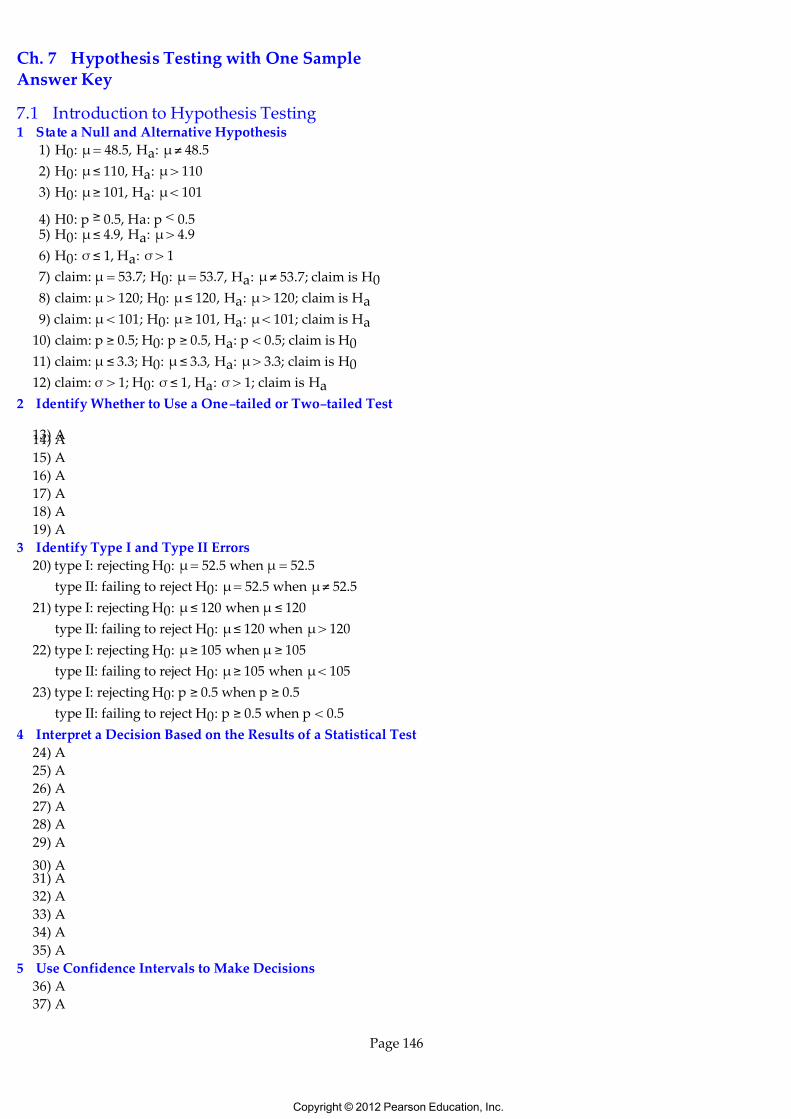
Ch. 7 Hypothesis Testing with One SampleAnswer Key
7.1 Introduction to Hypothesis Testing1 State a Null and Alternative Hypothesis
1) H0: μ = 48.5, Ha: μ≠ 48.5
2) H0: μ≤ 110, Ha: μ > 110
3) H0: μ≥ 101, Ha: μ < 101
4) H0: p ≥ 0.5, Ha: p < 0.55) H0: μ≤ 4.9, Ha: μ > 4.9
6) H0: σ ≤ 1, Ha: σ > 1
7) claim: μ = 53.7; H0: μ = 53.7 , Ha: μ≠ 53.7; claim is H0
8) claim: μ > 120; H0: μ≤ 120 , Ha: μ > 120; claim is Ha
9) claim: μ < 101; H0: μ≥ 101, Ha: μ < 101; claim is Ha
10) claim: p ≥ 0.5; H0: p ≥ 0.5, Ha: p < 0.5; claim is H0
11) claim: μ ≤ 3.3; H0: μ≤ 3.3, Ha: μ > 3.3; claim is H0
12) claim: σ > 1; H0: σ ≤ 1, Ha: σ > 1; claim is Ha
2 Identify Whether to Use a One-tailed or Two-tailed Test
13) A14) A
15) A
16) A
17) A
18) A
19) A
3 Identify Type I and Type II Errors
20) type I: rejecting H0: μ = 52.5 when μ = 52.5
type II: failing to reject H0: μ= 52.5 when μ≠ 52.5
21) type I: rejecting H0: μ≤ 120 when μ ≤ 120
type II: failing to reject H0: μ≤ 120 when μ> 120
22) type I: rejecting H0: μ≥ 105 when μ ≥ 105
type II: failing to reject H0: μ≥ 105 when μ< 105
23) type I: rejecting H0: p ≥ 0.5 when p ≥ 0.5
type II: failing to reject H0: p ≥ 0.5 when p < 0.5
4 Interpret a Decision Based on the Results of a Statistical Test
24) A
25) A
26) A
27) A
28) A
29) A
30) A31) A
32) A
33) A
34) A
35) A
5 Use Confidence Intervals to Make Decisions
36) A
37) A
Page 146
Copyright © 2012 Pearson Education, Inc.

7/26/2019 les5e_ptb_07
http://slidepdf.com/reader/full/les5eptb07 16/19
6 Concepts
38) A
39) A
7.2 Hypothesis Testing for the Mean (Large Samples)1 Find P-values
1) A
2) A
3) A
4) A
2 Test
a
Claim
About
a
Mean
Using
P-
values
5) A
6) A
7) A
8) Fail to reject H0; There is not enough evidence to support the fast food outletʹs claim that the mean waiting time is less
than 3.4 minutes.
9) P-value = 0.000001, P < α , reject H0; There is sufficient evidence to support the school districtʹs claim.
3 Find Critical Values
10) A
11) A
12) A
13) A14) A
15) A
4 Test a Claim About a Mean
16) A
17) A
18) A
19) A
20) A
21) A
22) A
23) standardized test statistic ≈ 1.77; critical value = 1.645; reject H0; There is enough evidence to support the claim.
24) standardized test statistic ≈ -1.97; critical value = ±1.96; reject H0; There is enough evidence to support the claim.25) standardized test statistic ≈ 2.65; critical value = 2.33; reject H0. There is enough evidence to reject the claim.
26) standardized test statistic ≈ -2.16, critical value = ±2.575, fail to reject H0; There is not enough evidence to reject the
claim.
27) standardized test statistic ≈ -3.03; critical value z0 = -2.33; reject H0; The data support the agencyʹs claim.
28) standardized test statistic ≈ -1.58; critical value z0 = ±1.96; fail to reject H0; There is not sufficient evidence to reject
the manufacturerʹs claim.
29) standardized test statistic ≈ -3.74; critical value z0 = -1.645; reject H0; There is sufficient evidence to support the
trucking firmʹs claim.
30) standardized test statistic ≈ -3.58; critical value z0 = -1.645; reject H0; There is sufficient evidence to support the
politicianʹs claim.
31) x = 60.4, s = 12.2, standardized test statistic ≈ 0.18; critical value z0 = 2.33; fail to reject H0; There is not sufficient
evidence to reject the claim.
32) Standardized test statistic ≈ 1.29; critical value z0 = -1.645; fail to reject H0; There is not enough evidence to support
the fast food outletʹs claim.
33) Confidence interval (3.47, 3.73); 3.5 lies in the interval, fail to reject H0; There is not enough evidence to support the
fast food outletʹs claim.
34) Standardized test statistic ≈ -4.71; critical value z0 = -1.645; reject H0; There is sufficient evidence to support the
districtʹs claim.
Page 147
Copyright © 2012 Pearson Education, Inc.
7/26/2019 les5e_ptb_07
http://slidepdf.com/reader/full/les5eptb07 17/19
35) Confidence interval (2.84, 3.96); 5 lies outside the interval, reject H0; There is sufficient evidence to support the
districtʹs claim.
7.3 Hypothesis Testing for the Mean (Small Samples)1 Find Critical Values in a t-distribution
1) A
2 Test a Claim About a Mean
2) A
3) A
4) A5) A
6) A
7) A
8) t0 = ±3.106, standardized test statistic ≈ 1.890, fail to reject H0; There is not sufficient evidence to reject the claim.
9) t0 = -1.833, standardized test statistic ≈ -2.189, reject H0; There is sufficient evidence to reject the claim
10) t0 = 1.761, standardized test statistic ≈ 1.452, fail to reject H0; There is not sufficient evidence to reject the claim
11) t0 = -1.328, standardized test statistic ≈ -0.894, fail to reject H0; There is not sufficient evidence to support the claim
12) t0 = 2.797, standardized test statistic ≈ 1.667, fail to reject H0; There is not sufficient evidence to support the claim
13) t0 = ±3.106, standardized test statistic ≈ -0.825, fail to reject H0; There is not sufficient evidence to support the claim
14) critical value t0 = -2.539; standardized test statistic ≈ -2.981; reject H0; There is sufficient evidence to support the
Metropolitan Bus Companyʹs claim.15) critical value t0 = -2.539; standardized test statistic ≈ -1.917; fail to reject H0; There is not sufficient evidence to
support the government agencyʹs claim.
16) x = 60.21, s = 13.43; critical value t0 = 2.650; standardized test statistic ≈ 0.060; fail to reject H0; There is not sufficient
evidence to support the claim.
17) Confidence interval (50.70, 69.73); 60 lies in the interval, fail to reject H0; There is not sufficient evidence to reject the
groupʹs claim.
18) critical value t0 = ±2.064; standardized test statistic ≈ -1.875; fail to reject H0; There is not sufficient evidence to reject
the manufacturerʹs claim.
19) Confidence interval (946.98, 1013.02); 1000 lies in the interval, fail to reject H0; There is not sufficient evidence to reject
the manufacturerʹs claim.
20) critical value t0 = -1.740; standardized test statistic -2.121; reject H0; There is sufficient evidence to support thetrucking firmʹs claim.
3 Test a Claim About a Mean Using a P-value
21) P-value = 0.4766. Since the P-value is great than α , there is not sufficient evidence to support the the groupʹs claim.
22) Standardized test statistic ≈ -1.25; Therefore, at a degree of freedom of 24, P must be between 0.10 and 0.25. P > α , fail
to reject H0; There is not sufficient evidence to reject the manufacturerʹs claim.
23) Standardized test statistic ≈ -1.118; Therefore, at 19 degrees of freedom, P must lie between 0.10 and 0.25. Since P > α ,
fail to reject H0. There is not sufficient evidence to support the fast food outletʹs claim.
24) standardized test statistic ≈ -4.522; Therefore, at a degree of freedom of 27, P must lie between 0.0001 and 0.00003. P <
α , reject H0. There is sufficient evidence to support the school districtʹs claim.
7.4 Hypothesis Testing for Proportions
1 Test
a
Claim
About
a
Proportion1) A
2) A
3) A
4) A
5) critical value z0 = ±1.96; standardized test statistic ≈ -1.08; fail to reject H0; There is not sufficient evidence to support
the claim.
6) critical value z0 = 1.645; standardized test statistic ≈ 1.21; fail to reject H0; There is not sufficient evidence to support
the claim p > 0.5. The Republican candidate has no chance.
Page 148
Copyright © 2012 Pearson Education, Inc.

7/26/2019 les5e_ptb_07
http://slidepdf.com/reader/full/les5eptb07 18/19
7) critical value z0 = -2.33; standardized test statistic ≈ - 0.45; fail to reject H0; There is not sufficient evidence to support
the airlineʹs claim.
8) critical value z0 = -1.645; standardized test statistic ≈ -1.33; fail to reject H0; There is not sufficient evidence to reject
the claim.
9) α = 0.05; P-value = 0.0918; P > α , fail to reject H0; There is not sufficient evidence to reject the studyʹs claim.
10) Confidence interval (0.071, 0.154); 15% lies in the interval, fail to reject H0; There is not sufficient evidence to reject the
studyʹs claim.
11) critical value z0 = ±1.96; standardized test statistic ≈ 2.76; reject H0; There is enough evidence to reject the universityʹs
claim. The school is not believable.12) critical value z0 = ±1.96; standardized test statistic ≈ 4.43; reject H0; There is enough evidence to reject the claim that
this is not a biased coin. The coin is not fair.
13) α = 0.05; P-value = 0.0901; P > α; fail to reject H0; There is not sufficient evidence to reject the telephone companyʹs
claim.
14) Standardized test statistic ≈ -1.34; critical value z0 = ±1.96; fail to reject H0; There is not sufficient evidence to reject
the companyʹs claim.
15) Confidence interval (0.143, 0.209); 20% lies in the interval, fail to reject H0; There is not sufficient evidence to reject the
companyʹs claim.
16) α = 0.05; P-value = 0.0574; P > α; fail to reject H0; There is not enough evidence to reject the claim that this is not a
biased coin. The coin is fair.
7.5 Hypothesis Testing for Variance and Standard Deviation1 Find Critical Values
1) A
2) A
3) A
4) A
5) A
6) A
2 Test Claims About Variances and Standard Deviations
7) A
8) A
9) A
10) A11) A
12) A
13) critical values X 2L = 3.816 and X
2R = 21.920; standardized test statistic X2 = 9.209; fail to reject H0; There is not
sufficient evidence to reject the claim.
14) critical value X 20 = 6.571; standardized test statistic X2 ≈ 11.667; fail to reject H0; There is not sufficient evidence to
reject the claim.
15) critical value X 20 = 36.191; standardized test statistic X2 ≈ 36.813; reject H0; There is sufficient evidence to reject the
claim.
16) critical value X 20 = 33.409; standardized test statistic X2 ≈ 24.158; fail to reject H0; There is not sufficient evidence to
reject the claim.
17) critical value X 20 = 18.114; standardized test statistic X2 ≈ 16.875; reject H0; There is sufficient evidence to support the
claim.
Page 149
Copyright © 2012 Pearson Education, Inc.
7/26/2019 les5e_ptb_07
http://slidepdf.com/reader/full/les5eptb07 19/19
18) critical values X 2L = 1.735 and X
2R = 23.589; standardized test statistic X2 ≈ 9.926; fail to reject H0; There is not
sufficient evidence to support the claim.
19) critical values X 2L = 3.816 and X
2R = 21.920; standardized test statistic X2 ≈ 9.267; fail to reject H0; There is not
sufficient evidence to reject the claim.
20) critical value X 20 = 6.571; standardized test statistic X2 ≈ 11.605; fail to reject H0; There is not sufficient evidence to
reject the claim.
21) critical value X 20 = 36.191; standardized test statistic X2 ≈ 36.766; reject H0; There is sufficient evidence to reject the
claim.
22) critical value X 20 = 33.409; standardized test statistic X2 ≈ 24.009; fail to reject H0; There is not sufficient evidence to
support the claim.
23) critical value X 20 = 18.114; standardized test statistic X2 ≈ 16.809; reject H0; There is sufficient evidence to support the
claim.
24) critical values X 2L = 1.735 and X
2R = 23.589; standardized test statistic X2 ≈ 9.919; fail to reject H0; There is not
sufficient evidence to support the claim.
25) critical values X 2L = 3.565 and X
2R = 29.819; standardized test statistic X2 ≈ 10.42; fail to reject H0; There is not
sufficient evidence to reject the claim.
26) critical value X 20 = 10.117; standardized test statistic X2 ≈ 9.048; reject H0; There is sufficient evidence to support the
claim.
27) Confidence interval (1.89, 5.62); 6.25 lies outside the interval, reject H0; There is sufficient evidence to support the
claim.
28) critical value X 20 = 124.342; standardized test statistic X2 = 144; reject H0; There is sufficient evidence to support the
claim.
29) Confidence interval (1,847,835, 1,940,125); 1,000,000 lies outside the interval, reject H0; There is sufficient evidence to
support the claim.
30) critical values X 2L = 35.534 and X
2R = 91.952; standardized test statistic X2 ≈ 78.634; fail to reject H0; There is not
sufficient evidence to reject the claim.
31) critical value X 20 = 90.531; standardized test statistics X2 = 149.527; reject H0; There is sufficient evidence to support
the claim.
32) critical value X 20 = 63.691; standardized test statistic X2 = 53.824; fail to reject H0; There is not sufficient evidence to
support the claim.
3 Test Claims About Variances and Standard Deviations Using a P -value
33) Standardized test statistic ≈ 9.048; Therefore, at a degree of freedom of 19, P must be between 0.025 and 0.05. P < α ,
reject H0; There is sufficient evidence to support the claim.
34) Standardized test statistic ≈ 144; Therefore, at a degree of freedom of 100, P must be less than 0.005. P < α , reject H0;
There is sufficient evidence to support the firmʹs claim.
Page 150


