
Laser ablation ICP-MS in paleoceanography: A regional...
81
Laser ablation ICP-MS in paleoceanography: A regional study on the benthic foraminifer Oridorsalis umbonatus in the Benguela Upwelling Area off Namibia Dissertation zur Erlangung des Doktorgrades der Naturwissenschaften am Fachbereich Geowissenschaften der Universit¨ at Bremen vorgelegt von S¨ ohnke Rathmann Bremen, August 2008
Transcript of Laser ablation ICP-MS in paleoceanography: A regional...
Laser ablation ICP-MS in paleoceanography:A regional study on the benthic foraminiferOridorsalis umbonatus in the Benguela
Upwelling Area off Namibia
Dissertation zur Erlangung desDoktorgrades der Naturwissenschaften
am Fachbereich Geowissenschaftender Universitat Bremen
vorgelegt von
Sohnke Rathmann
Bremen, August 2008

II
Tag des Kolloquiums:12. Dezember 2008
Gutachter:Prof. Dr. Gerold Wefer
Prof. Dr. Andreas Mackensen
Prufer:PD Dr. Matthias Zabel
Prof. Dr. Tilo von Dobeneck
III

IV
DanksagungFur die Vergabe der Arbeit und die Betreuung mochte ich mich ganz herzlich bei Prof.Dr. Gerold Wefer bedanken. Mein gleichfalls besonderer Dank geht an Dr. StefanMulitza, der mir immer mit Unterstutzung, Ideen und zur Diskussionen zur Seite standund die Arbeit dadurch entscheidend weiter brachte. Fur die freundliche Ubernahmedes Zweitgutachtens gilt mein Dank Prof. Dr. Andreas Mackensen.Dr. Henning Kuhnert danke ich dafur, mir die Geheimnisse des Laser ablation Sy-
stems und des Massenspektrometers naher gebracht zu haben um so den Foraminife-ren ihre Geheimnisse zu entlocken.Desweiteren gilt mein Dank Kapitan und Crew auf FS METEOR auf der Reise
M57/2 sowie den Kolleginnen und Kollegen, im besonderen denen aus dem Geolabor,an Bord. Es war eine schone und erfolgreiche Zeit mit Euch an Bord!Weiterhin gilt mein Dank all jenen Kolleginnen und Kollegen aus dem Fachbereich,
die fur das tolle Arbeitsklima gesorgt haben und immer zu Diskussionen bereit waren.Vor allem waren dies Oscar Romero, Barbara Donner, Andre Paul, Harald Paulsen,Ismene Seeberg-Elverfeldt und Snjezana Zaric. Die beiden letztgenannten sowie mei-ne Zimmergenossin Iris Wilke sorgten mit Ihren Computerproblemen auch gerne furkurzere Ablenkungen. Nach der Losung der Problemchen (meistens war es ja nichtmehr) konnte ich mich wieder mit frischem Elan in die eigentliche Arbeit sturzen!Weiterhin danke ich Iris Wilke und Rik Tjallingii die sich das Buro mit mir geteilthaben. Es gab immer nette Diskussionen mit Euch, auch wenn sie nicht alle fachlichwaren.Fur die Unterstutung bei den analytischen Untersuchungen danke ich Dr. Barbara
Donner und Dr. Sylvia Hess, die mir die planktischen und benthischen Foraminiferennaher gebracht habe, Dr. Oscar Romero der mich in den XRF-Scanner eingewiesenund mit mir zusammen die Kerne von M57/2 gemessen hat, sowie Dr. Monika Seglund Ihr Team fur die Messung der stabilen Isotopen.Meiner Frau Cessna und meiner Familie danke ich dafur, daß sie mich immer un-
terstutzt haben, vor allem, wenn es mit der Arbeit mal nicht so gut lief. Ihr habt mirimmer wieder die notige Kraft und Energie gegeben diese Arbeit zu verwirklichen,auch wenn es dann doch etwas langer gedauert hat, sie zum Abschluß zu bringen!Fur die letzten Korrekturen und den ”Feinschliff“ mochte ich mich neben den Co-Autoren der Artikel (Kapitel 2–4) besonders bei Iris und Snjezana bedanken, die bereit
waren meine Einleitung und das Schlußwort mit hilfreichen Hinweisen zu versehen!Diese Arbeit wurde von der Deutschen Forschungsgemeinschaft im Rahmen des
Forschungszentrums Ozeanrander finanziell unterstutzt.
V

VI
Table of Contents
Abstract 1
1. Introduction 31.1. Motivation and scientific objectives . . . . . . . . . . . . . . . . . . 31.2. Trace elements . . . . . . . . . . . . . . . . . . . . . . . . . . . . . 41.3. Working area . . . . . . . . . . . . . . . . . . . . . . . . . . . . . . 61.4. Material and Methods . . . . . . . . . . . . . . . . . . . . . . . . . . 9
1.4.1. Sample material . . . . . . . . . . . . . . . . . . . . . . . . 101.4.2. Sample preparation . . . . . . . . . . . . . . . . . . . . . . . 111.4.3. Trace element determination by laser ablation ICP-MS . . . . 121.4.4. Stable isotope determination by ICP-MS . . . . . . . . . . . 121.4.5. Geochemical properties . . . . . . . . . . . . . . . . . . . . 131.4.6. XRF-scanning . . . . . . . . . . . . . . . . . . . . . . . . . 13
1.5. Outline . . . . . . . . . . . . . . . . . . . . . . . . . . . . . . . . . 14
2. Mg/Ca ratios of the benthic foraminifera Oridorsalis umbonatusobtained by laser ablation from core top sediments: Relationshipto bottom water temperature 17Sohnke Rathmann, Silvia Hess, Henning Kuhnert and Stefan Mulitza
3. Carbonate ion effect on Mg/Ca, Sr/Ca and stable isotopes on thebenthic foraminifera Oridorsalis umbonatus off Namibia 29Sohnke Rathmann and Henning Kuhnert
4. Stratification of eastern South Atlantic (25◦S) upper water massesduring the Last Glacial Maximum 47Sohnke Rathmann, Henning Kuhnert, Andre Paul, Oscar Romeroand Stefan Mulitza
5. Conclusions and Outlook 57
A. Additional material 61
B. References 63
VII

Table of Contents
VIII
AbstractThe different benthic foraminiferal species (epibenthic as well as endobenthic) colo-nize wide areas of the ocean floor and are widely used for paleoceanographic recon-structions. To improve these reconstructions, it is an important part in research to con-tinuously develop and refine proxies by e.g. improving measuring techniques as wellas introducing other species in paleoceanograhpy. The main focus of the presentedthesis is a regional examination of the trace element ratios of the rarely used benthicforaminifer Oridorsalis umbonatus and the investigation of their suitability for paleo-ceanographic applications. Since O. umbonatus is not very abundant in the sediments,it was necessary – as a prerequisite for such studies – to investigate, whether laser ab-lation ICP-MS can be used for trace element measurements on benthic foraminifera.Therefore, as a first step, trace elements were measured using laser ablation ICP-MS
on a set of modern core top samples collected along a depth transect on the continentalslope off Namibia at 25.5◦S (320 − 2300m water depth; 2.9◦ to 10.4◦C). The Mg/Caratios where than calibrated against bottom water temperatures (BWT). The studydemonstrates clearly that benthic foraminiferal trace elements can be reliably mea-sured with the laser ablation technique and that the Mg/Ca ratio of O. umbonatus hasthe potential to be used as a proxy for BWTs. The resulting Mg/Ca–BWT relationshipofO. umbonatus is described by the exponential equationMg/Ca = 1.528∗e0.09∗BWT.The temperature sensitivity of this equation is similar to previously published calibra-tions based on Cibicidoides species suggesting that the Mg/Ca ratio of O. umbonatusis a valuable proxy for thermocline and deep water temperatures.For the last few years the influence of the carbonate ion concentration ([CO2–3 ])
on the trace element and stable isotope incorporation in calcareous shells has beenintensely discussed. Hence, the dependency on trace elements and stable isotopesin the tests of O. umbonatus was analysed as a second step. Modern core top sam-ples from the Namibian continental slope suggest that the shell composition of thisspecies is influenced by the chemistry of the pore-water. However, for these organic-rich sediments, the impact of ocean bottom water properties on both pore-water andshell chemistry is surprisingly small. Sr/Ca correlates negatively with [CO2–3 ] and toa lesser extent to Δ[CO2−
3 ], which is opposed to previous results. A correlation be-tween shell δ18O (corrected for temperature and δ18Oseawater) and [CO2–3 ] was found,however, the variability of the corrected δ18O is close to the analytical limit. No cleardependences were observed for δ13C and Mg/Ca on [CO2–3 ].In a third step, the above findings were used to investigate the changes in the water
mass stratification off Namibia between the Holocene and the Last Glacial Maximum(LGM). Trace elements and stable isotopes of O. umbonatus were measured on sixmulticores and six gravity cores to determine BWTs and salinity. The calculated seawater density reveals that our samples follow the water masses downslope in the reg-ular sequence. BWTs show nearly no changes between LGM and modern values.Interestingly, in the shallow cores, which were most influenced by LGM conditions,
1
Abstract
we even observe slightly warmer BWTs during the LGM, which are in contrast tothe findings of Niebler et al. (2003), who investigated inter alia nearby cores with amodified version of the Imbrie-Kipp-Tranfer-Function to reconstruct sea surface tem-peratures. This contrary changes in the sea surface and bottom water temperaturessuggest a shift in the water masses during the LGM.
2
1. Introduction
1.1. Motivation and scientific objectivesIn the field of paleoceanography scientists investigate the climate of the past. Theknowledge about ancient natural climatic variations is important to understand how theclimate system will react to changes, e.g. the raise of the atmospheric CO2-concentra-tion. Because it is not possible to measure ancient environmental conditions directly,we have to use measurable replacement indicators for e.g. the temperature. Thesereplacement indicators are called proxies. Proxies make it possible to reconstructpast climatic conditions and are useful to validate paleoceanographic models, whichin turn can be used for climate predictions (e.g. Houghton et al., 1995; Fischer andWefer, 1999; Houghton et al., 2001, and references therein).In general, proxies are calibrated using a modern reference dataset that includes a
range of both corresponding values, the one of the proxy and the one of the respectivetarget parameter. If their relationship is understood, the proxy can be applied to thesedimentary record for paleoceanographic reconstructions. Various constituents of thefauna and flora are used in paleoceanography. An excellent overview about the stateof the art of the different proxies is given in Wefer et al. (1999).The most used proxies to reconstruct water temperatures are alkenones, foramini-
feral assemblages, oxygen isotopes, coralline Sr/Ca ratios and foraminiferal Mg/Caratios, but there remains significant disagreement (up to 5◦C and up to 2000 years)between the temperatures reconstructed by these various proxies (Lea et al., 2000;Mollenhauer et al., 2005). Therefore it is crucial to understand the controls of differentpalaeotemperature proxies and to continuously refine them as well as develop newproxies to ensure that we can accurately reconstruct the past.Planktic and benthic foraminifera are widely distributed throughout the world’s
oceans and are major carbonate producers, which accounts for their high fossilizationpotential. Therefore, foraminifera have been used for the reconstruction of paleoen-vironmental parameters for many years (e.g. McCrea, 1950; Emiliani, 1955). In thiscontext not only the proxy itself, but also the chosen measuring technique can play animportant role. Boyle and Keigwin (1985) were among the first, who used a liquidsolution of foraminiferal shells to measure trace elements, and established a cleaningmethod, which even today is the basis for trace element measurements with liquidsolution on foraminiferal tests. However, not only is this cleaning procedure very ex-tensive, the liquid solution method also needs a certain amount of sample material. Yetthere are other methods to measure trace elements as well, like e.g. Laser AblationInductively Coupled Plasma Mass Spectrometry (LA-ICP-MS). This method is fastand reliable and needs less material in the process than the liquid solution method.In addition, the sample material is reusable for further investigations such as stableisotope measurements. A further benefit is the possibility to omit the time consuming
3
1. Introduction
cleaning method.Oridorsalis umbonatus is a benthic foraminiferal species that covers a broad depth
range (320−4000m water depth) as well as a wide time span since the Tertiary. Thesebroad temporal and spatial ranges make O. umbonatus an interesting species for fur-ther investigations. However, due to the often very limited number of tests being foundin the sediment, so far there have been only few investigations on this species worldwide. Moreover, as stated above, dependencies between proxies and target parame-ters are mostly calibrated with world wide reference datasets. However, especiallyfor benthic foraminifera, regional calibrations may be more effective and reasonablebecause they consider the specific regional circumstances that have more influence onbenthic species than on planktic foraminifera, which are more mobile. E.g. Lear et al.(2002) made a global calibration for a Mg/Ca-temperature relationship of O. umbona-tus, but they found only a weak regression (R2 = 0.4). A regional regression for thisspecies was never made, because mostly other species like Cibicidoides wuellerstorfitake precedence over O. umbonatus due to their higher frequency of occurence in theregion. Only through the introduction of the laser ablation method, which is able toproduce reliable results from significantly smaller amounts of sample material, thisspecies is now brought to the spotlight. Therefore, a regional calibration between itstrace element ratios and bottom water temperatures (BWT) using the new promisingmethod of laser ablation should be the first step to explore its potential in paleoceano-graphy.Based on the above considerations, the scientific objectives for this study were
• to test if laser ablation is applicable to measure trace elements onO. umbonatus,
• to calibrate the trace element ratios ofO. umbonatuswith the BWT for a specificregion (Benguela Upwelling System) and to compare the resulting calibrationwith other calibrations from the literature either on the same species (Lear et al.,2002) or on other benthic species in a comparable temperature range (Rosenthalet al., 1997),
• to investigate whether there is an influence of carbonate ion concentration([CO 2−
3 ]) and carbonate ion saturation (Δ[CO2−3 ]) on Mg/Ca, Sr/Ca and sta-
ble isotopes as discovered previously (e.g. Russell and Spero, 2000; Boyle andErez, 2003; Russell et al., 2004; Elderfield et al., 2006) and to quantify thispotential influence on the related parameters,
• to paleoceanographically apply the calibration on a timeslice from the sedimen-tary record (Last Glacial Maximum, LGM), and
• to compare our results for the BWT with the findings of Niebler et al. (2003),who investigated sea surface temperatures (SST) of the LGM in the same region,which were up to 10◦C lower than today.
1.2. Trace elementsThe analysis of a wide range of trace elements, like Cd, Ba, Mg, Sr and U to namethe most commonly used, has been applied in paleoceanography since the mid of the
4
1.2. Trace elements
last century. After it was used first on magmatic rocks, it became more and moreimportant on calcareous shells. Temperature dependencies of Mg/Ca and Sr/Ca ratiosare known since more than three decades (Oomori et al., 1987; Katz, 1973). The firstinvestigations to determine the relationship between the trace element incorporationand the temperature have been done on corals (Harriss and Almy, 1964). Besidescorals, trace elements are used from the calcareous shells of ostracodes (Muller, 2000;Morishita et al., 2007), foraminifera and, less frequently, bivalves (Epple, 2004) andotoliths of salmon (Arai et al., 2006). Most common is the temperature dependencyof the Sr/Ca ratio (if Sr/Ca is higher than 5 mmol/mol as e.g. in corals) or the Mg/Caratio (if Sr/Ca is lower than 5 mmol/mol as e.g. in foraminifera) (see Muller, 2000).Because of the low concentrations of trace elements in the shells, the usefulness of
trace element proxies was limited by the low accuracy of the measuring techniquesfor a long time. Significantly improved measurements, that are possible since justmore than a decade, now make this method a promising technique, which is able toprovide quantitative information about past climates. Mg/Ca ratios in foraminiferalcalcite are one of the most applied of these palaeotemperature proxies, and are used toassess past SST (Barker et al., 2005) and BWTs (Lear et al., 2000) from planktic andbenthic foraminifera, respectively. A powerful advantage in using the Mg/Ca palaeo-temperature proxy is the possibility to reconstruct the sea salinity if used together withthe foraminiferal calcite δ18O record, assuming the relationship between salinity andδ18O seawater is known (Wolff et al., 1999).The Mg/Ca ratios in modern planktic foraminifera have been demonstrated to be
primarily a function of the temperature and the Mg/Ca ratio of the water in which theygrew (Nurnberg et al., 1996; Lea et al., 2000; Elderfield and Ganssen, 2000; Dekenset al., 2002; Anand et al., 2003; Barker et al., 2005). The Mg/Ca ratio in seawateris spatially constant and changes on timescales of less than 1 million years due tothe very long residence times of both Mg and Ca in the oceans (Broecker and Peng,1982), but individual measurements show significant scatter around calibrations ofthe Mg/Ca palaeothermometer (Elderfield and Ganssen, 2000; Anand et al., 2003).Furthermore, there are notable differences between the various existing calibrationsderived from different ocean regions (e.g. for Globigerinoides ruber (white), Elder-field and Ganssen, 2000; Lear et al., 2002). Therefore, regional calibrations seem tobe appropriate.The degree of scatter limits the precision of Mg/Ca as a palaeotemperature proxy
and calls the accuracy of the technique into question. An unsuccessful attempt to ad-vance this method was conducted by Wu and Hillaire-Marcel (1995), who used laserablation instead of liquid solution on benthic foraminiferal tests. This new measuringtechnique was successful only after the development of new laser ablation systemswith a higher accuracy, which were applied on planktic foraminifera for the first time(Eggins et al., 2003; Reichart et al., 2003). Since this technique allows to measure se-veral tests per sediment sample and even to make multiple measurements per test, it ispossible to balance some scattering by excluding data off a 2σ level when calculatingthe mean for that sample. However it is likely, that there are additional oceanographicvariables that affect the incorporation of Mg into foraminiferal calcite. Laboratory cul-ture studies have shown that the carbonate ion concentration has an effect on Mg/Caratios in foraminifera but suggest that its influence is small in comparison with temper-ature (Lea, 1999; Nurnberg et al., 1996; Russell et al., 2004; Elderfield et al., 2006).
5

1. Introduction
In benthic foraminifera, increased Mg/Ca ratios have been observed to correlate withincreased carbonate ion concentrations (Elderfield et al., 2006; Boyle and Erez, 2003).In contrast, a laboratory study of planktic foraminifera (Russell et al., 2004), showeddecreasing Mg/Ca ratios with increasing carbonate ion concentrations.
1.3. Working areaThe working area is located off the coast of Namibia around 25◦S within the BenguelaUpwelling System. The Benguela high-productivity system is situated off SouthwestAfrica adjacent to the coasts of Namibia and South Africa (Figure 1.1). Its northernand southern boundaries are defined as the Angola-Benguela frontal zone and theAgulhas retroflection, respectively. The northern boundary is formed by the WalvisRidge which at about 19.5◦S is connected with the continental shelf via a shallow sill(< 2500m), that is referred to as Walvis Plateau.
Walvis Bay
Lüderitz
Benguela
Curre
nt
Surface current
undercurrent
Figure 1.1.: Overview map of the working area, including the main currents (black:surface currents, grey: undercurrents).
The shelf width and depth in the Cape Basin are variable. Double shelf breaksare common, in particular near Walvis Bay (23◦S, see Figure 1.2). The outer shelfis relatively deep in large areas with the major shelf break at a water depth of about400m. The SE trade winds are prevailing in the Benguela area, as described in detailby Shannon and Nelson (1996). Upwelling favourable winds are perennial in thenorthern part of the system, while in the South, distinct upwelling maxima occur in
6

1.3. Working area
spring and summer. Consequently, the upwelling system is commonly divided into anorthern part with perennial upwelling and a southern half with stronger seasonality.The border between the two subsystems is usually drawn near Luderitz at 27◦S. In thisstudy, we focus on the northern part near the border of the two subsystems.The prevailing southeasterly trade winds drive coastal upwelling of cold and nutri-
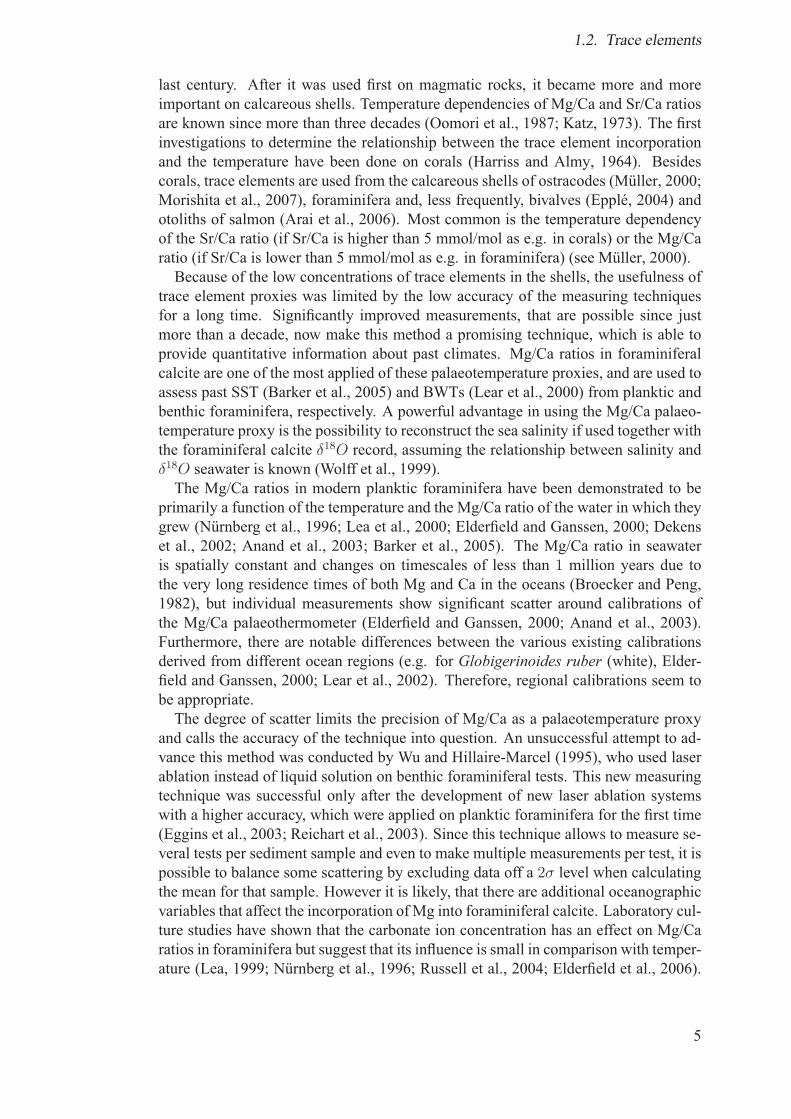
ent-rich waters originating from depths of 200−300m in the body of the South AtlanticCentral Water (Shannon, 1985). Upwelling of these nutrient-rich water masses leadsto high productivity resulting in high concentrations of chlorophyll-a in surface waters(Figure 1.3a) and low SST (Figure1.3b). Upwelling in the Benguela system occursin a number of distinct upwelling cells, which form at locations of maximum wind
Figure 1.2.: Temperature section off Walvis Bay (Moorholz and Heene, 2003a). Blackvertical lines indicate CTD-measurements.
stress curl and where there is a change in orientation of the coastline (Lutjeharms andMeeuwis, 1987; Shannon and Nelson, 1996). Upwelling events are strongest, mostfrequent, and extend furthest offshore at the Luderitz cell centered at 27◦S (see Fig-ure 1.3). Productivity is also high on the Walvis Plateau (near 19◦S) and near WalvisBay (22◦S) (Lutjeharms and Meeuwis, 1987; Summerhayes et al., 1995). However,there is some disagreement between different authors whether the high productivityat Walvis Bay results from upwelling as stated by Lutjeharms and Meeuwis (1987) orwhether the physical requirements for upwelling, such as wind stress, are not given inthe area (Shannon, 1985). Between 18◦S and 34◦S, a longshore thermal front coinci-dent with the shelf break demarcates the seaward extent of the upwelled water. Thisfront is highly convoluted and often disturbed by filaments and eddies, sometimes ex-tending as far as 1300km offshore (Summerhayes et al., 1995). On the offshore sideof the front, secondary upwelling may occur. It has been noted that enhanced phy-toplankton productivity often occurs not in the center of upwelling cells, but ratheroffshore and at the borders of or just outside upwelling sites (Lutjeharms and Stock-ton, 1987, and references therein). Therefore the development of an extensive andhighly convoluted field of filaments, eddies and thermal fronts, as can be found off-shore Luderitz, is favorable for high productivity.
7
1. Introduction
A poleward undercurrent has been reported for the shelf and the upper slope offNamibia (Shannon and Nelson, 1996) and can be modeled to follow the shelf breakusing a time-dependent, wind- and density-driven physical model (Fennel, 1999; Sko-gen, 1999). The structure of the shelf and slope and the temperature distribution areshown in Figure 1.2. Upwelling will occur on the shelf break (∼ 13◦E) and on theshelf ∼ 1.5◦ closer to the coast. Occasional bergwinds perpendicular to the coast
(a) Chlorophyll-a (b) SST
Figure 1.3.: Chlorophyll-a (a) and SST (b) maps with SeaWIFS data. The black boxin the left figure denotes the working area, the black line the transect.
are the dominant means of transport for terrestrial material in the prevailing arid cli-mate. However, only insignificant relative contributions of terrigenous particles to to-tal fluxes were observed in sediment traps (Wefer and Fischer, 1993; Giraudeau et al.,2000). Terrestrial input, in particular terrestrial input of organic matter, can thereforebe considered to be of minor importance in the area, which is also confirmed by thestable organic carbon isotope composition (δ13Corg) exhibiting consistently marinevalues in surface sediments (Fischer et al., 1998).Off Namibia, the surface layer is characterized by warm water of higher salinity
originating from the northern Benguela area. The SST increases offshore, whereas atthe coast a very weak upwelling structure is found. Below the surface mixed layerthe thermocline water off Namibia consists of two different central water masses andtheir mixing stages. Saline, nutrient rich but oxygen depleted South Atlantic Centralwater (SACW) originating from the tropical ecosystem enters the Benguela systemfrom the north covering the entire shelf and the continental margin to 12.2◦E. Fresher,nutrient-depleted and oxygen-rich Eastern South Atlantic Central Water (ESACW)is transported with the Benguela Current (BC) northward. The distribution of bothcentral water types is shown in Figure 1.4. In the upper central water layer (13◦Cisotherm, ∼ 150m depth) the SACW extends down to 24◦S and covers only the shelf.The major portion of the upwelled water at the coast is originating from this depth.This causes a higher on shore transport of central water. In the deeper layers the
8

1.4. Material and Methods
Figure 1.4.: Horizontal distribution of salinity at the 10◦C isotherm (left) and at the13◦C isotherm (right) off the Namibian coast. The front between the twocentral water types is depicted by the bold isoline. (Moorholz and Heene,2003b)
southward extension of SACW at the shelf increases (see salinity distribution at the10◦C isotherm, ∼ 250m depth). This may be caused by a higher intensity of the pole-ward undercurrent and a decreasing shore ward transport of ESACW. Due to theirdifferent oxygen and nutrient contents the distribution of central water masses playsan important role for the ventilation of the subsurface layer and the productivity of theBenguela Upwelling System (Moorholz and Heene, 2003b).The central water masses are underlain by the Antarctic IntermediateWater (AAIW).
The core of the AAIW can be identified using the salinity minimum at 800m depth asan indicator. The secondary salinity maximum close to 2200m is associated with theNorth Atlantic Deep Water (NADW).
1.4. Material and MethodsThe Department of Geosciences at Bremen University, especially the Sonderfor-schungsbereich (SFB) 261 “The South Atlantic in the Late Quaternary – Reconstruc-tion of Material Budgets and Current Systems”, had a research focus on the upwellingarea off Namibia since 1989, and a broad set of samples was collected and investi-gated. The aim of the SFB was the application and development of proxies for thereconstruction of current and productivity systems in the region over the last 300, 000years. These extensive investigations make this area an ideal field to test new measur-ing techniques and proxies from formerly less used species because of the broad rangeof published results to compare and validate the own findings with.
9
1. Introduction
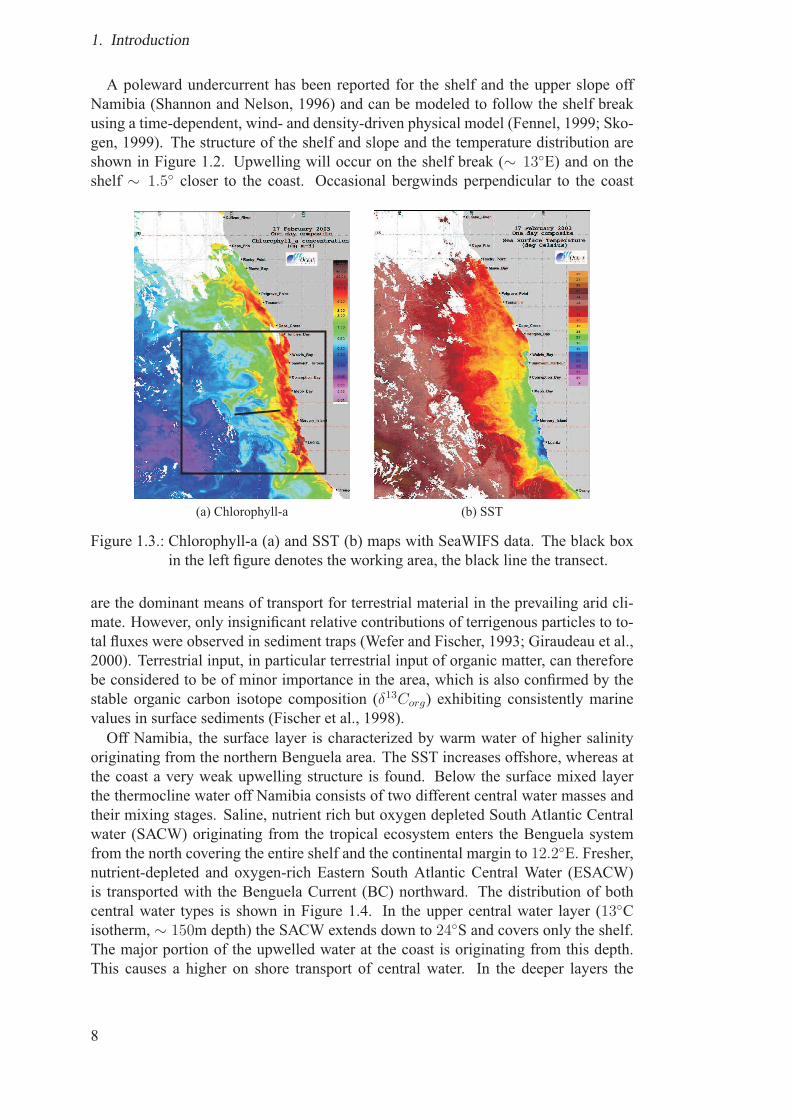
1.4.1. Sample materialOn the R/V METEOR cruises M34/1, M34/2 and M57/2 (Bleil and cruise partici-pants, 1996; Schulz and cruise participants, 1996; Zabel and cruise participants, 2003),multicores and gravity cores were collected on the shelf and the slope off Namibiabetween Walvis Bay in the north and Luderitz in the south from 50 − 3000m waterdepth (Figure 1.5). Bottom water temperatures were measured with a conductivity-temperature-depth logger (CTD SBE 911+) (Moorholz and Heene, 2003a) on eachmulticorer position on cruise M57/2.
Walvis Bay
Lüderitz
3606-1
Figure 1.5.: Core locations of the multicores and gravity cores off Namibia fromM34/1, M34/2 and M57/2 (Bleil and cruise participants, 1996; Schulzand cruise participants, 1996; Zabel and cruise participants, 2003). Reddiamonds: gravity cores; blue circles: multicores.
On board of R/V METEOR the sediments (mostly nannofossil ooze) were cutinto 1cm slices immediately upon recovery and were preserved and stained with anethanol/Rose Bengal solution, which stains only living cells. The multicores fromM57/2 (Zabel and cruise participants, 2003) were used to calibrate the Mg/Ca-tempe-rature-relationship for the endobenthic foraminiferal species O. umbonatus. The samemulticores and additional ones from M34/2 (Schulz and cruise participants, 1996)were used to improve the calibration and for further analyses on trace elements andstable isotopes.
10
1.4. Material and Methods
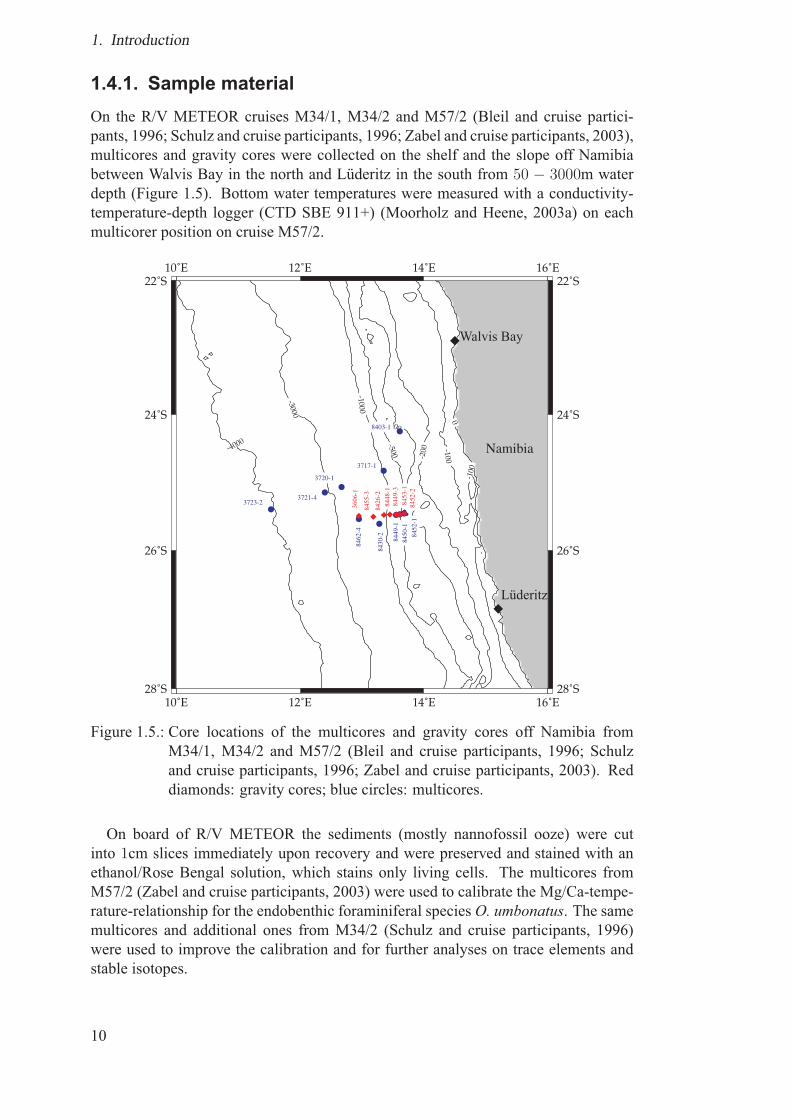
For the paleoceanographic application of the new proxy, gravity cores from M57/2(Zabel and cruise participants, 2003) and gravity core GeoB3606-1 fromM34/1 (Bleiland cruise participants, 1996) were used. Gravity corer with pipe lengths of either 6,12 or 18m, and a weight of 2.5 tons were deployed (see red diamonds in Figure 1.5).In order to retain the relative orientation of the cores, all liners used had been marked
Figure 1.6.: Scheme of the inscription of gravity core segments.
lengthwise with a straight line. On board, the sediment cores were cut into 1−metersections, closed up with caps on both ends and labeled according to a standard scheme(Figure 1.6). Core segments were cut into “archive” and “work” halves. The “archive”half was used for core description, smear slide sampling, core photography, and scan-ning of light reflectance. For geochemical and foraminiferal analyses the “work” halfwas sampled with two series of 10−ml syringes at 5cm intervals.
1.4.2. Sample preparationMulticores After the initial preparation on board as described in Section 1.4.1 thesamples were washed over a 125μm and a 63μm sieve and were dried at 50◦C atthe laboratory in Bremen. A binocular microscope was used to collect five to tenindividuals of O. umbonatus with a diameter of 300 − 400μm out of the topmostcm of each sample. Only well preserved tests (with all chambers) were used. In allsamples, Rose Bengal stained shells were present, which indicates modern sediments.The CTD-measured BWTs derived on cruise M57/2 fall well within the seasonal
temperature range derived from the World Ocean Atlas (WOA) (Levitus and Boyer,1994; Stephens et al., 2002) for the coring sites. The BWTs at the investigated sitescover a range from 2.9◦ to 10.4◦C. Since there are no CTD-data available for themulticorer positions from cruise M34/2, BWTs from the WOA (Stephens et al., 2002)were used for these positions.
Gravity cores In the laboratory in Bremen, the samples were washed over a 150μmand a 63μm sieve and dried at 50◦C. As for the multicorer samples, a binocular mi-croscope was used to find individuals of O. umbonatus. But unlike in the multicorer
11
1. Introduction
samples, it was not possible, to find at least five individuals in each gravity core sam-ple, so that it was necessary to measure smaller amounts of tests and/or combine twoadjoining core-depths in these cases.
1.4.3. Trace element determination by laser ablation ICP-MSA Finnigan Laserprobe UV (266nm wavelength) laser ablation system, coupled toa Finnigan Element 2 sector field ICP-MS was used for the trace element analyses.The calibrations are based on the NIST610 glass standard reference material (SRM),assuming the composition according to Pearce et al. (1997).The foraminifers were fixed on a sample holder with double-sided duct tape and
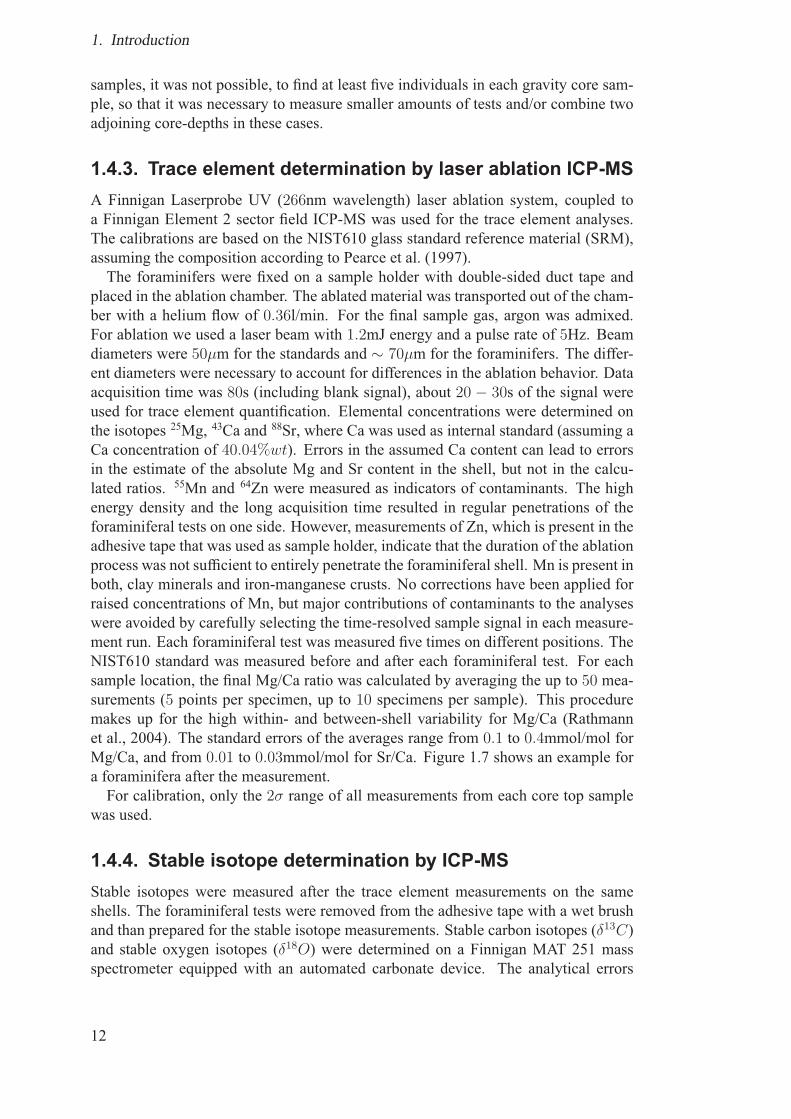
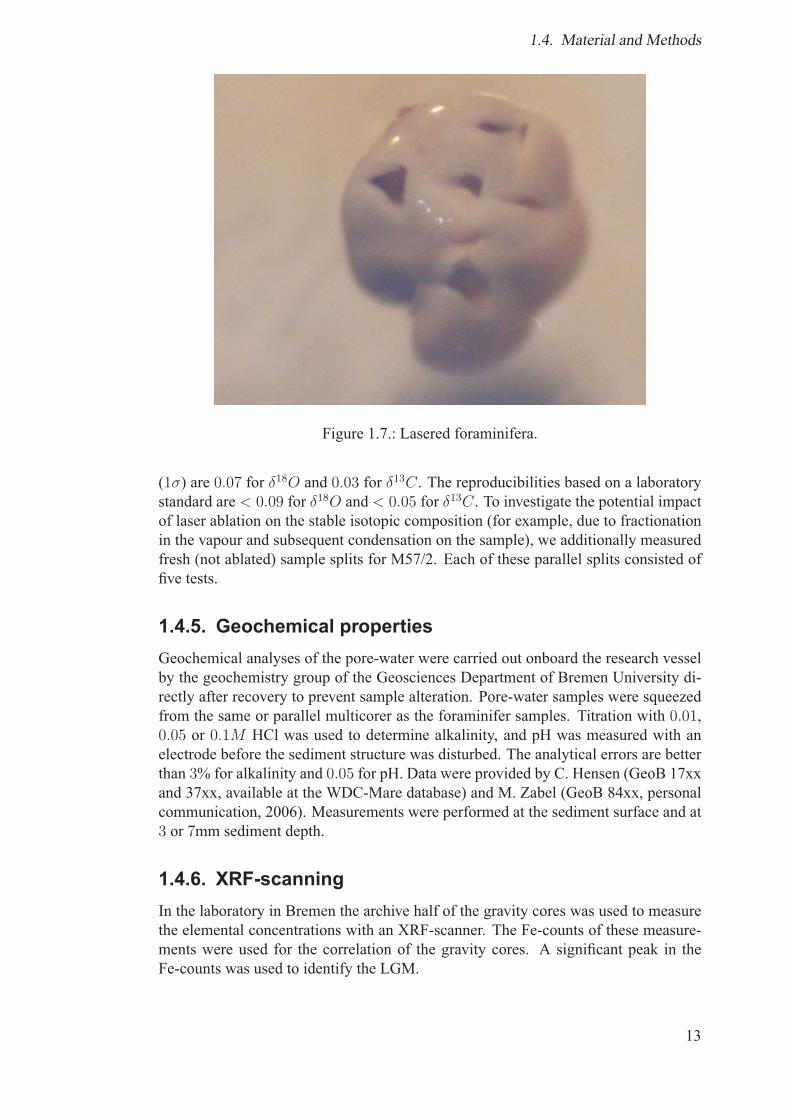
placed in the ablation chamber. The ablated material was transported out of the cham-ber with a helium flow of 0.36l/min. For the final sample gas, argon was admixed.For ablation we used a laser beam with 1.2mJ energy and a pulse rate of 5Hz. Beamdiameters were 50μm for the standards and ∼ 70μm for the foraminifers. The differ-ent diameters were necessary to account for differences in the ablation behavior. Dataacquisition time was 80s (including blank signal), about 20 − 30s of the signal wereused for trace element quantification. Elemental concentrations were determined onthe isotopes 25Mg, 43Ca and 88Sr, where Ca was used as internal standard (assuming aCa concentration of 40.04%wt). Errors in the assumed Ca content can lead to errorsin the estimate of the absolute Mg and Sr content in the shell, but not in the calcu-lated ratios. 55Mn and 64Zn were measured as indicators of contaminants. The highenergy density and the long acquisition time resulted in regular penetrations of theforaminiferal tests on one side. However, measurements of Zn, which is present in theadhesive tape that was used as sample holder, indicate that the duration of the ablationprocess was not sufficient to entirely penetrate the foraminiferal shell. Mn is present inboth, clay minerals and iron-manganese crusts. No corrections have been applied forraised concentrations of Mn, but major contributions of contaminants to the analyseswere avoided by carefully selecting the time-resolved sample signal in each measure-ment run. Each foraminiferal test was measured five times on different positions. TheNIST610 standard was measured before and after each foraminiferal test. For eachsample location, the final Mg/Ca ratio was calculated by averaging the up to 50 mea-surements (5 points per specimen, up to 10 specimens per sample). This proceduremakes up for the high within- and between-shell variability for Mg/Ca (Rathmannet al., 2004). The standard errors of the averages range from 0.1 to 0.4mmol/mol forMg/Ca, and from 0.01 to 0.03mmol/mol for Sr/Ca. Figure 1.7 shows an example fora foraminifera after the measurement.For calibration, only the 2σ range of all measurements from each core top sample
was used.
1.4.4. Stable isotope determination by ICP-MSStable isotopes were measured after the trace element measurements on the sameshells. The foraminiferal tests were removed from the adhesive tape with a wet brushand than prepared for the stable isotope measurements. Stable carbon isotopes (δ13C)and stable oxygen isotopes (δ18O) were determined on a Finnigan MAT 251 massspectrometer equipped with an automated carbonate device. The analytical errors
12
1.4. Material and Methods
Figure 1.7.: Lasered foraminifera.
(1σ) are 0.07 for δ18O and 0.03 for δ13C. The reproducibilities based on a laboratorystandard are < 0.09 for δ18O and < 0.05 for δ13C. To investigate the potential impactof laser ablation on the stable isotopic composition (for example, due to fractionationin the vapour and subsequent condensation on the sample), we additionally measuredfresh (not ablated) sample splits for M57/2. Each of these parallel splits consisted offive tests.
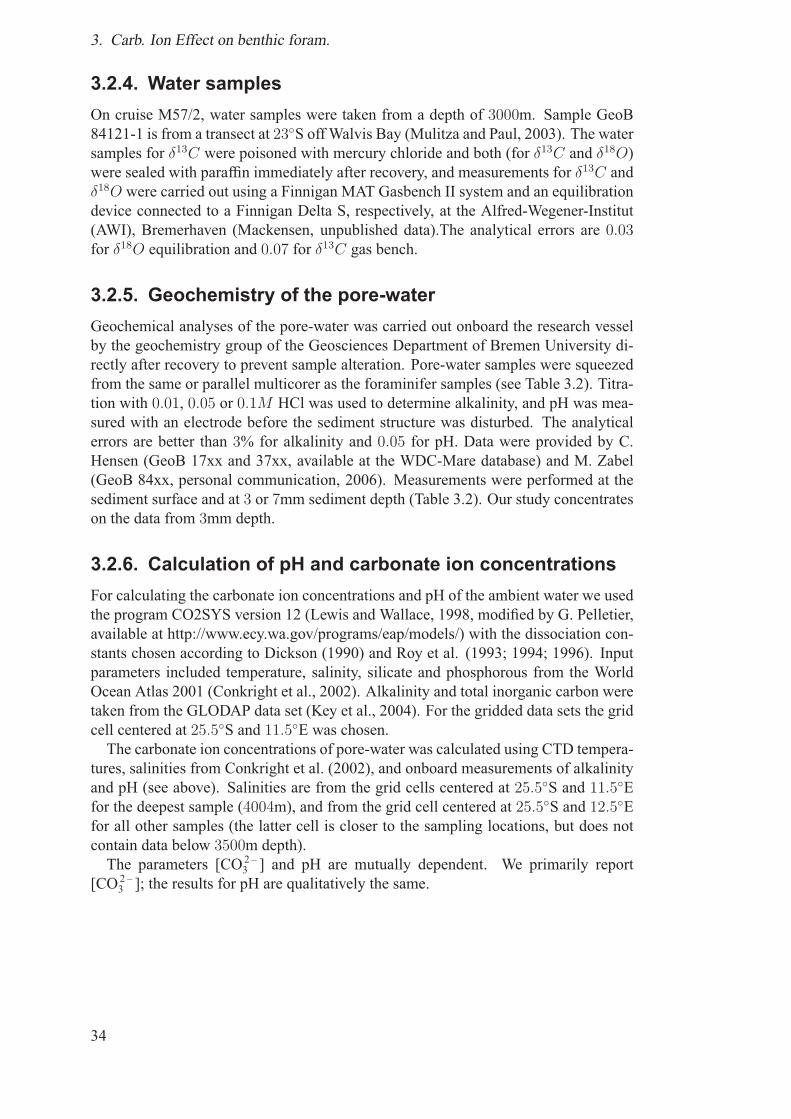
1.4.5. Geochemical propertiesGeochemical analyses of the pore-water were carried out onboard the research vesselby the geochemistry group of the Geosciences Department of Bremen University di-rectly after recovery to prevent sample alteration. Pore-water samples were squeezedfrom the same or parallel multicorer as the foraminifer samples. Titration with 0.01,0.05 or 0.1M HCl was used to determine alkalinity, and pH was measured with anelectrode before the sediment structure was disturbed. The analytical errors are betterthan 3% for alkalinity and 0.05 for pH. Data were provided by C. Hensen (GeoB 17xxand 37xx, available at the WDC-Mare database) and M. Zabel (GeoB 84xx, personalcommunication, 2006). Measurements were performed at the sediment surface and at3 or 7mm sediment depth.
1.4.6. XRF-scanningIn the laboratory in Bremen the archive half of the gravity cores was used to measurethe elemental concentrations with an XRF-scanner. The Fe-counts of these measure-ments were used for the correlation of the gravity cores. A significant peak in theFe-counts was used to identify the LGM.
13
1. Introduction
The XRF core scanner allows a nondestructive, nearly continuous, and relativelyfast analysis of various elements. The XRF scanner measures the chemical composi-tion of the sediment as element intensities in total counts (cnts) or counts per second(cps), which are proportional to the chemical concentrations. Although element in-tensities mainly depend on the element concentration, they are also influenced by theenergy level of the X-ray source, the count time, and the physical properties of the se-diment. Conventional XRF analyzers use dry and homogenized powder samples in or-der to avoid interference of sample inhomogeneities or physical variations. However,down-core varying physical properties can be an issue for XRF core scanner analyzesthat are obtained directly at the split core surface. A more detailed study about dif-ferent influences on the XRF-measurement quality was conducted by Tjallingii et al.(2007).
1.5. OutlineThe presented thesis will contribute to a better knowledge of benthic foraminiferaand the use of their trace element ratios and stable isotopes for paleoceanographicreconstructions. The development of new proxies and the improvement of existingones are essential for a better understanding of the climate history.In the first manuscript, “Mg/Ca ratios of the benthic foraminifera Oridorsalis um-
bonatus obtained by laser ablation from core top sediments: Relationship to bottomwater temperature” (Sohnke Rathmann, Silvia Hess, Henning Kuhnert and StefanMulitza, published in Geochemistry Geophysics Geosystems), a regional calibrationfor the Mg/Ca–BWT-relationship onO. umbonatus obtained by laser ablation ICP-MSis presented. The samples from the topmost cm from six multicores on a transect froma water depth of 320m down to 2293m off Luderitz were investigated. Five to seventests of the benthic foraminifera O. umbonatus were measured for their trace elementratios using a laser ablation ICP-MS system. The resulting exponential equation forthe Mg/Ca–BWT-relationship (Mg/Ca = 1.528 ∗ e0.09∗BWT) is similar to comparableones for other species, which confirms the usefulness of O. umbonatus in the recon-struction of BWTs. This regional calibration is the basis for ongoing research in thisarea (see the following manuscripts).In the second manuscript, “Carbonate ion effect on Mg/Ca, Sr/Ca and stable iso-
topes on the benthic foraminifera Oridorsalis umbonatus off Namibia” (Sohnke Rath-mann and Henning Kuhnert, published in Marine Micropaleontology), the modernreference dataset is improved with 4 additional multicores (one to close the gap be-tween 605m and 1330m water depth and 3 to extend the depth range down to 4004mwater depth). The dependence of Mg/Ca, Sr/Ca, δ18O and δ13C on the BWT, pH,[CO2–3 ] and Δ[CO2−
3 ] (both from the pore-water and the water column for the last 3parameters) was investigated on the samples. A correlation between Sr/Ca ratios and[CO2–3 ] as well as between shell δ18O (corrected for temperature and δ18Oseawater)and [CO2–3 ] was observed, however, the variability of the corrected δ18O is close tothe analytical limit. Mg/Ca and δ13C showed no clear dependences on [CO2–3 ]. Nei-ther the trace element ratios nor the stable isotopes had a dependence on Δ[CO2−
3 ].Interestingly, these results support the results from Elderfield et al. (2006), who alsofound no relationships withΔ[CO2−
3 ] and only relationships with [CO2–3 ] in the South
14
1.5. Outline
Atlantic.For the third manuscript, “Stratification of eastern South Atlantic (25◦S) upper wa-
ter masses during the Last Glacial Maximum” (Sohnke Rathmann, Henning Kuhnert,Andre Paul, Oscar Romero and Stefan Mulitza, manuscript in preparation for submis-sion), gravity cores from the positions of the aforementioned multicores were exam-ined. The cores were correlated with each other using the Fe-content, investigatedusing the XRF-scanning method, and a horizon (LGM) was chosen for the paleo-ceanographic application of Mg/Ca ratios of O. umbonatus. These horizons weremeasured, and a comparison of LGM and modern temperatures was made. Interest-ingly, we found no lower BWTs as expected for the LGM. On the contrary, we evenfound slightly higher temperatures. This is contrary to the changes in the SSTs, asdescribed by Niebler et al. (2003), who used a modified version of the Imbrie-Kipp-Transfer-Function for their analyses and found that the LGM SSTs were up to 10◦Clower than today.
15

1. Introduction
16
2. Mg/Ca ratios of the benthicforaminifera Oridorsalisumbonatus obtained by laserablation from core topsediments: Relationship tobottom water temperatureSohnke Rathmann, Silvia Hess, Henning Kuhnert and Stefan Mulitza
Geochem. Geophys. Geosys. 5 (2004) Q12013, doi:10.1029/2004GC000808
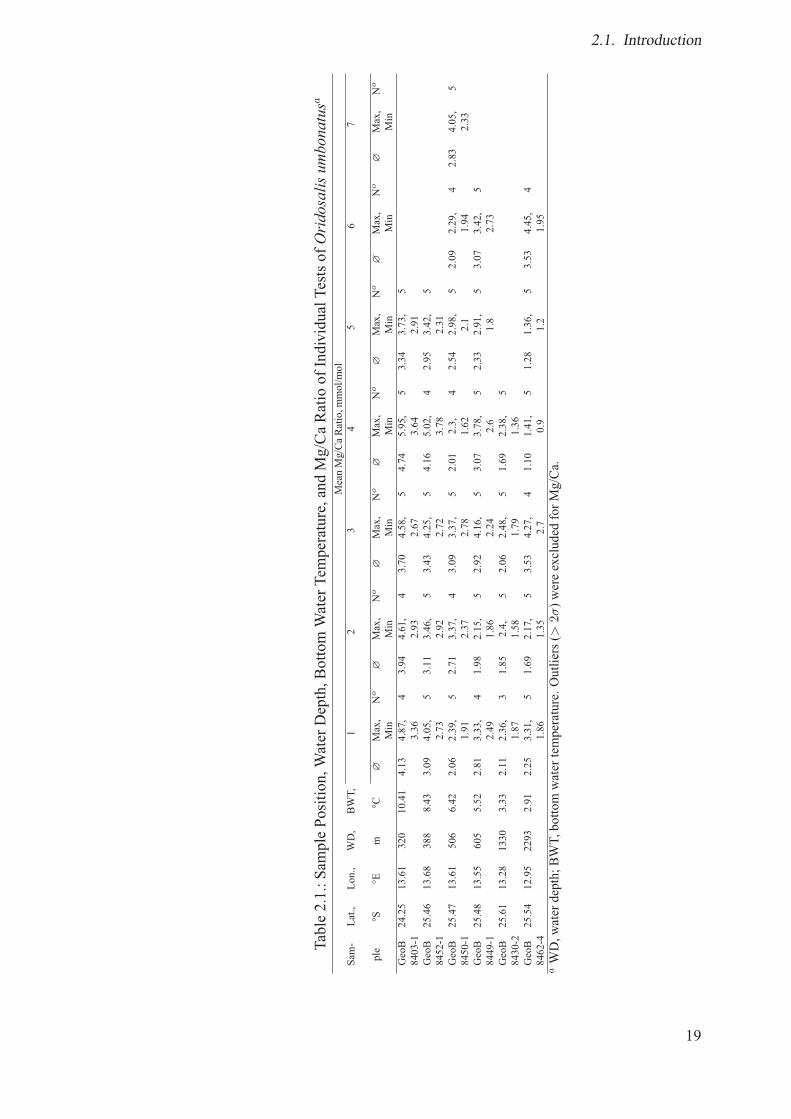
Abstract A laser-ablation system connected to an inductively coupled plasma massspectrometer was used to determine Mg/Ca ratios of the benthic foraminifera Oridor-salis umbonatus. A set of modern core top samples collected along a depth transecton the continental slope off Namibia (320− 2300m water depth; 2.9◦ to 10.4◦C) wasused to calibrate the Mg/Ca ratio against bottom water temperature. The resultingMg/Ca–bottom water temperature relationship of O. umbonatus is described by theexponential equation: Mg/Ca = 1.528∗e0.09∗BWT. The temperature sensitivity of thisequation is similar to previously published calibrations based on Cibicidoides speciessuggesting that the Mg/Ca ratio of O. umbonatus is a valuable proxy for thermoclineand deep water temperature.Keywords: benthic foraminifera, Mg/Ca thermometry, laser ablation ICP-MS, trace
elements, temperature, marine geochemistry
2.1. IntroductionMg/Ca ratios of benthic foraminiferal tests have been used as a proxy for bottomwater temperatures (Rathburn and De Deckker, 1997; Rosenthal et al., 1997; Lea,1999; Lear et al., 2000, 2002; Martin et al., 2002; Billups and Schrag, 2003). Themost commonly used species is Cibicidoides wuellerstorfi which is adapted to oli-gotrophic deep sea conditions (Corliss, 1985; Lutze and Thiel, 1989; Corliss, 1991;Gooday, 1994). Cibicidoides wuellerstorfi is an epifaunal taxon and has been ob-served to live in microhabitats at the sediment/water interface. However, in shallowwater depths (above ∼ 1000m) and in highly productive areas, C. wuellerstorfi canbe extremely rare or even absent (Lutze and Thiel, 1989; Schmiedl, 1995). Hencecalibrations for other species are needed, especially if thermocline properties are to be
17
2. Mg/Ca ratios of benthic foraminifera
reconstructed. The species Oridorsalis umbonatus represents a potential alternativeto C. wuellerstorfi. Oridorsalis umbonatus is a preferentially shallow infaunal livingspecies (Corliss, 1985; Rathburn and Corliss, 1994; Schmiedl et al., 1997), occurringin a wide range of habitats and water depths. Its long geological record spanning theentire Cenozoic (Lear et al., 2000) makes this species particularly useful as a recorderof paleoenvironmental conditions.Generally, the two main strategies to determine trace elemental composition in fo-
raminifera are based on the analysis of liquid solution of dissolved shells and laserablation of solid shells. For liquid solution analysis, the foraminifer samples undergoan elaborate cleaning procedure (Martin and Lea, 2002; Barker et al., 2003) and aresubsequently dissolved in diluted acid. The solution is usually analyzed by induc-tively coupled plasma atomic emission spectrometer (ICP-AES) or inductively cou-pled plasma mass spectrometer (ICP-MS) (Rosenthal et al., 2004). The advantagesof this method are the perfect sample homogenization and high analytical precision.Laser ablation requires no or minimal sample preparation. Material is directly ab-lated from the foraminiferal test and is introduced to an ICP-MS (Eggins et al., 2003;Hathorne et al., 2003; Reichart et al., 2003). The laser beam can also be used to removesurface contamination from the shell prior to analysis. The advantages of this methodare the absence of time-consuming preparation and the small sample size needed foranalyses (theoretically less than a single shell). The absence of a chemical treatmentalso precludes the alteration of the analyzed material. However, comparisonof Mg/Caratios in coral samples measured by laser ablation and by isotope dilution ICP-MSshowed no systematic offsets (Fallon et al., 1999).Here, we used the laser ablation technique to measure Mg/Ca ratios of O. umbo-
natus from the continental slope off Namibia. Our data show that the slope of theMg/Ca–temperature relationship of O. umbonatus is very close to that of C. wuellers-torfi. Hence Mg/Ca in O. umbonatus is a useful proxy to estimate past variations inbottom water temperatures.
18
2.1. Introduction
Table2.1.:SamplePosition,WaterDepth,BottomWaterTemperature,andMg/CaRatioofIndividualTestsofOridosalisumbonatusa
MeanMg/CaRatio,mmol/mol
Sam-
Lat.,
Lon.,
WD,
BWT,
12
34
56
7
ple
°S°E
m°C
∅Max,
Min
No
∅Max,
Min
No
∅Max,
Min
No
∅Max,
Min
No
∅Max,
Min
No
∅Max,
Min
No
∅Max,
Min
No
GeoB
8403-1
24.25
13.61
320
10.41
4.13
4.87,
3.36
43.94
4.61,
2.93
43.70
4.58,
2.67
54.74
5.95,
3.64
53.34
3.73,
2.91
5
GeoB
8452-1
25.46
13.68
388
8.43
3.09
4.05,
2.73
53.11
3.46,
2.92
53.43
4.25,
2.72
54.16
5.02,
3.78
42.95
3.42,
2.31
5
GeoB
8450-1
25.47
13.61
506
6.42
2.06
2.39,
1.91
52.71
3.37,
2.37
43.09
3.37,
2.78
52.01
2.3,
1.62
42.54
2.98,
2.1
52.09
2.29,
1.94
42.83
4.05,
2.33
5
GeoB
8449-1
25.48
13.55
605
5.52
2.81
3.33,
2.49
41.98
2.15,
1.86
52.92
4.16,
2.24
53.07
3.78,
2.6
52.33
2.91,
1.8
53.07
3.42,
2.73
5
GeoB
8430-2
25.61
13.28
1330
3.33
2.11
2.36,
1.87
31.85
2.4,
1.58
52.06
2.48,
1.79
51.69
2.38,
1.36
5
GeoB
8462-4
25.54
12.95
2293
2.91
2.25
3.31,
1.86
51.69
2.17,
1.35
53.53
4.27,
2.7
41.10
1.41,
0.9
51.28
1.36,
1.2
53.53
4.45,
1.95
4
aWD,waterdepth;BWT,bottomwatertemperature.Outliers(>
2σ)wereexcludedforMg/Ca.
19
2. Mg/Ca ratios of benthic foraminifera
2.2. Material and Methods
2.2.1. SamplingWe used multicorer samples from the Benguela upwelling system off Namibia from awater depth range of 320 to 2300m collected during METEOR cruise M57/2 (Zabeland cruise participants, 2003). Immediately after recovery, the sediment cores werecut into 1cm slices, preserved and stained with an ethanol/Rose Bengal solution. Themulticorer samples were washed over a 125μm and a 63μm sieve and dried at 50◦C.For Mg/Ca measurements five to seven individuals of O. umbonatus with a diameterof 300 − 400μm were collected from the topmost centimeter of the sediment of sixstations (Table 2.1). Only well-preserved tests (with all chambers) were used. Inall samples, Rose Bengal stained shells were present, which indicates modern sedi-ments. Furthermore the δ18O composition of the planktic foraminifer Neogloboqua-drina pachyderma (dex.) from the same sample is close to Holocene values fromnearby cores (S. Rathmann, unpublished data, 2003) supporting the modern age of thesamples.For each multicorer position, temperature profiles were measured with a conducti-
vity-temperature-depth probe (CTD SBE 911+) (Moorholz and Heene, 2003a). Themeasured bottom water temperature (BWT) at the investigated sites covers a rangeof 2.9◦ to 10.4◦C (Tables 2.1 and 2.2). Generally, the CTD temperatures measuredin the field are well within the seasonal temperature range derived from the WorldOcean Atlas (WOA) (Levitus and Boyer, 1994; Stephens et al., 2002) for the site loca-
Table 2.2.: Comparison of BottomWater Temperature Between CTDMeasurements and DataFrom the World Ocean Atlas 1994 and 2001 for the Core Locationsa
Waterdepth,
MeanMg/Ca
CTDTemp.
WOA (1994) Temp. °C WOA (2001) Temp. °C
m Ratios °C Mean Max. Min. Mean Max. Min.320 3.96 10.41 9.28 9.84 8.85 9.14 9.43 8.74388 3.31 8.43 8.13 8.64 7.77 8.03 8.35 7.59506 2.50 6.42 6.10 6.53 5.71 6.22 6.55 5.85605 2.69 5.52 5.09 5.57 4.74 5.37 5.66 4.821330 1.91 3.33 3.28 3.32 3.26 3.31 3.42 3.222293 2.14 2.91 3.02 3.03 3.00 2.99 3.03 2.97
a Levitus and Boyer (1994); Stephens et al. (2002) (< 1000m wd: monthly, > 1000m wd: seasonal).
tions, except for the shallowest site, where measured temperatures were more than 1◦Chigher than the warmest temperature estimated in WOA. We attribute this mismatchto the interpolation technique used in WOA, which fails to reproduce very strongtemperature gradients associated to hydrographic fronts and small-scale hydrographicfeatures (Schafer-Neth et al., 2005).
2.2.2. Analytical methodsMg/Ca measurements were done with a Finnigan Laserprobe UV (266nm wavelength)laser ablation system, coupled to a Finnigan Element 2 sector field ICP-MS. The cali-
20
2.2. Material and Methods
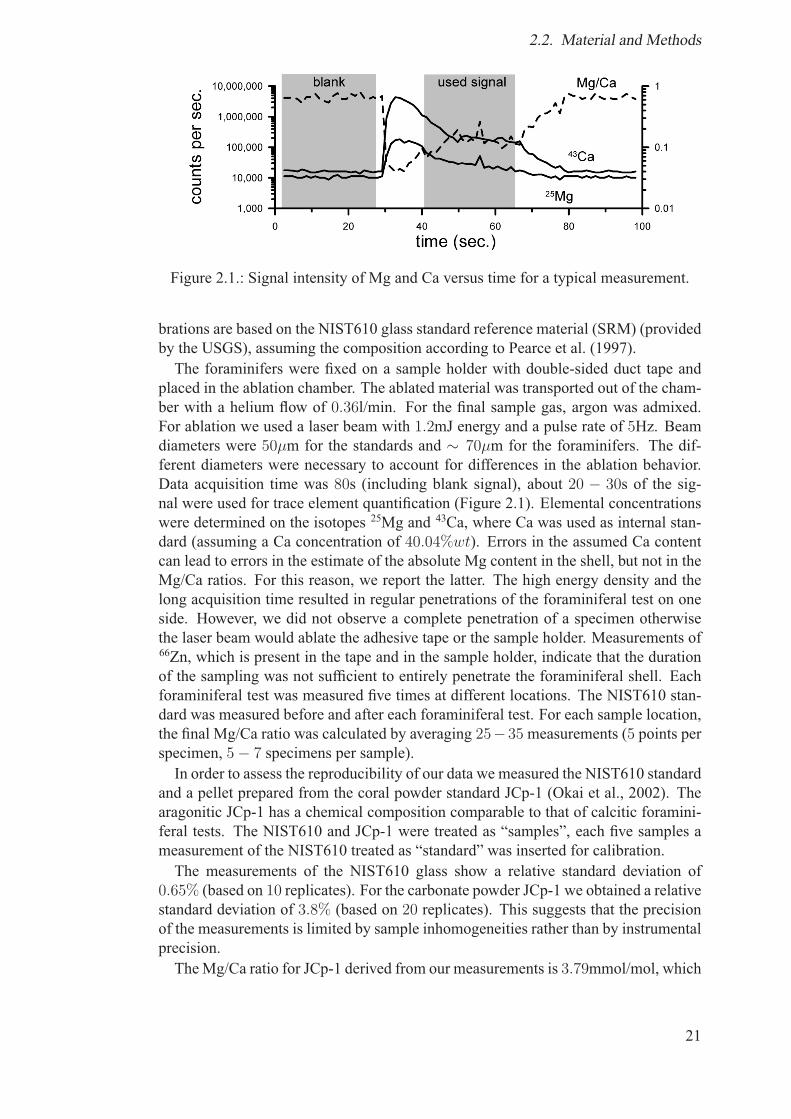
Figure 2.1.: Signal intensity of Mg and Ca versus time for a typical measurement.
brations are based on the NIST610 glass standard reference material (SRM) (providedby the USGS), assuming the composition according to Pearce et al. (1997).The foraminifers were fixed on a sample holder with double-sided duct tape and
placed in the ablation chamber. The ablated material was transported out of the cham-ber with a helium flow of 0.36l/min. For the final sample gas, argon was admixed.For ablation we used a laser beam with 1.2mJ energy and a pulse rate of 5Hz. Beamdiameters were 50μm for the standards and ∼ 70μm for the foraminifers. The dif-ferent diameters were necessary to account for differences in the ablation behavior.Data acquisition time was 80s (including blank signal), about 20 − 30s of the sig-nal were used for trace element quantification (Figure 2.1). Elemental concentrationswere determined on the isotopes 25Mg and 43Ca, where Ca was used as internal stan-dard (assuming a Ca concentration of 40.04%wt). Errors in the assumed Ca contentcan lead to errors in the estimate of the absolute Mg content in the shell, but not in theMg/Ca ratios. For this reason, we report the latter. The high energy density and thelong acquisition time resulted in regular penetrations of the foraminiferal test on oneside. However, we did not observe a complete penetration of a specimen otherwisethe laser beam would ablate the adhesive tape or the sample holder. Measurements of66Zn, which is present in the tape and in the sample holder, indicate that the durationof the sampling was not sufficient to entirely penetrate the foraminiferal shell. Eachforaminiferal test was measured five times at different locations. The NIST610 stan-dard was measured before and after each foraminiferal test. For each sample location,the final Mg/Ca ratio was calculated by averaging 25−35measurements (5 points perspecimen, 5− 7 specimens per sample).In order to assess the reproducibility of our data we measured the NIST610 standard
and a pellet prepared from the coral powder standard JCp-1 (Okai et al., 2002). Thearagonitic JCp-1 has a chemical composition comparable to that of calcitic foramini-feral tests. The NIST610 and JCp-1 were treated as “samples”, each five samples ameasurement of the NIST610 treated as “standard” was inserted for calibration.The measurements of the NIST610 glass show a relative standard deviation of
0.65% (based on 10 replicates). For the carbonate powder JCp-1 we obtained a relativestandard deviation of 3.8% (based on 20 replicates). This suggests that the precisionof the measurements is limited by sample inhomogeneities rather than by instrumentalprecision.TheMg/Ca ratio for JCp-1 derived from our measurements is 3.79mmol/mol, which
21
2. Mg/Ca ratios of benthic foraminifera
2 2.5 3 3.5 4
Mg/Ca (mmol/mol)
2400
2000
1600
1200
800
400
0
Wate
r D
epth
(m
)
3 4 5 6 7 8 9 10
CTD-Temperature (°C)
Mg/Ca
Temp.
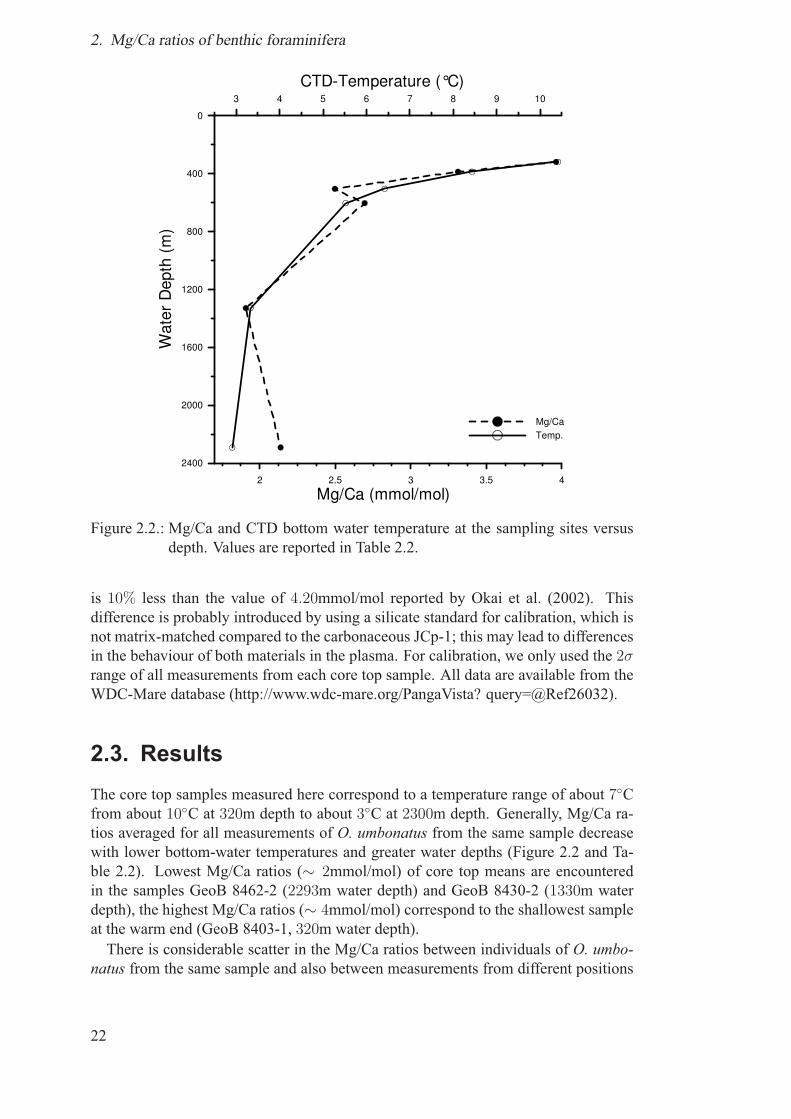
Figure 2.2.: Mg/Ca and CTD bottom water temperature at the sampling sites versusdepth. Values are reported in Table 2.2.
is 10% less than the value of 4.20mmol/mol reported by Okai et al. (2002). Thisdifference is probably introduced by using a silicate standard for calibration, which isnot matrix-matched compared to the carbonaceous JCp-1; this may lead to differencesin the behaviour of both materials in the plasma. For calibration, we only used the 2σrange of all measurements from each core top sample. All data are available from theWDC-Mare database (http://www.wdc-mare.org/PangaVista? query=@Ref26032).
2.3. ResultsThe core top samples measured here correspond to a temperature range of about 7◦Cfrom about 10◦C at 320m depth to about 3◦C at 2300m depth. Generally, Mg/Ca ra-tios averaged for all measurements of O. umbonatus from the same sample decreasewith lower bottom-water temperatures and greater water depths (Figure 2.2 and Ta-ble 2.2). Lowest Mg/Ca ratios (∼ 2mmol/mol) of core top means are encounteredin the samples GeoB 8462-2 (2293m water depth) and GeoB 8430-2 (1330m waterdepth), the highest Mg/Ca ratios (∼ 4mmol/mol) correspond to the shallowest sampleat the warm end (GeoB 8403-1, 320m water depth).There is considerable scatter in the Mg/Ca ratios between individuals of O. umbo-
natus from the same sample and also between measurements from different positions
22
2.4. Discussion
0 5 10 15 20 25 30
Sample No.
0
2
4
6
8
12
Mg
/Ca
(m
mo
l/m
ol)
GeoB 8403-1(WD: 320 m)
GeoB 8452-1(WD: 388 m)
GeoB 8450-1(WD: 506 m)
GeoB 8449-1(WD: 605 m)
GeoB 8430-2(WD: 1330 m)
GeoB 8462-4(WD: 2293 m)
0
2
4
6
8
12
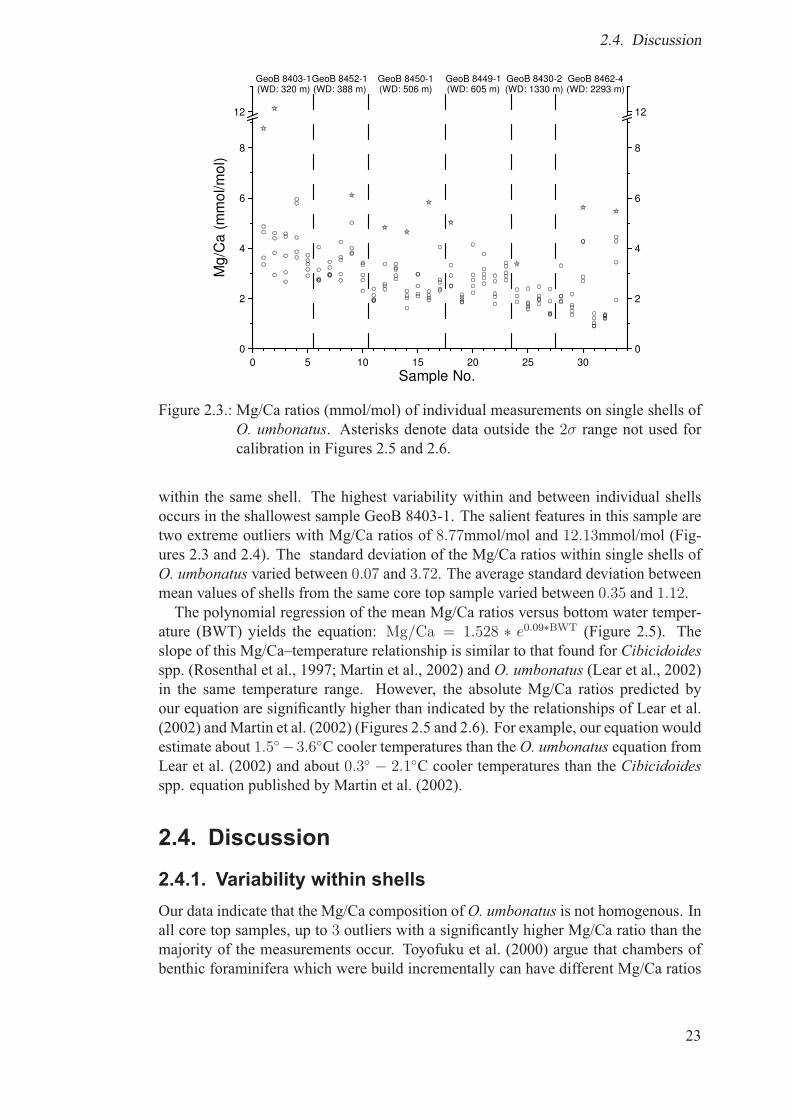
Figure 2.3.: Mg/Ca ratios (mmol/mol) of individual measurements on single shells ofO. umbonatus. Asterisks denote data outside the 2σ range not used forcalibration in Figures 2.5 and 2.6.
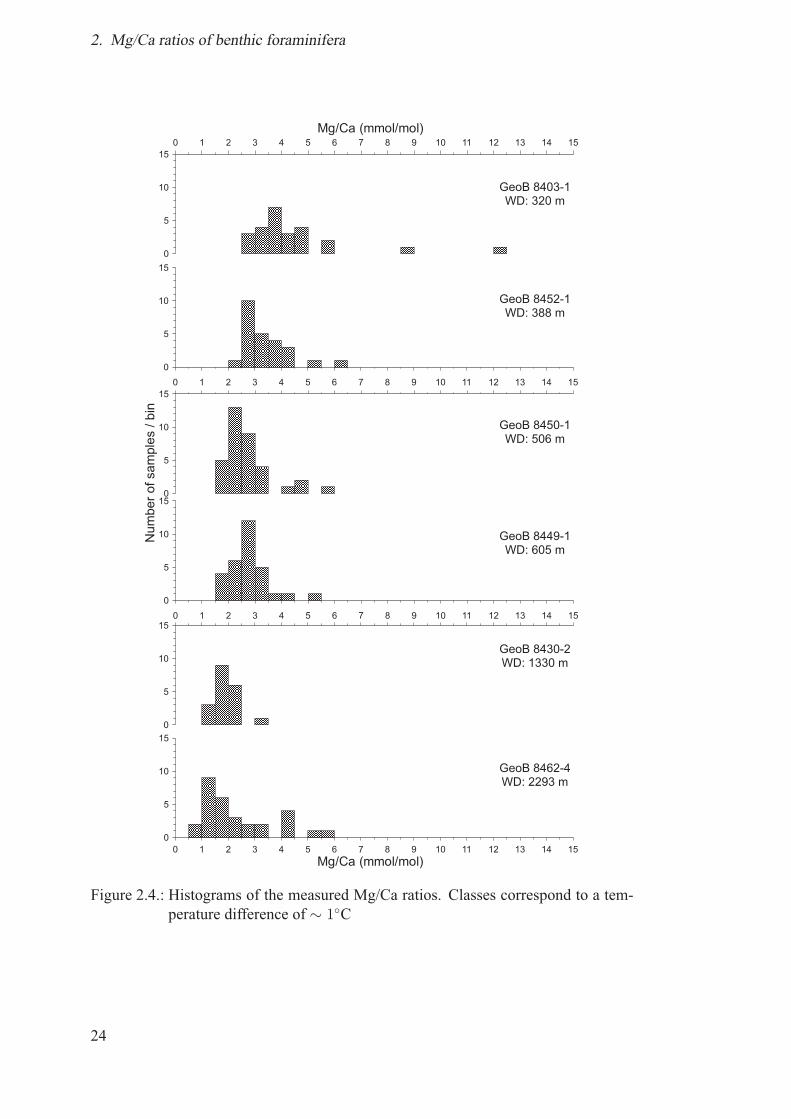
within the same shell. The highest variability within and between individual shellsoccurs in the shallowest sample GeoB 8403-1. The salient features in this sample aretwo extreme outliers with Mg/Ca ratios of 8.77mmol/mol and 12.13mmol/mol (Fig-ures 2.3 and 2.4). The standard deviation of the Mg/Ca ratios within single shells ofO. umbonatus varied between 0.07 and 3.72. The average standard deviation betweenmean values of shells from the same core top sample varied between 0.35 and 1.12.The polynomial regression of the mean Mg/Ca ratios versus bottom water temper-
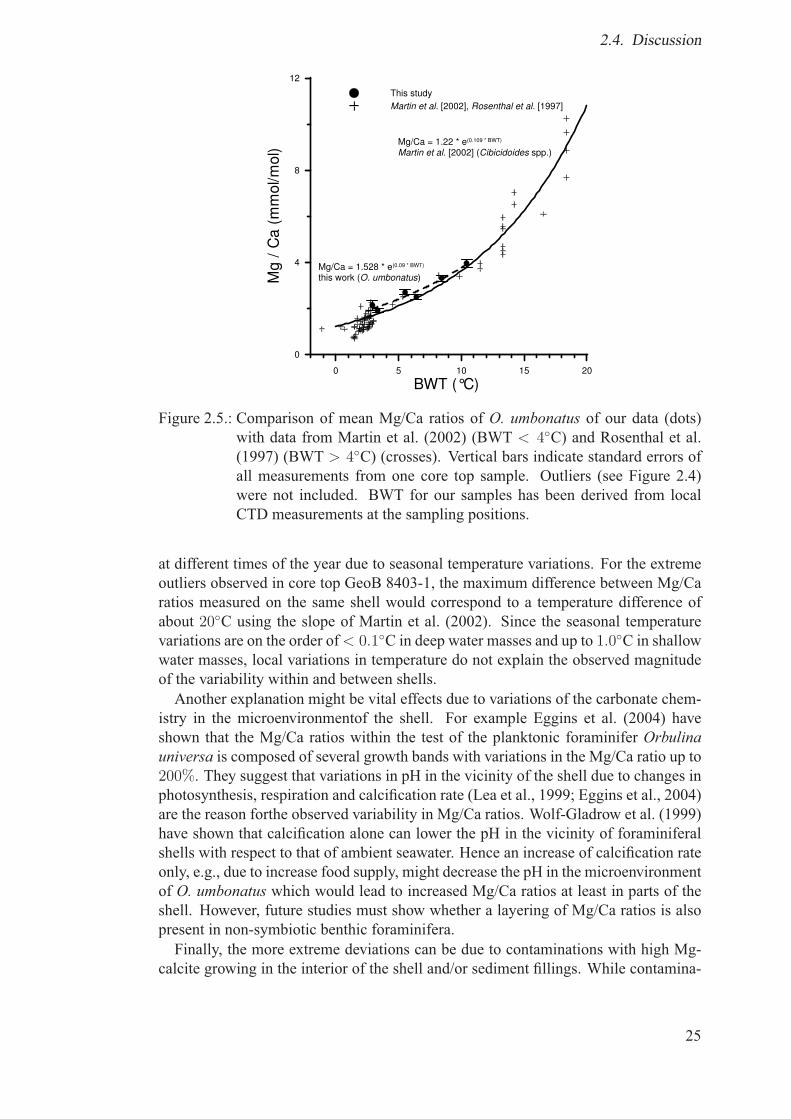
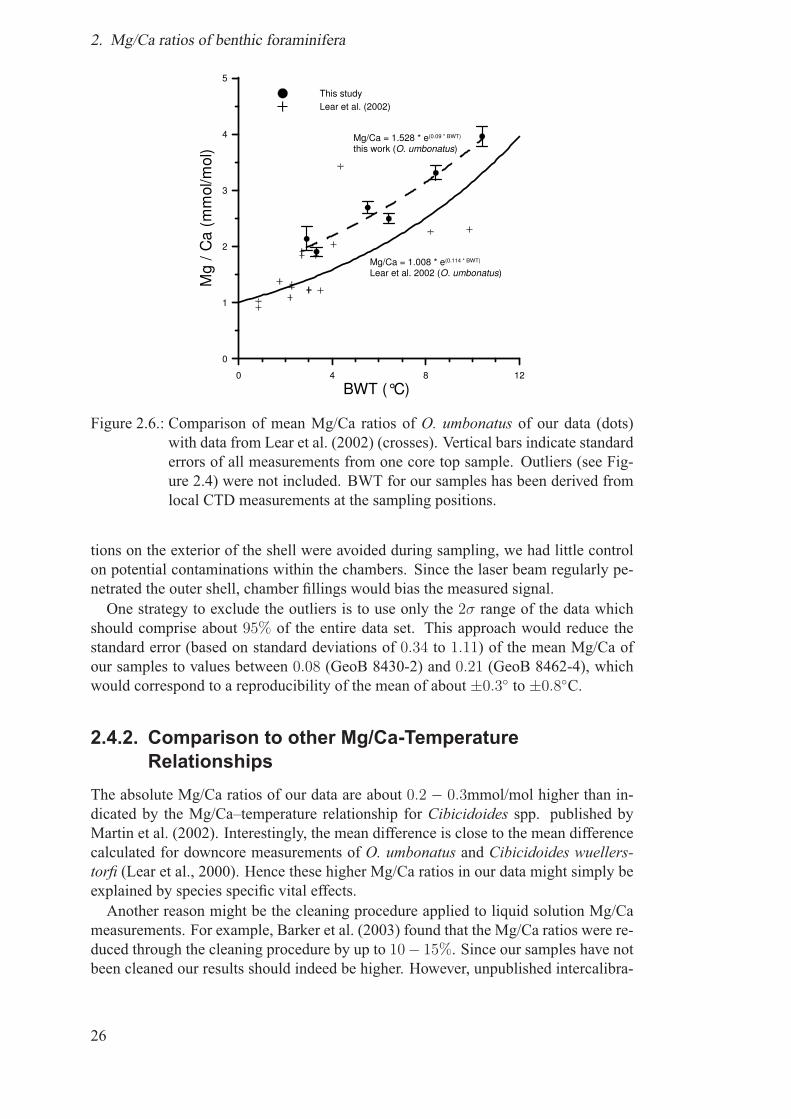
ature (BWT) yields the equation: Mg/Ca = 1.528 ∗ e0.09∗BWT (Figure 2.5). Theslope of this Mg/Ca–temperature relationship is similar to that found for Cibicidoidesspp. (Rosenthal et al., 1997; Martin et al., 2002) and O. umbonatus (Lear et al., 2002)in the same temperature range. However, the absolute Mg/Ca ratios predicted byour equation are significantly higher than indicated by the relationships of Lear et al.(2002) andMartin et al. (2002) (Figures 2.5 and 2.6). For example, our equation wouldestimate about 1.5◦−3.6◦C cooler temperatures than the O. umbonatus equation fromLear et al. (2002) and about 0.3◦ − 2.1◦C cooler temperatures than the Cibicidoidesspp. equation published by Martin et al. (2002).
2.4. Discussion
2.4.1. Variability within shellsOur data indicate that the Mg/Ca composition of O. umbonatus is not homogenous. Inall core top samples, up to 3 outliers with a significantly higher Mg/Ca ratio than themajority of the measurements occur. Toyofuku et al. (2000) argue that chambers ofbenthic foraminifera which were build incrementally can have different Mg/Ca ratios
23
2. Mg/Ca ratios of benthic foraminifera
0 1 2 3 4 5 6 7 8 9 10 11 12 13 14 15
0
5
10
15
0
5
10
15
0 1 2 3 4 5 6 7 8 9 10 11 12 13 14 15
Mg/Ca (mmol/mol)
0
5
10
15
0 1 2 3 4 5 6 7 8 9 10 11 12 13 14 15
Mg/Ca (mmol/mol)
0
5
10
15
0
5
10
15
0 1 2 3 4 5 6 7 8 9 10 11 12 13 14 15
0
5
10
15
GeoB 8452-1WD: 388 m
GeoB 8430-2WD: 1330 m
GeoB 8462-4WD: 2293 m
GeoB 8403-1WD: 320 m
GeoB 8450-1WD: 506 m
GeoB 8449-1WD: 605 m
Nu
mb
er
ofsa
mp
les
/b
in
Figure 2.4.: Histograms of the measured Mg/Ca ratios. Classes correspond to a tem-perature difference of ∼ 1◦C
24
2.4. Discussion
0 5 10 15 20
BWT (°C)
0
4
8
12
Mg
/ C
a (
mm
ol/m
ol)
This study
Martin et al. [2002], Rosenthal et al. [1997]
Mg/Ca = 1.528 * e(0.09 * BWT)
this work (O. umbonatus)
Mg/Ca = 1.22 * e(0.109 * BWT)
Martin et al. [2002] (Cibicidoides spp.)
Figure 2.5.: Comparison of mean Mg/Ca ratios of O. umbonatus of our data (dots)with data from Martin et al. (2002) (BWT < 4◦C) and Rosenthal et al.(1997) (BWT > 4◦C) (crosses). Vertical bars indicate standard errors ofall measurements from one core top sample. Outliers (see Figure 2.4)were not included. BWT for our samples has been derived from localCTD measurements at the sampling positions.
at different times of the year due to seasonal temperature variations. For the extremeoutliers observed in core top GeoB 8403-1, the maximum difference between Mg/Caratios measured on the same shell would correspond to a temperature difference ofabout 20◦C using the slope of Martin et al. (2002). Since the seasonal temperaturevariations are on the order of< 0.1◦C in deep water masses and up to 1.0◦C in shallowwater masses, local variations in temperature do not explain the observed magnitudeof the variability within and between shells.Another explanation might be vital effects due to variations of the carbonate chem-
istry in the microenvironmentof the shell. For example Eggins et al. (2004) haveshown that the Mg/Ca ratios within the test of the planktonic foraminifer Orbulinauniversa is composed of several growth bands with variations in the Mg/Ca ratio up to200%. They suggest that variations in pH in the vicinity of the shell due to changes inphotosynthesis, respiration and calcification rate (Lea et al., 1999; Eggins et al., 2004)are the reason forthe observed variability in Mg/Ca ratios. Wolf-Gladrow et al. (1999)have shown that calcification alone can lower the pH in the vicinity of foraminiferalshells with respect to that of ambient seawater. Hence an increase of calcification rateonly, e.g., due to increase food supply, might decrease the pH in the microenvironmentof O. umbonatus which would lead to increased Mg/Ca ratios at least in parts of theshell. However, future studies must show whether a layering of Mg/Ca ratios is alsopresent in non-symbiotic benthic foraminifera.Finally, the more extreme deviations can be due to contaminations with high Mg-
calcite growing in the interior of the shell and/or sediment fillings. While contamina-
25
2. Mg/Ca ratios of benthic foraminifera
0 4 8 12
BWT (°C)
0
1
2
3
4
5
Mg /
Ca (
mm
ol/m
ol)
This study
Lear et al. (2002)
Mg/Ca = 1.528 * e(0.09 * BWT)
this work (O. umbonatus)
Mg/Ca = 1.008 * e(0.114 * BWT)
Lear et al. 2002 (O. umbonatus)
Figure 2.6.: Comparison of mean Mg/Ca ratios of O. umbonatus of our data (dots)with data from Lear et al. (2002) (crosses). Vertical bars indicate standarderrors of all measurements from one core top sample. Outliers (see Fig-ure 2.4) were not included. BWT for our samples has been derived fromlocal CTD measurements at the sampling positions.
tions on the exterior of the shell were avoided during sampling, we had little controlon potential contaminations within the chambers. Since the laser beam regularly pe-netrated the outer shell, chamber fillings would bias the measured signal.One strategy to exclude the outliers is to use only the 2σ range of the data which
should comprise about 95% of the entire data set. This approach would reduce thestandard error (based on standard deviations of 0.34 to 1.11) of the mean Mg/Ca ofour samples to values between 0.08 (GeoB 8430-2) and 0.21 (GeoB 8462-4), whichwould correspond to a reproducibility of the mean of about ±0.3◦ to ±0.8◦C.
2.4.2. Comparison to other Mg/Ca-TemperatureRelationships
The absolute Mg/Ca ratios of our data are about 0.2 − 0.3mmol/mol higher than in-dicated by the Mg/Ca–temperature relationship for Cibicidoides spp. published byMartin et al. (2002). Interestingly, the mean difference is close to the mean differencecalculated for downcore measurements of O. umbonatus and Cibicidoides wuellers-torfi (Lear et al., 2000). Hence these higher Mg/Ca ratios in our data might simply beexplained by species specific vital effects.Another reason might be the cleaning procedure applied to liquid solution Mg/Ca
measurements. For example, Barker et al. (2003) found that the Mg/Ca ratios were re-duced through the cleaning procedure by up to 10− 15%. Since our samples have notbeen cleaned our results should indeed be higher. However, unpublished intercalibra-
26
2.5. Conclusions and paleoceanographic implications
tions of sample material measured with both by laser ablation and from liquid solutionshow no systematic offset for the benthoc species Cibicides pachyderma (S. Weldeab,unpublished data, 2004). This would impl a minor effect of the cleaning procedure onthe Mg/Ca ratio of benthic foraminifera. However, future intercalibrations on otherbenthic species must show whether this finding can be generalized.The best documented benthic relationship for Mg/Ca vs. temperature has been de-
rived for Cibicidoides species in the temperature range between−1◦ and 19◦C (Martinet al., 2002). Although our data set has been produced by a different methodology, theslope of the relationship of Martin et al. (2002) is nearly identical to that derived inthis work. For example, Mg/Ca temperature in our relationship is about 0.22 per °Cbetween 0◦ and 10◦C, whereas Martin et al. (2002) indicates a slope of about 0.24 per°C in the same temperature range.Mg/Ca data for O. umbonatus are available from a set of core tops from different
ocean basins (Lear et al., 2000). These measurements indicate that the Mg/Ca rela-tionship of O. umbonatus is less well constrained than for other benthic species. Forexample, individual measurements of Mg/Ca deviate up to 1.78mmol/mol (∼ 6◦C)from a polynomial fit through the data. Our calibration does not show such a largevariability. This may indicate that regional calibrations give more consistent resultsthan calibrations based on material from different oceans.
2.5. Conclusions and paleoceanographicimplications
Measuring Mg/Ca ratios with the laser ablation technique on O. umbonatus is an al-ternative approach to estimate bottom water temperature. Our results show that thesensitivity of the Mg/Ca–temperature relationship for O. umbonatus is comparableto that of Cibicidoides spp. Since O. umbonatus is abundant over the main thermo-cline, it provides a good candidate for studying past variations in vertical temperaturegradients.The laser ablation technique allows the rapid determination of Mg/Ca ratios as long
as the number of samples is relatively small. It is therefore well suited for overviewson core sequences and can serve as a base for subsequent high-resolution studies withliquid solution analyses. Laser ablation also provides information on within-samplevariability that is otherwise difficult to obtain. Furthermore, the high number of mea-surements per sediment sample allows identification of outliers and potentially con-taminated shell parts, increasing the accuracy of the final temperature estimate.
Acknowledgements We thank Andreas Klugel for improving the instrument set-up. Thanks to S. Weldeab, P. De Deckker, A. Jurkiw and G. Wefer for discussion andtwo anonymous referees for constructive comments. This work was funded by theDeutsche Forschungsgemeinschaft (DFG Research Center Ocean Margins contribu-tion RCOM0209) and the Bundesministerium fur Bildung und Forschung (DEKLIM).
27
2. Mg/Ca ratios of benthic foraminifera
28
3. Carbonate ion effect on Mg/Ca,Sr/Ca and stable isotopes onthe benthic foraminiferaOridorsalis umbonatus offNamibia
Sohnke Rathmann and Henning KuhnertMarine Micropaleontology 66 (2008) 120–133
Abstract We investigate the influence of carbonate system parameters (carbonateion concentration, [CO2–3 ], carbonate ion saturation, Δ[CO2−
3 ]) on the trace elementand stable isotope ratios in the endobenthic foraminifera Oridorsalis umbonatus. Datafrom modern core top samples from the Namibian continental slope suggest that theshell composition of this species is influenced by the chemistry of the pore-water.For these organic-rich sediments, the impact of ocean bottom water properties onboth pore-water and shell chemistry is surprisingly small. Sr/Ca correlates negativelywith [CO2–3 ] and to a lesser extend to Δ[CO2−
3 ], which is opposed to previous re-sults. A [CO2–3 ] decrease of 10μmol/kg leads to an increases of 0.05mmol/mol inSr/Ca. We observe a correlation between shell δ18O (corrected for temperature andδ18Oseawater) and [CO2–3 ], however, the variability of the corrected δ18O is close tothe analytical limit. No clear dependences were observed for δ13C and Mg/Ca.Keywords: benthic foraminifera, stable isotopes, laser ablation ICP-MS, trace ele-
ments, temperature, carbonate ion effect
3.1. IntroductionThe elemental ratios of Mg/Ca and Sr/Ca, and the stable isotopic composition (δ18O,δ13C) of foraminifera tests are among the most often used proxies in paleoceanogra-phy. With the exception of Sr/Ca, the primary environmental controls on these pa-rameters are well known. Mg/Ca is driven by temperature (Rathburn and De Deckker,1997; Rosenthal et al., 1997; Lea, 1999; Lear et al., 2000, 2002; Martin et al., 2002;Billups and Schrag, 2003), δ18O by temperature and δ18O of seawater (e.g., Emiliani,1955; Shackleton, 1974), and δ13C by a multitude of factors including δ13C of seawa-ter, bottom water circulation and vital effects (e.g., Broecker and Peng, 1982; Mack-ensen and Bickert, 1999). Sr/Ca is marginally influenced by temperature (Muller,2000; Mortyn et al., 2005), but seems to be driven by the carbonate ion concentration
29
3. Carb. Ion Effect on benthic foram.
and the carbonate saturation state (Δ[CO2−3 ], the difference between [CO2–3 ] and satu-
ration [CO2–3 ]) of the ambient water for some species (Lea et al., 1999; Russell et al.,2004; Mortyn et al., 2005; Rosenthal et al., 2006) and, on the glacial to interglacialtimescale, by changes in the Sr/Ca of seawater (Stoll et al., 1999). The other threeproxies are also influenced to varying degrees by changes in [CO2–3 ] and Δ[CO2−
3 ],often referred to as the carbonate ion effect.For stable isotopes this has been shown for planktonic foraminiferal species in cul-
turing experiments (Spero et al., 1997; Wolf-Gladrow et al., 1999; Zeebe, 1999; Zeebeet al., 1999) and in samples from sediment traps and multinets (Russell and Spero,2000; Wilke et al., 2006). Studies on the elemental composition have been carriedout on cultured planktonic (Lea et al., 1999; Russell et al., 2004), and benthic speciesfrom sediment core tops (Rosenthal et al., 2006; Elderfield et al., 2006).For planktonic and epibenthic foraminifera ambient [CO2–3 ] is governed by the
properties of the water column. However, for endobenthic foraminifera [CO2–3 ] isdetermined by the pore-water, the composition of which may significantly deviatefrom that of the bottom water. Elderfield et al. (2006) showed that the effect of bottomwaterΔ[CO2−
3 ] on shell Mg/Ca was significantly larger in the epibenthic Cibicidoideswuellerstorfi than in endobenthic Uvigerina spp. They argued that the pore-water ap-proaches the CaCO3 equilibrium (Δ[CO2−
3 ]=0) with increasing sediment depth (onthe order of magnitude of a few centimetres) and that foraminifera calcifying belowthe equilibrium depth would not be subject to Δ[CO2−
3 ] effects.However, close to the sediment-bottom water interface, the carbonate chemistry of
the pore-water can be influenced by the oxidation of organic matter, and the release ofmetabolic CO2 leads to more acidic pH and lower [CO
2–3 ] (Archer et al., 1989; Hales
and Emerson, 1996). Foraminifera growing in this uppermost sediment layer shouldtherefore exhibit a characteristic pore-water signature in their shell chemistry. Thecarbonate ion effect, if present, should be identifiable in Mg/Ca, Sr/Ca, and δ18O; forδ13C the situation is more complex, as it is also influenced by the isotopic compositionof the pore-water.An ideal location to investigate the relationship between benthic foraminiferal shell
composition and pore-water [CO2–3 ] is the Namibian continental slope. The region isinfluenced by the Benguela upwelling system that favours high productivity and theformation of organic–rich sediments. pH (Pfeifer et al., 2002) and therefore [CO2–3 ],within the topmost sediment layer are highly variable.Oridorsalis umbonatus is an endobenthic foraminifer that lives in the uppermost
centimetre of the sediment (Corliss, 1985; Rathburn and Corliss, 1994; Schmiedl et al.,1997). Due to its wide distribution it is used in paleoceanographic studies, particularlywhere Cibicidoides spp. is absent (e.g. Lear et al., 2000).In a recent calibration study Rathmann et al. (2004) investigated the temperature–
Mg/Ca relationship in O. umbonatus from the Namibian continental slope. Most oftheir samples were derived from water depth shallower than 1000m, where the steeptemperature gradient towards the upper slope dominates any potential influence of[CO2–3 ]. However, the Mg/Ca from the deepest sample (2300m) in Rathmann et al.(2004) is – albeit only slightly – too high to be entirely temperature-controlled, sug-gesting the existence of an additional factor influencing shell composition.In this study we investigate the relationships of Mg/Ca, Sr/Ca, δ13C, and δ18O in the
shell of Oridorsalis umbonatus with bottom- and pore-water [CO2–3 ] and Δ[CO2−3 ].
30
3.2. Material and Methods
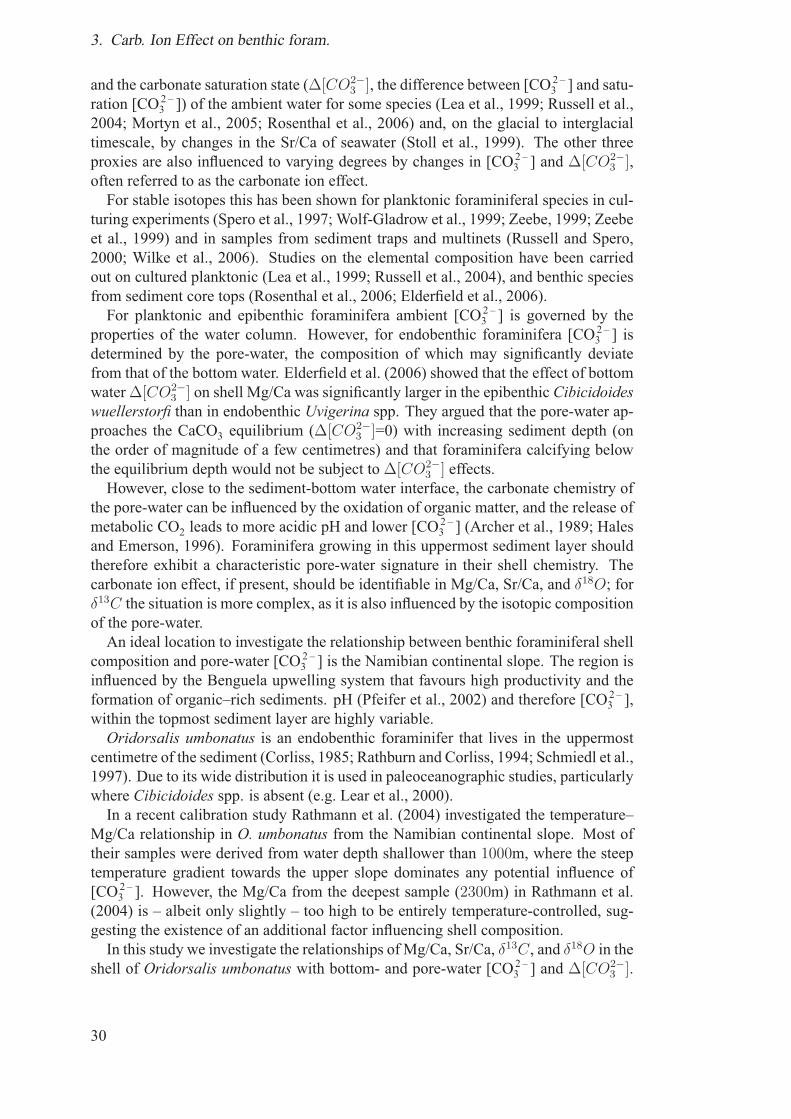
Figure 3.1.: Sample location and isobaths of the working area.
Our samples were retrieved from the Namibian continental slope over the depth rangefrom 320 to 4000m; for water depth below 600m pore-water measurements have beenavailable to us.
3.2. Material and Methods
3.2.1. SamplingDuring METEOR cruises M34/2 and M57/2 (Schulz and cruise participants, 1996;Zabel and cruise participants, 2003) multicorers from the sediments underlying theBenguela upwelling system off Namibia were collected from water depths between320 to 4000m. For the present study samples are used from ten stations (Table 3.1,Figure 3.1), including those from Rathmann et al. (2004). The sediments (mostlynannofossil ooze) were cut into 1cm slices immediately upon recovery and were pre-served and stained with an ethanol/Rose Bengal solution. After washing the samplesover a 125μm and a 63μm sieve, they were dried at 50◦C. Out of the topmost cm fiveto ten individuals of O. umbonatus with a diameter of 300−400μm were collected formeasurements. Only well preserved tests, with all chambers were used.A conductivity-temperature-depth logger (CTD SBE 911+) (Moorholz and Hee-
ne, 2003a) was deployed on each multicorer position on cruise M57/2. The measured
31
3. Carb. Ion Effect on benthic foram.
bottom water temperatures (BWT) at the investigated sites range from 2.9◦C to 10.4◦C(Table 3.1).
3.2.2. Trace elementsWe used a Finnigan Laserprobe UV (266nm wavelength) laser ablation system, cou-pled to a ThermoFinnigan Element 2 sector field ICP-MS for the trace element ana-lyses. The calibrations are based on the NIST610 glass standard reference material(SRM), assuming the composition according to Pearce et al. (1997).We follow the procedures described in Rathmann et al. (2004) to determine ele-
mental concentrations on the isotopes 25Mg, 43Ca and 88Sr, where Ca was used asinternal standard (assuming a Ca concentration of 40.04%wt). Errors in the assumedCa content can lead to errors in the estimate of the absolute Mg and Sr content in theshell, but not in the calculated ratios. For this reason, we report the latter. As indi-cators for contaminants 55Mn and 64Zn were measured. The high energy density andthe long acquisition time resulted in regular penetrations of the foraminiferal tests onone side. However, measurements of Zn, which is present in the adhesive tape thatwas used as sample holder, indicate that the duration of the ablation process was notsufficient to entirely penetrate the foraminiferal shell on both sides. Mn is present inboth, clay minerals and iron-manganese crusts. Major contributions of contaminantswere avoided by carefully selecting the time-resolved sample signal in each measure-ment run (see Rathmann et al., 2004). Each foraminiferal test was measured fivetimes on different positions using a beam diameter of 70μm. The NIST610 standardwas measured before and after each foraminiferal test. For each sample location, thefinal Mg/Ca and Sr/Ca ratios were calculated by averaging 25 − 50 measurements(5 points per specimen, 5 − 10 specimens per sample). Data points outside the 2σrange of the average were excluded. This procedure makes up for the high within- andbetween-shell variability for Mg/Ca (Rathmann et al., 2004). Standard errors of theaverages range from 0.1 to 0.4mmol/mol for Mg/Ca, and from 0.01 to 0.03mmol/molfor Sr/Ca. To identify potential methodological biases of the laser ablation techniquewe measured the JCp-1 coral powder standard (Okai et al., 2002). Mg/Ca and Sr/Caare systematically lower by 10 and 13%, respectively, than the values reported by Okaiet al. (2002). No correction has been applied to the data reported in this study.
3.2.3. Stable isotopesAfter laser ablation the test were analyzed for stable isotopes. δ13C and δ18O weredetermined using a FinniganMAT 251 mass spectrometer equipped with an automatedcarbonate device. The analytical errors (1σ) are 0.07 for δ18O and 0.03 for δ13C. Thereproducibilities based on a laboratory standard calibrated against NBS 19 are < 0.07for δ18O and < 0.05 for δ13C.
32
3.2. Material and Methods
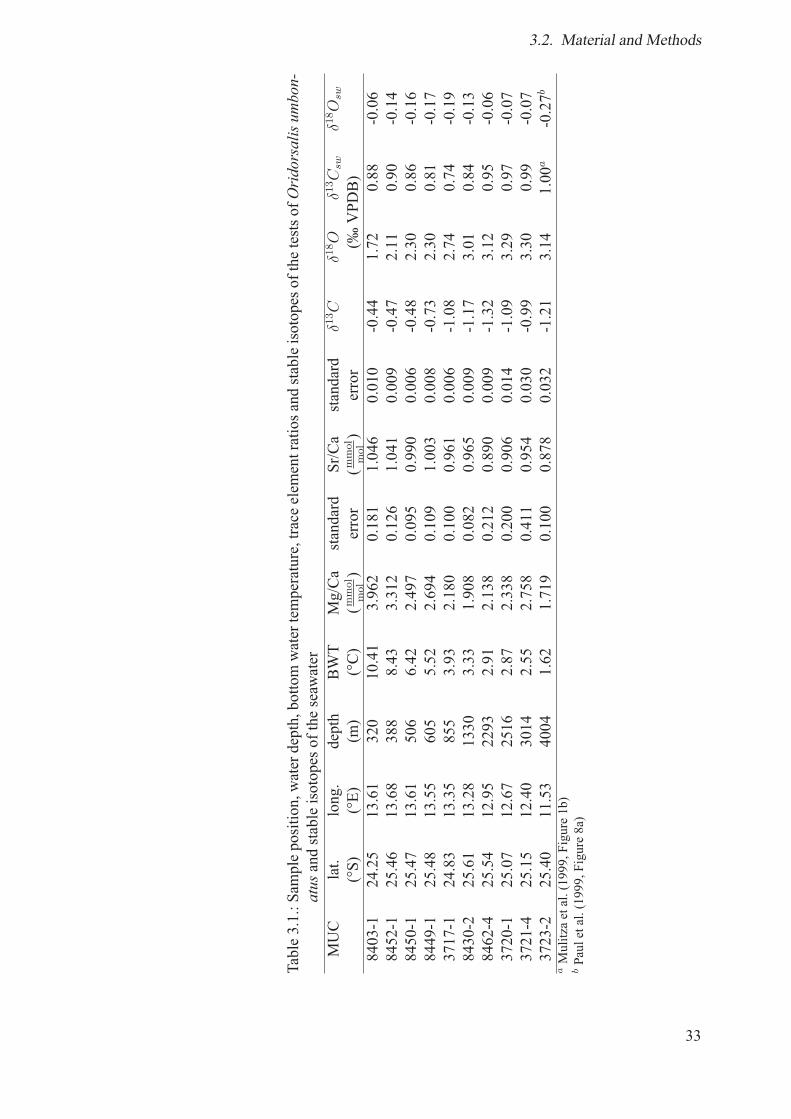
Table3.1.:Sampleposition,waterdepth,bottomwatertemperature,traceelementratiosandstableisotopesofthetestsofOridorsalisumbon-
atusandstableisotopesoftheseawater
MUC
lat.
long.
depth
BWT
Mg/Ca
standard
Sr/Ca
standard
δ13C
δ18O
δ13C
sw
δ18O
sw
(°S)
(°E)
(m)
(°C)
(mm
ol
mol)
error
(mm
ol
mol)
error
(‰VPDB)
8403-1
24.25
13.61
320
10.41
3.962
0.181
1.046
0.010
-0.44
1.72
0.88
-0.06
8452-1
25.46
13.68
388
8.43
3.312
0.126
1.041
0.009
-0.47
2.11
0.90
-0.14
8450-1
25.47
13.61
506
6.42
2.497
0.095
0.990
0.006
-0.48
2.30
0.86
-0.16
8449-1
25.48
13.55
605
5.52
2.694
0.109
1.003
0.008
-0.73
2.30
0.81
-0.17
3717-1
24.83
13.35
855
3.93
2.180
0.100
0.961
0.006
-1.08
2.74
0.74
-0.19
8430-2
25.61
13.28
1330
3.33
1.908
0.082
0.965
0.009
-1.17
3.01
0.84
-0.13
8462-4
25.54
12.95
2293
2.91
2.138
0.212
0.890
0.009
-1.32
3.12
0.95
-0.06
3720-1
25.07
12.67
2516
2.87
2.338
0.200
0.906
0.014
-1.09
3.29
0.97
-0.07
3721-4
25.15
12.40
3014
2.55
2.758
0.411
0.954
0.030
-0.99
3.30
0.99
-0.07
3723-2
25.40
11.53
4004
1.62
1.719
0.100
0.878
0.032
-1.21
3.14
1.00
a-0.27b
aMulitzaetal.(1999,Figure1b)
bPauletal.(1999,Figure8a)
33
3. Carb. Ion Effect on benthic foram.
3.2.4. Water samplesOn cruise M57/2, water samples were taken from a depth of 3000m. Sample GeoB84121-1 is from a transect at 23◦S off Walvis Bay (Mulitza and Paul, 2003). The watersamples for δ13C were poisoned with mercury chloride and both (for δ13C and δ18O)were sealed with paraffin immediately after recovery, and measurements for δ13C andδ18O were carried out using a Finnigan MAT Gasbench II system and an equilibrationdevice connected to a Finnigan Delta S, respectively, at the Alfred-Wegener-Institut(AWI), Bremerhaven (Mackensen, unpublished data).The analytical errors are 0.03for δ18O equilibration and 0.07 for δ13C gas bench.
3.2.5. Geochemistry of the pore-waterGeochemical analyses of the pore-water was carried out onboard the research vesselby the geochemistry group of the Geosciences Department of Bremen University di-rectly after recovery to prevent sample alteration. Pore-water samples were squeezedfrom the same or parallel multicorer as the foraminifer samples (see Table 3.2). Titra-tion with 0.01, 0.05 or 0.1M HCl was used to determine alkalinity, and pH was mea-sured with an electrode before the sediment structure was disturbed. The analyticalerrors are better than 3% for alkalinity and 0.05 for pH. Data were provided by C.Hensen (GeoB 17xx and 37xx, available at the WDC-Mare database) and M. Zabel(GeoB 84xx, personal communication, 2006). Measurements were performed at thesediment surface and at 3 or 7mm sediment depth (Table 3.2). Our study concentrateson the data from 3mm depth.
3.2.6. Calculation of pH and carbonate ion concentrationsFor calculating the carbonate ion concentrations and pH of the ambient water we usedthe program CO2SYS version 12 (Lewis and Wallace, 1998, modified by G. Pelletier,available at http://www.ecy.wa.gov/programs/eap/models/) with the dissociation con-stants chosen according to Dickson (1990) and Roy et al. (1993; 1994; 1996). Inputparameters included temperature, salinity, silicate and phosphorous from the WorldOcean Atlas 2001 (Conkright et al., 2002). Alkalinity and total inorganic carbon weretaken from the GLODAP data set (Key et al., 2004). For the gridded data sets the gridcell centered at 25.5◦S and 11.5◦E was chosen.The carbonate ion concentrations of pore-water was calculated using CTD tempera-
tures, salinities from Conkright et al. (2002), and onboard measurements of alkalinityand pH (see above). Salinities are from the grid cells centered at 25.5◦S and 11.5◦Efor the deepest sample (4004m), and from the grid cell centered at 25.5◦S and 12.5◦Efor all other samples (the latter cell is closer to the sampling locations, but does notcontain data below 3500m depth).The parameters [CO2–3 ] and pH are mutually dependent. We primarily report
[CO2–3 ]; the results for pH are qualitatively the same.
34
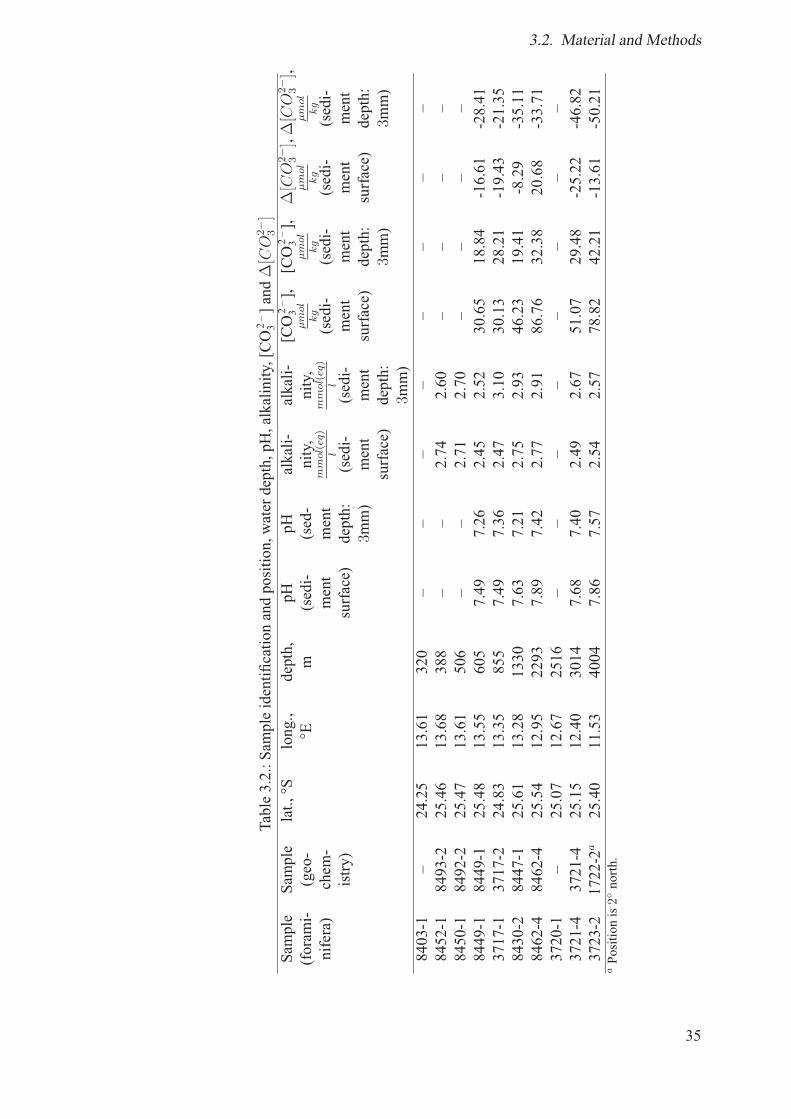
3.2. Material and Methods
Table3.2.:Sampleidentificationandposition,waterdepth,pH,alkalinity,[CO2–
3]and
Δ[C
O2−
3]
Sample
(forami-
nifera)
Sample
(geo-
chem-
istry)
lat.,°S
long.,
°Edepth,
mpH (sedi-
ment
surface)
pH (sed-
ment
depth:
3mm)
alkali-
nity,
mm
ol(
eq)
l
(sedi-
ment
surface)
alkali-
nity,
mm
ol(
eq)
l
(sedi-
ment
depth:
3mm)
[CO2–
3],
μm
ol
kg
(sedi-
ment
surface)
[CO2–
3],
μm
ol
kg
(sedi-
ment
depth:
3mm)
Δ[C
O2−
3],
μm
ol
kg
(sedi-
ment
surface)
Δ[C
O2−
3],
μm
ol
kg
(sedi-
ment
depth:
3mm)
8403-1
–24.25
13.61
320
––
––
––
––
8452-1
8493-2
25.46
13.68
388
––
2.74
2.60
––
––
8450-1
8492-2
25.47
13.61
506
––
2.71
2.70
––
––
8449-1
8449-1
25.48
13.55
605
7.49
7.26
2.45
2.52
30.65
18.84
-16.61
-28.41
3717-1
3717-2
24.83
13.35
855
7.49
7.36
2.47
3.10
30.13
28.21
-19.43
-21.35
8430-2
8447-1
25.61
13.28
1330
7.63
7.21
2.75
2.93
46.23
19.41
-8.29
-35.11
8462-4
8462-4
25.54
12.95
2293
7.89
7.42
2.77
2.91
86.76
32.38
20.68
-33.71
3720-1
–25.07
12.67
2516
––
––
––
––
3721-4
3721-4
25.15
12.40
3014
7.68
7.40
2.49
2.67
51.07
29.48
-25.22
-46.82
3723-2
1722-2
a25.40
11.53
4004
7.86
7.57
2.54
2.57
78.82
42.21
-13.61
-50.21
aPositionis
2◦north.
35
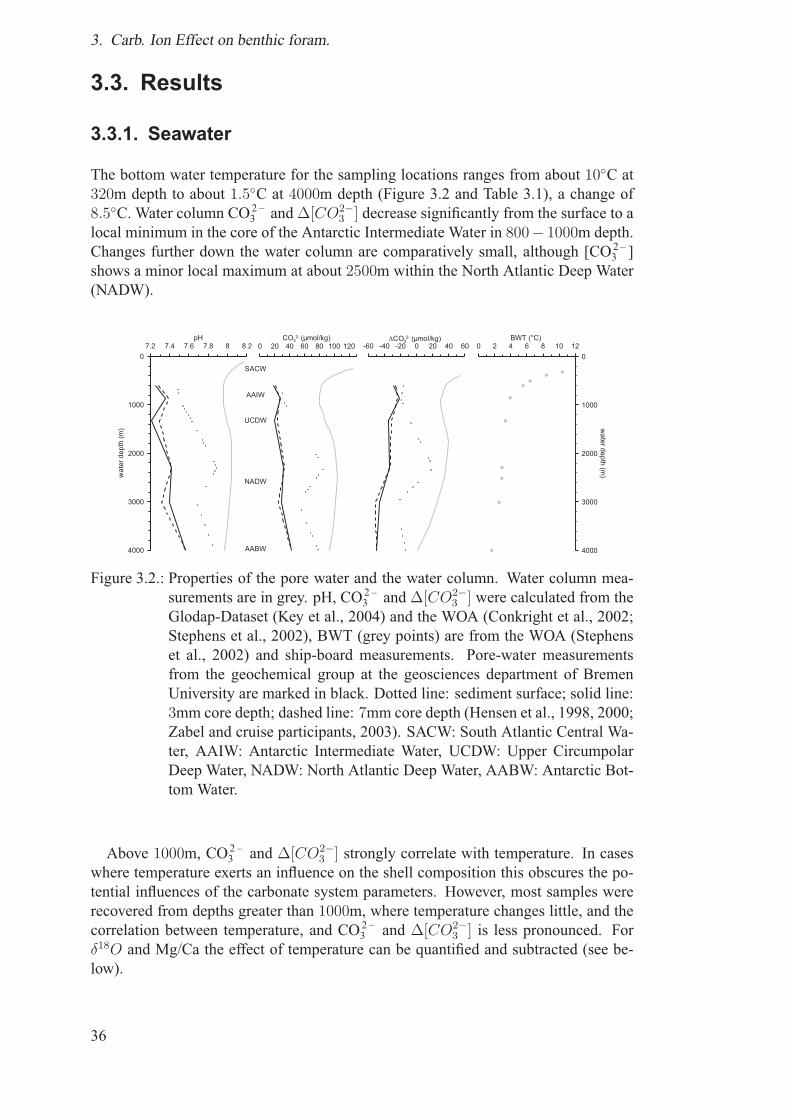
3. Carb. Ion Effect on benthic foram.
3.3. Results
3.3.1. Seawater
The bottom water temperature for the sampling locations ranges from about 10◦C at320m depth to about 1.5◦C at 4000m depth (Figure 3.2 and Table 3.1), a change of8.5◦C. Water column CO2–3 andΔ[CO2−
3 ] decrease significantly from the surface to alocal minimum in the core of the Antarctic Intermediate Water in 800− 1000m depth.Changes further down the water column are comparatively small, although [CO2–3 ]shows a minor local maximum at about 2500m within the North Atlantic Deep Water(NADW).
Figure 3.2.: Properties of the pore water and the water column. Water column mea-surements are in grey. pH, CO2–3 and Δ[CO2−
3 ] were calculated from theGlodap-Dataset (Key et al., 2004) and the WOA (Conkright et al., 2002;Stephens et al., 2002), BWT (grey points) are from the WOA (Stephenset al., 2002) and ship-board measurements. Pore-water measurementsfrom the geochemical group at the geosciences department of BremenUniversity are marked in black. Dotted line: sediment surface; solid line:3mm core depth; dashed line: 7mm core depth (Hensen et al., 1998, 2000;Zabel and cruise participants, 2003). SACW: South Atlantic Central Wa-ter, AAIW: Antarctic Intermediate Water, UCDW: Upper CircumpolarDeep Water, NADW: North Atlantic Deep Water, AABW: Antarctic Bot-tom Water.
Above 1000m, CO2–3 and Δ[CO2−3 ] strongly correlate with temperature. In cases
where temperature exerts an influence on the shell composition this obscures the po-tential influences of the carbonate system parameters. However, most samples wererecovered from depths greater than 1000m, where temperature changes little, and thecorrelation between temperature, and CO2–3 and Δ[CO2−
3 ] is less pronounced. Forδ18O and Mg/Ca the effect of temperature can be quantified and subtracted (see be-low).
36
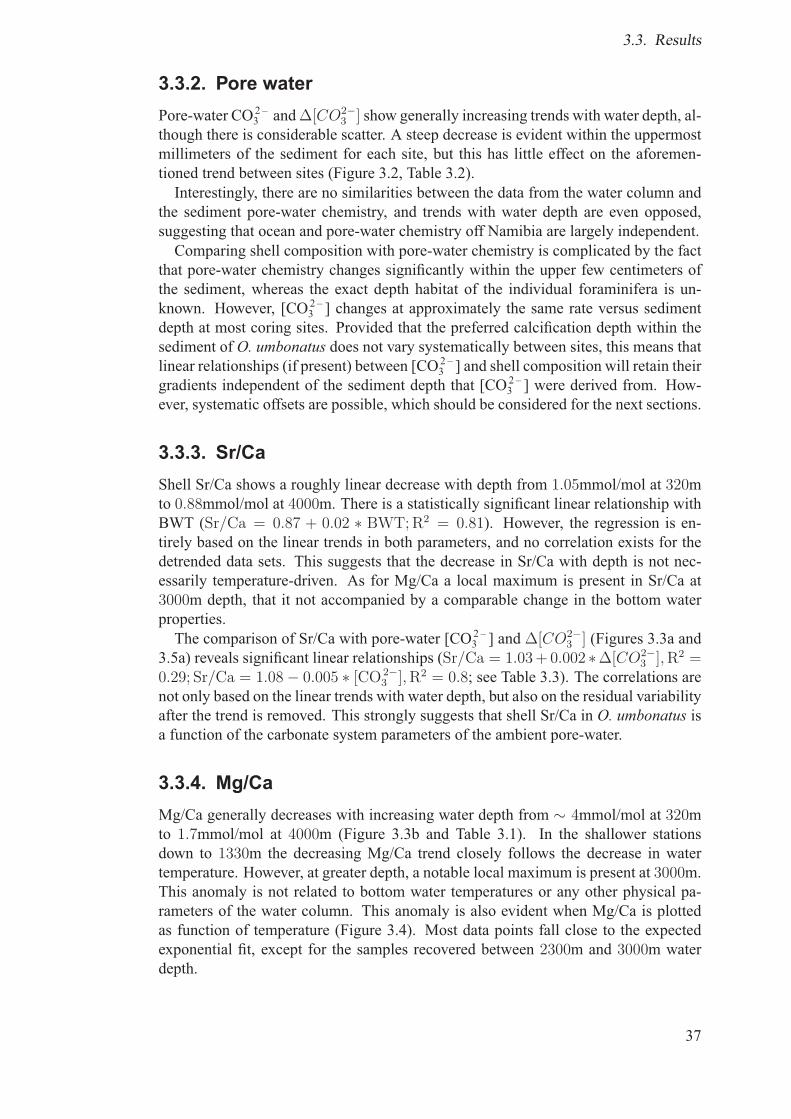
3.3. Results
3.3.2. Pore waterPore-water CO2–3 andΔ[CO2−
3 ] show generally increasing trends with water depth, al-though there is considerable scatter. A steep decrease is evident within the uppermostmillimeters of the sediment for each site, but this has little effect on the aforemen-tioned trend between sites (Figure 3.2, Table 3.2).Interestingly, there are no similarities between the data from the water column and
the sediment pore-water chemistry, and trends with water depth are even opposed,suggesting that ocean and pore-water chemistry off Namibia are largely independent.Comparing shell composition with pore-water chemistry is complicated by the fact
that pore-water chemistry changes significantly within the upper few centimeters ofthe sediment, whereas the exact depth habitat of the individual foraminifera is un-known. However, [CO2–3 ] changes at approximately the same rate versus sedimentdepth at most coring sites. Provided that the preferred calcification depth within thesediment of O. umbonatus does not vary systematically between sites, this means thatlinear relationships (if present) between [CO2–3 ] and shell composition will retain theirgradients independent of the sediment depth that [CO2–3 ] were derived from. How-ever, systematic offsets are possible, which should be considered for the next sections.
3.3.3. Sr/CaShell Sr/Ca shows a roughly linear decrease with depth from 1.05mmol/mol at 320mto 0.88mmol/mol at 4000m. There is a statistically significant linear relationship withBWT (Sr/Ca = 0.87 + 0.02 ∗ BWT; R2 = 0.81). However, the regression is en-tirely based on the linear trends in both parameters, and no correlation exists for thedetrended data sets. This suggests that the decrease in Sr/Ca with depth is not nec-essarily temperature-driven. As for Mg/Ca a local maximum is present in Sr/Ca at3000m depth, that it not accompanied by a comparable change in the bottom waterproperties.The comparison of Sr/Ca with pore-water [CO2–3 ] and Δ[CO2−
3 ] (Figures 3.3a and3.5a) reveals significant linear relationships (Sr/Ca = 1.03 + 0.002 ∗Δ[CO2−
3 ], R2 =0.29; Sr/Ca = 1.08− 0.005 ∗ [CO 2−
3 ], R2 = 0.8; see Table 3.3). The correlations arenot only based on the linear trends with water depth, but also on the residual variabilityafter the trend is removed. This strongly suggests that shell Sr/Ca in O. umbonatus isa function of the carbonate system parameters of the ambient pore-water.
3.3.4. Mg/CaMg/Ca generally decreases with increasing water depth from ∼ 4mmol/mol at 320mto 1.7mmol/mol at 4000m (Figure 3.3b and Table 3.1). In the shallower stationsdown to 1330m the decreasing Mg/Ca trend closely follows the decrease in watertemperature. However, at greater depth, a notable local maximum is present at 3000m.This anomaly is not related to bottom water temperatures or any other physical pa-rameters of the water column. This anomaly is also evident when Mg/Ca is plottedas function of temperature (Figure 3.4). Most data points fall close to the expectedexponential fit, except for the samples recovered between 2300m and 3000m waterdepth.
37
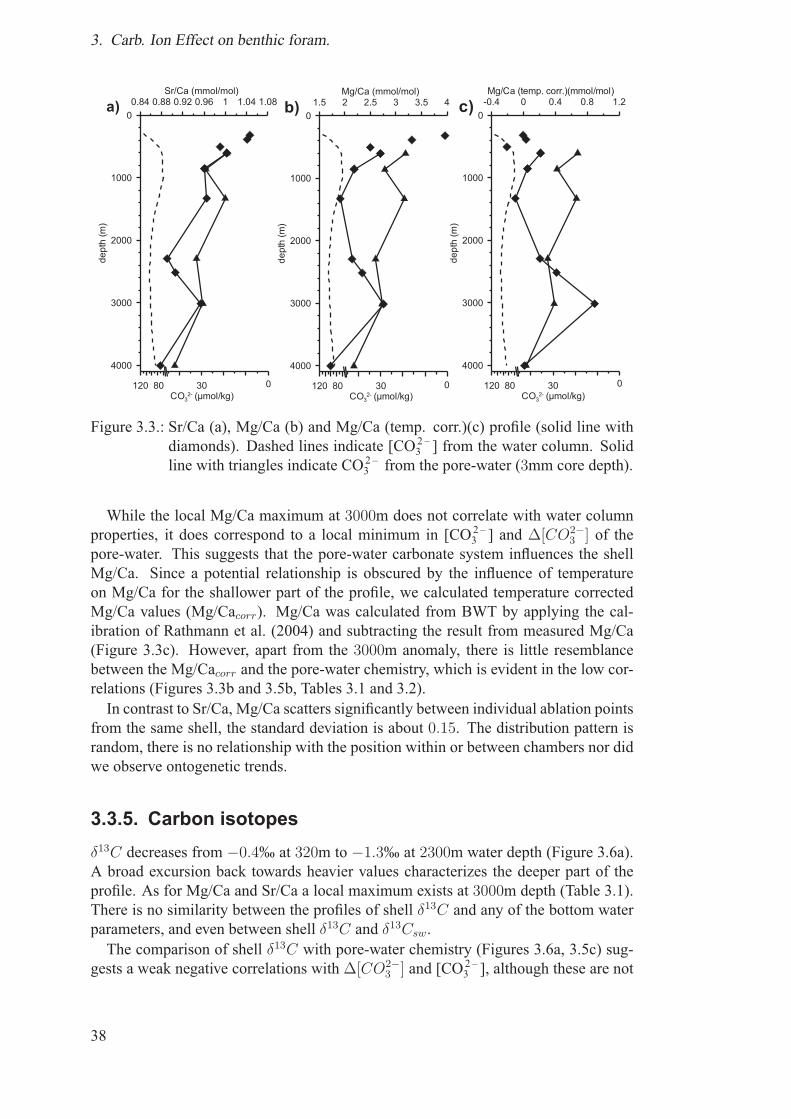
3. Carb. Ion Effect on benthic foram.
Figure 3.3.: Sr/Ca (a), Mg/Ca (b) and Mg/Ca (temp. corr.)(c) profile (solid line withdiamonds). Dashed lines indicate [CO2–3 ] from the water column. Solidline with triangles indicate CO2–3 from the pore-water (3mm core depth).
While the local Mg/Ca maximum at 3000m does not correlate with water columnproperties, it does correspond to a local minimum in [CO2–3 ] and Δ[CO2−
3 ] of thepore-water. This suggests that the pore-water carbonate system influences the shellMg/Ca. Since a potential relationship is obscured by the influence of temperatureon Mg/Ca for the shallower part of the profile, we calculated temperature correctedMg/Ca values (Mg/Cacorr). Mg/Ca was calculated from BWT by applying the cal-ibration of Rathmann et al. (2004) and subtracting the result from measured Mg/Ca(Figure 3.3c). However, apart from the 3000m anomaly, there is little resemblancebetween the Mg/Cacorr and the pore-water chemistry, which is evident in the low cor-relations (Figures 3.3b and 3.5b, Tables 3.1 and 3.2).In contrast to Sr/Ca, Mg/Ca scatters significantly between individual ablation points
from the same shell, the standard deviation is about 0.15. The distribution pattern israndom, there is no relationship with the position within or between chambers nor didwe observe ontogenetic trends.
3.3.5. Carbon isotopesδ13C decreases from −0.4‰ at 320m to −1.3‰ at 2300m water depth (Figure 3.6a).A broad excursion back towards heavier values characterizes the deeper part of theprofile. As for Mg/Ca and Sr/Ca a local maximum exists at 3000m depth (Table 3.1).There is no similarity between the profiles of shell δ13C and any of the bottom waterparameters, and even between shell δ13C and δ13Csw.The comparison of shell δ13C with pore-water chemistry (Figures 3.6a, 3.5c) sug-
gests a weak negative correlations with Δ[CO2−3 ] and [CO2–3 ], although these are not
38

3.3. Results
Figure 3.4.: Comparison of mean Mg/Ca ratios of O. umbonatus of our data with datafrom Rathmann et al. (2004)(solid line). Vertical bars indicate standarderrors of all measurements from core top sample. BWT has been derivedfrom local CTD measurements at the sampling positions and from theWOA (Stephens et al., 2002)). Formula calculated from all mean values(dashed line).
statistically significant. The influence of temperature on carbonate δ13C is a matterof debate (Romanek et al., 1992; Russell and Spero, 2000). If δ13C is corrected forδ13Csw and/or temperature the general shape of the δ13C curve with water depth (Fig-ure 3.6a) changes slightly, but the correlations with Δ[CO2−
3 ] and [CO2–3 ] to remaininsignificant (Table 3.3).
3.3.6. Oxygen isotopesδ18O values range from 1.7‰ at 320m to 3.3‰ at 3000m depth (Figure 3.6b). Theδ18O profile matches that of temperature without major deviations. To assess thepotential impact of sea- and pore-water chemistry we subtracted the temperature com-ponent from the measured δ18O data by applying the calibration of Shackleton (1974).We also subtracted the δ18O of seawater, although the potential impact on the overallvariability of shell δ18O is small given the range of δ18Osw of only 0.12‰. We willsubsequently use the term δ18Ocorr for the corrected shell δ18O. When the deepestsample (4000m) is excluded, δ18Ocorr shows little variability (Figure 3.6c), often onlymarginally exceeding the analytical uncertainty. There is no discernible trend withwater depth. A correlation with pore-water [CO2–3 ] is evident, but this relationshipshould be viewed cautiously given the analytical limits.
39
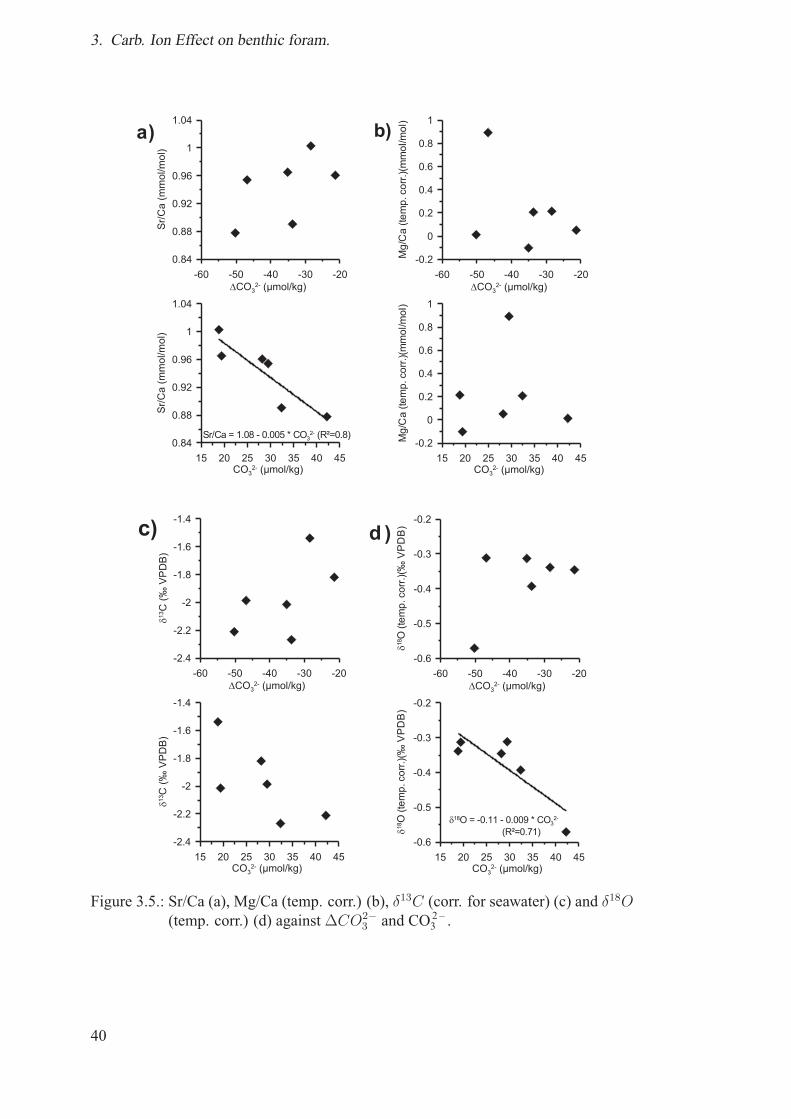
3. Carb. Ion Effect on benthic foram.
Figure 3.5.: Sr/Ca (a), Mg/Ca (temp. corr.) (b), δ13C (corr. for seawater) (c) and δ18O(temp. corr.) (d) against ΔCO2−
3 and CO2–3 .
40
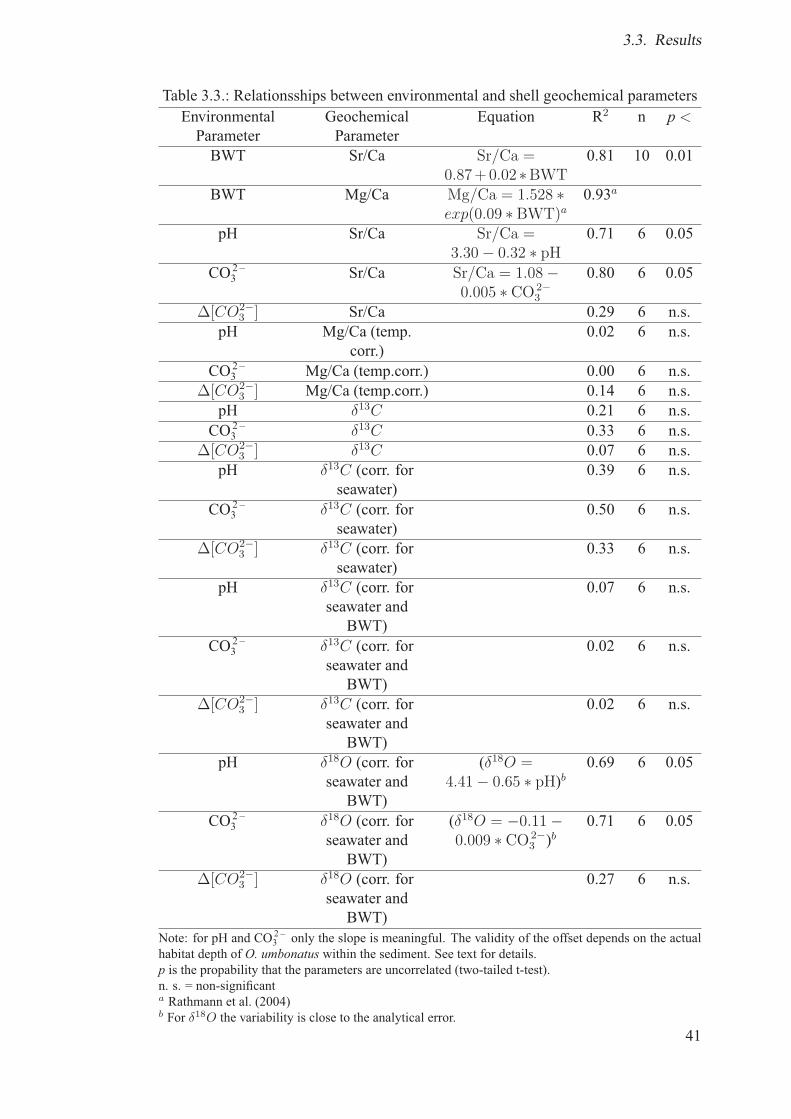
3.3. Results
Table 3.3.: Relationsships between environmental and shell geochemical parametersEnvironmentalParameter
GeochemicalParameter
Equation R2 n p <
BWT Sr/Ca Sr/Ca =0.87+0.02∗BWT
0.81 10 0.01
BWT Mg/Ca Mg/Ca = 1.528 ∗exp(0.09 ∗BWT)a
0.93a
pH Sr/Ca Sr/Ca =3.30− 0.32 ∗ pH
0.71 6 0.05
CO2–3 Sr/Ca Sr/Ca = 1.08−0.005 ∗ CO 2−
3
0.80 6 0.05
Δ[CO2−3 ] Sr/Ca 0.29 6 n.s.
pH Mg/Ca (temp.corr.)
0.02 6 n.s.
CO2–3 Mg/Ca (temp.corr.) 0.00 6 n.s.Δ[CO2−
3 ] Mg/Ca (temp.corr.) 0.14 6 n.s.pH δ13C 0.21 6 n.s.CO2–3 δ13C 0.33 6 n.s.
Δ[CO2−3 ] δ13C 0.07 6 n.s.
pH δ13C (corr. forseawater)
0.39 6 n.s.
CO2–3 δ13C (corr. forseawater)
0.50 6 n.s.
Δ[CO2−3 ] δ13C (corr. for
seawater)0.33 6 n.s.
pH δ13C (corr. forseawater andBWT)
0.07 6 n.s.
CO2–3 δ13C (corr. forseawater andBWT)
0.02 6 n.s.
Δ[CO2−3 ] δ13C (corr. for
seawater andBWT)
0.02 6 n.s.
pH δ18O (corr. forseawater andBWT)
(δ18O =4.41− 0.65 ∗ pH)b
0.69 6 0.05
CO2–3 δ18O (corr. forseawater andBWT)
(δ18O = −0.11−0.009 ∗ CO 2−
3 )b0.71 6 0.05
Δ[CO2−3 ] δ18O (corr. for
seawater andBWT)
0.27 6 n.s.
Note: for pH and CO2 –3 only the slope is meaningful. The validity of the offset depends on the actualhabitat depth of O. umbonatus within the sediment. See text for details.p is the propability that the parameters are uncorrelated (two-tailed t-test).n. s. = non-significanta Rathmann et al. (2004)b For δ18O the variability is close to the analytical error.
41
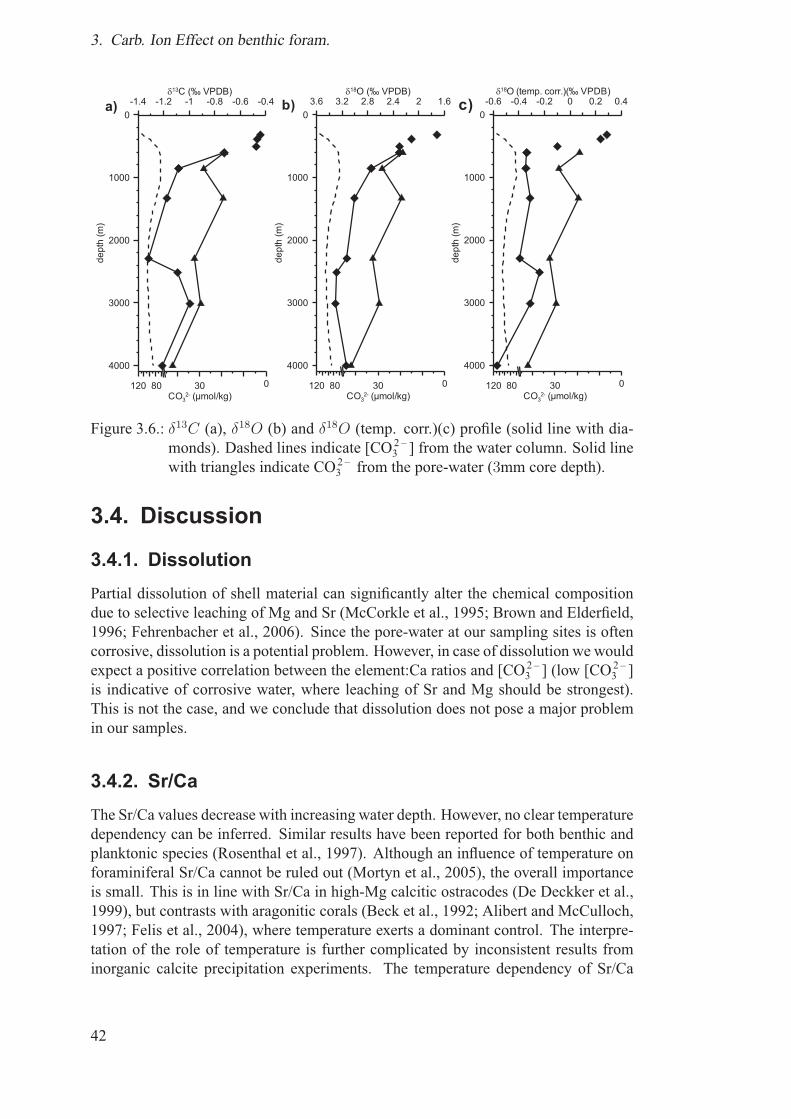
3. Carb. Ion Effect on benthic foram.
Figure 3.6.: δ13C (a), δ18O (b) and δ18O (temp. corr.)(c) profile (solid line with dia-monds). Dashed lines indicate [CO2–3 ] from the water column. Solid linewith triangles indicate CO2–3 from the pore-water (3mm core depth).
3.4. Discussion
3.4.1. DissolutionPartial dissolution of shell material can significantly alter the chemical compositiondue to selective leaching of Mg and Sr (McCorkle et al., 1995; Brown and Elderfield,1996; Fehrenbacher et al., 2006). Since the pore-water at our sampling sites is oftencorrosive, dissolution is a potential problem. However, in case of dissolution we wouldexpect a positive correlation between the element:Ca ratios and [CO2–3 ] (low [CO
2–3 ]
is indicative of corrosive water, where leaching of Sr and Mg should be strongest).This is not the case, and we conclude that dissolution does not pose a major problemin our samples.
3.4.2. Sr/CaThe Sr/Ca values decrease with increasing water depth. However, no clear temperaturedependency can be inferred. Similar results have been reported for both benthic andplanktonic species (Rosenthal et al., 1997). Although an influence of temperature onforaminiferal Sr/Ca cannot be ruled out (Mortyn et al., 2005), the overall importanceis small. This is in line with Sr/Ca in high-Mg calcitic ostracodes (De Deckker et al.,1999), but contrasts with aragonitic corals (Beck et al., 1992; Alibert and McCulloch,1997; Felis et al., 2004), where temperature exerts a dominant control. The interpre-tation of the role of temperature is further complicated by inconsistent results frominorganic calcite precipitation experiments. The temperature dependency of Sr/Ca
42
3.4. Discussion
ranges from positive (Malone and Baker, 1999) to insignificant (Katz et al., 1972) tonegative (Kinsman, 1969).Sr/Ca of seawater varies between ocean basins and with water depth (Bernstein
et al., 1987; de Villiers, 1999). Unless major carbonate dissolution takes place withinthe sediment this would affect both bottom and pore-water. However, the variabilityfor the South Atlantic (de Villiers, 1999) is only about 5% of the mean, while it is 17%for the foraminiferal shells. We therefore exclude water Sr/Ca as the primary driver ofshell Sr/Ca, although it may represent a secondary modifier.A significant influence of pore-water [CO2–3 ] on shell Sr/Ca is evident, a change in
[CO2–3 ] of 10μmol/kg results in a change in Sr/Ca of −0.05mmol/mol (Figure 3.3a).The absolute variability of Sr/Ca between samples is small, but approximately 90%can be explained by changes in [CO2–3 ]. In contrast to [CO
2–3 ] the influence of
Δ[CO2−3 ] is marginal (∼ 8%).
Interestingly, the negative correlation of Sr/Ca and [CO2–3 ] for O. umbonatus isopposed to that for Orbulina universa (Russell et al., 2004) and Hoeglundina elegans(Rosenthal et al., 2006), where the correlations are positive. The results also differfrom those for Globigerina bulloides, where no significant relationship exists (Russellet al., 2004). This indicates that the influence of [CO2–3 ] on foraminiferal Sr/Ca isstrongly species-specific. Orbulina universa is symbiotic and H. elegans is aragonitic,which suggests a potential role of endosymbionts and shell mineralogy on the sign ofthe Sr/Ca versus [CO2–3 ] relationship.
3.4.3. Mg/CaAs indicated previously the expected dependency of foraminiferal Mg/Ca ratios fromthe ambient bottom water temperature is clearly present, where the Mg/Ca ratios fallclose to the calibrations of Rathmann et al. (2004) and Lear et al. (2002), where thelatter is based on independent data.The positive excursion between 2293m and 3014m water depth in both Mg/Ca and
Mg/Cacorr coincides with a negative excursion in pore-water [CO2–3 ]. Following pre-vious studies on planktonic foraminifera (Lea et al., 1999; Russell et al., 2004) the de-crease in pore-water [CO2–3 ] by 10μmol/kg from 2300m to 3000m water depth shouldresult in a Mg/Ca increase of about 0.3−0.5mmol/mol, which compares with a changein Mg/Ca of 0.3 per 10μmol/kg [CO2–3 ] decrease in our data (Table 3.3). Although thisexcursion in Mg/Ca may be explained by changes in [CO2–3 ], the data from shallowerwater do not support a general [CO2–3 ]–dependency of Mg/Ca, which is evident by thelack of coincidence with Mg/Cacorr (Figure 3.3c). Russell et al. (2004) have shownthat pH and [CO2–3 ] only impact the shell Mg concentration below thresholds of pH8.2 and [CO2–3 ] of 200μmol/kg of the ambient water under laboratory conditions. Thepore-water at our sampling sites is often under-saturated with respect to calcite, and[CO2–3 ] remains well below the above values, suggesting that the “threshold effect” isnot present here. Elderfield et al. (2006) compared Mg/Ca in C. wuellerstorfiwith bot-tom water Δ[CO2−
3 ] on a global scale, where the Atlantic was the only ocean withoutsignificant relationship. In essence, a high proportion of the Mg/Ca variability (some-times more than one third) in O. umbonatus remains unexplained below temperaturesof ∼ 4◦C.The variability in Mg/Ca within shells of O. umbonatus from the same sediment
43
3. Carb. Ion Effect on benthic foram.
sample suggests that Mg is not homogeneously distributed. Within-shell variabilityalong the shell surface or between shell layers has been previously ascribed to temper-ature changes during growth (Toyofuku et al., 2000; Eggins et al., 2004), ontogenetictrend (Anand and Elderfield, 2005; Toyofuku and Kitazato, 2005), and variations thathave no apparent dependency on ontogenetic or environmental parameters (Hathorneet al., 2003; Eggins et al., 2003, 2004). We can exclude the first two possibilities, sincetemperature variability at the sampling sites is small, and no ontogenetic trends havebeen observed. Alternatively, changes in the ambient [CO2–3 ], e.g., due to vertical mi-gration of the foraminifer, could induce changes in the shell Mg/Ca. The problem withthis explanation is that we would expect a similar magnitude of variability in Sr/Ca,where the dependency on [CO2–3 ] is significant (see above). Although the intra-shellvariability for Mg/Ca is high and the exact reason remains enigmatic, the impact onthe average calculated for each sediment sample remains relatively small.
3.4.4. Carbon isotopesThe dependence of foraminiferal δ13C from [CO2–3 ] has been previously demonstra-ted in both culturing experiments and samples from plankton tows (Spero et al., 1997;Bauch et al., 2002; Wilke et al., 2006). The likely reason for the lack of a clearcorrelation in the Namibian samples is the unknown value of pore-water δ13C, whichmay differ from bottom water δ13C. Generally, the oxidation of organic matter inthe sediment releases 13C–depleted carbon resulting in the drop of pore-water δ13C.Therefore, the δ13Cshell is often influenced by the flux of organic matter to the sedi-ment (Zahn et al., 1986; Mackensen and Bickert, 1999), leading to offsets of up to−0.6‰ in extreme cases.
3.4.5. Oxygen isotopesThe gradient in δ18Ocorr versus pore-water [CO2–3 ] is higher but of the same orderof magnitude compared to the results of culturing studies of planktonic species bySpero et al. (1997) and Zeebe (1999), and inorganic calcite precipitation experiments(McCrea, 1950). To some extent the difference in the slope may be caused by theissue outlined in the Results section. However, it is likely that species-specific effectscontribute to the difference. Even among the (planktonic) species studied so far theslope ranges between 0.002‰ δ18O / μmol/kg [CO2–3 ] for Orbulina universa and0.005 for Globigerina bulloides (Spero et al., 1997), while no influence of [CO2–3 ] onδ18O has been found for Globorotalia inflata (Wilke et al., 2006).Theoretically, [CO2–3 ] should exert a stronger influence on endobenthic compared
to epibenthic species given the variable composition of pore-water. There are currentlyno systematic comparisons that include direct measurements of pore-water [CO2–3 ].Results purely based on δ18O are ambiguous: for example, there is no difference be-tween the epibenthic Cibicidoides wuellerstorfi and the endobenthic C. kullenbergi(McCorkle et al., 1990), but Mulitza and Paul (2003) suggested that the 0.6‰ offsetbetween C. wuellerstorfi and the endobenthic Uvigerina peregrina may be due to dif-ferent carbonate ion concentrations in the ambient water. However, due to the absenceof [CO2–3 ] data there is no clear distinction between the influences of [CO
2–3 ] and vital
effects.
44
3.5. Conclusions
3.4.6. Influence of water masses
Variations in water mass properties have been previously suggested to influence theforaminiferal shell chemistry (Martin et al., 1999). Our sampling transect penetratessome of the major water masses of the South Atlantic. With respect to the carbonatesystem, the strongest contrast exists between the high-[CO2–3 ] NADW on one handand the highly corrosive, low-[CO2–3 ] AAIW and AABW on the other hand (Fig-ure 3.2). The anomalies in our Mg/Ca, Sr/Ca, and δ13C data are centred at about3000m depth, which would correspond to the NADW. While at first this hints at a po-tential water mass effect, the closer inspection of the water column chemistry revealsthat there is no change equivalent to the anomaly in the shell composition. Further-more, the local extremes in water chemistry that characterizes the AAIW core (ataround 800m) are not accompanied by anomalies or local extremes in our geochemi-cal data. This lack of coincidence is not surprising, given the degree of independencebetween the pore-water and the water column. Together with the clear influence of thepore-water on shell Sr/Ca and δ13C, this demonstrates that O. umbonatus off Namibiarecords pore-water, not water column, properties.
3.5. ConclusionsWe measure trace element and stable isotope ratios in O. umbonatus and comparedthe results with the chemical and physical properties of the water column and thepore-water. Only the latter appeared to influence the shell composition. We observe anegative correlation between δ18Ocorr and [CO2–3 ], which is expected from previousobservations and experiments. The variability in 18Ocorr between the sample stationsis small, and we suggest further investigation covering a broader range of values.A significant [CO2–3 ]–dependence was inferred for Sr/Ca, in fact, most of the Sr/Ca
variability can be attributed to changes in [CO2–3 ]. In contrast to previous studies,the sign of the relationship is negative. Nevertheless, the results indicate that Sr/Cain O. umbonatus offers the potential as a paleo-proxy for pore-water [CO2–3 ] in fu-ture studies. Generally, the influence of [CO2–3 ] rather than Δ[CO2−
3 ] appears moreimportant. No clear influence was observed for δ13C and Mg/Ca.The results indicate that it is important to distinguish between the chemical pro-
perties of pore-water and the water column. At least for organic-rich sediments it isnecessary to use pore-water measurements to investigate the influence of the carbonatesystem on the shell composition in endobenthic foraminifera.
Acknowledgements We thank Monika Segl and her team for the stable isotopemeasurements. Andreas Mackensen and Andre Paul provided water stable isotopedata, Matthias Zabel made the pH data available, and Iris Wilke introduced us tothe CO2SYS software. We thank Stefan Mulitza for discussions and many valuablesuggestions, and Heather Johnstone for improving the English. Gert-Jan Reichart andan anonymous reviewer are thanked for their constructive and helpful comments. Thiswork was funded by the Deutsche Forschungsgemeinschaft (DFG Research CenterOcean Margins Contribution No. RCOM0524).
45
3. Carb. Ion Effect on benthic foram.
Supplementary data Supplementary data associated with this article can be found,in the online version, at doi:10.1016/j.marmicro.2007.08.001 and in Chapter A.
46
4. Stratification of eastern SouthAtlantic (25◦S) upper watermasses during the Last GlacialMaximum
Sohnke Rathmann, Henning Kuhnert, Andre Paul, Oscar Romero and Stefan Mulitzamanuscript in preparation for submission to Geophysical Research Letters
Abstract We investigate the changes in the water mass stratification between theHolocene and the Last Glacial Maximum. Trace elements and stable isotopes weremeasured on Oridorsalis umbonatus of six multicores and six gravity cores to deter-mine bottom water temperatures and salinity. The calculated density represent thatour samples follow the water masses downslope in the regular sequence. Bottom wa-ter temperatures (BWT) show nearly no changes between the Last Glacial Maximumand modern values. Interestingly, in the shallow cores, which were most influenced,we observe slightly warmer BWTs during the LGM, which is in contrast to the fin-dings of Niebler et al. (2003), who investigated inter alia nearby cores with a modifiedversion of the Imbrie-Kipp-Tranfer-Function. These opposed changes between BWTsand sea surface temperatures (SST) suggest a movement of the water masses.
4.1. IntroductionThe permanent thermoclines in the subtropical gyres constitute about 15%–20%of the World Ocean volume (Karstensen and Quadfasel, 2002). This volume is venti-lated through subduction, which is the flux across the base of the mixed layer at mid-and low latitudes (Luyten et al., 1983). The waters in the thermocline store, trans-port and release heat and nutrients. Therefore thermocline processes exert primarycontrol over the cycling and vertical distribution of nutrients and heat in the ocean(e.g. Slowey and Curry, 1995), and may act as a buffer or amplifier for changes in theearth’s climate system. Furthermore, the associated thermocline circulation providesa route of communication between the midlatitudes and the tropics (e.g. Johnson andMcPhaden, 1999). This is especially true for the upwelling regions offshore South-west Africa where the characteristics of the local hydrography (and presumably thatof the local productivity) seems to be highly dependent on the properties of the up-welled thermocline water (Niebler et al., 2003; Paul and Schafer-Neth, 2003), whichare preformed at higher latitudes.The model results of the modelling group of the Geosciences Department at Bremen
University yield strong evidence for a glacial shallowing of both mixed layer and
47
4. Stratification of the upper water masses
thermocline in the Namibian upwelling region. In concert with higher glacial windspeeds and increased upwelling velocity, this shallowing resulted in a more efficientvertical exchange between these two uppermost layers of the ocean. At the same time,the balance of Angola and Benguela Current was shifted towards the latter, which wasdominated by the cold water preformed near Drake Passage (instead of Indian OceanWaters).In the western North Atlantic the glacial thermocline was also characterized by
a cooler, shallower and more uniformly ventilated thermocline (Slowey and Curry,1995). However, it is still unknown how this changed glacial thermocline structureaffected the upwelling regions in the eastern North Atlantic off Northwest Africa.The strength of the temperature decrease in the last glacial maximum (LGM) has
been extensively discussed (e.g. CLIMAP-Project Members, 1981; Niebler et al.,2003, on a global scale and on a regional scale, respectively). Niebler et al. (2003) re-constructed a temperature difference of 10◦C for the shallow area off Namibia. Theyused a modified version of the Imbrie-Kipp transfer function method to reconstructsea-surface temperatures (SST) from foraminiferal faunal assemblages. The valida-tion or refutation of these huge changes in temperature will be discussed here.With the aid of Mg/Ca and δ18O of the benthic foraminifera Oridorsalis umbonatus
it is also possible to reconstruct the salinity. The Mg/Ca values were used to recon-struct the temperature, which is therefore independent from the stable oxygen isotopesand can be used in the well known equation from Epstein et al. (1953) to calculate theδ18O of seawater (δ18Osw). These δ18Osw is the variable to calculate the salinity (seeWolff et al., 1999).Since a few years the influence of the carbonate ion concentration ([CO2–3 ]) on the
incorporation of trace elements is discussed (e.g. Russell and Spero, 2000; Russellet al., 2004; Elderfield et al., 2006). In a recently published article, Rathmann andKuhnert (2008) explored the influence of [CO2–3 ] on the trace element ratios of O.umbonatus. They found only a sensitivity with Sr/Ca and δ18O. Therefore, the [CO2–3 ]will be ignored, due to their small influence on Mg/Ca.
4.1.1. Regional SettingOff Namibia, the surface layer is characterised by warm water of higher salinity o-riginating from the northern Benguela. The SST increases offshore, and at the coasta very weak upwelling structure is found. Below the surface mixed layer oxygendepleted central water covers the entire shelf and the continental margin to 12.2◦E.The decomposition of organic matter caused anoxic conditions in the bottom layer atthe shelf. The core of the Antarctic Intermediate Water (AAIW) was identified by thesalinity minimum at 800m depth. The secondary salinity maximum near 2200m isassociated with the North Atlantic Deep Water (NADW).The thermocline water off Namibia consists of two different central water masses
and their mixing stages. Saline, nutrient rich but oxygen depleted South Atlantic Cen-tral water (SACW) originating from the tropical ecosystem enters the Benguela sys-tem from the north. Fresher, nutrient-depleted and oxygen-rich Eastern South AtlanticCentral Water (ESACW) is transported with the Benguela Current (BC) northward. Inthe upper central water layer (13◦C isotherm, ∼ 150m depth, Moorholz and Heene,2003b) the SACW reach to 24◦S and covers only the shelf. The major portion of the
48
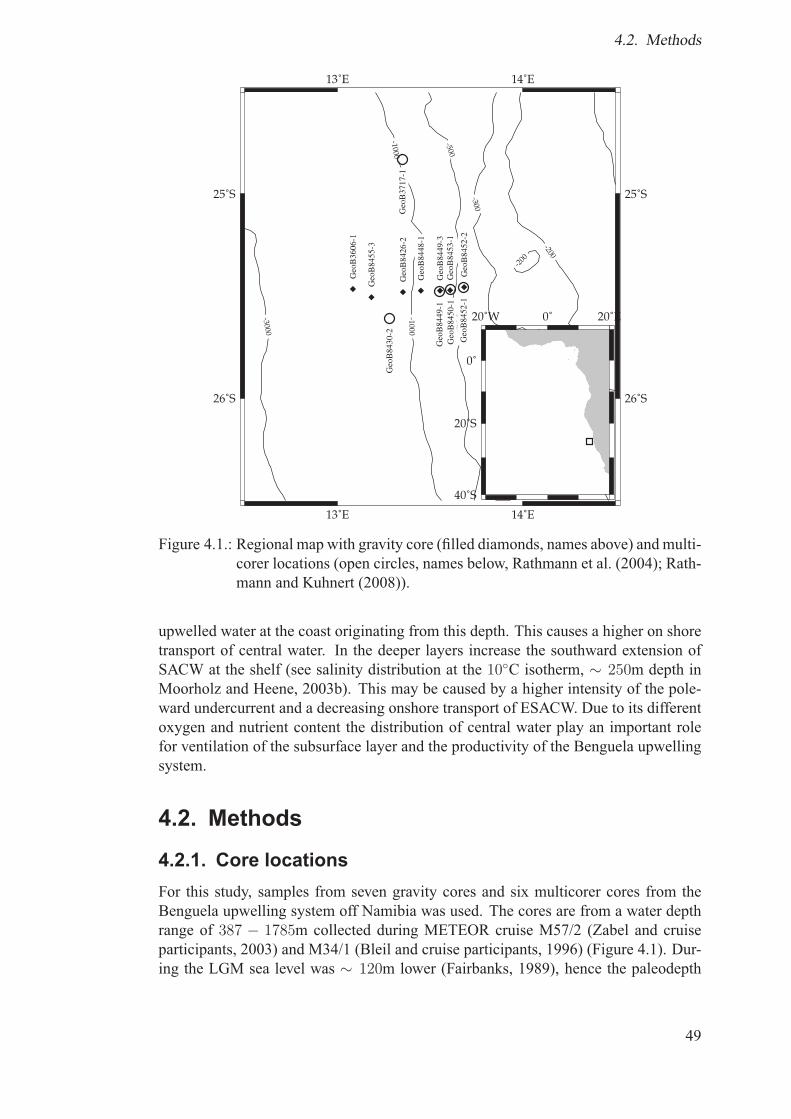
4.2. Methods
Figure 4.1.: Regional map with gravity core (filled diamonds, names above) and multi-corer locations (open circles, names below, Rathmann et al. (2004); Rath-mann and Kuhnert (2008)).
upwelled water at the coast originating from this depth. This causes a higher on shoretransport of central water. In the deeper layers increase the southward extension ofSACW at the shelf (see salinity distribution at the 10◦C isotherm, ∼ 250m depth inMoorholz and Heene, 2003b). This may be caused by a higher intensity of the pole-ward undercurrent and a decreasing onshore transport of ESACW. Due to its differentoxygen and nutrient content the distribution of central water play an important rolefor ventilation of the subsurface layer and the productivity of the Benguela upwellingsystem.
4.2. Methods
4.2.1. Core locationsFor this study, samples from seven gravity cores and six multicorer cores from theBenguela upwelling system off Namibia was used. The cores are from a water depthrange of 387 − 1785m collected during METEOR cruise M57/2 (Zabel and cruiseparticipants, 2003) and M34/1 (Bleil and cruise participants, 1996) (Figure 4.1). Dur-ing the LGM sea level was ∼ 120m lower (Fairbanks, 1989), hence the paleodepth
49
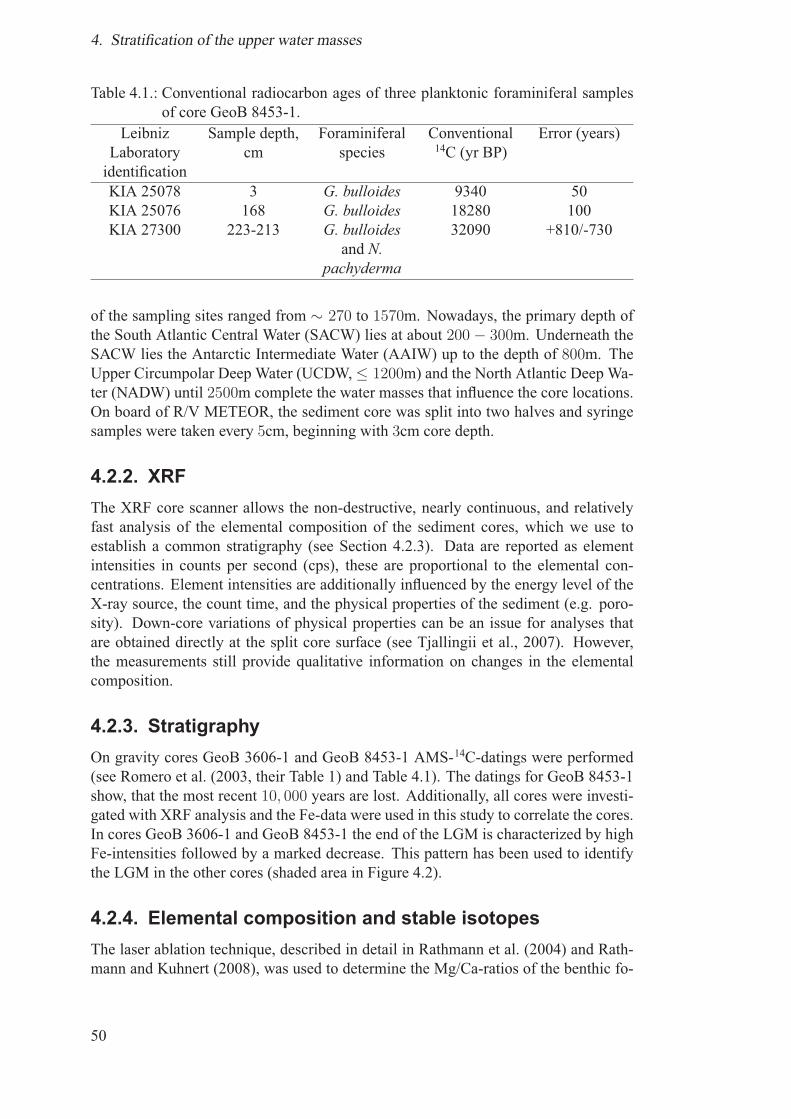
4. Stratification of the upper water masses
Table 4.1.: Conventional radiocarbon ages of three planktonic foraminiferal samplesof core GeoB 8453-1.
LeibnizLaboratoryidentification
Sample depth,cm
Foraminiferalspecies
Conventional14C (yr BP)
Error (years)
KIA 25078 3 G. bulloides 9340 50KIA 25076 168 G. bulloides 18280 100KIA 27300 223-213 G. bulloides
and N.pachyderma
32090 +810/-730
of the sampling sites ranged from ∼ 270 to 1570m. Nowadays, the primary depth ofthe South Atlantic Central Water (SACW) lies at about 200 − 300m. Underneath theSACW lies the Antarctic Intermediate Water (AAIW) up to the depth of 800m. TheUpper Circumpolar Deep Water (UCDW,≤ 1200m) and the North Atlantic Deep Wa-ter (NADW) until 2500m complete the water masses that influence the core locations.On board of R/V METEOR, the sediment core was split into two halves and syringesamples were taken every 5cm, beginning with 3cm core depth.
4.2.2. XRFThe XRF core scanner allows the non-destructive, nearly continuous, and relativelyfast analysis of the elemental composition of the sediment cores, which we use toestablish a common stratigraphy (see Section 4.2.3). Data are reported as elementintensities in counts per second (cps), these are proportional to the elemental con-centrations. Element intensities are additionally influenced by the energy level of theX-ray source, the count time, and the physical properties of the sediment (e.g. poro-sity). Down-core variations of physical properties can be an issue for analyses thatare obtained directly at the split core surface (see Tjallingii et al., 2007). However,the measurements still provide qualitative information on changes in the elementalcomposition.
4.2.3. StratigraphyOn gravity cores GeoB 3606-1 and GeoB 8453-1 AMS-14C-datings were performed(see Romero et al. (2003, their Table 1) and Table 4.1). The datings for GeoB 8453-1show, that the most recent 10, 000 years are lost. Additionally, all cores were investi-gated with XRF analysis and the Fe-data were used in this study to correlate the cores.In cores GeoB 3606-1 and GeoB 8453-1 the end of the LGM is characterized by highFe-intensities followed by a marked decrease. This pattern has been used to identifythe LGM in the other cores (shaded area in Figure 4.2).
4.2.4. Elemental composition and stable isotopesThe laser ablation technique, described in detail in Rathmann et al. (2004) and Rath-mann and Kuhnert (2008), was used to determine the Mg/Ca-ratios of the benthic fo-
50
4.2. Methods
4000 3000 2000 1000 0
Fe (cps)GeoB 8426-2wd: 1045 m
400
300
200
100
0
de
pth
(cm
)
4000 3000 2000 1000 0
Fe (cps)GeoB 8448-1
wd: 803 m
5000 4000 3000 2000 1000 0
Fe (cps)GeoB 8452-2
wd: 387 m
6000 5000 4000 3000 2000 1000
Fe (cps)GeoB 8453-1
wd: 505 m
4000 3000 2000 1000 0
Fe (cps)GeoB 8455-3wd: 1515 m
400
300
200
100
0
de
pth
(m)
4000 3000 2000 1000 0
Fe (cps)GeoB 3606-1wd: 1785 m
9340
18280
32090
9895
10895
13280
16990
Figure 4.2.: XRF-Fe-measurements of the gravity cores to determine the LGM(shaded area). Arrows indicate the measurment range. Triangles indicateAMS-14C measurements with uncalibrated ages.
raminifera Oridorsalis umbonatus. Measurements are based on the isotopes 25Mg and43Ca. 55Mn and 64Zn were measured as indicators of contaminants. Mn is present iniron-manganese crusts, while Zn indicates the penetration of the shell and the ablationof the sample holder. Each foraminiferal test was measured five times on different po-sitions using a beam diameter of 70μm. The NIST610 standard was measured beforeand after each foraminiferal test. For each sediment sample, the final Mg/Ca ratioswere calculated by averaging 5 − 30 measurements (5 points per specimen, 1 − 6specimens per sample). This procedure makes up for the high within- and between-shell variability for Mg/Ca (Rathmann et al., 2004). Outliers beyond the 2σ rangewere discarded. The standard errors of the averages range from 0.1 to 0.4mmol/molfor Mg/Ca. The results of the 2 − 5 samples per gravity core were combined to oneLGM-data point.Stable isotopes were measured after the trace element measurements on the same
shells. The δ13C- and δ18O-values were determined on a Finnigan MAT 251 massspectrometer equipped with an automated carbonate device. The analytical errors(1σ) are 0.07 for δ18O and 0.03 for δ13C. The reproducibilities based on a laboratorystandard are < 0.07 for δ18O and < 0.05 for δ13C.
4.2.5. Reconstruction of bottom water temperature (BWT)and density
The Mg/Ca ratios and δ18Oc values were used to reconstruct bottom water temper-atures (BWT) and water mass densities (ρ). We used the BWT–Mg/Ca relation-ship from Rathmann et al. (2004) for the reconstruction of the BWT (Mg/Ca =1.528 ∗ e(0.09∗BWT), where Mg/Ca is reported in mmol/mol and BWT is the bottomwater temperature in ◦C). These BWT were used to subtract the temperature compo-nent from foraminiferal δ18O in order to calculate δ18Osw and paleosalinity followingthe procedure in Wolff et al. (1999, equations 2 and 7): δ18Ow = δ18Oc − 21.9 +√
310.6 + 10 ∗BWT and S =δ18Ow − b
a− dg
a+ Sg with the isotope ratio of sea-
water δ18Ow, the isotope ratio of the foraminifera test δ18Oc and the above calculated
51
4. Stratification of the upper water masses
Table 4.2.: Reconstructed BWT and density.
(a) Multicorer
corenumber
Depth,m
Lat., ◦S Lon.,◦E
δ18Oc,‰
VPDB
δ18Ow,‰
VPDB
S, psu ρ,kg/m3
GeoB8403-1
320 24.25 13.61 1.72 0.49 35.32 1028.57
GeoB8452-1
388 25.46 13.68 2.11 0.40 35.14 1029.08
GeoB8450-1
506 25.47 13.61 2.30 -0.22 34.00 1029.02
GeoB8449-1
605 25.48 13.55 2.30 0.004 34.41 1029.93
GeoB3717-1
855 24.83 13.35 2.74 -0.18 34.08 1031.01
GeoB8430-2
1330 25.61 13.28 3.01 -0.31 33.83 1033.06
(b) Gravity corer
GeoB8452-2
387 25.46 13.68 1.89 1.25 35.59 1028.04
GeoB8453-1
505 25.47 13.61 2.78 1.32 35.72 1029.32
GeoB8448-1
803 25.48 13.45 3.51 1.79 36.60 1031.52
GeoB8426-2
1045 25.48 13.35 4.12 1.84 36.70 1033.05
GeoB8455-3
1515 25.51 13.18 4.52 1.69 36.42 1035.26
GeoB3606-1
1785 25.47 13.08 5.10 0.81 34.79 1035.82
bottom water temperature BWT. a is the slope of the δ18Ow–salinity relationship and bis the freshwater end member of δ18O. dg and Sg are correction factors for δ18Ow andsalinity. They are 0 for the core tops and 1.2‰ and 1.1‰, respectively, for the gravitycore samples. These reconstructed BWT and paleosalinities were used to calculate ρwith an online calculator (Tomczak, 2000). See all data in Table 4.2.
52
4.3. Results
Table 4.3.: Time slice measurements (LGM) of the cores.GC
numberDepth, m Lat., ◦S Lon., ◦E Mg/Ca,
mmolmol
deviation δ18Oc, ‰VPDB
GeoB8452-2
387 25.46 13.68 4.921 0.75 1.886
GeoB8453-1
505 25.47 13.61 3.630 0.67 2.780
GeoB8448-1
803 25.48 13.45 3.311 0.12 3.506
GeoB8426-2
1045 25.48 13.35 2.715 0.38 4.122
GeoB8455-3
1515 25.51 13.18 2.251 0.11 4.517
GeoB3606-1
1785 25.47 13.08 1.398 0.09 5.102
4.3. Results
The temperature drops from∼ 11◦C in shallowest down to∼ 3◦C at the deepest sites.
The Mg/Ca ratios generally decrease with increasing water depth, ranging from∼ 4mmol/mol to ∼ 2mmol/mol at the sediment surface and from 4.9mmol/mol to1.4mmol/mol for the LGM samples (see Table 4.3 and Figure 4.3). The Mg/Ca ratiosfor the LGM are slightly higher than the Holocene values (∼ 0.8mmol/mol on aver-age), except for the deepest gravity core GeoB 3606-1 (Figure 4.3). In the same depthinterval, δ18Oc increase from 1.886‰ to 5.102‰. When the LGM data are correctedfor sea level (1‰) there are nearly no differences between the gravity core data andthe multicorer data (see the equlibrium curve in Figure 4.3).
The calculated modern seawater salinity fluctuates between 35.32psu at the shal-lowest depth and 33.83psu (Table 4.2a) at the deepest core position and is< 1% lowerthan the measured data (Moorholz and Heene, 2003a). For the LGM the seawatersalinity is slightly higher, as expected, we have a scope from 34.79psu to 36.7psu(Table 4.2b).
The seawater density was calculated to verify, that the water masses follow thecorrect sequence. Each water mass has a different density, increasing with increasingwater depth. The calculated in-situ density span the range from 1028.57kgm−3 for theshallowest multicore to 1033.06kgm−3 for the deepest multicore. For the multicoresfrom M57/2, CTD-data for the density is available. These measured density data(Moorholz and Heene, 2003a) are slightly lower (< 0.5%) than the calculated ones,but the offset is not constant. Due to the absence of CTD-data for all multicoresand the variable differences, the offset will be ignored. For the gravity cores therange is 1028.04− 1035.82kgm−3. Figure 4.4 show the calculated seawater densitiesagainst water depth. Both multicorer (Figure 4.4, black dots) and gravity corer data(Figure 4.4, red dots) show these increases of water depth and sewater density.
53
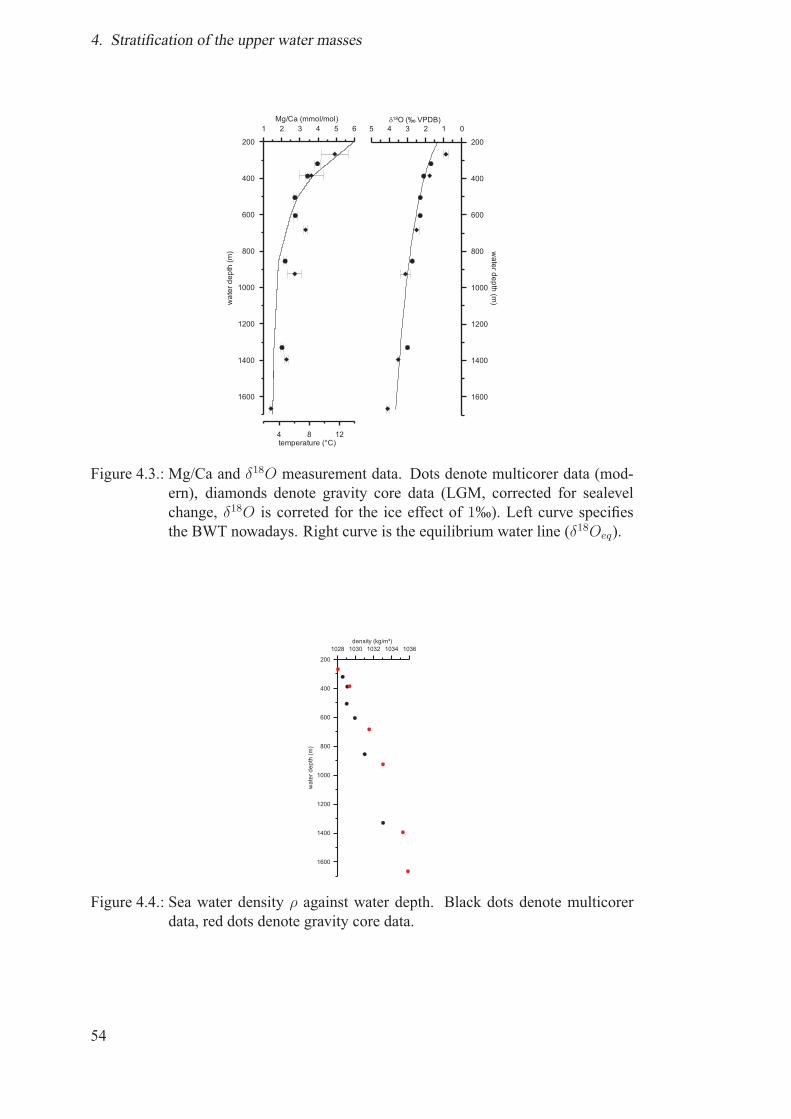
4. Stratification of the upper water masses
Figure 4.3.: Mg/Ca and δ18O measurement data. Dots denote multicorer data (mod-ern), diamonds denote gravity core data (LGM, corrected for sealevelchange, δ18O is correted for the ice effect of 1‰). Left curve specifiesthe BWT nowadays. Right curve is the equilibrium water line (δ18Oeq).
Figure 4.4.: Sea water density ρ against water depth. Black dots denote multicorerdata, red dots denote gravity core data.
54
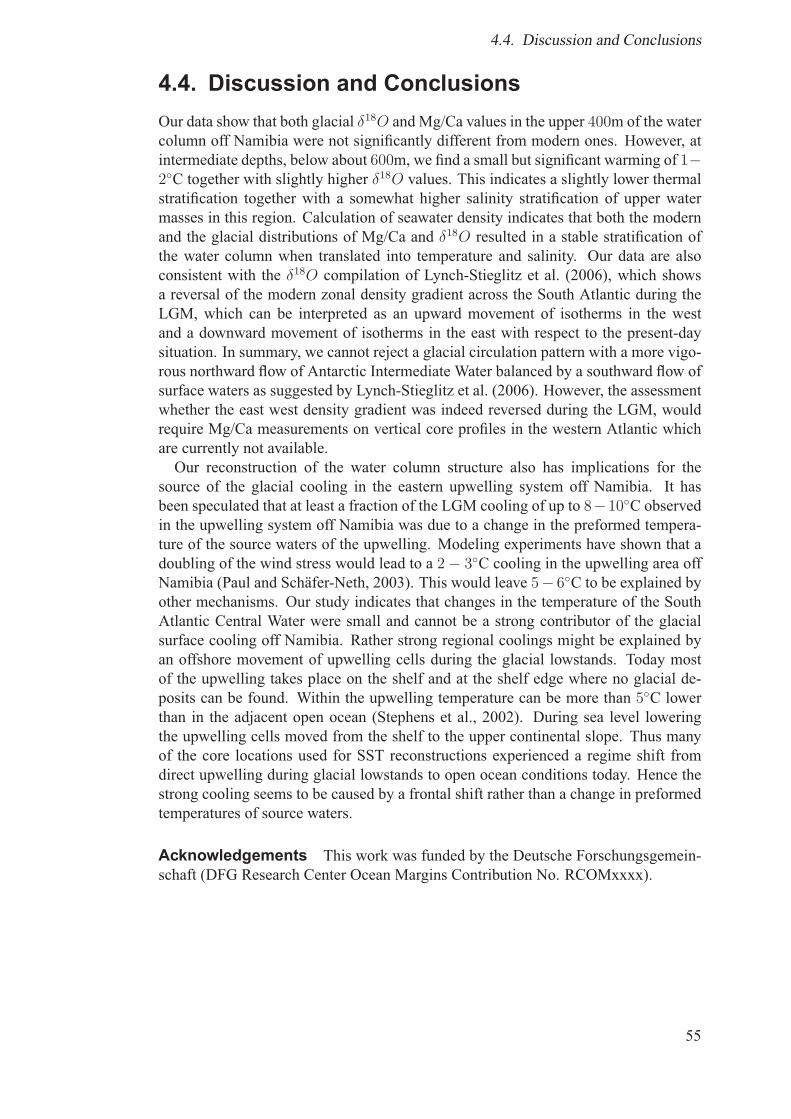
4.4. Discussion and Conclusions
4.4. Discussion and ConclusionsOur data show that both glacial δ18O and Mg/Ca values in the upper 400m of the watercolumn off Namibia were not significantly different from modern ones. However, atintermediate depths, below about 600m, we find a small but significant warming of 1−2◦C together with slightly higher δ18O values. This indicates a slightly lower thermalstratification together with a somewhat higher salinity stratification of upper watermasses in this region. Calculation of seawater density indicates that both the modernand the glacial distributions of Mg/Ca and δ18O resulted in a stable stratification ofthe water column when translated into temperature and salinity. Our data are alsoconsistent with the δ18O compilation of Lynch-Stieglitz et al. (2006), which showsa reversal of the modern zonal density gradient across the South Atlantic during theLGM, which can be interpreted as an upward movement of isotherms in the westand a downward movement of isotherms in the east with respect to the present-daysituation. In summary, we cannot reject a glacial circulation pattern with a more vigo-rous northward flow of Antarctic Intermediate Water balanced by a southward flow ofsurface waters as suggested by Lynch-Stieglitz et al. (2006). However, the assessmentwhether the east west density gradient was indeed reversed during the LGM, wouldrequire Mg/Ca measurements on vertical core profiles in the western Atlantic whichare currently not available.Our reconstruction of the water column structure also has implications for the
source of the glacial cooling in the eastern upwelling system off Namibia. It hasbeen speculated that at least a fraction of the LGM cooling of up to 8−10◦C observedin the upwelling system off Namibia was due to a change in the preformed tempera-ture of the source waters of the upwelling. Modeling experiments have shown that adoubling of the wind stress would lead to a 2− 3◦C cooling in the upwelling area offNamibia (Paul and Schafer-Neth, 2003). This would leave 5− 6◦C to be explained byother mechanisms. Our study indicates that changes in the temperature of the SouthAtlantic Central Water were small and cannot be a strong contributor of the glacialsurface cooling off Namibia. Rather strong regional coolings might be explained byan offshore movement of upwelling cells during the glacial lowstands. Today mostof the upwelling takes place on the shelf and at the shelf edge where no glacial de-posits can be found. Within the upwelling temperature can be more than 5◦C lowerthan in the adjacent open ocean (Stephens et al., 2002). During sea level loweringthe upwelling cells moved from the shelf to the upper continental slope. Thus manyof the core locations used for SST reconstructions experienced a regime shift fromdirect upwelling during glacial lowstands to open ocean conditions today. Hence thestrong cooling seems to be caused by a frontal shift rather than a change in preformedtemperatures of source waters.
Acknowledgements This work was funded by the Deutsche Forschungsgemein-schaft (DFG Research Center Ocean Margins Contribution No. RCOMxxxx).
55

4. Stratification of the upper water masses
56
5. Conclusions and OutlookThis study demonstrates clearly that measuring Mg/Ca ratios on O. umbonatus withthe laser ablation technique is a useful alternative approach to estimate bottom watertemperatures. Since O. umbonatus is abundant over the main thermocline, it is agood candidate for studying past variations in vertical temperature gradients. Theinvestigation of surface samples to calibrate this proxy for the Benguela UpwellingArea revealed the following results:
• The sensitivity of theMg/Ca–temperature relationship forO. umbonatus is com-parable to that of Cibicidoides spp.
• The laser ablation technique allows the rapid determination of Mg/Ca ratios aslong as the number of samples is relatively small. It is therefore well suitedfor overviews on core sequences and can serve as a basis for subsequent high-resolution studies with liquid solution analyses.
• Laser ablation also provides information on within-sample variability that isotherwise difficult to obtain.
• The high number of measurements per sediment sample allows identification ofoutliers and potentially contaminated shell parts and their subsequent exclusion,thus increasing the accuracy of the final temperature estimate.
Research findings of the last years have shown, that the carbonate ion concentration/ saturation can have an influence on the incorporation of trace elements and stableisotopes in the tests of foraminifera. Therefore it was necessary to examine, whethersuch an influence could also be detected for O. umbonatus. This study showed:
• There is a negative correlation between δ18Ocorr and [CO2–3 ], which has beenexpected from previous observations and experiments. However, the variabilityin δ18Ocorr between the various sample stations is small, and we suggest furtherinvestigation covering a broader range of values.
• A significant [CO2–3 ] dependence was inferred for Sr/Ca, which accounts formost of the Sr/Ca variability. In contrast to previous studies, the sign of therelationship is negative, yet the results indicate that Sr/Ca in O. umbonatus hasthe potential to be used as a paleo-proxy for pore-water [CO2–3 ].
• The influence of [CO2–3 ] on the trace element ratios and stable isotope compo-sition appears to be more important than the influence of Δ[CO2−
3 ].
• No clear influence of [CO2–3 ] was observed for δ13C and Mg/Ca.
57
5. Conclusions and Outlook
• Depending on the habitat of the investigated foraminiferal species it is importantto distinguish between the chemical properties of the pore-water and the watercolumn. For organic-rich sediments it is necessary to use pore-water measure-ments to investigate the influence of the carbonate system on the shell composi-tion of endobenthic foraminifera like O. umbonatus.
Niebler et al. (2003) have speculated that at least a fraction of the LGM cooling ofup to 8− 10◦C observed in the upwelling system off Namibia was due to a change inthe preformed temperature of the source waters of the upwelling. Modeling experi-ments have shown that a doubling of the wind stress would lead to a 2− 3◦C coolingin the upwelling area off Namibia (Paul and Schafer-Neth, 2003). This would leave6− 7◦C to be explained by other mechanisms. Investigating trace elements and stableisotopes of O. umbonatus in the LGM time slice of the sedimentary record within theBenguela Upwelling Area has shown:
• Both glacial δ18O and Mg/Ca values in the upper 400m of the water columnoff Namibia were not significantly different from modern ones. At intermediatedepths, below about 600m, a small but significant warming of 1− 2◦C togetherwith slightly higher δ18O values was found. This indicates a slightly lowerthermal stratification together with a somewhat higher salinity stratification ofupper water masses in this region.
• The calculation of seawater density indicates that both the modern and theglacial distributions of Mg/Ca and δ18O resulted in a stable stratification of thewater column when translated into temperature and salinity.
• Changes in the temperature of the South Atlantic Central Water were small andcannot be a strong contributor to the glacial surface cooling off Namibia. Ratherstrong regional coolings might be explained by an offshore movement of up-welling cells during the glacial lowstands. During sea level lowering in theLGM the upwelling cells moved from the shelf to the upper continental slope.Thus many of the core locations used for SST reconstructions experienced aregime shift from direct upwelling during glacial lowstands to open ocean con-ditions today. Hence the strong cooling seems to be caused by a frontal shiftrather than a change in preformed temperatures of source waters.
This work shows a regional investigation on the rarely used species O. umbonatus.For future studies, it would be interesting to do the same analysis in other regionsof the Atlantic Ocean, e.g. off NW-Africa as well as in upwelling areas in the otheroceans. The area off NW-Africa between Cape Blanc in the south (∼ 22◦N) andCape Ghir in the north (∼ 30◦N) seems a good candidate for further investigationsof that kind, due to the numerous expeditions conducted in the recent past (Meggersand cruise participants, 2002; Schulz and cruise participants, 2003; Bleil and cruiseparticipants, 2004). The oceanographic situation is as well known as off Namibia,and the sample frequency of GeoB sediment cores is nearly the same. In addition,the geochemistry group at Bremen University also does extensive investigations in theregion, so that the geochemical parameters like [CO2–3 ] are available for the watercolumn as well as for the pore-water. A comparison of the different calibrations for
58
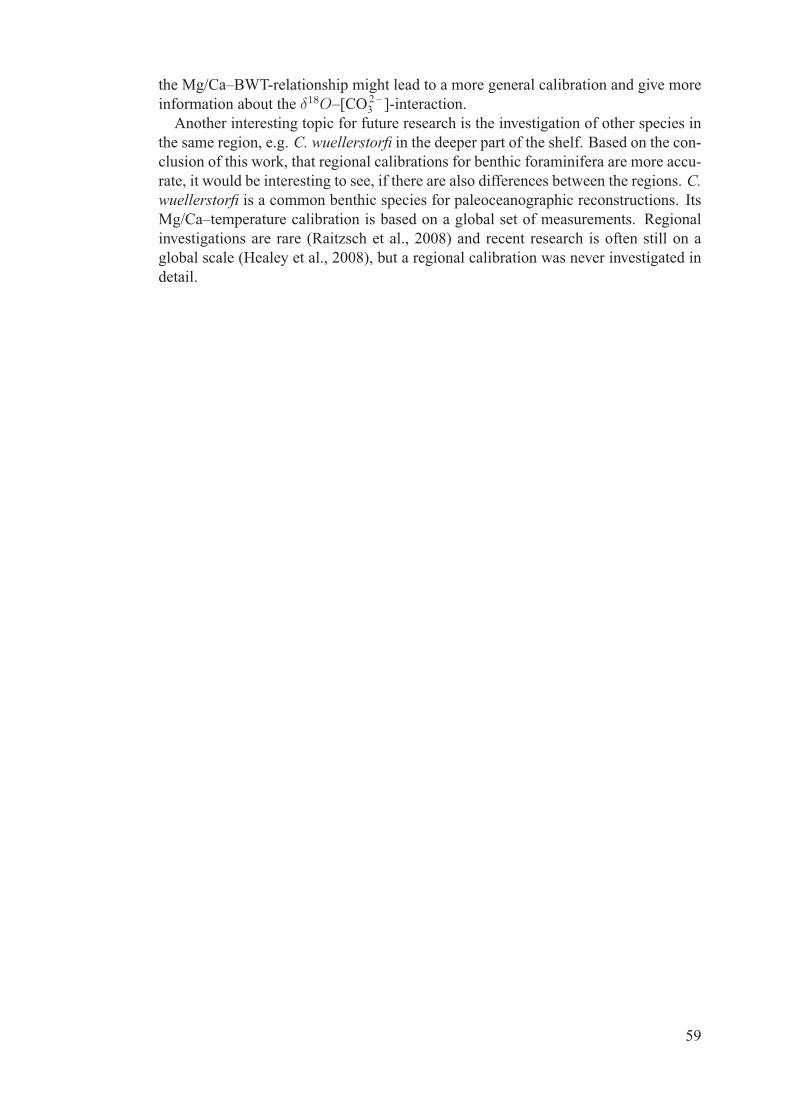
the Mg/Ca–BWT-relationship might lead to a more general calibration and give moreinformation about the δ18O–[CO2–3 ]-interaction.Another interesting topic for future research is the investigation of other species in
the same region, e.g. C. wuellerstorfi in the deeper part of the shelf. Based on the con-clusion of this work, that regional calibrations for benthic foraminifera are more accu-rate, it would be interesting to see, if there are also differences between the regions. C.wuellerstorfi is a common benthic species for paleoceanographic reconstructions. ItsMg/Ca–temperature calibration is based on a global set of measurements. Regionalinvestigations are rare (Raitzsch et al., 2008) and recent research is often still on aglobal scale (Healey et al., 2008), but a regional calibration was never investigated indetail.
59

5. Conclusions and Outlook
60
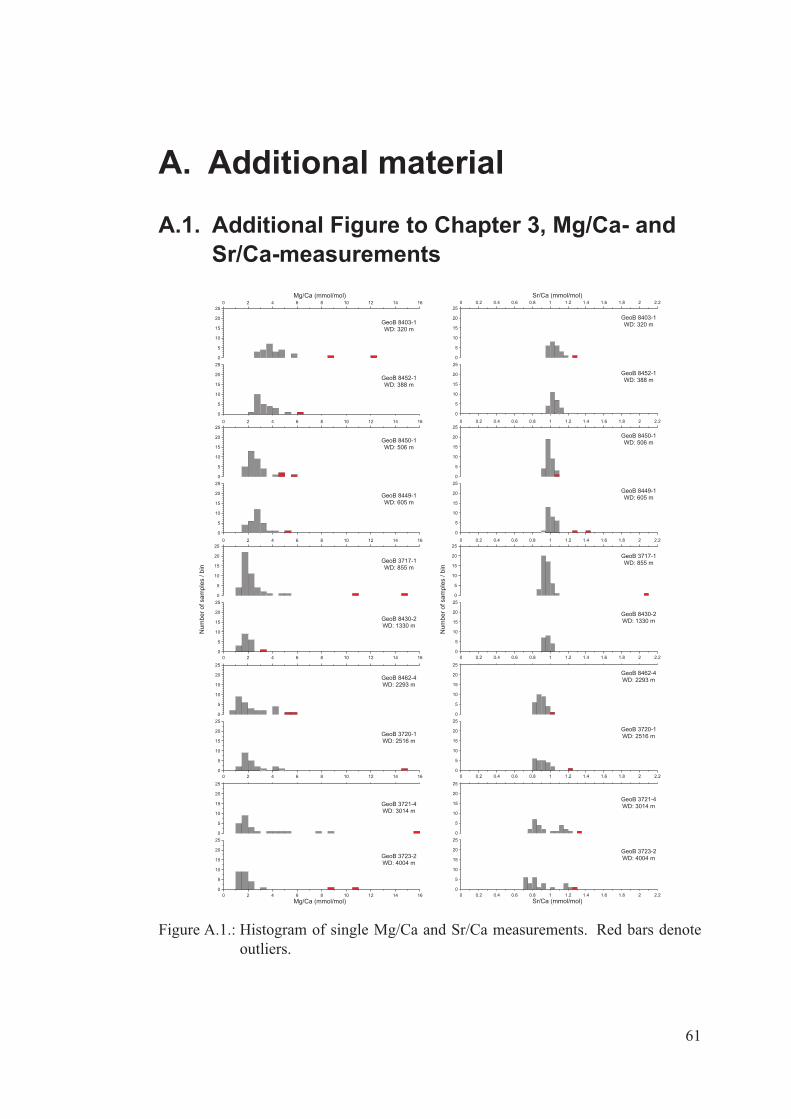
A. Additional material
A.1. Additional Figure to Chapter 3, Mg/Ca- andSr/Ca-measurements
Figure A.1.: Histogram of single Mg/Ca and Sr/Ca measurements. Red bars denoteoutliers.
61
A. Additional material
A.2. Additional Material to Chapter 3, stableisotope measurements
To investigate the potential impact of laser ablation on the stable isotopic composition(for example, due to fractionation in the vapour and subsequent condensation on thesample), we additionally measured fresh (not ablated) sample splits for M57/2. Eachof these parallel splits consisted of five tests. Shells that have been subject to laser ab-lation tend to have marginally lighter isotopic values within the analytical uncertainty(Figure A.2). This suggests that laser ablation does not induce significant artefactsin the remaining shell material (for example, through preferential evaporation of iso-topically lighter and condensation of isotopically heavier material). Our approach ofanalyzing the elemental and isotopic compositions on the same foraminiferal tests istherefore valid.
Figure A.2.: Comparison of stable isotope measurements of previously ablated testand fresh tests.
62
B. ReferencesAlibert, C. and M. T. McCulloch (1997). Strontium/calcium ratios in modern Poritescorals from the Great Barrier Reef as a proxy for sea surface temperature: Cal-ibration of the thermometer and monitoring of ENSO. Paleoceanography 12(3),345–364.
Anand, P. and H. Elderfield (2005). Variability of Mg/Ca and Sr/Ca betweenand within the planktonic foraminifers Globigerina bulloides and Globoro-talia truncatulinoides. Geochem. Geophys. Geosys. 6(11), Q11D11, doi:10.1029/2004GC000811.
Anand, P., H. Elderfield, and M. Conte (2003). Calibration of Mg/Ca thermometryin planktonic foraminifera from a sediment trap time series. Paleoceanography 18,doi:10.1029/2002PA000846.
Arai, T., T. Hirata, and Y. Takagi (2006). Application of laser ablation ICPMS to tracethe environmental history of chum salmon Oncorhynchus keta. Mar. Env. Res. 63,55–66.
Archer, D., S. Emerson, and C. E. Reimers (1989). Dissolution of calcite in deep-sea sediments: pH and O2 microelectrode results. Geochim. Cosmochim. Acta 53,2831–2845.
Barker, S., I. Cacho, H. Benway, and K. Tachikawa (2005). Planktonic foraminiferalMg/Ca as a proxy for past oceanic temperatures: a mehodological overview anddata compilation for the Last Glacial Maximum. Quat. Sci. Rev. 24, 821–834.
Barker, S., M. Greaves, and H. Elderfield (2003). A study of cleaning proceduresused for foraminiferal Mg/Ca paleothermometry. Geochem. Geophys. Geosys. 4(9),8407, doi:10.1029/2003GC000559.
Bauch, D., H. Erlenkeuser, G. Winckler, G. Pavlova, and J. Thiede (2002). Carbon iso-topes and habitat of polar planktic foraminifera in the Okhotsk Sea: The ’carbonateion effect’ under natural conditions. Mar. Micropal. 45, 83–99.
Beck, J. W., R. L. Edwards, E. Ito, F. W. Taylor, J. Recy, F. Rougerie, P. Joannot, andC. Henin (1992). Sea-surface temperature from coral skeletal strontium/calciumratios. Science 257, 644–647.
Bernstein, R. E., P. R. Betzer, R. A. Feely, R. H. Byrne, M. Lamb, and A. F. Michaels(1987). Acantharian Fluxes and Strontium to Chlorinity Ratios in the North PacificOcean. Science 237, 1490–1494.
63
B. References
Billups, K. and D. P. Schrag (2003). Application of benthic foraminiferal Mg/Ca ratiosto questions of Cenozoic climate change. Earth Planet. Sci. Lett. 209, 181–195.
Bleil, U. and cruise participants (1996). Report and preliminary results of ME-TEOR Cruise M34/1, Cape Town – Walvis Bay, 03.01.1996 – 26.01.1996. Num-ber 77 in Berichte aus dem Fachbereich Geowissenschaften. Fachbereich Geowis-senschaften, Universitat Bremen.
Bleil, U. and cruise participants (2004). Report and preliminary results of ME-TEOR Cruise M58/2, Las Palmas – Las Palmas (Canary Islands, Spain), 15.05.– 08.06.2003. Number 227 in Berichte aus dem Fachbereich Geowissenschaften.Fachbereich Geowissenschaften, Universitat Bremen.
Boyle, E. and J. Erez (2003). Does carbonate ion influence foraminiferal Mg/Ca?Ocean Sci. Meet. Suppl. AGU 84, Abstract OS21G–01.
Boyle, E. A. and L. D. Keigwin (1985). Comparison of Atlantic and Pacific paleo-chemical records for the last 250,000 years: Changes in deep ocean circulation andchemical inventories. Earth Planet. Sci. Lett. 76, 135–150.
Broecker, W. S. and T.-H. Peng (1982). Tracers in the Sea. Lamont-Doherty Geolog-ical Observatory, Columbia University, Palisades, New York.
Brown, S. J. and H. Elderfield (1996). Variations in Mg/Ca and Sr/Ca ratios of plank-tonic foraminifera caused by postdepositional dissolution: Evidence of shallowMg-dependent dissolution. Paleoceanography 11, 543–551.
CLIMAP-Project Members (1981). Seasonal Reconstruction of the Earth’s Surface atthe last Glacial Maximum. Geol. Soc. Amer. Map Chart Ser. MC-36, 1–18.
Conkright, M. E., R. A. Locarnini, H. E. Garcia, T. D. O’Brien, T. P. Boyer,C. Stephens, and J. I. Antonov (2002).World OceanAtlas 2001: Objective Analyses,Data Statistics, and Figures, CD-ROM Documentation. National OceanographicData Center, Silver Spring, MD.
Corliss, B. H. (1985). Microhabitats of benthic foraminifera within deep-sea sedi-ments. Nature 314, 435–438.
Corliss, B. H. (1991). Morphology and microhabitat preferences of benthicforaminifera from the northwest Atlantic Ocean. Mar. Micropal. 17, 195–236.
De Deckker, P., A. R. Chivas, and J. M. G. Shelley (1999). Uptake of Mg and Sr in theeuryhaline ostracod Cyprideis determined from in vitro experiments. Palaeogeogr.,Palaeoclim., Palaeoecol. 148, 105–116.
de Villiers, S. (1999). Seawater strontium and Sr/Ca variability in the Atlantic andPacific oceans. Earth Planet. Sci. Lett. 171, 623–634.
Dekens, P. S., D. W. Lea, D. K. Pak, and H. J. Spero (2002). Core top calibration ofMg/Ca in tropical foraminifera: Refining paleotemperature estimation. Geochem.Geophys. Geosys. 3(4), 10.1029/2001GC000200.
64
B. References
Dickson, A. G. (1990). Standard potential of the reaction: AgCl(s) + 1/2 H2(g) =Ag(’s’) + HCl(aq), and the standard acidity constant of the ion HSO−4 in syntheticseawater from 273.15 to 318.15 K. J. Chem. Thermodyn. 22, 113–127.
Eggins, S., P. De Deckker, and J. Marshall (2003). Mg/Ca variation in planktonicforaminifera tests: implications for reconstructing paleo-seawater temperature andhabitat migration. Earth Planet. Sci. Lett. 212, 291–306.
Eggins, S. M., A. Sadekov, and P. De Deckker (2004). Modulation and daily bandingof Mg/Ca in Orbulina universa tests by symbiont photosynthesis and respiration: acomplication for seawater thermometry? Earth Planet. Sci. Lett. 225, 411–419.
Elderfield, H. and G. Ganssen (2000). Past temperature and δ18O of surface oceanwaters inferred from foraminiferal Mg/Ca ratios. Nature 405, 442–445.
Elderfield, H., J. Yu, P. Anand, T. Kiefer, and B. Nyland (2006). Calibrations forbenthic foraminiferal Mg/Ca paleothermometry and the carbonate ion hypothesis.Earth Plant. Sci. Lett. 250(3-4), 633–649.
Emiliani, C. (1955). Pleistocene temperatures. J. Geol. 63, 538–578.
Epple, V. M. (2004). High-resolution climate reconstruction for the Holocene basedon growth chronologies of the bivalve Arctica islandica from the North Sea. Ph. D.thesis, University Bremen.
Epstein, S., R. Buchsbaum, H. A. Lowenstam, and U. H. C. (1953). Revisedcarbonate-water isotopic temperature scale. Bull. Geol. Soc. Amer. 64, 1315–1325.
Fairbanks, R. G. (1989). A 17,000-year glacio-eustatic sea level record: influenceof glacial melting rates on the Younger Dryas event and deep-ocean circulation.Nature 342, 637–642.
Fallon, S. J., M. T. McCulloch, R. van Woesik, and D. J. Sinclair (1999). Coralsat their latitudinal limits: laser ablation trace element systematics in Porites fromShirigai Bay, Japan. Earth Planet. Sci. Lett. 172(3-4), 221–238.
Fehrenbacher, J., P. A. Martin, and G. Eshel (2006). Glacial deep watercarbonate chemistry inferred from foraminiferal Mg/Ca: A case study fromthe western tropical Atlantic. Geochem. Geophys. Geosys. 7(9), Q09P16,doi:10.1029/2005GC001156.
Felis, T., G. Lohmann, H. Kuhnert, S. J. Lorenz, D. Scholz, J. Patzold, S. A. Al-Rousan, and S. M. Al-Moghrabi (2004). Increased seasonality in Middle East tem-peratures during the last interglacial period. Nature 429, 164–168.
Fennel, W. (1999). Theory of the Benguela upwelling system. J. Phys. Oceanogr. 29,177–190.
Fischer, G., P. J. Muller, and G.Wefer (1998). Latitudinal δ13Corg variations in sinkingmatter and sediments from the South Atlantic: Effects of anthropogenic CO2 andimplications for paleo-PCO2 reconstructions. J. Mar. Syst. 17, 471–495.
65
B. References
Fischer, G. and G. Wefer (Eds.) (1999). Use of Proxies in Paleoceanography: Exam-ples from the South Atlantic. Springer Verlag Berlin Heidelberg.
Giraudeau, J., G. W. Bailey, and C. Pujol (2000). A high-resolution time-series analy-ses of particle fluxes in the Northern Benguela coastal upwelling system: Carbonaterecord of changes in biogenic production and particle transfer processes. Deep SeaRes., Part II 47, 1999–2028.
Gooday, A. J. (1994). The biology of deep-sea foraminifera: a review of some ad-vances and their applications in paleoceanography. Palaios 9, 14–31.
Hales, B. and S. Emerson (1996). Calcite dissolution in sediments of the Ontong-Java Plateau: In situ measurements of pore water O2 and pH. Global Biogeochem.Cycles 10(3), 527–541.
Harriss, R. C. and C. C. Almy (1964). A preliminary investigation into the incorpora-tion of minor elements into skeletal material of scleractinian corals. Bull. Mar. Sci.Caribb. 14, 418–423.
Hathorne, E. C., O. Alard, R. H. James, and N. W. Rogers (2003). Determinationof intratest variability of trace elements in foraminifera by laser ablation induc-tively coupled plasma-mass spetrometry. Geochem. Geophys. Geosys. 4(12), 8408,doi:10.1029/2003GC000539.
Healey, S. L., R. C. Thunell, and B. H. Corliss (2008). The Mg/Ca-temperature re-lationship of benthic foraminiferal calcite: New core-top calibrations in the < 4◦Ctemperature range. Earth Planet. Sci. Lett. 272, 523–530.
Hensen, C., H. Landenberger, M. Zabel, and H. D. Schulz (1998). Quantification ofdiffusive benthic fluxes of nitrate, phosphate, and silicate in the southern AtlanticOcean. Global Biogeochem. Cycles 12(1), 193–210.
Hensen, C., M. Zabel, and H. D. Schulz (2000). A comparison of benthic nutrientfluxes from deep-sea sediments off Namibia and Argentina. Deep-Sea Res. II 47,2029–2050.
Houghton, J. T., Y. Ding, D. J. Griggs, M. Noguer, P. J. van der Linden, and D. Xiaosu(2001). Climate Change 2001: The Scientific Basis. Technical report, CambridgeUniversity Press.
Houghton, J. T., L. G. Meira Filho, B. A. Callander, N. Harris, A. Kattenberg, andK. Maskell (1995). Climate Change 1995 - The Science of Climate Change. Tech-nical report, Cambridge University Press.
Johnson, G. C. and M. J. McPhaden (1999). Interior pycnocline flow from the Sub-tropical to the Equatorial Pacific Ocean. J. Phys. Oceanogr. 29(12), 3073–3089.
Karstensen, J. and D. Quadfasel (2002). Water subducted into the Indian Ocean sub-tropical gyre. Deep-Sea Res. II 49, 1441–1457.
66
B. References
Katz, A. (1973). The interaction of magnesium with calcite during crystal growth at25− 90◦C and one atmosphere. Geochim. Cosmochim. Acta 37, 1563–1578.
Katz, A., E. Sass, A. Starinsky, and H. D. Holland (1972). Strontium behavior inthe aragonite-calcite transformation: An experimental study at 40-98°C. Geochim.Cosmochim. Acta 36, 481–496.
Key, R. M.and Kozyr, A., C. L. Sabine, K. Lee, R. Wanninkhof, J. L. Bullister, R. A.Feely, F. J. Millero, C. Mordy, and T.-H. Peng (2004). A global ocean carbonclimatology: Results from GlobalData Analysis Project (GLODAP). Global Bio-geochem. Cycl. 18, GB4031, doi:10.1029/2004GB002247.
Kinsman, D. J. J. (1969). Interpretation of Sr2+ concentrations in carbonate mineralsand rocks. J. Sedim. Petrol. 39, 486–508.
Lea, D., D. Pak, and H. Spero (2000). Climate impact of late quaternary equatorialPacific sea surface temperature variations. Science 289, 1719–1724.
Lea, D. W. (1999). Trace elements in foraminiferal calcite. In B. K. Sen Gupta (Ed.),Modern Foraminifera, pp. 259–277. Kluwer Academic Publishers.
Lea, D. W., T. A. Mashiotta, and H. J. Spero (1999). Controls on magnesium andstrontium uptake in planktonic foraminifera determined by live culturing. Geochim.Cosmochim. Acta 63(16), 2369–2379.
Lear, C. H., H. Elderfield, and P. A. Wilson (2000). Cenocoic Deep-Sea Temperaturesand Global Ice Volumes fromMg/Ca in Benthic Foraminiferal Calcite. Science 287,269–272.
Lear, C. H., Y. Rosenthal, and N. Slowey (2002). Benthic foraminiferal Mg/Ca-paleothermometry: A revised core-top calibration. Geochim. Cosmochim.Acta 66(19), 3375–3387.
Levitus, S. and T. P. Boyer (1994). World Ocean Atlas 1994, Vol. 4: Temperature.NOAA Atlas NESDIS 4. U.S. Gov. Printing Office, Washington, D.C.
Lewis, E. and D. W. R. Wallace (1998). Program developed for CO2 system calcula-tions, ORNL/CDIAC-105. Carbon Dioxide Information Analysis Center, Oak RidgeNational Laboratory, U.S. Department of Energy, Oak Ridge, Tennessee.
Lutjeharms, J. R. E. and J. M. Meeuwis (1987). The extent and variability of south-east Atlantic upwelling. S. Afr. J. Mar. Sci. 5, 51–62.
Lutjeharms, J. R. E. and P. L. Stockton (1987). Kinematics of the upwelling front offsouthern Africa. S. Afr. J. Mar. Sci. 5, 35–49.
Lutze, G. F. and H. Thiel (1989). Epibenthic foraminifera from elevated microhabitats:Cibicidoides wuellerstorfi and Planulina arimiensis. J. Foraminiferal Res. 19, 153–158.
Luyten, J. R., J. Pedlosky, and H. Stommel (1983). The ventilated thermocline. J.Phys. Oceanogr. 13(2), 292–309.
67
B. References
Lynch-Stieglitz, J., W. B. Curry, D. W. Oppo, U. S. Ninneman, C. D. Charles,and J. Munson (2006). Meridional overturning circulation in the South At-lantic at the last glacial maximum. Geochem. Geophys, Geosys. 7, Q10N03,doi:10.1029/2005GC001226.
Mackensen, A. and T. Bickert (1999). Stable Carbon Isotopes in Benthic Foraminifera:Proxies for Deep and Bottom Water Circulation and New Production. In G. Fischerand G.Wefer (Eds.),Use of Proxies in Paleoceanography: Examples from the SouthAtlantic, pp. 229–254. Springer Verlag Berlin Heidelberg.
Malone, M. J. and P. A. Baker (1999). Temperature dependence of the strontiumdistribution coefficient in calcite: An experimental study from 400 to 2000C andapplication to natural diagenetic calcites. J. Sed. Res. 69(1), 216–223.
Martin, P. A. and D. W. Lea (2002). A simple evaluation of cleaning procedureson fossil benthic foraminiferal Mg/Ca. Geochem. Geophys. Geosys. 3(10), 8401,doi:10.1029/2001GC000280.
Martin, P. A., D. W. Lea, T. A. Mashiotta, T. Papenfuss, and M. Sarnthein (1999).Variation on foraminiferal Sr/Ca over Quaternary glacial-interglacial cycles: Ev-idence for changes in mean ocean Sr/Ca? Geochem. Geophys. Geosys. 1(1),doi:10.1029/1999GC000006.
Martin, P. A., D. W. Lea, Y. Rosenthal, N. J. Shackleton, M. Sarnthein, and T. Pa-penfuss (2002). Quaternary deep sea temperature histories derived from benthicforaminiferal Mg/Ca. Earth Planet. Sci. Lett. 198, 193–209.
McCorkle, D. C., L. D. Keigwin, B. H. Corliss, and S. R. Emerson (1990). Theinfluence of microhabitats on the carbon isotopic composition of deep-sea benthicforaminifera. Paleoceanography 5(2), 161–185.
McCorkle, D. C., P. A. Martin, D. W. Lea, and G. P. Klinkhammer (1995). Evidence ofa dissolution effect on benthic foraminiferal shell chemistry: δ13C, Cd/Ca, Ba/Ca,and Sr/Ca results from the Ontong Java Plateau. Paleoceanography 10(4), 699–714.
McCrea, J. M. (1950). On the isotopic chemistry of carbonates and a paleotemperaturescale. J. Chem. Phys. 18, 849–857.
Meggers, H. and cruise participants (2002). Report of RV POSEIDONCruise POS272,Las Palmas – Las Palmas, 1.4. – 14.4.2001. Number 197 in Berichte aus dem Fach-bereich Geowissenschaften. Fachbereich Geowissenschaften, Universitat Bremen.
Muller, A. (2000). Mg/Ca und Sr/Ca-Verhaltnisse in biogenem Carbonat planktis-cher Foraminiferen und benthischer Ostracoden, Volume 313 of Berichte aus demInstitut fur Meereskunde. Institut fur Meereskunde, Kiel.
Mollenhauer, G., M. Kienast, F. Lamy, H. Meggers, R. R. Schneider, J. M. Hays, andT. I. Eglinton (2005). An evaluation of 14C age relationships between co-occuringforaminifera, alkenones, and total organic carbon in continental margin sediments.Paleoceanography 20, PA1016, doi:10.1029/2004PA001103.
68
B. References
Moorholz, V. and T. Heene (2003a). CTD-Probe and Water Sampling. In M. Zabel(Ed.), Report and prelimiary results of METEOR Cruise M 57/2, Walvis Bay -Walvis Bay, 11.02.-12.03.2003, pp. 34–35. Fachbereich Geowissenschaften, Uni-versitat Bremen.
Moorholz, V. and T. Heene (2003b). Hydrographic studies. In M. Zabel (Ed.), Reportand prelimiary results of METEOR Cruise M 57/2, Walvis Bay - Walvis Bay, 11.02.-12.03.2003, pp. 129–133. Fachbereich Geowissenschaften, Universitat Bremen.
Morishita, T., A. Tsurumi, and T. Kamiya (2007). Magnesium and strontium distribu-tions within valves of a recent marine ostracode, Neonesidea oligodentata: Impli-cations for paleoenvironmental reconstructions. Geochem. Geophys. Geosys. 8(7),Q07009, doi:10.1029/2007GC001585.
Mortyn, P., H. Elderfield, P. Anand, and M. Greaves (2005). An evaluation of con-trols on planktonic foraminiferal Sr/Ca: Comparison of water column and core-topdata from a North Atlantic transect. Geochem. Geophys. Geosyst. 6(12), Q12007,doi:10.1029/2005GC001047.
Mulitza, S., H. Arz, S. K. von Mucke, C. Moos, H.-S. Niebler, J. Patzold, and M. Segl(1999). The South Atlantic Carbon Isotope Record of Planktic Foraminifera. InG. Fischer and G. Wefer (Eds.), Use of Proxies in Paleoceanography: Examplesfrom the South Atlantic, pp. 427–445. Springer Verlag Berlin Heidelberg.
Mulitza, S. and A. Paul (2003). Water sampling for Stable Isotopes and NutrientAnalysis. In M. Zabel (Ed.), Report and preliminary results of METEOR CruiseM 57/2, Walvis Bay – Walvis Bay, 11.02.–12.02.2003, pp. 35–37. Fachbereich Ge-owissenschaften, Universitat Bremen.
Niebler, H.-S., H. W. Arz, B. Donner, S. Mulitza, J. Patzold, and G. Wefer(2003). Sea surface temperatures in the equatorial and South Atlantic Oceanduring the Last Glacial Maximum (23–19 ka). Paleoceanography 18(3), 1069,doi:10.1029/2003PA000902.
Nurnberg, D., J. Bijma, and C. Hemleben (1996). Assessing the reliability of mag-nesium in foraminiferal calcite as a proxy for water mass temperatures. Geochim.Cosmochim. Acta 60, 803–814.
Okai, T., A. Suzuki, H. Kawahata, S. Terashima, and N. Imai (2002). Preparation ofa new Geological Survey of Japan geochemical reference material: Coral JCp-1.Geostand. Newsletter 25, 95–99.
Oomori, T., H. Kaneshima, Y. Maezato, and Y. Kitano (1987). Distribution coefficientof Mg2+ ions between calcite and solution at 10− 50◦C. Mar. Chem. 20, 327–336.
Paul, A., S. Mulitza, J. Patzold, and T. Wolff (1999). Simulation of Oxygen Isotopesin a Global Ocean Model. In G. Fischer and G. Wefer (Eds.), Use of Proxies in Pa-leoceanography: Examples from the South Atlantic, pp. 655–686. Springer VerlagBerlin Heidelberg.
69
B. References
Paul, A. and C. Schafer-Neth (2003). Modeling the water masses of the At-lantic Ocean at the Last Glacial Maximum. Paleoceanography 18(3), 1058,doi:10.1029/2002PA000783.
Pearce, N. J. G., W. T. Perkins, J. A. Westgate, M. P. Gorton, S. E. Jackson, C. L. Neal,and S. P. Chenery (1997). A compilation of new and published major and traceelement data for NIST SRM 610 and NIST SRM 612 glass reference materials.Geostand. Newsletter 21, 115–144.
Pfeifer, K., C. Hensen, M. Adler, F. Wenzhofer, B. Weber, and H. D. Schulz (2002).Modeling of subsurface calcite dissolution, including the respiration and reoxida-tion processes of marine sediments in the region of equatorial upwelling off Gabon.Geochim. Cosmochim. Acta 66(24), 4247–4259.
Raitzsch, M., H. Kuhnert, J. Groeneveld, and T. Bickert (2008). Benthicforaminifer Mg/Ca anomalies in South Atlantic core top sediments and theirimplications for paleothermometry. Geochem. Geophys. Geosys. 9, Q05010,doi:10.1029/2007GC001788.
Rathburn, A. E. and B. H. Corliss (1994). The ecology of living (stained) deep-seabenthic foraminifera from the Sulu Sea. Paleoceanography 9, 87–150.
Rathburn, A. E. and P. De Deckker (1997). Magnesium and strontium composition ofRecent benthic foraminifera from the Coral Sea, Australia and Prydz Bay, Antartica.Mar. Micropal. 32, 231–248.
Rathmann, S., S. Hess, H. Kuhnert, and S. Mulitza (2004). Mg/Ca ratios of thebenthic foraminifera Oridorsalis umbonatus obtained by laser ablation from coretop sediments: Relationship to bottom water temperature. Geochem. Geophys.Geosyst. 5(12), Q12013, doi:10.1029/2004GC000808.
Rathmann, S. and H. Kuhnert (2008). Carbonate ion effect on Mg/Ca, Sr/Ca andstable isotopes on the benthic foraminifera Oridorsalis umbonatus off Namibia.Mar. Micropal. 66, 120–133.
Reichart, G.-J., F. Jorissen, P. Anschutz, and P. R. D. Mason (2003). Singleforaminifera test chemistry records the marine environment. Geology 31(4), 355–358.
Romanek, C. S., E. L. Grossmann, and J. W. Morse (1992). Carbon isotopic fractiona-tion in synthetic aragonite and calcite: effects of temperature and precipitation rate.Geochim. Cosmochim. Acta 56, 419–430.
Romero, O., G. Mollenhauer, R. R. Schneider, and G. Wefer (2003). Oscillation of thesiliceous imprint in the central Benguela Upwelling System from MIS 3 through tothe early Holocene: the influence of the Southern Ocean. J. Quat. Sci. 18(8), 733–743.
Rosenthal, Y., E. A. Boyle, and N. Slowey (1997). Temperature control on the incor-poration of magnesium, strontium, fluorine and cadmium into benthic foraminiferal
70
B. References
shells from Little Bahama Bank: Prospects for thermocline paleoceanography.Geochim. Cosmochim. Acta 61(17), 3633–3643.
Rosenthal, Y., C. H. Lear, D. W. Oppo, and B. K. Linsley (2006). Tempera-ture and carbonate ion effect on Mg/Ca and Sr/Ca ratios in benthic foraminifera:Aragonitic species Hoeglundina elegans. Paleoceanography 21, PA1007,doi:10.1029/2005PA001158.
Rosenthal, Y., S. Peeron-Cashman, C. H. Lear, E. Bard, S. Barker, K. Billups,M. Bryan, M. L. Delaney, P. B. deMenocal, G. S. Dwyer, H. Elderfield, C. R.German, M. Greaves, D. W. Lea, T. M. M. Jr., D. K. Pak, G. L. Paradis, A. D. Rus-sel, R. R. Schneider, K. Scheiderich, L. Stott, K. Tachikawa, E. Tappa, R. Thunell,M. Wara, S. Weldeab, and P. A. Wilson (2004). Interlaboratory comparison study ofMg/Ca and Sr/Ca measurements in planktonic foraminifera for paleoceanographicresearch. Geochem. Geophys. Geosys. 5(4), Q04D09, doi:10.1029/203GC000650.
Roy, R. N., L. N. Roy, K. M. Vogel, C. Porter-Moore, T. Pearson, C. E. Good, F. J.Millero, and D. M. Campbell (1993). The dissociation constants of carbonic acid inseawater at salinities 5 to 45 and temperatures 0 to 450C. Mar. Chem. 44, 249–267.
Roy, R. N., L. N. Roy, K. M. Vogel, C. Porter-Moore, T. Pearson, C. E. Good, F. J.Millero, and D. M. Campbell (1994). Erratum. Mar. Chem. 45, 337.
Roy, R. N., L. N. Roy, K. M. Vogel, C. Porter-Moore, T. Pearson, C. E. Good, F. J.Millero, and D. M. Campbell (1996). Erratum. Mar. Chem. 52, 183.
Russell, A., B. Honisch, H. Spero, and D. Lea (2004). Effects of seawater carbonateion concentration and temperature on shell U, Mg, and Sr in cultured planktonicforaminifera. Geochim. Cosmochim. Acta 68, 4347–4361.
Russell, A. D. and H. J. Spero (2000, February). Field examination of the oceaniccarbonate ion effect on stable isotopes in planktonic foraminifera. Paleoceanogra-phy 15(1), 43–52.
Schafer-Neth, C., A. Paul, and S. Mulitza (2005). Perspectives on mapping theMARGO reconstructions by variogram analysis/kriging and objective analysis.Quat. Sci. Rev. 24, 1083–1093.
Schmiedl, G. (1995). Late Quaternary benthic foraminiferal assemblages from theeastern South Atlantic Ocean: Reconstruction of deep water circulation and pro-ductivity changes. Technical report, Alfred Wegener Institute for Polar and MarineResearch. pp. 207.
Schmiedl, G., A. Mackensen, and P. J. Muller (1997). Recent benthic foraminiferafrom the eastern South Atlantic Ocean: Dependence on food supply and watermasses. Mar. Micropal. 32, 249–287.
Schulz, H. D. and cruise participants (1996). Report and preliminary results of ME-TEOR Cruise M34/2, Walvis Bay – Walvis Bay, 29.01.1996 – 18.02.1996. Num-ber 78 in Berichte aus dem Fachbereich Geowissenschaften. Fachbereich Geowis-senschaften, Universitat Bremen.
71
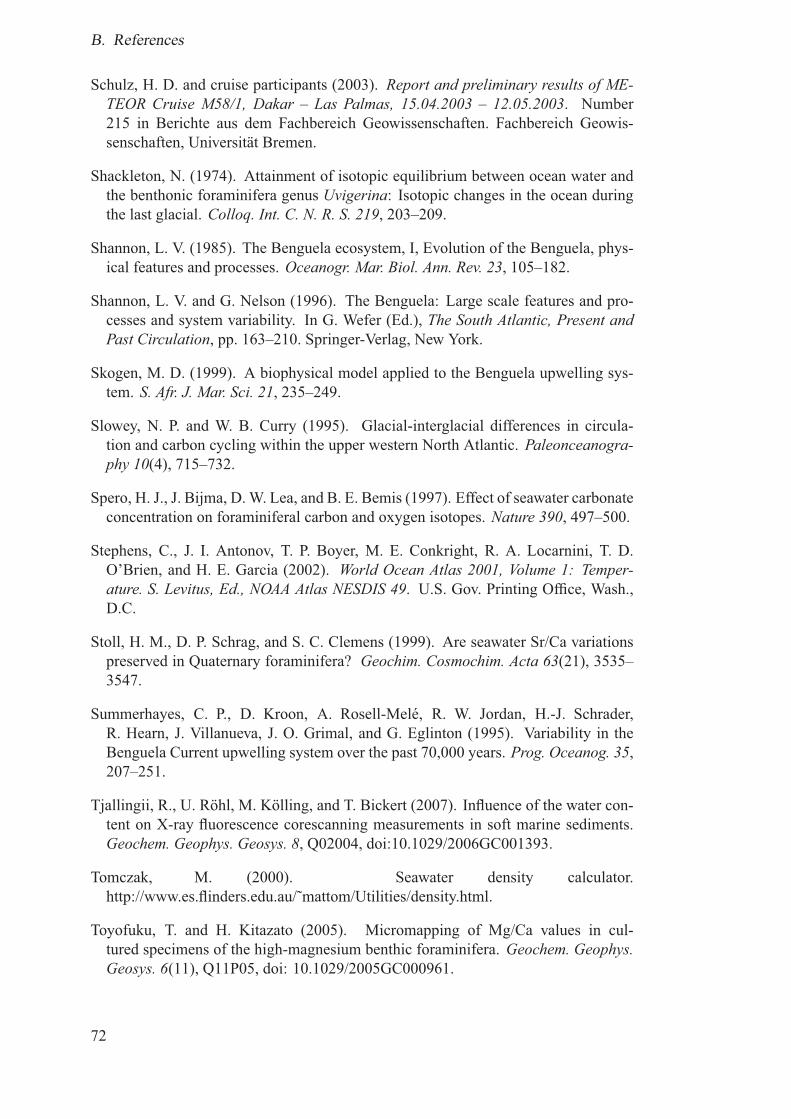
B. References
Schulz, H. D. and cruise participants (2003). Report and preliminary results of ME-TEOR Cruise M58/1, Dakar – Las Palmas, 15.04.2003 – 12.05.2003. Number215 in Berichte aus dem Fachbereich Geowissenschaften. Fachbereich Geowis-senschaften, Universitat Bremen.
Shackleton, N. (1974). Attainment of isotopic equilibrium between ocean water andthe benthonic foraminifera genus Uvigerina: Isotopic changes in the ocean duringthe last glacial. Colloq. Int. C. N. R. S. 219, 203–209.
Shannon, L. V. (1985). The Benguela ecosystem, I, Evolution of the Benguela, phys-ical features and processes. Oceanogr. Mar. Biol. Ann. Rev. 23, 105–182.
Shannon, L. V. and G. Nelson (1996). The Benguela: Large scale features and pro-cesses and system variability. In G. Wefer (Ed.), The South Atlantic, Present andPast Circulation, pp. 163–210. Springer-Verlag, New York.
Skogen, M. D. (1999). A biophysical model applied to the Benguela upwelling sys-tem. S. Afr. J. Mar. Sci. 21, 235–249.
Slowey, N. P. and W. B. Curry (1995). Glacial-interglacial differences in circula-tion and carbon cycling within the upper western North Atlantic. Paleonceanogra-phy 10(4), 715–732.
Spero, H. J., J. Bijma, D.W. Lea, and B. E. Bemis (1997). Effect of seawater carbonateconcentration on foraminiferal carbon and oxygen isotopes. Nature 390, 497–500.
Stephens, C., J. I. Antonov, T. P. Boyer, M. E. Conkright, R. A. Locarnini, T. D.O’Brien, and H. E. Garcia (2002). World Ocean Atlas 2001, Volume 1: Temper-ature. S. Levitus, Ed., NOAA Atlas NESDIS 49. U.S. Gov. Printing Office, Wash.,D.C.
Stoll, H. M., D. P. Schrag, and S. C. Clemens (1999). Are seawater Sr/Ca variationspreserved in Quaternary foraminifera? Geochim. Cosmochim. Acta 63(21), 3535–3547.
Summerhayes, C. P., D. Kroon, A. Rosell-Mele, R. W. Jordan, H.-J. Schrader,R. Hearn, J. Villanueva, J. O. Grimal, and G. Eglinton (1995). Variability in theBenguela Current upwelling system over the past 70,000 years. Prog. Oceanog. 35,207–251.
Tjallingii, R., U. Rohl, M. Kolling, and T. Bickert (2007). Influence of the water con-tent on X-ray fluorescence corescanning measurements in soft marine sediments.Geochem. Geophys. Geosys. 8, Q02004, doi:10.1029/2006GC001393.
Tomczak, M. (2000). Seawater density calculator.http://www.es.flinders.edu.au/˜mattom/Utilities/density.html.
Toyofuku, T. and H. Kitazato (2005). Micromapping of Mg/Ca values in cul-tured specimens of the high-magnesium benthic foraminifera. Geochem. Geophys.Geosys. 6(11), Q11P05, doi: 10.1029/2005GC000961.
72
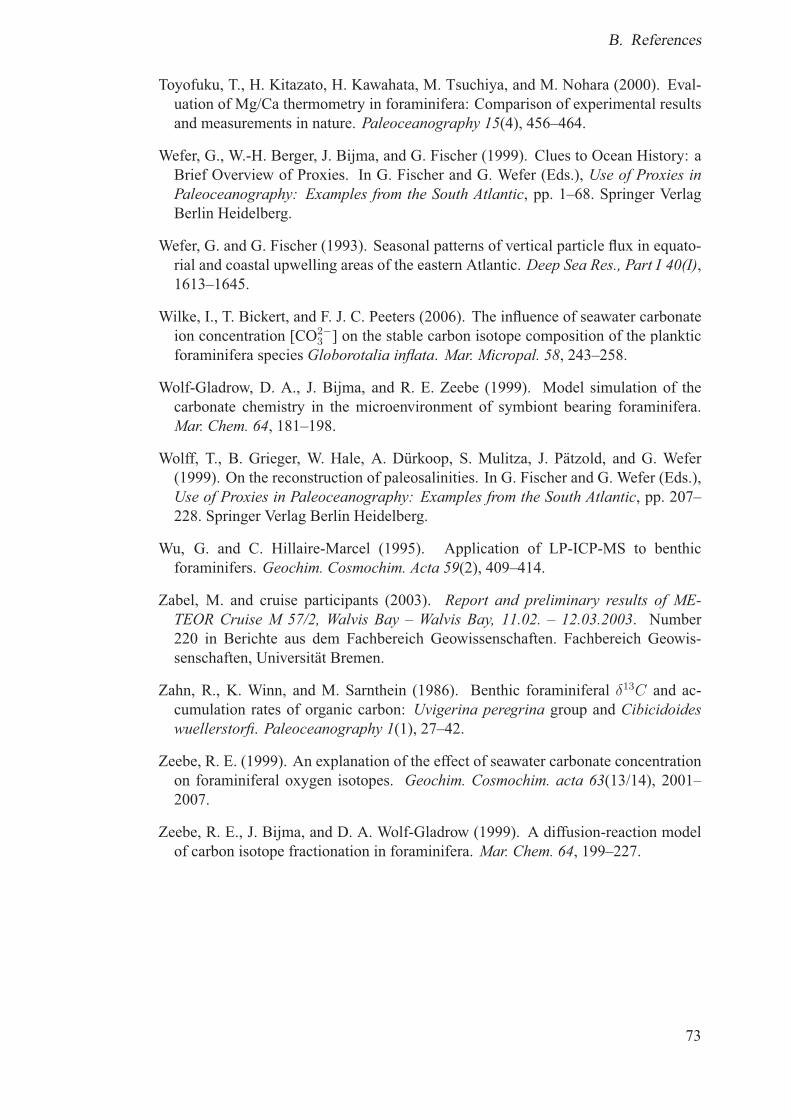
B. References
Toyofuku, T., H. Kitazato, H. Kawahata, M. Tsuchiya, and M. Nohara (2000). Eval-uation of Mg/Ca thermometry in foraminifera: Comparison of experimental resultsand measurements in nature. Paleoceanography 15(4), 456–464.
Wefer, G., W.-H. Berger, J. Bijma, and G. Fischer (1999). Clues to Ocean History: aBrief Overview of Proxies. In G. Fischer and G. Wefer (Eds.), Use of Proxies inPaleoceanography: Examples from the South Atlantic, pp. 1–68. Springer VerlagBerlin Heidelberg.
Wefer, G. and G. Fischer (1993). Seasonal patterns of vertical particle flux in equato-rial and coastal upwelling areas of the eastern Atlantic. Deep Sea Res., Part I 40(I),1613–1645.
Wilke, I., T. Bickert, and F. J. C. Peeters (2006). The influence of seawater carbonateion concentration [CO2−
3 ] on the stable carbon isotope composition of the plankticforaminifera species Globorotalia inflata. Mar. Micropal. 58, 243–258.
Wolf-Gladrow, D. A., J. Bijma, and R. E. Zeebe (1999). Model simulation of thecarbonate chemistry in the microenvironment of symbiont bearing foraminifera.Mar. Chem. 64, 181–198.
Wolff, T., B. Grieger, W. Hale, A. Durkoop, S. Mulitza, J. Patzold, and G. Wefer(1999). On the reconstruction of paleosalinities. In G. Fischer and G. Wefer (Eds.),Use of Proxies in Paleoceanography: Examples from the South Atlantic, pp. 207–228. Springer Verlag Berlin Heidelberg.
Wu, G. and C. Hillaire-Marcel (1995). Application of LP-ICP-MS to benthicforaminifers. Geochim. Cosmochim. Acta 59(2), 409–414.
Zabel, M. and cruise participants (2003). Report and preliminary results of ME-TEOR Cruise M 57/2, Walvis Bay – Walvis Bay, 11.02. – 12.03.2003. Number220 in Berichte aus dem Fachbereich Geowissenschaften. Fachbereich Geowis-senschaften, Universitat Bremen.
Zahn, R., K. Winn, and M. Sarnthein (1986). Benthic foraminiferal δ13C and ac-cumulation rates of organic carbon: Uvigerina peregrina group and Cibicidoideswuellerstorfi. Paleoceanography 1(1), 27–42.
Zeebe, R. E. (1999). An explanation of the effect of seawater carbonate concentrationon foraminiferal oxygen isotopes. Geochim. Cosmochim. acta 63(13/14), 2001–2007.
Zeebe, R. E., J. Bijma, and D. A. Wolf-Gladrow (1999). A diffusion-reaction modelof carbon isotope fractionation in foraminifera. Mar. Chem. 64, 199–227.
73


![[SHIMADZU] 島津製作所 · cc-ms cv-aas, cv-afs, icp-oes, icp-ms, aas pbb/pbde cr(vl) pb/cd icp-oes. icp-ms icp-oes. icp-ms, icp-oes, icp-ms, cc-ms aas cv-aas aas : aas . - icp-oes](https://static.fdocument.pub/doc/165x107/602bef1d6551697710154f3f/shimadzu-eoe-cc-ms-cv-aas-cv-afs-icp-oes-icp-ms-aas-pbbpbde-crvl.jpg)