Kobe University Repository : Kernelgroundwaters have been analyzed extensively (e.g., BGS/ DPHE,...
10
Kobe University Repository : Kernel タイトル Title Geochemical study of major and trace elements in the arsenic contaminated groundwaters in Bangladesh 著者 Author(s) Asagoe, Yuma / Terakado, Yasutaka / Kishibe, Katsuya / Nasher, N. M. Refat 掲載誌・巻号・ページ Citation 神戸大学大学院人間発達環境学研究科研究紀要,10(2):141-149 刊行日 Issue date 2017-03-30 資源タイプ Resource Type Departmental Bulletin Paper / 紀要論文 版区分 Resource Version publisher 権利 Rights DOI JaLCDOI URL http://www.lib.kobe-u.ac.jp/handle_kernel/E0041234 PDF issue: 2020-10-23
Transcript of Kobe University Repository : Kernelgroundwaters have been analyzed extensively (e.g., BGS/ DPHE,...
Kobe University Repository : Kernel
タイトルTit le
Geochemical study of major and trace elements in the arseniccontaminated groundwaters in Bangladesh
著者Author(s)
Asagoe, Yuma / Terakado, Yasutaka / Kishibe, Katsuya / Nasher, N. M.Refat
掲載誌・巻号・ページCitat ion 神戸大学大学院人間発達環境学研究科研究紀要,10(2):141-149
刊行日Issue date 2017-03-30
資源タイプResource Type Departmental Bullet in Paper / 紀要論文
版区分Resource Version publisher
権利Rights
DOI
JaLCDOI
URL http://www.lib.kobe-u.ac.jp/handle_kernel/E0041234
PDF issue: 2020-10-23

(141)
- -141
神戸大学大学院人間発達環境学研究科 研究紀要 第10巻 第2号 2017
Bulletin of Graduate School of Human Development and Environment, Kobe University, Vol.10 No.2 2017REPORT
* Graduate School of Human Development and Environment, Kobe University (Received September 30, 2016Accepted October 31, 2016)
1. Introduction
Arsenic (As) is known as a strong toxic element affecting
nearly all organ systems especially causing dermal effects.
Before 1960’s, people in Bangladesh mainly had utilized the
river water, but it was significantly contaminated with bacte-
ria. As a result, infant mortality was high (Smith et al.,
2000), and the Bangladesh government encouraged the use of
groundwater to improve mortality. Before 1970’s, arsenic
contamination had not been found in Bangladesh, because ar-
senic was not included in water quality inspection items.
Since 1970’s, arsenic contamination problem in the Bangla-
desh and west Bengal areas has received attention and many
investigations have been performed (e.g., BGS/DPHE, 2001;
Ravenscfort et al., 2009). At present, the guideline value for
arsenic in drinking water in Bangladesh is 50 ppb, although
the value of WHO is 10 ppb (UNICEF, 2010; WHO, 2011). It
has been pointed out that about 50% of Bangladesh wells con-
tain more than 10 ppb arsenic and 28% contain more than 50
ppb arsenic (Yu et al., 2003).
The concentrations of arsenic and major elements in
groundwaters have been analyzed extensively (e.g., BGS/
DPHE, 2001). From the geological and geochemical view-
points, mechanisms of arsenic contaminated groundwaters are
interesting, and some genetic models have been proposed: for
example, arsenic bearing sulfide oxidation, arsenic adsorbed
ferric oxyhydroxides dissolution under reducing condition,
alkaline desorption, and contribution of geothermal waters
(e.g., Ranenscroft et al., 2009). In the previous studies, the
positive tendency between arsenic and iron and the negative
tendency between arsenic and sulfate were reported for several
high arsenic areas in Bangladesh (BGS/DPHE, 2001). The
positive tendency between arsenic and iron was considered as
reflecting congruent dissolution of iron oxides and the associ-
ated release of arsenic under the reducing conditions (BGS/
DPHE, 2001). The negative tendency between arsenic and sul-
fate was interpreted by strong reduction of sulfate in the for-
mation processes of high arsenic concentration groundwaters
(BGS/DPHE, 2001). These observations may support the re-
ductive dissolution of ferric oxyhydroxides, but both observed
correlations are not enough clear, and correlations between
arsenic and other elements such as manganese, phosphorus,
and bicarbonate are ambiguous (BGS/DPHE, 2001). There-
fore, more investigations are necessary.
Mineralogical studies on the sediments from the arsenic
contaminated areas have shown that Fe-oxides and Fe-hy-
droxides and pyrite are the most important arsenic adsorbent
minerals (Ravenscroft et al., 2009). Contrary to the water
sample cases, the clear positive correlations between iron and
arsenic concentrations in the sediments of the contaminated
areas were pointed out (BGS/DPHE, 2001), suggesting the re-
Abstract:Major and some trace elements including rare earth element (REE) in 15 groundwater samples collected from
Bangladesh were analyzed to examine the formation mechanisms of arsenic contaminated groundwaters using the
relationships among chemical elements. Several features were observed: (1) the positive tendency between arsenic and
iron, (2) the negative tendency between arsenic and sulfate, (3) relatively high barium and low REE concentrations.
These observations are consistent with the reductive dissolution of ferric oxyhydroxides. Moreover, it was considered
that the contrasting positive and negative relationships between Fe and other elements such as As, Mn, Ba, and REE
are reconciled by different adsorption ability of ferric hydroxides for these elements.
Geochemical study of major and trace elements in the arsenic
contaminated groundwaters in Bangladesh
Yuma ASAGOE*, Yasutaka TERAKADO*, Katsuya KISHIBE* and N. M. Refat NASHER*
(142)
- -142
ductive dissolution of ferric oxyhydroxides. However, the re-
lease mechanisms of arsenic from arsenic contained sediment
to groundwater are not completely understood due to the
complex relationships among arsenic and major component
concentrations.
The previous geochemical studies have been performed
mainly on the basis of major element concentrations, but some
trace elements such as rare earth elements (REE) have not
been investigated. It is known that REEs have unique chemi-
cal characteristics and their abundances are considered to re-
flect redox conditions of groundwaters. In oxidizing condi-
tions, Ce(III) is expected to be oxidized to Ce(IV), being
precipitated as CeO2. Therefore, the abundance of Ce ion in
water sample may decrease relative to the other trivalent
REEs, and negative Ce anomaly should be seen in the REE
pattern. Thus REE data might be a useful tool for redox con-
ditions, but REE data on the Bangladesh groundwaters have
not been reported.
In this study, we analyzed major and some trace elements
including REE of 15 Bangladesh groundwater samples collect-
ed near Dhaka City. The purpose of the study is to reveal the
relationships among the chemical elements and to discuss the
formation mechanisms of the arsenic contaminated ground-
waters in Bangladesh.
2. Samples and analytical methods
The samples used were collected near Dhaka city, Bangla-
desh, during March 6 to March 7, 2015 in addition to those
collected in early January, 2015 for the previous study (Ter-
akado et al., 2015). The sampling points are shown in Fig. 1-A
and 1-B. The pH measurements were made on-site using un-
filtered water with a pH meter (PH-6011A CUSTOM) calibrat-
ed with pH 7 and pH 4 standard solutions. The waters were
filtered using 0.45 µm membrane filter, and were stored in
polyethylene bottles which were washed by using boiled hy-
drochloric acid and boiled distilled water. The depths were
heard from people around the wells.
The sample bottles were transported to the laboratory in
Kobe University within about 10 days. The samples for meas-
urement of anion concentrations and alkalinity were frozen as
soon as possible after the arrival. The samples for major cati-
on and REE measurements, pure hydrochloric acid were added
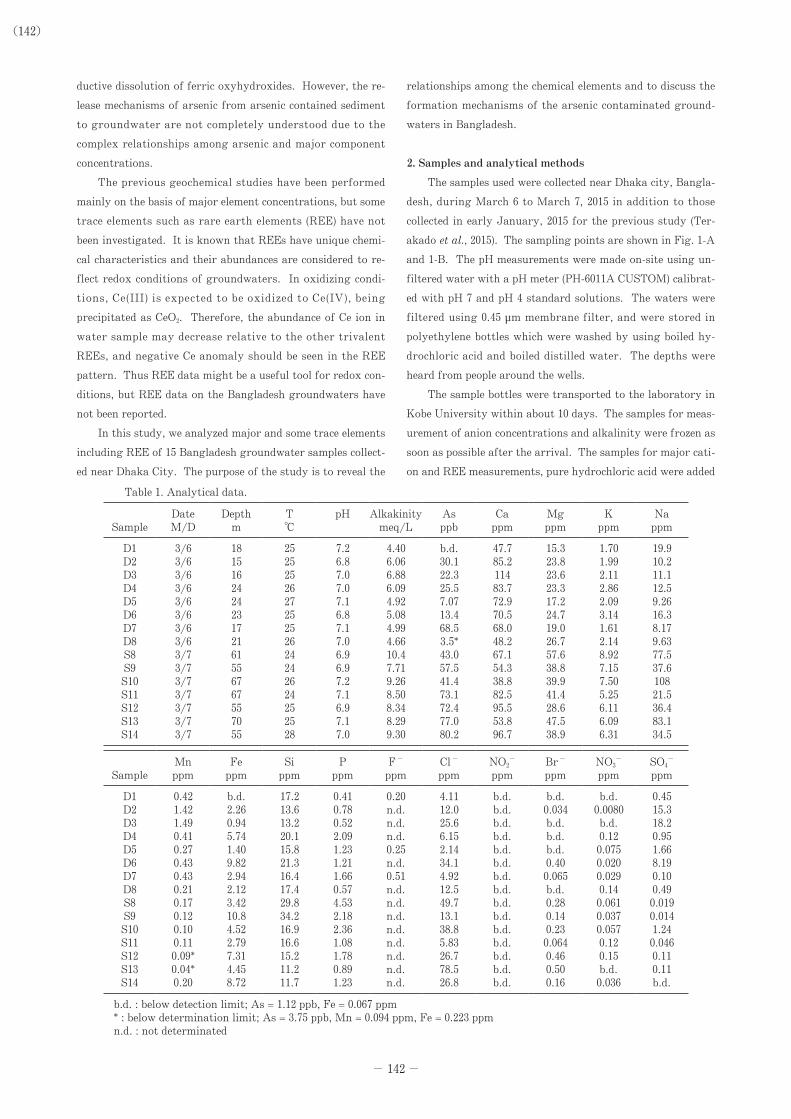
Table 1. Analytical data.
Date Depth T pH Alkakinity As Ca Mg K NaSample M/D m ℃ meq/L ppb ppm ppm ppm ppm
D1 3/6 18 25 7.2 4.40 b.d. 47.7 15.3 1.70 19.9D2 3/6 15 25 6.8 6.06 30.1 85.2 23.8 1.99 10.2D3 3/6 16 25 7.0 6.88 22.3 114 23.6 2.11 11.1D4 3/6 24 26 7.0 6.09 25.5 83.7 23.3 2.86 12.5D5 3/6 24 27 7.1 4.92 7.07 72.9 17.2 2.09 9.26D6 3/6 23 25 6.8 5.08 13.4 70.5 24.7 3.14 16.3D7 3/6 17 25 7.1 4.99 68.5 68.0 19.0 1.61 8.17D8 3/6 21 26 7.0 4.66 3.5* 48.2 26.7 2.14 9.63S8 3/7 61 24 6.9 10.4 43.0 67.1 57.6 8.92 77.5S9 3/7 55 24 6.9 7.71 57.5 54.3 38.8 7.15 37.6S10 3/7 67 26 7.2 9.26 41.4 38.8 39.9 7.50 108S11 3/7 67 24 7.1 8.50 73.1 82.5 41.4 5.25 21.5S12 3/7 55 25 6.9 8.34 72.4 95.5 28.6 6.11 36.4S13 3/7 70 25 7.1 8.29 77.0 53.8 47.5 6.09 83.1S14 3/7 55 28 7.0 9.30 80.2 96.7 38.9 6.31 34.5
Mn Fe Si P F- Cl- NO2- Br- NO3
- SO4-
Sample ppm ppm ppm ppm ppm ppm ppm ppm ppm ppm
D1 0.42 b.d. 17.2 0.41 0.20 4.11 b.d. b.d. b.d. 0.45D2 1.42 2.26 13.6 0.78 n.d. 12.0 b.d. 0.034 0.0080 15.3D3 1.49 0.94 13.2 0.52 n.d. 25.6 b.d. b.d. b.d. 18.2D4 0.41 5.74 20.1 2.09 n.d. 6.15 b.d. b.d. 0.12 0.95D5 0.27 1.40 15.8 1.23 0.25 2.14 b.d. b.d. 0.075 1.66D6 0.43 9.82 21.3 1.21 n.d. 34.1 b.d. 0.40 0.020 8.19D7 0.43 2.94 16.4 1.66 0.51 4.92 b.d. 0.065 0.029 0.10D8 0.21 2.12 17.4 0.57 n.d. 12.5 b.d. b.d. 0.14 0.49S8 0.17 3.42 29.8 4.53 n.d. 49.7 b.d. 0.28 0.061 0.019S9 0.12 10.8 34.2 2.18 n.d. 13.1 b.d. 0.14 0.037 0.014S10 0.10 4.52 16.9 2.36 n.d. 38.8 b.d. 0.23 0.057 1.24S11 0.11 2.79 16.6 1.08 n.d. 5.83 b.d. 0.064 0.12 0.046S12 0.09* 7.31 15.2 1.78 n.d. 26.7 b.d. 0.46 0.15 0.11S13 0.04* 4.45 11.2 0.89 n.d. 78.5 b.d. 0.50 b.d. 0.11S14 0.20 8.72 11.7 1.23 n.d. 26.8 b.d. 0.16 0.036 b.d.
b.d. : below detection limit; As = 1.12 ppb, Fe = 0.067 ppm* : below determination limit; As = 3.75 ppb, Mn = 0.094 ppm, Fe = 0.223 ppmn.d. : not determinated

(143)
- -143
and stored at room temperature.
Alkalinity was measured by titration using 0.02 N sulfuric
acid to pH 4.8. The anion concentrations (F -, Cl -, NO2-, Br -,
NO3-, and SO4
2-) were analyzed by ion chromatograph with
Hitachi HPLC system. The cation concentrations (Ca, Mg, K,
Na, Fe, and Mn) were measured by flame atomic absorption
method using Sr to suppress chemical interferences on Hitachi
Z-2010. Si and P were analyzed by ICP optical emission spec-
trometry with Shimadzu ICPS-1000IV. Total inorganic arse-
nic concentrations were measured by hydride generation
atomic absorption spectrometry using a hydride generator
HYD-10 (Nippon Jarrell Ash Co., Japan) with the atomic ab-
sorption spectrometer. Potassium iodide solution (50wt.%)
was used to reduce arsenate to arsenite, and sodium borohy-
dride (2.5wt.%) was used to generate arsenic hydride.
REEs and Ba were measured by mass-spectrometric iso-
tope dilution using a thermal ionization mass-spectrometer
(JEOL JMS-05RB). Using one litter sample, the REE were
firstly coprecipitated with ferric hydroxide, and light, middle,
and heavy REEs were separated by cation exchange column
(e.g., Masuda and Ikeuchi, 1979). To avoid Ba interference in
La measurements, nitric acid was used for elution (e.g., Jahn
et al., 1980).
3. Results
The obtained data in the present study are listed in Table
1 and 2. The temperature and pH values of all the samples fall
within narrow ranges of 24-28℃ and 6.8-7.2, respectively. The
alkalinity values of the western samples (D1~D8) range from
4.40 to 6.88 meq/L, whereas those of the southern ones (S8~
S14) range from 7.71 to 10.4 meq/L. The arsenic concentra-
tions of the western samples (D1-D8) range from 3.5 ppb to
68.5 ppb, while those of the southern ones (S8~S14) range
from 41.4 ppb to 80.2 ppb.
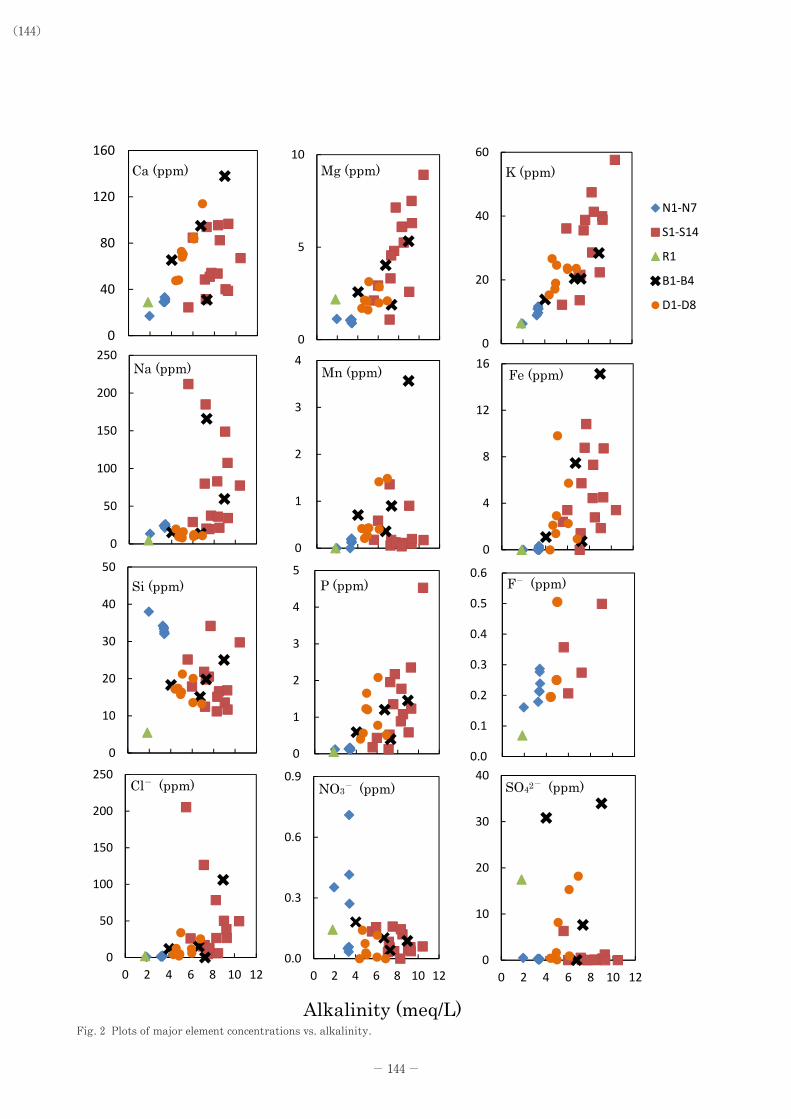
The relationships between alkalinity and some measured
elements are plotted in Fig. 2 together with the previously ob-
tained data. Broad positive correlations are seen for Mg, K,
and F-. As for Ca, Mn, Fe and P plots, lack of relatively high
values for relatively low alkalinity range shows positive ten-
dency. Similarly, lack of relatively high values for relatively
low alkalinity range suggests negative tendency for the NO3-
plot.
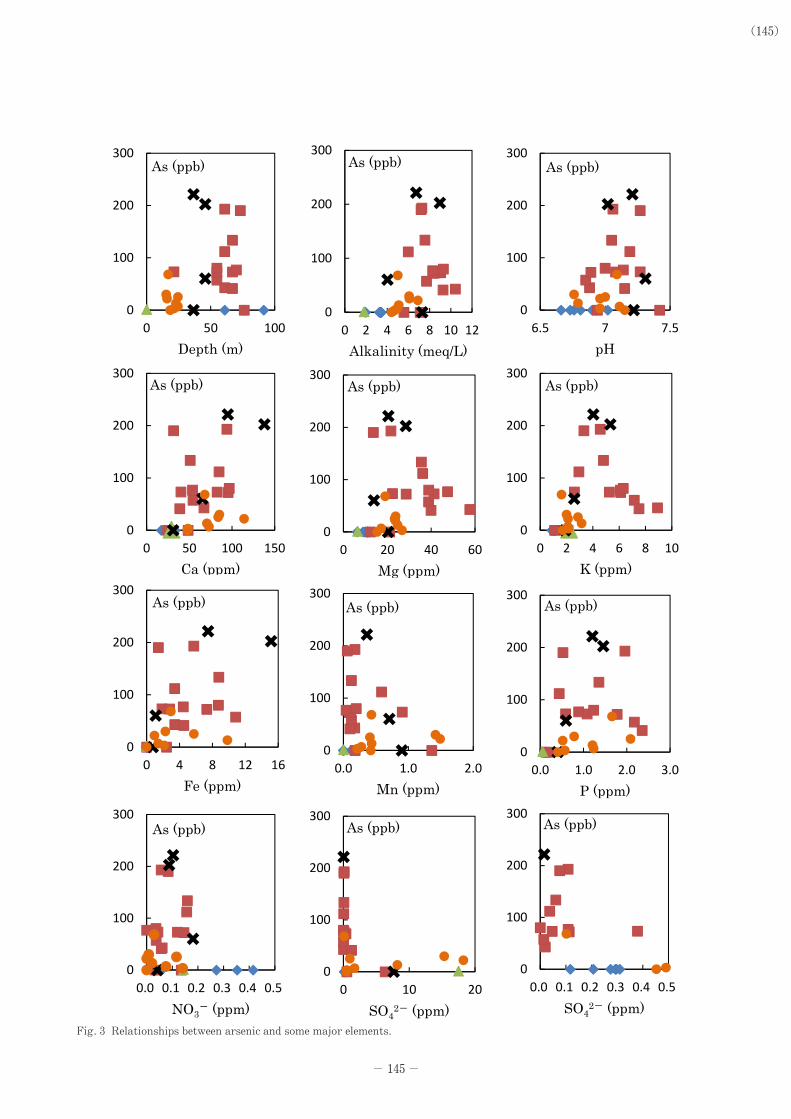
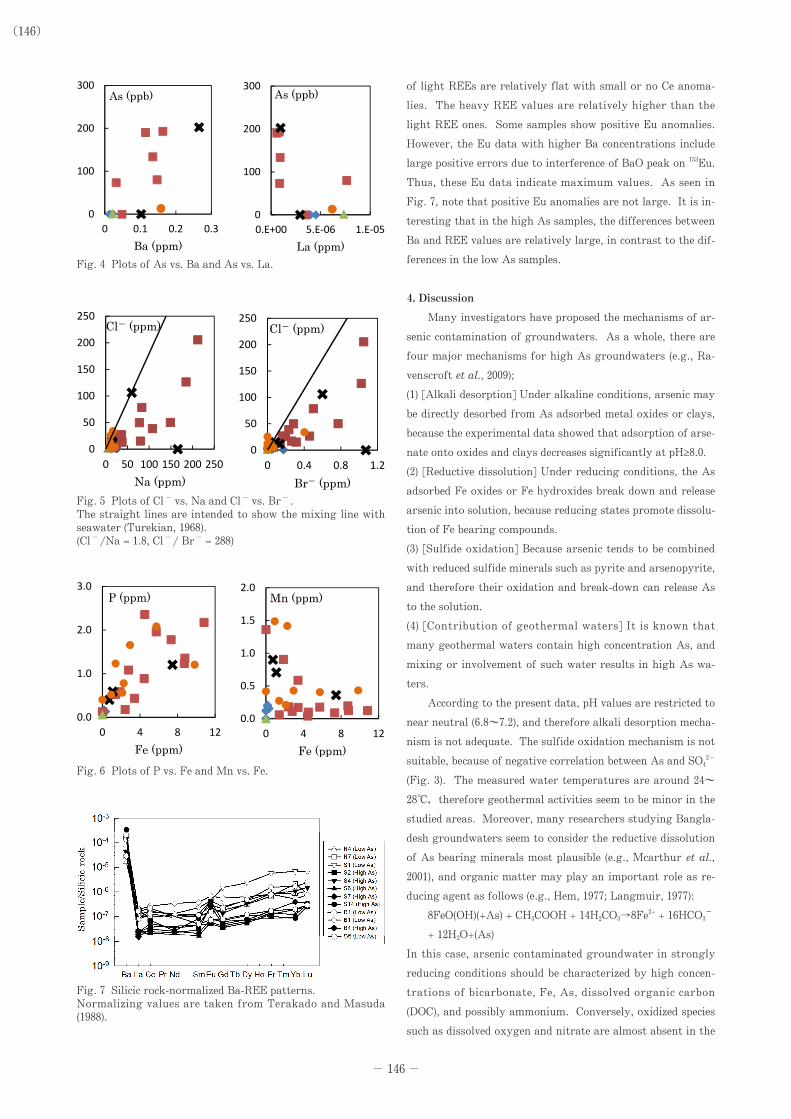
In Fig. 3 and Fig. 4, the relationships between As and
other elements are rather ambiguous, but weak negative cor-
relations can be seen for As-Mn, As-NO3-, As-SO4
2- and As-La
(REE). In Fig. 5, Cl--Na and Cl--Br- relationships show posi-
tive correlations, but most data points deviate from the sea-
water lines. In Fig. 6, P-Fe and Mn-Fe data are plotted. The
P-Fe data show positive correlation, whereas Mn-Fe show
negative tendency.
The REE patterns normalized to silicic rock average are
shown in Fig. 7 together with the Ba data. The REE patterns
Table 2. Analytical data of Ba and REEs.
Ba La Ce Nd Sm Eu Gd Dy Er Yb LuSample ppm ppm ppm ppm ppm ppm ppm ppm ppm ppm ppm
N4 0.013 4.51E-06 1.24E-05 3.41E-06 6.87E-07 3.97E-07 1.15E-06 1.89E-06 2.11E-06 1.89E-06 3.77E-07N7 0.021 3.97E-06 6.94E-06 3.42E-06 5.53E-07 1.47E-07 8.47E-07 1.30E-06 1.59E-06 4.84E-06 3.05E-07S1 0.048 3.49E-06 1.11E-05 3.87E-06 1.23E-06 4.00E-07 6.84E-06 1.01E-05 1.34E-05 1.58E-05 2.35E-06S2 0.135 9.03E-07 2.73E-06 n.d. 2.38E-07 4.80E-08 1.62E-07 2.25E-07 2.93E-07 4.43E-07 8.70E-08S4 0.032 8.64E-07 3.76E-06 9.84E-07 2.38E-07 2.21E-07 6.30E-07 1.36E-06 2.02E-06 2.44E-06 5.33E-07S6 0.163 8.23E-07 1.57E-06 n.d. 9.20E-08 5.37E-08 1.91E-07 2.57E-07 3.40E-07 2.73E-07 1.07E-07S7 0.115 5.72E-07 2.24E-06 n.d. 1.13E-07 7.15E-08 2.86E-07 3.05E-07 n.d. 2.16E-07 n.d.S14 0.147 7.63E-06 5.00E-06 7.76E-07 4.41E-07 3.89E-07 3.08E-07 4.62E-07 2.47E-07 1.92E-07 9.37E-08R1 0.022 7.33E-06 1.93E-05 1.00E-05 2.07E-06 6.33E-07 2.57E-06 2.66E-06 1.86E-06 1.19E-06 2.68E-07B1 0.102 2.92E-06 9.55E-06 2.65E-06 6.20E-07 2.55E-07 1.03E-06 2.00E-06 3.60E-06 3.89E-06 8.48E-07B4 0.265 9.41E-07 1.78E-06 6.62E-07 1.58E-07 2.60E-07 2.27E-07 3.08E-07 4.08E-07 8.85E-07 1.21E-07D6 0.158 6.16E-06 1.58E-05 n.d. 2.67E-07 6.70E-08 3.65E-07 4.97E-07 4.11E-07 4.48E-07 1.02E-07
Fig. 1-A Map showing the position of Bangladesh in the south Asia region.
Asagoe et al.
Fig. 1-A Map showing the position of Bangladesh in the south Asia region. Fig. 1-B Map showing sampling points.
A
B
Fig. 1-B Map showing sampling points.
Asagoe et al.
Fig. 1-A Map showing the position of Bangladesh in the south Asia region. Fig. 1-B Map showing sampling points.
A
B
(144)
- -144
Fig. 2 Plots of major element concentrations vs. alkalinity.Asagoe et al.
Alkalinity (meq/L)
0
5
10
0 2 4 6 8 10 120
20
40
60
0 2 4 6 8 10 12
N1-N7
S1-S14
R1
B1-B4
D1-D8
0
40
80
120
160
0 2 4 6 8 10 12
Ca (ppm) Mg (ppm) K (ppm)
0
50
100
150
200
250
0 2 4 6 8 10 12
Na (ppm)
0
1
2
3
4
0 2 4 6 8 10 12
Mn (ppm)
0
4
8
12
16
0 2 4 6 8 10 12
Fe (ppm)
0
10
20
30
40
50
0 2 4 6 8 10 12
Si (ppm)
0
1
2
3
4
5
0 2 4 6 8 10 12
P (ppm)
0
50
100
150
200
250
0 2 4 6 8 10 120.0
0.3
0.6
0.9
0 2 4 6 8 10 12
Cl- (ppm) NO3- (ppm)
0.0
0.1
0.2
0.3
0.4
0.5
0.6
0.0 2.0 4.0 6.0 8.0 10.012.0
0
10
20
30
40
0 2 4 6 8 10 12
F- (ppm)
SO42- (ppm)
Fig. 2 Plots of major element concentrations vs. alkalinity.
(145)
- -145
Fig. 3 Relationships between arsenic and some major elements.
Asagoe et al.
0
100
200
300
0 50 100Depth (m)
0
100
200
300
6.5 7 7.5pH
0
100
200
300
0 50 100 150Ca (ppm)
0
100
200
300
0 2 4 6 8 10 12Alkalinity (meq/L)
0
100
200
300
0 20 40 60Mg (ppm)
0
100
200
300
0 2 4 6 8 10K (ppm)
0
100
200
300
0 4 8 12 16Fe (ppm)
0
100
200
300
0.0 1.0 2.0Mn (ppm)
0
100
200
300
0.0 1.0 2.0 3.0P (ppm)
0
100
200
300
0 10 20SO4
2- (ppm)
0
100
200
300
0.0 0.1 0.2 0.3 0.4 0.5SO4
2- (ppm)
As (ppb)
As (ppb)
As (ppb)
As (ppb) As (ppb) As (ppb)
As (ppb)
As (ppb) As (ppb)
As (ppb)
0
100
200
300
0.0 0.1 0.2 0.3 0.4 0.5NO3
- (ppm)
As (ppb)
As (ppb)
Fig. 3 Relationships between arsenic and some major elements.
(146)
- -146
of light REEs are relatively flat with small or no Ce anoma-
lies. The heavy REE values are relatively higher than the
light REE ones. Some samples show positive Eu anomalies.
However, the Eu data with higher Ba concentrations include
large positive errors due to interference of BaO peak on 153Eu.
Thus, these Eu data indicate maximum values. As seen in
Fig. 7, note that positive Eu anomalies are not large. It is in-
teresting that in the high As samples, the differences between
Ba and REE values are relatively large, in contrast to the dif-
ferences in the low As samples.
4. Discussion
Many investigators have proposed the mechanisms of ar-
senic contamination of groundwaters. As a whole, there are
four major mechanisms for high As groundwaters (e.g., Ra-
venscroft et al., 2009);
(1) [Alkali desorption] Under alkaline conditions, arsenic may
be directly desorbed from As adsorbed metal oxides or clays,
because the experimental data showed that adsorption of arse-
nate onto oxides and clays decreases significantly at pH≥8.0.
(2) [Reductive dissolution] Under reducing conditions, the As
adsorbed Fe oxides or Fe hydroxides break down and release
arsenic into solution, because reducing states promote dissolu-
tion of Fe bearing compounds.
(3) [Sulfide oxidation] Because arsenic tends to be combined
with reduced sulfide minerals such as pyrite and arsenopyrite,
and therefore their oxidation and break-down can release As
to the solution.
(4) [Contribution of geothermal waters] It is known that
many geothermal waters contain high concentration As, and
mixing or involvement of such water results in high As wa-
ters.
According to the present data, pH values are restricted to
near neutral (6.8~7.2), and therefore alkali desorption mecha-
nism is not adequate. The sulfide oxidation mechanism is not
suitable, because of negative correlation between As and SO42-
(Fig. 3). The measured water temperatures are around 24~
28℃,therefore geothermal activities seem to be minor in the
studied areas. Moreover, many researchers studying Bangla-
desh groundwaters seem to consider the reductive dissolution
of As bearing minerals most plausible (e.g., Mcarthur et al.,
2001), and organic matter may play an important role as re-
ducing agent as follows (e.g., Hem, 1977; Langmuir, 1977):
8FeO(OH)(+As) + CH3COOH + 14H2CO3→8Fe2+ + 16HCO3-
+ 12H2O+(As)
In this case, arsenic contaminated groundwater in strongly
reducing conditions should be characterized by high concen-
trations of bicarbonate, Fe, As, dissolved organic carbon
(DOC), and possibly ammonium. Conversely, oxidized species
such as dissolved oxygen and nitrate are almost absent in the
Fig. 4 Plots of As vs. Ba and As vs. La.
Asagoe et al.
Fig. 4 Plots of As vs. Ba and As vs. La.
0
100
200
300
0 0.1 0.2 0.3Ba (ppm)
As (ppb)
0
100
200
300
0.E+00 5.E-06 1.E-05La (ppm)
As (ppb)
Fig. 5 Plots of Cl- vs. Na and Cl- vs. Br- .The straight lines are intended to show the mixing line with seawater (Turekian, 1968).(Cl-/Na = 1.8, Cl-/ Br- = 288)
Asagoe et al.
0
50
100
150
200
250
0 50 100 150 200 250Na (ppm)
Cl- (ppm)
0
50
100
150
200
250
0 0.4 0.8 1.2Br- (ppm)
Cl- (ppm)
Fig. 5 Plots of Cl- vs. Na and Cl- vs. Br-. The straight lines are intended to show the mixing line with seawater (Turekian, 1968). (Cl-/Na = 1.8, Cl-/ Br- = 288)
Fig. 6 Plots of P vs. Fe and Mn vs. Fe.
Asagoe et al.
0.0
0.5
1.0
1.5
2.0
0 4 8 12Fe (ppm)
Mn (ppm)
0.0
1.0
2.0
3.0
0 4 8 12Fe (ppm)
P (ppm)
Fig. 6 Plots of P vs. Fe and Mn vs. Fe.
Fig. 7 Silicic rock-normalized Ba-REE patterns.Normalizing values are taken from Terakado and Masuda (1988).
Asagoe et al.
Fig. 7 Silicic rock-normalized Ba-REE patterns. Normalizing values are taken from Terakado and Masuda(1988).
(147)
- -147
aquifers, and sulfate concentrations are usually very low (Ra-
venscroft et al., 2009).
As for the present data, weak positive tendencies of As-Fe
and As-Alkalinity and broad negative correlations of As-NO3-
and As-SO42- are observed, which are consistent with the
characteristics of the reductive dissolution mechanism. Con-
sequently, the reductive dissolution mechanism seems to more
or less to be involved in the formation processes of the high As
groundwaters.
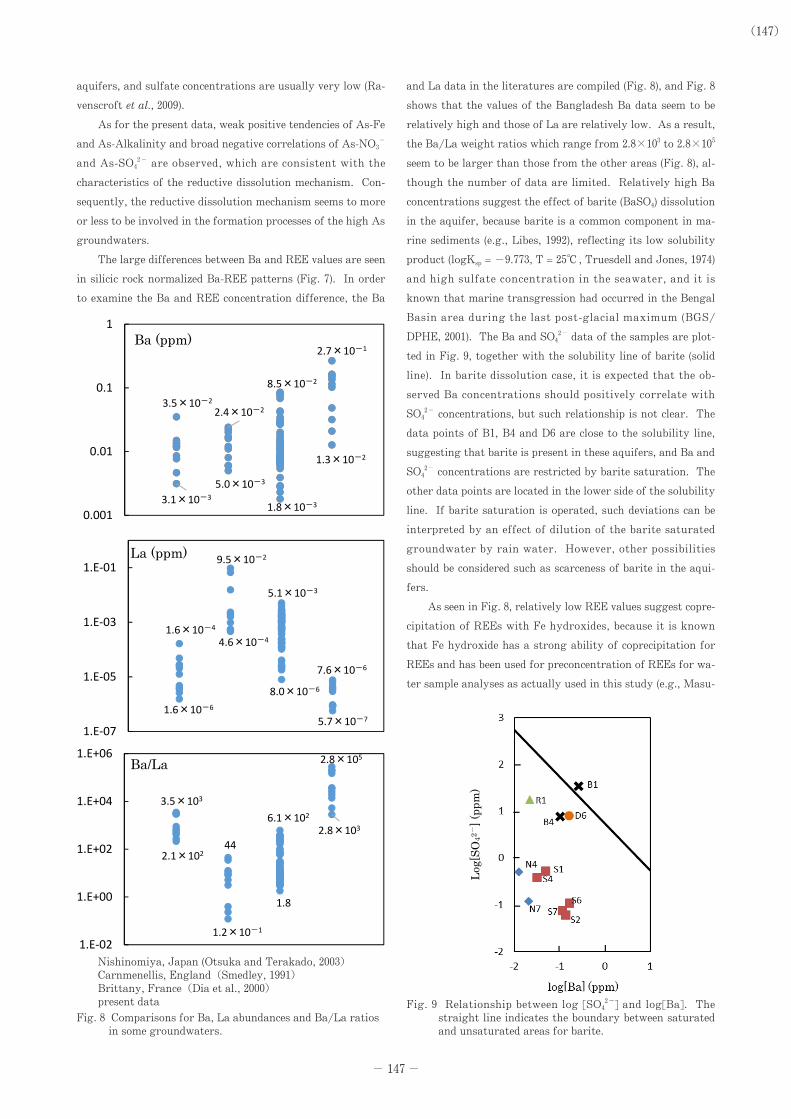
The large differences between Ba and REE values are seen
in silicic rock normalized Ba-REE patterns (Fig. 7). In order
to examine the Ba and REE concentration difference, the Ba
and La data in the literatures are compiled (Fig. 8), and Fig. 8
shows that the values of the Bangladesh Ba data seem to be
relatively high and those of La are relatively low. As a result,
the Ba/La weight ratios which range from 2.8×10³ to 2.8×10⁵
seem to be larger than those from the other areas (Fig. 8), al-
though the number of data are limited. Relatively high Ba
concentrations suggest the effect of barite (BaSO4) dissolution
in the aquifer, because barite is a common component in ma-
rine sediments (e.g., Libes, 1992), reflecting its low solubility
product (logKsp = -9.773, T = 25℃ , Truesdell and Jones, 1974)
and high sulfate concentration in the seawater, and it is
known that marine transgression had occurred in the Bengal
Basin area during the last post-glacial maximum (BGS/
DPHE, 2001). The Ba and SO42- data of the samples are plot-
ted in Fig. 9, together with the solubility line of barite (solid
line). In barite dissolution case, it is expected that the ob-
served Ba concentrations should positively correlate with
SO42- concentrations, but such relationship is not clear. The
data points of B1, B4 and D6 are close to the solubility line,
suggesting that barite is present in these aquifers, and Ba and
SO42- concentrations are restricted by barite saturation. The
other data points are located in the lower side of the solubility
line. If barite saturation is operated, such deviations can be
interpreted by an effect of dilution of the barite saturated
groundwater by rain water. However, other possibilities
should be considered such as scarceness of barite in the aqui-
fers.
As seen in Fig. 8, relatively low REE values suggest copre-
cipitation of REEs with Fe hydroxides, because it is known
that Fe hydroxide has a strong ability of coprecipitation for
REEs and has been used for preconcentration of REEs for wa-
ter sample analyses as actually used in this study (e.g., Masu-
Nishinomiya, Japan (Otsuka and Terakado, 2003) Carnmenellis, England(Smedley, 1991) Brittany, France(Dia et al., 2000) present data
Fig. 8 Comparisons for Ba, La abundances and Ba/La ratios in some groundwaters.
Asagoe et al.
Fig. 8 Comparisons for Ba, La abundances and Ba/La ratios in some groundwaters.
3.1×10⁻³
3.5×10⁻²
5.0×10⁻³
2.4×10⁻²
8.5×10⁻²
1.8×10⁻³
1.3×10⁻²
2.7×10⁻¹
0.001
0.01
0.1
1Ba (ppm)
1.6×10⁻⁶
1.6×10⁻⁴
4.6×10⁻⁴
9.5×10⁻²
8.0×10⁻⁶
5.1×10⁻³
5.7×10⁻⁷
7.6×10⁻⁶
1.E-07
1.E-05
1.E-03
1.E-01La (ppm)
3.5×10³
2.1×10244
1.2×10⁻¹
1.8
6.1×1022.8×103
2.8×10⁵
1.E-02
1.E+00
1.E+02
1.E+04
1.E+06Ba/La
Nishino
miya,
Japan
(Otsuka
and
Carnmen
ellis,
England
(Smedley,
1991)
Brittany,
France
(Dia et
al., 2000)
present
data Fig. 9 Relationship between log [SO4
2-] and log[Ba]. The straight line indicates the boundary between saturated and unsaturated areas for barite.
Asagoe et al.
Fig. 9 Relationship between log[SO42-] and log[Ba]. The straight line indicates to show the boundary between saturated and unsaturated areas for barite.
Log[
SO42-
] (pp
m)

(148)
- -148
da and Ikeuchi, 1979). In such coprecipitation case, when Fe
hydroxides dissolve under reducing condition, Fe and REE
should be released to the aquifer, which results in the positive
correlation between Fe and REE. However, Fe and La (REE)
data do not show positive correlation (Fig. 10). Therefore
more careful considerations are necessary.
Given that relatively high Fe concentrations (ppm level)
indicate dissolution of Fe hydroxides under reducing condi-
tions, to achieve REE depletion via coprecipitation, some Fe
hydroxide precipitation should occur somewhere under the
wells or re-adsorption of REE on some residual Fe hydroxides
due to relatively strong adsorption power of Fe hydroxides
for REE might have occurred.
Similarly, negative tendency between Mn and Fe (Fig. 6)
suggests Mn coprecipitation on Fe hydroxides. However, be-
cause Mn is a redox sensitive element, the negative tendency
may be attributed to the difference in redox potentials of Mn
and Fe components. Considering the boundary positions on
Eh-pH diagram, Mn can be released under more oxidizing con-
ditions than Fe, i.e., high Mn waters were formed under rela-
tively oxidized conditions. On the other hand, low Mn and
high Fe waters can be created by dissolution of the Mn scav-
enged Fe hydroxides.
In contrast to the negative tendencies seen in the Fe-REE
and Fe-Mn relationships, the positive correlation between Fe
and Ba is obvious (Fig. 10). Such positive correlation can be
simply explained by dissolution of Ba coprecipitated Fe hy-
droxides under reducing conditions. This is consistent with
“Reductive dissolution” as has been considered by many re-
searchers for high As and P groundwaters (e.g., Ravenscroft
et al., 2009).
However, the problem is that there occur two contrasting
relationships such as Fe-REE (negative) and Fe-Ba (positive) in
the same areas. As for the reason of this problem, the ad-
sorption abilities of Fe hydroxides for REE and Mn might be
stronger than those for Ba, As, and P. In such cases, if re-ad-
sorption might occur, REE and Mn should be adsorbed on Fe
hydroxides more strongly than Ba, As, and P, and thus REE
and Mn were scavenged.
As seen in Fig. 7, the REE patterns lack Ce anomalies or
show small positive Ce anomalies. This suggests reducing
condition in the aquifer, because Ce(III) is known to be oxi-
dized to Ce(IV) under oxidizing conditions. If Ce(IV) may oc-
cur, larger Ce anomalies should be observed. The REE pat-
terns show small positive Eu anomalies, which is consistent
with the reduction of Eu(III) to Eu(II), but it is known that
Eu(III) will not be reduced under earth’s near surface condi-
tions (Bau, 1991). As for positive Eu anomalies, because feld-
spars have large positive Eu anomalies (Smith, 1974), such
high Eu concentration in feldspars may contribute to the posi-
tive Eu anomaly via weathering or water-rock interactions in
the aquifers.
On the Cl- vs. Na and Cl- vs. Br- plots, the deviations of
the points from the seawater lines suggest addition of Na and
Br - or depletion of Cl - in groundwaters. However, depletion
of Cl- is unlikely, because Cl- is known as a most conservative
component in aquatic processes due to weakness of Cl - bear-
ing compound formation (Feth, 1981). Addition of Na can be
explained by the weathering of minerals which contain Na
(i.e., albite), but the sources of Br- cannot be identified at pre-
sent. The possibility of artificial addition of Br - (e.g., pesti-
cides, medicines, industrial solvents, gasoline additives, and
water purification compounds) was suggested by Price et al.,
(1988).
Acknowledgements
We thank the Center for Environmental Management of
Kobe University for the use of the atomic absorption spec-
trometer. We also thank Dr. K. Ohkushi for checking the
manuscript.
References
Bau, M. (1991) Rare-earth element mobility during hydro-
thermal and metamorphic fluid-rock interaction and the
significance of the oxidation state of europium. Chemical
Geology, 93, 219-230.
BGS/DPHE (2001) Arsenic contamination of groundwater in
Bangladesh. Eds: Kinniburgh, D. G. and Smedley, P. L.,
British Geological Survey Technical Report, WC/00/19.
Vol. 1 (Summary) 15 p. and Vol 2 (Final report) 267 p.
Dia, A., Gruau, G., Olivié-Lauquet, G., Riou, C., Molénat, J.,
and Curmi, P. (2000) The distribution of rare earth ele-
ments in groundwaters: Assessing the role of source-rock
composition, redox changes and colloidal particles. Geo-
chim. Cosmochim. Acta, 64, 4131-4151.
Feth, J. H. (1981) Chloride in Natural Continental Water: A
Review. 36p. U.S. Government Printing Office, Washing-
ton, DC.
Hem, J. D. (1977) Reactions of metal ions at surface of hy-
Fig. 10 Plots of La vs. Fe and Ba vs. Fe.
Asagoe et al.
Fig. 10 Plots of La vs. Fe and Ba vs. Fe.
0.E+00
3.E-06
6.E-06
9.E-06
0 10 20
Fe (ppm)
La (ppm)
0
0.1
0.2
0.3
0 10 20Fe (ppm)
Ba (ppm)
(149)
- -149
drous iron oxides. Geochim. Cosmochim. Acta, 41, 527-
538.
Jahn, B.-M., Bernard-Griffiths, J., Charlot, R., Cornichet, J.,
and Vidal, F. (1980) Nd and Sr isotopic compositions and
REE abundances of cretaceous MORB (Holes 417D and
418A, Legs 51, 52 and 53). Earth and Planetary Science
Letters, 48, 171-184.
Langmuir, D. (1997) Aqueous environmental geochemistry.
600p. Printice Hall Inc., New Jersey.
Libes, S. M. (1992) An introduction to Marine Biogeochemis-
try. 734p. John Wiley & Sons, Inc.
Masuda, A. and Ikeuchi, Y. (1979) Lanthanide tetrad effect
observed in marine environment. Geochemical Journal,
13, 19-22.
McArthur, J. M., Ravenscroft, P., Safiulla, S., and Thirlwall,
M. F. (2001) Arsenic in groundwater: Testing pollution
mechanisms for sedimentary aquifers in Bangladesh.
Water Resources Research, 37, 109-117.
Otsuka, M. and Terakado, Y. (2003) Rare earth element abun-
dances in high phosphorus and low iron groundwaters
from the Nishinomiya district, Japan: Variations in Ce
anomaly, redox state and heavy rare earth enrichment.
Geochemical Journal, 37, 1-19.
Price, D. (1988) Bromine compounds: Chemistry and applica-
tions. 434p. Elsevier, New York.
Ravenscroft, P., Brammer, H. and Richards, K. (2009) Arse-
nic pollution: a global synthesis. 617 p. Blackwell-Wiley.
Smedley, P. L. (1991) The geochemistry of rare earth elements
in groundwater from the Carnmenellis area, southwest
England. Geochim. Cosmochim. Acta, 55, 2767-2779.
Smith, A. H., Lingas, E. O. and Rahman, M. (2000) Contami-
nation of drinking-water by arsenic in Bangladesh: a pub-
lic health emergency. Bulletin of the World Health Or-
ganization, 78, 1093-1103.
Smith, J. V. (1974) Feldspar minerals, vols. 1 627p. and vols. 2
690p. Springer, Berlin.
Terakado, Y. and Masuda, A. (1988) Trace-element variations
in acidic rocks from the inner zone of southwest Japan.
Chemical Geology, 67, 227-241
Terakado, Y., Asagoe, Y., Koga, T. and Nasher, N. M. R.
(2015)
Preliminary report on arsenic and some related components in
tube-well waters from the high and low arsenic ground-
water areas near Dhaka, Bangladesh. Bulletin of Gradu-
ate School of Human Development and Environment,
Kobe University, 9, 73-80.
Truesdelland, A. H. and Jones, B. F. (1974) WATEQ, a com-
puter program for calculating chemical equilibria of natu-
ral waters. Journal of Research of the U.S. Geological
Survey, 2, 233-248.
Turekian, K. K. (1968) Ocean. Prentice-Hall, Inc., New Jer-
sey.
UNICEF (2010) Bangladesh: Monitoring the Situation of Chil-
dren and Women: Multiple Indicator Cluster Survey 2009:
Progotir Pathey 2009: Volume I: Technical Report. 220 p.
United Nations Children’s Fund. United States of Ameri-
ca.
WHO (2011) Guidelines for drinking-water quality - 4th ed.
541pp, World Health Organization. Switzerland.
Yu, W. H. (2003) Arsenic in groundwater in Bangladesh: A
geostatistical and epidemiological framework for evaluat-
ing health effects and potential remedies. Water Resourc-
es Research, 39, WES1 1-17.