Key Indicators for Asia and the Pacific 2017: Part II ... · PDF...
27
Regional Trends and Tables 107 I. People Snapshot • • The• total• population• of• Asia• and• the• Pacific• has• increased• by• nearly• 652• million,• from• 3.4• billion• people•in•2000•to•4.1•billion•people•in•2016.•The•region•now•accounts•for•55%•of•the•global•population.• • • The•dependency•ratio•decreased•between•2000•and•2016•for•most•developing•member•economies• as• the• number• of• youth• reaching• their• working-age• years• more• than• compensated• for• those• reaching•retirement•age.• • • While•Asia•and•the•Pacific’s•urbanization•rate•is•increasing,•fewer•than•half•of•all•people•in•the• region• lived• in• urban• areas• in• 2016,• which• is• well• below• average• urbanization• rates• of• about• 70%–80%•in•other•regions•of•the•world,•excluding••Africa.• • • The•quality•of•life,•as•measured•by•the•Human•Development•Index,•improved•most•significantly• between•2000•and•2015•in•Afghanistan,•Cambodia,•and•Myanmar.• • • Primary•and•secondary•educational•attainment•varies•widely•across•the•region,•with•a•gender•gap• in•favor•of•females•being•more•common•at•the•secondary•level.•• Key Trends The total population of Asia and the Pacific increased by nearly 652 million, from 3.4 billion people in 2000 to 4.1 billion people in 2016. The region now accounts for 55% of the global population. The• combined• populations• of• the• 48• regional• members• of• the• Asian• Development• Bank• (ADB)• reached• 4.1• billion• in• 2016,• or• 54.8%• of• the• world’s• total• population• (Figure 1.1a).• This• was• more•than•three•times•the•share•of•Africa,•the•region• comprising• the• next• largest• share• of• the• global• population.•Since•2000,•the•region’s•total•population• increased•by•nearly•652 million,•which•is•even•higher• than•the•current•total•population•of•Southeast•Asia• of•635•million.• Among• subregions• in• Asia• and• the• Pacific,• South• Asia• is• the• most• populous,• comprising• 36.9%• of• the• regional• total• in• 2016.• This• was• followed• by• East Asia•(35.9%),•Southeast•Asia•(15.5%),•Central•and• West•Asia•(7.6%),•and•the•Pacific•(0.3%)•(Figure•1.1b).• PRC = People’s Republic of China. Note: The aggregate for the West Asia region was adjusted to exclude Armenia, Azerbaijan, and Georgia, which are included in the total for Asia and the Pacific. Source: Table 1.1. Rest of the World, 1.1 Africa, 16.4 Europe, 11.0 North America, 7.7 South America, 5.6 West Asia, 3.3 PRC, 18.5 India, 17.4 Indonesia, 3.5 Pakistan, 2.6 Bangladesh, 2.2 Japan, 1.7 Philippines, 1.4 Viet Nam , 1.2 Thailand, 0.9 Others, 5.4 Asia and the Pacific, 54.8 Figure 1.1a: Percentage Distribution of Population by Global Region, and by Economy in Asia and the Pacific, 2016 Click here for figure data
Transcript of Key Indicators for Asia and the Pacific 2017: Part II ... · PDF...

107Regional Trends and Tables
107
I. People
Snapshot
•• The•total•population•of•Asia•and•the•Pacific•has•increased•by•nearly•652•million,•from•3.4•billion•people•in•2000•to•4.1•billion•people•in•2016.•The•region•now•accounts•for•55%•of•the•global•population.•
•• The•dependency•ratio•decreased•between•2000•and•2016•for•most•developing•member•economies•as• the• number• of• youth• reaching• their• working-age• years• more• than• compensated• for• those•reaching•retirement•age.•
•• While•Asia•and•the•Pacific’s•urbanization•rate•is•increasing,•fewer•than•half•of•all•people•in•the•region• lived• in• urban• areas• in• 2016,• which• is• well• below• average• urbanization• rates• of• about•70%–80%•in•other•regions•of•the•world,•excluding••Africa.•
•• The•quality•of•life,•as•measured•by•the•Human•Development•Index,•improved•most•significantly•between•2000•and•2015•in•Afghanistan,•Cambodia,•and•Myanmar.•
•• Primary•and•secondary•educational•attainment•varies•widely•across•the•region,•with•a•gender•gap•in•favor•of•females•being•more•common•at•the•secondary•level.••
Key Trends
The total population of Asia and the Pacific increased by nearly 652 million, from 3.4 billion people in 2000 to 4.1 billion people in 2016. The region now accounts for 55% of the global population. The• combined• populations• of• the• 48•regional• members• of• the• Asian• Development• Bank•(ADB)• reached• 4.1• billion• in• 2016,• or• 54.8%• of• the•world’s• total• population• (Figure 1.1a).• This• was•more•than•three•times•the•share•of•Africa,•the•region•
comprising• the• next• largest• share• of• the• global•population.•Since•2000,•the•region’s•total•population•increased•by•nearly•652 million,•which•is•even•higher•than•the•current•total•population•of•Southeast•Asia•of•635•million.•
Among• subregions• in• Asia• and• the• Pacific,•South• Asia• is• the• most• populous,• comprising• 36.9%•of• the• regional• total• in• 2016.• This• was• followed• by•East Asia•(35.9%),•Southeast•Asia•(15.5%),•Central•and•West•Asia•(7.6%),•and•the•Pacific•(0.3%)•(Figure•1.1b).•
PRC = People’s Republic of China.Note: The aggregate for the West Asia region was adjusted to exclude Armenia, Azerbaijan, and Georgia, which are included in the total for Asia and the Pacific.Source: Table 1.1.
Rest of the World, 1.1
Africa, 16.4
Europe, 11.0
North America, 7.7
South America, 5.6
West Asia, 3.3
PRC,18.5
India, 17.4
Indonesia, 3.5
Pakistan, 2.6
Bangladesh, 2.2 Japan, 1.7
Philippines, 1.4 Viet Nam , 1.2
Thailand, 0.9 Others, 5.4
Asia andthe Pacific,
54.8
Figure 1.1a: Percentage Distribution of Population by Global Region, and by Economy in Asia and the Pacific, 2016
Click here for figure data

108 Key Indicators for Asia and the Pacific 2017108
In•2016,•the•two•most•populous•economies•in•the•world,•the•People’s•Republic•of•China•(PRC)•and•India,•had•populations•of•1.4•billion•and•1.3•billion,•respectively.•The•list•of•the•most•populous•economies•in•the•region•also•includes•Indonesia•(259•million),•Pakistan•(195•million),•and•Bangladesh•(161•million).•The• economies• with• the• smallest• populations• in•the• region• were• Tuvalu• (11.3• thousand),• Nauru•(13 thousand),•Palau•(17.9•thousand),•and•the•Cook•Islands•(19 thousand).••
The• region’s• population• growth• rate• since•2000• has• slowed• more• rapidly• than• the• global•average.• The• annual• population• growth• rate• of•Asia•and•the•Pacific•fell•from•1.2%•in•2000•to•1.0%•
in• 2016,• compared• with• a• decline• in• the• global•average• from• 1.3%• to• 1.1%• (Table• 1.1).• The• Asia•and• Pacific• economies• with• the• highest• annual•population• growth• rates• between• 2000• and• 2016•were• Papua• New• Guinea• (3.1%),• Maldives• (3.0%),•Vanuatu• (2.5%),• and• Solomon• Islands• (2.3%).•The• economies• with• the• lowest• average• growth•rates• include• Armenia• (–0.4%),• Palau• (–0.3%),• the• Federated• States• of• Micronesia• (–0.2%),• and•Japan•(0.0%).
The• United• Nations• projects• that• the• world•population•will•reach•9.8•billion•in•2050,•with•Asia•and• the• Pacific’s• share• of• the• global• total• dipping•only•slightly•to•about•49.2%.•(UN•DESA•2017).•••••
Source: Table 1.1.
0.3
3.8
7.6
15.5
35.9
36.9
0.0 5.0 10.0 15.0 20.0
Percent
25.0 30.0 35.0 40.0
The Pacific
Developed
Central and West Asia
Southeast Asia
East Asia
South Asia
Figure 1.1b: Percentage Distribution of Population in Asia and the Pacific, 2016
Click here for figure data
109PeopleRegional Trends and Tables
109
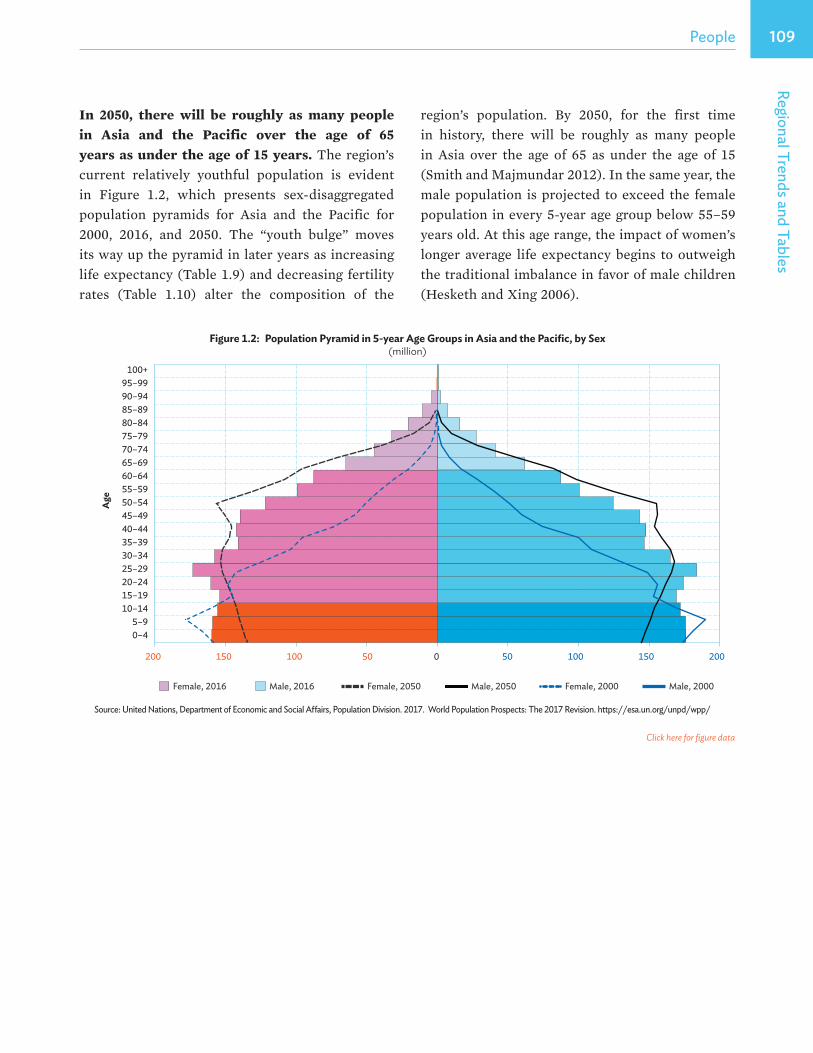
In 2050, there will be roughly as many people in Asia and the Pacific over the age of 65 years as under the age of 15 years.•The•region’s•current• relatively• youthful• population• is• evident•in• Figure 1.2,• which• presents• sex-disaggregated•population• pyramids• for• Asia• and• the• Pacific• for•2000,• 2016,• and• 2050.• The• “youth• bulge”• moves•its•way•up•the•pyramid•in•later•years•as•increasing•life•expectancy•(Table•1.9)•and•decreasing•fertility•rates• (Table• 1.10)• alter• the• composition• of• the•
region’s• population.• By• 2050,• for• the• first• time•in• history,• there• will• be• roughly• as• many• people•in• Asia• over• the• age• of• 65• as• under• the• age• of 15•(Smith•and•Majmundar•2012).•In•the•same•year,•the•male•population•is•projected•to•exceed•the•female•population•in•every•5-year•age•group•below•55–59•years•old.•At•this•age•range,•the•impact•of•women’s•longer•average•life•expectancy•begins•to•outweigh•the•traditional•imbalance•in•favor•of•male•children•(Hesketh•and•Xing•2006).
Male, 2016 Female, 2016 Female, 2050 Male, 2050 Female, 2000 Male, 2000
Source: United Nations, Department of Economic and Social A�airs, Population Division. 2017. World Population Prospects: The 2017 Revision. https://esa.un.org/unpd/wpp/
200
0–4 5–9
10–14 15–19 20–24 25–29 30–34 35–39 40–44 45–49 50–54 55–59 60–64 65–69 70–74 75–79 80–84 85–89 90–94 95–99
100+
Age
150 100 50 0 50 100 150 200
Figure 1.2: Population Pyramid in 5-year Age Groups in Asia and the Pacific, by Sex (million)
Click here for figure data

110 Key Indicators for Asia and the Pacific 2017110
FSM = Federated States of Micronesia, Lao PDR = Lao People’s Democratic Republic, PRC = People’s Republic of China.Source: Table 1.4.
2000 2016 2050
0 20 40 60 80 100 120
Taipei,China Hong Kong, China
Korea, Rep. of Singapore Maldives
Brunei Darussalam PRC
Thailand Azerbaijan
Viet Nam Malaysia Armenia
Palau Bhutan
Uzbekistan Indonesia Myanmar Mongolia
Cook Islands Georgia
Bangladesh Sri Lanka
India Australia
Kazakhstan Fiji
New Zealand Turkmenistan
Cambodia Kyrgyz Republic
Philippines Lao PDR
Nepal FSM
Tajikistan Kiribati
Pakistan Japan
Papua New Guinea Nauru
Vanuatu Tuvalu Tonga
Samoa Solomon Islands Marshall Islands
Afghanistan Timor–Leste
The dependency ratio decreased between 2000 and 2016 for most developing member economies as the number of youth reaching their working-age years more than compensated for those reaching retirement age.• Figure• 1.3• presents• the•dependency• (age–population)• ratio• in• 2000,• 2016,•and•2050•for•each•economy•in•Asia•and•the•Pacific•by• distinguishing• between• those• age• groups• that•are• typically• not• in• the• labor• force• (14• years• and•below,•and•65•years•and•above)•and•those•typically•in• the• labor• force• (15–64• years).• The• dependency•ratio• decreases• during• the• review• period• for• every•developing•member•economy•except•Sri•Lanka•and•Palau.• By• 2050,• the• dependency• ratio• is• expected•to•increase•in•those•developing•member•economies•with• aging• populations• in• which• there• are• more•retirements• than• new• entrants• into• with• the•workforce,•as•was•the•case•among•all•three•developed•members•between•2000•and•2016.•
In• the• decades• ahead,• many• governments•in• the• region• will• face• fiscal• challenges,• reduced•productive•capacity,•and•lower•long-term•economic•growth.• The• likely• economic• and• social• impacts• of•aging•of•the•region’s•population•in•the•decades•ahead•are•discussed•in•Box•1.•
Figure 1.3: Age Dependency Ratio
Click here for figure data

111PeopleRegional Trends and Tables
111
Box 1: Population Aging in Asia and the Pacific:From Demographic Dividend to Demographic Tax
Asia and the Pacific has benefitted economically in recent decades from a demographic dividend triggered by declining fertility rates in economies with relatively youthful populations, leading to a subsequent decline in the dependency ratio and a burgeoning workforce. According to a World Bank estimate, the expansion of the labor force contributed about one-third of per capita income growth in East Asia between 1960 and 2000 (WB 2016). Today, Asia and the Pacific is experiencing another demographic transition as its population ages. The United Nations projects that the region’s elderly population (aged 65 years and over) will grow from about 334 million in 2016 to about 870 million in 2050; during this period, the elderly’s share of the total population will increase from 8.1% to 18.1% (UN 2017).The looming increase in the region’s old-age dependency ratio—the number of people aged 65 years and over divided by the number of those of working age—will constrain future economic growth. Governments in the region will need to craft appropriate policies to address the impacts of this demographic tax.
The initial stage of the current demographic transition in Asia and the Pacific, which began as early as the 1950s in some parts of the region, altered the age distribution of the population as the proportion of the young in the total population increased in response to declining under-5 mortality rates. The age structure of an economy undergoing such a transition resembles a pyramid, with the base of the pyramid representing an expanding youth population. The median age in Asia subsequently began to rise as fertility rates declined precipitously amid improvements in public health, rising incomes, and urbanization. Increases in life expectancy across the region also contributed to a rise in the median age. Many economies reaped a demographic dividend as an expanding share of the working-age population helped accelerate economic growth. The rapid economic expansion in parts of Asia and the Pacific, particularly East Asia, was also facilitated by the presence of social, economic, and political institutions that capitalized on the growth potential offered by a demographic transition (Bloom, Canney, and Malaney 2000).
As part of the population aging process, the age structure in an economy gradually becomes uniform as the average number of births per woman falls to two. (Eventually, the age structure in an economy will resemble an inverse pyramid if fertility levels fall even further.) The decline in the working-age population as a share of the total population has an adverse effect on the labor supply, thereby negatively impacting potential growth as relatively fewer workers become responsible for supporting an increasing number of retirees. For example, by 2050, it is estimated that there will be about 198 million fewer working-age individuals in the People’s Republic of China (PRC) than there are now. Furthermore, they will be responsible for supporting an elderly population that will have expanded by more than 217 million during that time.
A range of policies can be considered to address the economic impacts of population aging. In economies where family support systems are a critical component of caring for the elderly (e.g., the PRC; the Republic of Korea; Taipei,China; and Thailand), adult day care services and tax relief for multigenerational families can allow adult children to continue working in support of their aging parents. Mandatory retirement ages may need to be reevaluated in some cases, particularly in economies where there is a lower retirement age for women than men despite women living longer on average. Reforming labor laws to encourage firms to retain older workers by making employment conditions more flexible—by allowing part-time working hours or wage scales that are not automatically based on seniority—could also create more job opportunities for the elderly and delay retirement.
Personal savings are another key part of addressing population aging in Asia and the Pacific. Within the region, the elderly in South Asia (e.g., India) and Southeast Asia (e.g., Indonesia, the Philippines, and Thailand) are the most reliant upon personal savings for financing consumption after retirement. To facilitate saving, governments in the region should strive to effectively manage inflation and ensure that domestic financial markets offer secure, long-term investment opportunities. The governments of Malaysia and Singapore have gone even further by implementing mandatory personal savings accounts.
Public pension programs both provide an economic safety net for the elderly and allow for risk pooling. Such programs can meet the retirement needs of the poor and address challenges facing the poor and nonpoor alike, including long-term disability and outliving one’s savings. At the same time, public pension programs can be difficult to administer, particularly in lower-income economies in
(continued on next page)

112 Key Indicators for Asia and the Pacific 2017112
which the agricultural and/or informal sector accounts for a large share of total employment. Good governance is required to ensure effective payments collection and funds management. Furthermore, the experiences of developed economies have shown the risk of establishing potentially unsustainable pay-as-you-go systems. As the old-age dependency ratio in an economy increases, such systems can only be maintained by reducing benefits and/or raising payroll taxes.
Finally, the increased costs of providing health care for an expanding elderly population will place fiscal strain on many governments in the region. In Japan, health care spending per capita for the elderly is about four times higher than for the rest of the population (East-West Center 2002). Many governments will have to face such fiscal burdens from a lower level of economic development than was the case with Japan or other advanced economies. This will make it more difficult to balance a commitment to providing health care for the elderly with the ability and willingness of taxpayers to fund public health schemes.
There is, of course, variation in the status of population aging across Asia and Pacific economies, which will affect policy responses in individual economies. In Japan, the proportion of the population aged 65 years and older was 26.6% in 2016, while in the high-income developing economies of East Asia—such as Hong Kong, China; the Republic of Korea; and Taipei,China—the shares of the elderly population in 2016 were 15.8%, 13.4%, and 12.8%, respectively. By comparison, economies in South Asia and the Pacific generally still have young populations, with subregional averages of only 5.8% and 4.0% of the population aged 65 years and over, respectively. The populations of the economies of Central and West Asia and Southeast Asia are also relatively young, with a few notable exceptions. For example, the percentage of the total population aged 65 years and over in 2016 in Georgia and Armenia was 14.7% and 11.1%, respectively, while the corresponding figures for Singapore and Thailand were 12.3% and 11.0%, respectively (Table 1.4).
Despite these differences in age structure across the region, all economies in Asia and the Pacific will eventually face many of the same challenges over the long term given the prevalence of declining birth rates and extended life expectancies. Economies that are at a more advanced stage of population aging need to immediately address the challenges of transitioning from a demographic dividend to a demographic tax. Those at a relatively earlier stage should learn the lessons of how other economies have benefited from their demographic dynamism and how they are preparing for the future.
Sources:
Asian Development Bank. 2011. Asian Development Outlook 2011. Manila.
East-West Center. 2002. The Future of Population in Asia. Honolulu.
D. Bloom, D. Canney, and P. Malaney. 2000. The Economic Consequences of Demographic Change in East Asia. www.nber.org/chapters/c8148.pdf
L. Kihara. 2017. IMF Warns Asia to Act Early on Rapidly Aging Population. Reuters. 8 May 2017.
United Nations, Department of Economic and Social Affairs, Population Division. World Population Prospects, 2017 Revision. https://esa.un.org/unpd/wpp/DataQuery/ (accessed 31 July 2017).
World Bank. 2016. World Bank East Asia and Regional Reports. Live Long and Prosper: Aging in East Asia and the Pacific. Washington, DC.
(Box 1 continued)

113PeopleRegional Trends and Tables
113
While Asia and the Pacific’s urbanization rate is increasing, fewer than half of all people in the region lived in urban areas in 2016, which is well below average urbanization rates of about 70%–80% in other regions of the world, excluding Africa. By•global•region,•Asia’s•urbanization•rate•of•47.5%•in•2014•exceeded•only•that•of•Africa•at•40.0%.•Urbanization•rates•in•other•regions•of•the•world•in•2014•were•81.5%•for•North•America,•79.5%•for•Latin•America• and• the• Caribbean,• 73.4%• for• Europe,• and•70.8%•for•Oceania•(UN•DESA•2014).•
Between• 2000• (or• the• earliest• year• for• which•data• are• available)• and• 2016• (or• the• latest• year• for•which• data• are• available),• the• urban• share• of• the•total•population•increased•in•7•of•the•10•economies•in• Central• and• West• Asia,• 4• of• the• 5• economies• in•East• Asia,• 5• of• the• 6• economies• in• South• Asia,• 8•of• the• 10• economies• in• Southeast• Asia,• 10• of• the•14• economies• of• the• Pacific,• and• all• 3• developed•member•economies•(Figure•1.4,•Table 1.2).1
The quality of life, as measured by the Human Development Index (HDI), improved most significantly between 2000 and 2015 in Afghanistan, Cambodia, and Myanmar.• Figure 1.5a• shows• HDI•values• for• each• of• the• region’s• economies• in• 2015.2•Some•of•the•region’s•high•income•economies•such•as•Brunei•Darussalam;•Hong•Kong,•China;•the•Republic•of• Korea;• Singapore;• and• Taipei,China• had• an• HDI•value•in•2015•exceeding•0.8.•On•the•other•hand,•the•economies•with•the•lowest•HDI•values•in•2015•include•Afghanistan• (0.48),• Papua• New• Guinea• (0.52),• and•Solomon• Islands• (0.52).• Overall,• 75%• of• the• region’s•developing• member• economies• had• an• HDI• value•equal•to•or•exceeding•0.6,•and•half•had•an•HDI•value•equal•to•or•exceeding•0.7.••
FSM = Federated States of Micronesia, Lao PDR = Lao People’s Democratic Republic, PRC = People’s Republic of China.Source: Table 1.2.
20162000
0 20 40 60 80 100 120
Australia New Zealand
Japan
Papua New Guinea Samoa
FSM Solomon Islands
Tonga Vanuatu
Timor–Leste Fiji
Kiribati Tuvalu
Marshall Islands Cook Islands
Nauru
Cambodia Myanmar Viet Nam Lao PDR
Philippines Thailand
Indonesia Malaysia
Brunei Darussalam Singapore
Sri Lanka Nepal India
Bangladesh Bhutan
PRC Taipei,China
Mongolia Korea, Rep. of
Hong Kong, China
Afghanistan Tajikistan
Kyrgyz Republic Pakistan
Turkmenistan Uzbekistan Azerbaijan
Kazakhstan Georgia
Armenia
1 No change in the urbanization rate was observed during the review period in three of the region’s economies that were fully urbanized in 2000: Hong Kong, China; Nauru; and Singapore.
2 The HDI is calculated by the United Nations Development Programme for economies worldwide. It covers three important aspects of welfare: long and healthy life, access to education, and decent standards of living.
Figure 1.4: Urbanization Rate (%)
Click here for figure data

114 Key Indicators for Asia and the Pacific 2017114
annual•average•growth•rates•in•HDI•between•2000•and•2015• are• Timor–Leste,• the• Lao• People’s• Democratic•Republic,•and•India.•Expectedly,•the•three•developed•economies•of•Asia•and•the•Pacific•whose•HDI•values•exceeded•0.85•in•2000•and•0.90•based•on•latest•data,•had• low•annual•growth•rates•despite•having•some•of•the•highest•values•of•HDI•in•the•world.•
Figure•1.5b•shows•the•average•annual•increase•in•HDI•values•between•2000•and•2015•in•those•economies•for• which• comparable• data• are• available.• Average•annual•HDI•growth•rates•were•highest•in•some•of•the•same•economies•that•had•low•HDI•values•at•the•end•of•the• review• period,• including• Afghanistan,• Cambodia,•and•Myanmar.•Other•economies•posting•notably•high•
FSM = Federated States of Micronesia, Lao PDR = Lao People’s Democratic Republic, PRC = People’s Republic of China.Note: For Taipei,China, data are obtained from DGBAS.Source: Table 1.8.
0.479 0.515 0.516
0.550 0.556 0.558 0.563 0.579 0.586 0.588 0.597 0.606 0.607 0.624 0.627 0.638
0.664 0.682 0.683 0.689 0.692 0.701 0.701 0.704 0.721 0.735 0.736 0.738 0.740 0.743 0.759 0.766 0.769 0.788 0.789 0.794
0.865 0.885 0.901 0.903 0.915 0.917 0.925 0.939
0 0.100
0.200 0.300
0.400 0.500
0.600 0.700
0.800
0.900 1.000
Afghanistan Solomon Islands
Papua New Guinea Pakistan
Myanmar Nepal
Cambodia Bangladesh
Lao PDR Kiribati
Vanuatu Timor–Leste
Bhutan India
Tajikistan FSM
Kyrgyz Republic Philippines
Viet Nam Indonesia
Turkmenistan Maldives
Uzbekistan Samoa Tonga
Mongolia Fiji
PRC Thailand Armenia
Azerbaijan Sri Lanka
Georgia Palau
Malaysia Kazakhstan
Brunei Darussalam Taipei,China
Korea, Rep. of Japan
New Zealand Hong Kong, China
Singapore Australia
FSM = Federated States of Micronesia, Lao PDR = Lao People’s Democratic Republic, PRC = People’s Republic of China.Source: Table 1.8.
0.29 0.35 0.36 0.36 0.37 0.41 0.45
0.50 0.56 0.58 0.61 0.63
0.70 0.74 0.75
0.80 0.87 0.88 0.89
0.95 0.98 1.02 1.06 1.10 1.12 1.14 1.18
1.34 1.34
1.42 1.47
1.49 1.49
1.56 1.57
1.69 1.76
2.08 2.29
0 0.20
0.40 0.60
0.80
1.00
1.20
1.40
1.60
1.80
2.00
2.20
2.40 Australia
New Zealand Japan
Brunei Darussalam FSM
Palau Tonga
Fiji Malaysia
Samoa Philippines
Korea, Rep. of Hong Kong, China
Sri Lanka Kyrgyz Republic
Singapore Thailand
Indonesia Georgia
Armenia Kazakhstan
Solomon Islands Tajikistan
Uzbekistan Azerbaijan
Viet Nam Maldives Pakistan
Papua New Guinea Bangladesh
PRC Mongolia
Nepal India
Lao PDR Timor–Leste
Myanmar Cambodia
Afghanistan
Figure 1.5a: Human Development Index, 2015Figure 1.5b: Human Development Index Average Annual Growth,
2000–2015 (%)
Click here for figure data Click here for figure data

115PeopleRegional Trends and Tables
115
Primary and secondary educational attainment varies widely across the region, with a gender gap in favor of females being more common at the secondary level.• Education• is• a• major•driver• of• economic• growth;• lack• of• education•can• limit• employment• opportunities,• increase•the• risk• of• social• exclusion• and• poverty,• and•restrict•participation• in•civic•and•political•affairs•(McMahon•1998).•Figures•1.6a•and•1.6b•show•the•gross• intake• levels• for• the• last• grades• of• primary•
and• secondary• education,• respectively,• for• both•males• and• females.• At• the• primary• level,• Nauru,•Pakistan,•and•Papua•New•Guinea•exhibit•the•largest•gender•gap•in•favor•of•males,•while•in•Bangladesh,•Kiribati,•and•Tuvalu•the•gender•gap•notably•favors•females• at• the• primary• level.• The• gender• gap• in•favor•of•males•persists• in•Pakistan•and•Tajikistan•at• the• secondary• level,• and• either• persists• or•increases• in• favor• of• females• in• Bangladesh,• the•Cook•Islands,•Kiribati,•and•Tuvalu.•
Female Male Female Male
0 20 40 60 80 100 120 140
Pakistan Palau
Myanmar Papua New Guinea
Tuvalu Solomon Islands
Vanuatu Bangladesh
Cook Islands PRC
Bhutan Cambodia
Maldives India
Tajikistan Marshall Islands
Thailand Philippines
Armenia Mongolia
Uzbekistan Sri Lanka Malaysia Lao PDR
Korea, Rep. of Samoa Japan
Brunei Darussalam Timor–Leste
Viet Nam Azerbaijan Indonesia
Nepal Kiribati
Fiji Kazakhstan
Kyrgyz Republic Tonga
Georgia Nauru
0 20 40 60 80 100 120
Myanmar Cambodia
Vanuatu Pakistan
Bangladesh Lao PDR
Solomon Islands Timor–Leste
Philippines Bhutan
Nepal Malaysia
India Thailand
Indonesia Azerbaijan
Cook Islands Kyrgyz Republic
Kiribati Tuvalu
Fiji Uzbekistan
Maldives Sri Lanka
PRC Hong Kong, China
Tajikistan Viet Nam
Palau Samoa
Brunei Darussalam Georgia
Korea, Rep. of Kazakhstan
Lao PDR = Lao People’s Democratic Republic, PRC = People’s Republic of China.Note: This chart includes economies with available data between 2011 and 2016.Source: Table 1.11.
Lao PDR = Lao People’s Democratic Republic, PRC = People’s Republic of China.Note: This chart includes economies with available data between 2011 and 2016.Source: UNESCO Institute for Statistics Database. UIS.Stat. http://data.uis.unesco.org/ (accessed 30 June 2017).
Figure 1.6a: Primary Education Completion Rate, Latest Year(%)
Figure 1.6b: Secondary Education Completion Rate, Latest Year(%)
Click here for figure dataClick here for figure data
116 Key Indicators for Asia and the Pacific 2017116
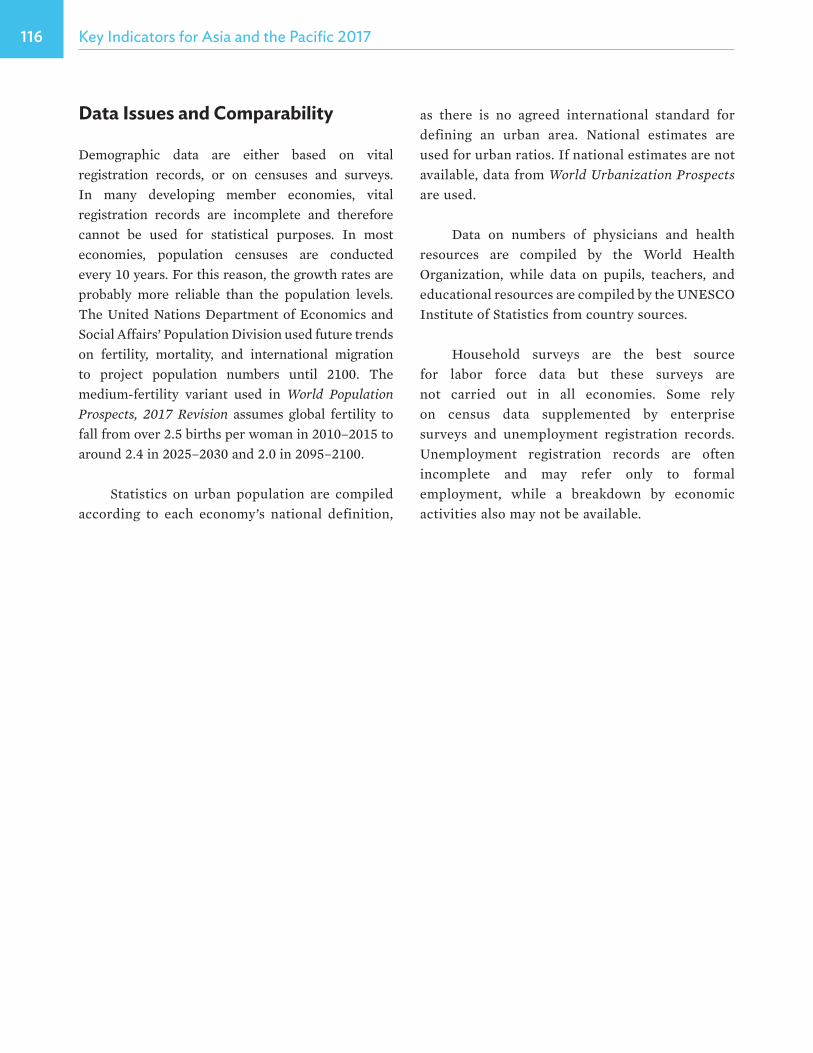
Data Issues and Comparability
Demographic• data• are• either• based• on• vital•registration• records,• or• on• censuses• and• surveys.•In• many• developing• member• economies,• vital•registration• records• are• incomplete• and• therefore•cannot• be• used• for• statistical• purposes.• In• most•economies,• population• censuses• are• conducted•every•10•years.•For•this•reason,•the•growth•rates•are•probably• more• reliable• than• the• population• levels.•The•United•Nations•Department•of•Economics•and•Social•Affairs’•Population•Division•used•future•trends•on• fertility,• mortality,• and• international• migration•to• project• population• numbers• until• 2100.• The•medium-fertility• variant• used• in• World Population Prospects,• 2017 Revision• assumes• global• fertility• to•fall•from•over•2.5•births•per•woman•in•2010–2015•to•around•2.4•in•2025–2030•and•2.0•in•2095–2100.
Statistics• on• urban• population• are• compiled•according• to• each• economy’s• national• definition,•
as• there• is• no• agreed• international• standard• for•defining• an• urban• area.• National• estimates• are•used•for•urban•ratios.•If•national•estimates•are•not•available,•data•from•World Urbanization Prospects•are•used.•
Data• on• numbers• of• physicians• and• health•resources• are• compiled• by• the• World• Health•Organization,• while• data• on• pupils,• teachers,• and•educational•resources•are•compiled•by•the•UNESCO•Institute•of•Statistics•from•country•sources.
Household• surveys• are• the• best• source•for• labor• force• data• but• these• surveys• are•not• carried• out• in• all• economies.• Some• rely•on• census• data• supplemented• by• enterprise•surveys• and• unemployment• registration• records.•Unemployment• registration• records• are• often•incomplete• and• may• refer• only• to• formal•employment,• while• a• breakdown• by• economic•activities•also•may•not•be•available.•

117PeopleRegional Trends and Tables
Population
Table 1.1: Midyear Population
Regional MemberPopulation
(million)Annual Population Growth Ratesf
(%)2000 2005 2010 2016 2000 2005 2010 2016
Developing Member Economies Central and West Asia 231.7 253.7 279.0 310.8 1.8 1.8 2.0 1.8
Afghanistana 21.0 23.6 26.0 29.2 1.4 1.5 2.0 2.1Armenia 3.2 3.1 3.0 3.0 –0.3 –0.6 –0.7 –0.4Azerbaijan 8.1 8.5 9.1 9.8 1.1 1.2 1.2 1.1Georgiaa 4.4 4.3 4.4 3.7 –0.8 0.1 1.2 0.2Kazakhstan 14.9 15.1 16.3 17.8 –0.3 0.9 1.4 1.5Kyrgyz Republica 4.9 5.1 5.4 6.0 1.4 1.2 0.3 2.1Pakistan 140.0 156.0 173.5 195.4 2.4 2.2 2.1 1.9Tajikistan 6.2 6.9 7.6 8.6 2.1 2.1 2.2 1.1Turkmenistan 4.5 4.7 5.0 5.4 1.2 1.1 1.3 1.2Uzbekistan 24.7 26.2 28.6 31.8 1.4 1.2 2.9 1.8
East Asia 1,345.7 1,387.8 1,423.4 1,467.9 0.8 0.6 0.5 0.6China, People’s Rep. of a 1,267.4 1,307.6 1,340.9 1,382.7 0.8 0.6 0.5 0.6Hong Kong, China 6.7 6.8 7.0 7.3 0.9 0.4 0.7 0.6Korea, Rep. of 47.0 48.2 49.6 51.2 0.8 0.2 0.5 0.5Mongolia 2.4 2.5 2.7 3.1 1.3 1.1 1.8 2.0Taipei,China 22.2 22.7 23.1 23.5 0.8 0.4 0.3 0.2
South Asia 1,189.6 1,290.5 1,382.6 1,510.6 1.6 1.5 1.4 1.2Bangladesh 129.3 138.6 148.6 160.8 1.4 1.5 1.4 1.2Bhutan 0.6 0.6 0.7 0.8 1.3 1.3 1.8 1.5Indiaa 1,019.0 1,106.0 1,186.0 1,299.0 1.8 1.5 1.4 1.2Maldivesb, c 0.3 0.3 0.4 0.5 1.5 3.3 2.3 3.7Nepal 21.0 25.3 26.3 28.3 3.0 2.3 1.4 1.4Sri Lanka 19.4 19.6 20.7 21.2 1.3 0.9 1.0 1.1
Southeast Asia 515.4 550.1 590.5 634.5 1.5 1.3 2.0 1.2Brunei Darussalam 0.3 0.4 0.4 0.4 2.5 1.8 1.8 1.5Cambodia 12.5 13.3 14.1 15.2 1.3 1.3 1.3 1.3Indonesia 206.3 219.9 238.5 258.7 1.2 1.3 2.7 1.3Lao PDR 5.1 5.6 6.0 6.6 2.0 2.0 1.5 1.4Malaysia 23.5 26.0 28.6 31.7 2.5 2.1 1.8 1.5Myanmara 47.7 50.0 51.7 52.9 1.2 0.8 0.7 0.9Philippines 76.8 84.7 93.1 103.2 2.3 1.9 2.3 1.7Singapore 4.0 4.3 5.1 5.6 1.7 2.4 1.8 1.3Thailand 62.2 64.1 65.9 67.5 1.1 0.6 0.6 0.4Viet Nam 77.1 81.9 86.9 92.7 1.4 1.2 1.1 1.1
The Pacificd 8.0 9.1 10.4 12.1 3.3 2.6 2.7 2.6Cook Islands 18.0 21.5 23.7 19.0 9.1 5.9 4.9 1.6Fiji 802.0 827.0 850.7 871.0 0.6 0.7 0.6 0.4Kiribatia 84.5 92.5 103.1 111.6 1.7 1.8 2.1 1.3Marshall Islands 51.2 51.2 52.9 54.2 0.8 1.4 1.2 0.4Micronesia, Fed. States ofa 107.0 105.6 102.8 102.5 0.2 –0.3 –0.5 0.2Nauru 10.1 9.5 9.7 13.0 1.0 –2.2 1.9 4.2Palau 18.9 19.8 18.3 17.9 0.3 0.8 –1.9 1.6Papua New Guinea 5,190.8 6,051.7 7,055.4 8,482.0 3.3 3.1 3.1 3.1Samoa 175.1 179.9 186.4 192.1 0.9 0.5 0.8 0.5Solomon Islands 418.6 470.1 528.0 606.8 2.3 2.3 2.3 2.3Timor–Leste 779.0 945.4 1,066.4 1,208.6 1.2 1.8 2.7 2.1Tongac 99.1 101.2 102.8 104.0 0.4 0.4 0.2 0.2Tuvalu 9.5 10.3 11.1 11.3 1.3 3.1 0.5 1.2Vanuatu 191.7 217.8 245.4 283.4 2.7 2.6 2.7 2.2
Developed Member Economies 149.7 152.1 154.5 155.8 0.2 0.2 0.3 0.3Australia 19.0 20.2 22.0 24.1 1.2 1.2 1.6 1.4Japan 126.8 127.8 128.1 127.0 0.2 0.0 0.0 0.0New Zealand 3.9 4.1 4.4 4.7 0.6 1.1 1.1 2.1
DEVELOPING MEMBER ECONOMIESe 3,290.4 3,491.2 3,685.8 3,935.9 1.3 1.1 1.2 1.0REGIONAL MEMBERSe 3,440.1 3,643.3 3,840.2 4,091.7 1.2 1.1 1.1 1.0WORLD 6,145.0 6,542.2 6,958.2 7,467.0 1.3 1.3 1.2 1.1
0.0 = magnitude is less than half of unit employed, Lao PDR = Lao People’s Democratic Republic.
a Population figures are as of 1 January for Georgia and the Kyrgyz Republic, 1 May for Afghanistan, 30 September for the Federated States of Micronesia, 1 October for India and Myanmar, 7 November for Kiribati, and 31 December for the People’s Republic of China.
b As of 1 March for 2000.c For 2016, refers to 2015 population.d Population figures for the Pacific developing member economies are in thousands while the regional total for the Pacific are in millions.e For reporting economies only.f The annual population growth rate is calculated as the percentage change of the population between the reference year and the year prior to the reference year. For example,
the population growth rates under the column heading “2016” refers to the population growth between 2015 and 2016. Sources: Economy sources; United Nations Population Division, Department of Economic and Social Affairs. 2017 Revision of World Population Prospects. https://esa.
un.org/unpd/wpp/ (accessed 25 July 2017).

118 Key Indicators for Asia and the Pacific 2017Population
Table 1.2: Migration and Urbanization
Regional MemberNet International Migration Ratea
(per 1,000 population)Urban Population
(as % of total population)2000–2005 2005–2010 2010–2015 2015–2020 2000 2005 2010 2016
Developing Member Economies Central and West Asia
Afghanistan 8.2 –5.8 2.9 –1.7 20.0 20.3 21.9 23.7Armenia –10.6 –12.5 –2.1 –1.7 64.8 64.0 63.5 63.6Azerbaijan 0.9 1.2 0.0 0.0 51.1 52.5 53.0 53.0Georgia –12.1 –13.7 –14.9 –2.5 52.0 52.2 53.0 57.2Kazakhstan 0.6 –0.4 1.9 – 56.5 57.1 54.5 57.2Kyrgyz Republic –6.9 –2.9 –4.9 –3.3 34.7 34.8 34.1 32.6Pakistan –0.9 –1.7 –1.3 –1.1 33.2 34.6 36.3 39.9Tajikistan –2.5 –2.0 –2.5 –2.2 26.6 26.4 26.4 26.4 (2015)Turkmenistan –5.4 –2.5 –1.9 –0.9 45.9 47.0 48.4 50.4Uzbekistan –1.9 –1.0 –0.4 –0.3 37.2 36.1 51.3 50.7
East AsiaChina, People’s Rep. of –0.3 –0.4 –0.2 –0.2 36.2 43.0 50.0 57.4Hong Kong, China 1.9 2.6 2.1 4.0 100.0 100.0 100.0 100.0Korea, Rep. of 0.3 –0.6 0.7 0.8 79.6 81.3 81.9 82.6Mongolia –1.2 –1.1 –1.1 –1.0 56.6 61.9 69.2 68.9Taipei,Chinab 1.8 ... 1.5 1.3 55.8 57.7 59.3 61.0
South AsiaBangladesh –2.2 –4.8 –3.2 –2.8 23.1 24.2 25.9 34.9Bhutan 9.4 4.9 2.6 0.0 21.0 30.9 34.8 39.5India –0.4 –0.5 –0.4 –0.4 27.7 28.8 29.9 31.0 (2015)Maldives 9.2 10.5 11.2 4.4 27.0 35.0 (2006) 40.5 ...Nepal –6.5 –7.8 –2.7 –2.4 14.1 14.6 17.1 19.6Sri Lanka –4.7 –5.2 –4.7 –4.3 14.6 (2001) 15.2 18.2 (2012) 19.3
Southeast AsiaBrunei Darussalam 1.9 –1.1 1.0 0.8 71.2 73.5 75.5 77.5Cambodia –0.6 –4.3 –2.0 –1.9 18.6 19.5 20.0 20.9Indonesia –0.8 –0.6 –0.7 –0.6 42.0 45.9 49.9 53.7 (2015)Lao PDR –5.3 –3.7 –5.5 –2.1 22.0 27.4 33.1 39.7Malaysia 5.3 5.3 5.3 1.6 62.9 66.5 71.0 74.8Myanmar –5.3 –5.9 –1.8 –0.4 27.0 28.9 31.4 29.2 (2015)Philippines –2.7 –3.3 –1.3 –1.2 47.1 46.6 45.3 44.3Singapore 20.7 18.8 12.7 10.4 100.0 100.0 100.0 100.0Thailand 1.2 0.2 0.5 0.3 31.1 32.5 42.0 44.5 (2013)Viet Nam –1.6 –2.0 –0.4 –0.4 24.2 27.1 30.5 33.9 (2015)
The PacificCook Islands ... ... ... ... 65.2 71.0 73.3 74.8Fiji –15.1 –6.8 –6.6 –4.4 47.9 49.9 51.8 53.7 (2015)Kiribati –4.6 –1.2 –4.0 –3.6 47.5 49.1 54.1 57.1 (2015)Marshall Islands ... ... ... ... 68.4 69.9 71.3 72.7 (2015)Micronesia, Fed. States of –24.1 –23.1 –15.8 –11.3 22.3 22.3 22.3 22.4Nauru ... ... ... ... 100.0 100.0 100.0 100.0Palau ... ... ... ... 69.5 77.4 77.0 ...Papua New Guinea – – – – 13.2 13.1 13.0 13.0Samoa –17.7 –16.8 –13.4 –12.7 22.0 21.2 20.1 19.0Solomon Islands –2.2 –4.8 –4.3 –3.9 15.8 17.8 20.0 22.8Timor–Leste 0.8 –17.6 –8.5 –7.6 24.3 26.3 29.5 28.9Tonga –16.3 –16.0 –15.4 –8.9 23.0 23.2 23.4 23.8Tuvalu ... ... ... ... 46.0 49.7 54.8 60.6Vanuatu –0.5 1.0 0.5 0.4 21.7 23.5 24.4 26.4
Developed Member EconomiesAustralia 5.9 10.6 8.0 6.9 84.1 (2001) 84.6 85.2 85.8Japan 0.3 0.4 0.6 0.4 78.6 86.0 90.5 93.9New Zealand 6.7 2.9 4.0 3.2 85.7 86.1 86.2 86.4
... = data not available at cutoff date, 0.0 = magnitude is less than half of unit employed, – = magnitude equals zero, Lao PDR = Lao People’s Democratic Republic.
a Refers to annual average.b For urban population, refers to localities of 100,000 or more inhabitants.
Sources: Economy sources; United Nations Population Division, Department of Economic and Social Affairs. 2014 Revision of World Urbanization Prospects—Data Query. https://esa.un.org/unpd/wup/DataQuery/ (accessed 14 July 2017).

119PeopleRegional Trends and Tables
Population
Table 1.3: Population Aged 0–14 Years and Aged 15–64 Yearsa (% of total population)
Regional MemberAged 0–14 Years Aged 15–64 Years
2000 2005 2010 2016 2000 2005 2010 2016Developing Member Economies Central and West Asia 39.3 36.5 34.8 33.9 56.2 58.8 60.6 61.5
Afghanistan 48.6 47.6 47.8 43.9 49.2 50.2 49.9 53.6Armenia 25.8 21.5 19.5 19.9 64.2 66.6 69.5 69.0Azerbaijan 31.1 26.2 22.8 23.2 63.0 67.2 71.3 71.0Georgia 22.6 19.5 18.0 18.9 65.0 66.2 67.7 66.3Kazakhstan 27.6 24.5 24.0 27.4 65.6 67.8 69.1 65.8Kyrgyz Republic 34.9 31.0 29.9 31.5 59.6 63.4 65.6 64.1Pakistan 41.1 38.2 36.2 34.9 54.8 57.6 59.4 60.6Tajikistan 42.5 38.1 35.7 35.2 53.9 58.0 60.8 61.4Turkmenistan 36.3 32.6 29.5 30.8 59.5 62.8 66.3 65.0Uzbekistan 37.3 32.6 29.1 28.0 58.1 62.6 66.4 67.7
East Asia 24.4 19.8 17.7 17.5 68.6 72.4 73.7 72.2China, People’s Rep. of 24.6 19.9 17.8 17.7 68.5 72.4 73.8 72.2Hong Kong, China 16.9 14.4 11.9 11.2 72.1 73.4 75.1 73.0Korea, Rep. of 20.6 18.8 16.1 13.7 72.2 72.3 73.2 72.9Mongolia 34.8 28.9 27.0 29.3 61.5 67.3 69.2 66.7Taipei,China 21.4 19.2 16.1 13.6 70.1 71.2 73.2 73.6
South Asia 35.0 33.0 31.1 28.3 60.7 62.3 63.8 65.9Bangladesh 37.1 34.4 32.1 28.9 59.1 61.3 63.2 66.0Bhutan 41.4 34.9 30.6 26.9 55.1 61.3 65.3 68.3India 34.7 32.8 30.9 28.2 60.9 62.4 64.0 66.0Maldives 40.7 31.6 25.5 23.4 55.6 64.2 70.1 72.5Nepal 41.0 39.7 37.0 31.7 55.2 56.0 58.1 62.7Sri Lanka 26.8 25.6 25.4 24.3 67.0 67.6 67.3 66.0
Southeast Asia 31.8 29.9 28.0 26.5 63.3 64.9 66.6 67.4Brunei Darussalam 30.6 27.8 26.0 23.4 67.0 69.2 70.6 72.3Cambodia 41.6 37.1 33.3 31.4 55.3 59.5 62.9 64.4Indonesia 30.7 30.0 29.0 27.7 64.6 65.2 66.2 67.1Lao PDR 43.4 40.3 36.3 33.3 53.1 56.1 60.0 62.8Malaysia 33.4 30.5 27.9 24.6 62.7 65.1 67.1 69.3Myanmar 32.1 30.9 30.0 27.4 63.0 64.3 65.1 67.1Philippines 38.5 37.1 33.9 32.0 58.3 59.4 62.0 63.3Singapore 21.5 19.1 17.3 15.2 71.2 72.6 73.6 72.5Thailand 24.0 21.3 19.2 17.7 69.5 70.9 71.9 71.4Viet Nam 31.7 27.2 23.7 23.1 61.9 66.3 69.8 70.0
The Pacific 40.5 39.5 38.3 36.6 56.3 57.1 58.1 59.5Cook Islands 34.7 31.4 28.0 26.7 59.1 61.3 64.0 66.7Fiji 35.0 30.5 29.0 28.6 61.5 65.4 66.2 65.4Kiribati 40.0 36.9 36.1 34.8 56.7 59.5 60.4 61.4Marshall Islands 42.3 41.3 41.8 39.3 55.5 56.5 55.9 57.1Micronesia, Fed. States of 40.3 38.8 36.9 33.6 56.0 57.2 59.3 61.9Nauru 40.1 37.1 35.6 40.0 58.6 61.2 63.1 60.0Palau 23.9 24.1 20.5 21.1 70.7 70.2 73.7 68.4Papua New Guinea 39.7 39.1 38.3 36.3 57.1 57.6 58.3 60.0Samoa 40.7 39.6 38.3 36.9 54.8 55.6 56.7 57.7Solomon Islands 41.9 41.3 40.8 39.2 55.2 55.7 55.9 57.3Timor–Leste 50.4 49.2 45.6 43.7 47.4 48.3 51.3 52.7Tonga 38.4 38.2 37.4 36.3 55.8 55.8 56.8 57.9Tuvalu 37.1 34.3 32.0 33.3 57.0 60.1 62.7 58.3Vanuatu 41.5 39.7 38.2 36.1 55.2 57.0 57.9 59.6
Developed Member Economies 15.8 14.8 14.4 14.1 68.0 66.6 64.7 61.5Australia 20.9 19.8 19.0 18.9 66.8 67.3 67.5 65.8Japan 14.8 13.8 13.4 12.9 68.2 66.5 64.1 60.5New Zealand 22.7 21.5 20.5 19.8 65.5 66.4 66.4 65.2
DEVELOPING MEMBER ECONOMIES 30.5 27.6 25.8 24.4 64.0 66.4 67.8 68.2REGIONAL MEMBERS 29.9 27.1 25.3 24.0 64.2 66.4 67.7 67.9WORLD 30.2 28.0 26.7 26.2 63.0 64.7 65.7 65.7
Lao PDR = Lao People’s Democratic Republic.
a For 2016, the United Nations Population Division projected the economies’ population based on the medium-fertility variant where fertility is above 2.5 children per woman in 2010–2015 censuses.
Sources: United Nations Department of Economic and Social Affairs, Population Division. World Population Prospects, The 2017 Revision. https://esa.un.org/unpd/wpp/ (accessed 26 June 2017); for the Cook Islands, Kiribati, the Marshall Islands, Nauru, Palau, and Tuvalu: Statistics for Development Division. http://sdd.spc.int/en/ (accessed June 2015).

120 Key Indicators for Asia and the Pacific 2017Population
Table 1.4: Population Aged 65 Years and Over and Age Dependency Ratioa
Regional MemberAged 65 Years and Over
(% of total population) Age Dependency Ratio2000 2005 2010 2016 2000 2005 2010 2016
Developing Member Economies Central and West Asia 4.5 4.7 4.6 4.6 78.0 70.0 65.0 62.6
Afghanistan 2.2 2.2 2.3 2.5 103.3 99.0 100.4 86.6Armenia 10.0 11.9 11.0 11.1 55.8 50.1 43.8 44.9Azerbaijan 5.8 6.6 5.9 5.8 58.7 48.8 40.3 40.9Georgia 12.4 14.3 14.3 14.7 53.9 51.1 47.8 50.8Kazakhstan 6.8 7.7 6.8 6.8 52.4 47.4 44.6 52.1Kyrgyz Republic 5.5 5.6 4.5 4.4 67.9 57.7 52.5 55.9Pakistan 4.1 4.3 4.4 4.5 82.4 73.6 68.4 65.0Tajikistan 3.6 3.9 3.4 3.4 85.6 72.3 64.4 62.7Turkmenistan 4.3 4.6 4.1 4.2 68.2 59.2 50.7 53.8Uzbekistan 4.6 4.8 4.5 4.3 72.1 59.8 50.7 47.7
East Asia 7.0 7.8 8.5 10.3 45.7 38.1 35.6 38.5China, People’s Rep. of 6.9 7.7 8.4 10.1 46.1 38.1 35.6 38.5Hong Kong, China 11.0 12.3 13.0 15.8 38.6 36.2 33.2 36.9Korea, Rep. of 7.2 8.9 10.7 13.4 38.5 38.3 36.6 37.1Mongolia 3.7 3.7 3.8 3.9 62.5 48.5 44.4 49.8Taipei,China 8.5 9.6 10.7 12.8 42.7 40.4 36.5 35.8
South Asia 4.4 4.7 5.1 5.8 64.9 60.6 56.6 51.7Bangladesh 3.8 4.3 4.7 5.1 69.2 63.1 58.2 51.5Bhutan 3.5 3.8 4.2 4.8 81.4 63.2 53.2 46.5India 4.4 4.8 5.1 5.8 64.3 60.1 56.3 51.5Maldives 3.7 4.3 4.5 4.1 79.9 55.9 42.7 38.0Nepal 3.8 4.3 4.9 5.6 81.0 78.4 72.2 59.5Sri Lanka 6.2 6.8 7.3 9.7 49.2 48.0 48.7 51.5
Southeast Asia 4.9 5.2 5.5 6.1 57.9 54.1 50.2 48.3Brunei Darussalam 2.4 3.0 3.4 4.3 49.4 44.5 41.6 38.3Cambodia 3.1 3.4 3.7 4.3 80.7 67.9 58.9 55.4Indonesia 4.7 4.8 4.8 5.2 54.8 53.5 51.1 48.9Lao PDR 3.6 3.7 3.7 4.0 88.5 78.4 66.6 59.3Malaysia 3.9 4.4 4.9 6.1 59.4 53.5 49.0 44.3Myanmar 4.8 4.8 4.9 5.5 58.6 55.6 53.6 49.0Philippines 3.3 3.5 4.1 4.7 71.6 68.2 61.4 57.9Singapore 7.3 8.2 9.0 12.3 40.5 37.7 35.8 38.0Thailand 6.5 7.8 8.9 11.0 43.9 41.0 39.1 40.1Viet Nam 6.4 6.6 6.6 6.9 61.5 50.9 43.3 42.9
The Pacific 3.1 3.3 3.6 4.0 77.5 75.0 72.1 68.2Cook Islands 6.2 7.3 8.0 6.7 69.3 63.1 56.2 50.0Fiji 3.4 4.1 4.8 6.0 62.5 53.0 51.1 53.0Kiribati 3.3 3.6 3.5 3.8 76.3 68.0 65.6 62.9Marshall Islands 2.1 2.2 2.3 3.6 80.0 76.9 78.8 75.0Micronesia, Fed. States of 3.7 4.0 3.8 4.6 78.7 74.8 68.8 61.6Nauru 1.3 1.7 1.3 0.0 70.7 63.4 58.5 66.7Palau 5.4 5.7 5.8 10.5 41.4 42.5 35.7 46.2Papua New Guinea 3.2 3.3 3.4 3.7 75.1 73.7 71.5 66.7Samoa 4.5 4.8 5.1 5.5 82.5 79.9 76.5 73.4Solomon Islands 2.8 3.0 3.3 3.5 81.0 79.6 78.8 74.5Timor–Leste 2.2 2.6 3.1 3.5 111.1 107.1 94.9 89.6Tonga 5.7 6.0 5.9 5.8 79.1 79.2 76.1 72.8Tuvalu 5.9 5.6 5.3 8.3 75.4 66.5 59.5 71.4Vanuatu 3.3 3.3 3.9 4.3 81.2 75.4 72.9 67.8
Developed Member Economies 16.3 18.6 20.9 24.5 47.1 50.1 54.6 62.7Australia 12.3 12.9 13.4 15.3 49.7 48.6 48.1 51.9Japan 17.0 19.7 22.5 26.6 46.6 50.3 55.9 65.3New Zealand 11.8 12.1 13.1 15.0 52.7 50.6 50.5 53.4
DEVELOPING MEMBER ECONOMIES 5.5 6.0 6.4 7.4 56.3 50.6 47.5 46.7REGIONAL MEMBERS 6.0 6.5 7.0 8.1 55.8 50.6 47.7 47.3WORLD 6.8 7.3 7.6 8.1 58.7 54.6 52.3 52.2
Lao PDR = Lao People’s Democratic Republic.
a For 2016, the United Nations Population Division projected the economies’ population based on the medium-fertility variant where fertility is above 2.5 children per woman in 2010–2015 censuses.
Sources: United Nations Department of Economic and Social Affairs, Population Division. World Population Prospects, The 2017 Revision. https://esa.un.org/unpd/wpp/ (accessed 26 June 2017); for the Cook Islands, Kiribati, the Marshall Islands, Nauru, Palau, and Tuvalu: Statistics for Development Division. http://sdd.spc.int/en/ (accessed June 2015).

121PeopleRegional Trends and Tables
Labor Force and Employment
Table 1.5: Labor Force Participation Rate a (%)
Regional Member 2000 2005 2010 2011 2012 2013 2014 2015 2016Developing Member Economies Central and West Asia
Afghanistan 50.6 51.7 51.3 51.5 51.7 52.1 52.4 52.5 52.5Armenia 61.4 57.7 61.2 63.0 62.7 63.4 63.1 62.5 61.0Azerbaijan 77.6 68.4 64.8 64.5 64.5 64.7 65.1 65.4 66.0Georgia 65.2 64.0 64.2 65.2 66.9 66.2 66.5 67.8 67.5Kazakhstan 66.0 69.4 71.2 71.6 71.7 71.7 70.7 71.1 70.0Kyrgyz Republic 64.9 64.9 64.1 64.8 64.2 62.5 62.7 62.9 63.1Pakistan 29.0 30.4 33.0 33.0 32.8 32.9 32.3 32.3 ...Tajikistan 56.3 55.0 50.3 49.4 48.9 48.6 47.8 48.0 ...Turkmenistan 60.5 60.5 60.6 60.9 61.2 61.5 61.8 62.0 62.1Uzbekistan 59.0 59.2 60.6 60.9 61.1 61.4 61.6 61.8 62.0
East AsiaChina, People’s Rep. of 77.5 73.5 70.9 70.9 70.9 71.0 71.0 70.9 70.8Hong Kong, China 61.4 60.9 59.6 60.1 60.5 61.2 61.1 61.1 61.1Korea, Rep. of 61.2 62.0 61.0 61.1 61.3 61.5 62.4 62.6 62.8Mongolia 62.9 63.5 61.6 62.5 63.5 61.9 62.1 61.5 60.5Taipei,China 57.7 57.8 58.1 58.2 58.4 58.4 58.5 58.7 58.8
South AsiaBangladesh 54.9 58.5 (2006) 59.3 ... ... 57.1 ... ... 58.5Bhutan 56.5 (2001) 60.4 68.6 67.4 64.4 65.3 62.6 63.1 ...India 37.6 39.2 37.4 (2009) 36.4 ... ... ... ... ...Maldives 54.3 62.4 65.7 66.2 66.6 67.1 67.6 68.0 68.3Nepal 85.8 84.6 83.4 83.3 83.2 83.1 83.0 83.0 83.0Sri Lanka 50.3 49.3 48.6 52.9 52.5 53.7 53.2 53.8 53.8
Southeast AsiaBrunei Darussalam 67.9 (2001) ... ... 68.9 ... ... 65.6 ... ...Cambodia 65.2 74.6 (2004) 87.0 87.5 84.2 83.0 82.6 ... ...Indonesia 67.8 66.8 67.7 66.8 67.8 66.8 66.6 65.8 ...Lao PDR 79.9 (2001) 66.6 79.2 ... ... ... ... ... ...Malaysia 65.4 63.3 63.7 64.5 65.6 67.3 67.6 67.9 67.7Myanmar ... ... ... ... ... ... 63.4 64.7 ...Philippines 64.9 65.1 64.1 64.6 64.2 63.9 64.4 63.7 63.5Singaporeb 63.2 63.0 66.2 66.1 66.6 66.7 67.0 68.3 68.0Thailandc 71.5 72.5 72.3 72.1 71.8 71.1 70.3 69.8 68.8Viet Nam 49.6 52.5 77.4 77.0 76.8 77.5 77.7 77.8 77.3
The PacificCook Islandsd 69.0 (2001) 70.2 (2006) ... 71.0 ... ... ... ... ...Fiji 57.4 56.2 54.9 54.8 54.7 54.6 54.4 54.3 54.3Kiribati 80.9 63.6 59.3 ... ... ... ... 66.0 ...Marshall Islands 51.1 51.1 ... 41.7 ... ... ... ... ...Micronesia, Fed. States of 58.6 ... 57.3 ... ... ... ... ... ...Nauru ... 75.8 (2006) ... 64.0 ... ... ... ... ...Palaue 67.5 69.1 ... ... 68.1 ... ... 77.4 ...Papua New Guinea 72.2 72.9 71.7 71.3 70.8 70.6 70.3 70.3 70.4Samoa 50.6 (2001) 49.8 (2006) ... 41.3 ... ... ... ... ...Solomon Islands ... ... 62.7 (2009) ... ... ... ... ... ...Timor–Leste 56.0 (2001) 60.2 (2004) 41.7 ... ... 30.6 ... ... ...Tonga ... 94.8 (2003) ... ... ... ... ... ... ...Tuvalu 58.2 (2002) ... ... ... 59.4 ... ... ... ...Vanuatu 77.0 73.6 71.0 71.1 71.1 71.1 71.0 71.0 71.0
Developed Member EconomiesAustralia 63.1 64.4 65.4 65.4 65.1 64.9 64.7 64.9 64.7Japan 62.4 60.4 59.6 59.3 59.1 59.3 59.4 59.6 60.0New Zealand 65.2 67.7 68.0 68.3 68.0 68.2 68.9 69.0 70.6
... = data not available at cutoff date, Lao PDR = Lao People’s Democratic Republic.
a Based on labor force concepts and definitions of the economy, and thus may vary.b Refers to Singapore residents only.c Includes seasonally inactive labor force.d Covers all wage and salary earners from all islands.e Includes members of the armed forces on active duty.
Sources: Economy sources; for Afghanistan, the People’s Republic of China, Fiji, the Kyrgyz Republic, Maldives, Nepal, Papua New Guinea, Turkmenistan, Uzbekistan, and Vanuatu: International Labour Organization. ILOSTAT. http://www.ilo.org/ilostat/ (accessed 21 June 2017); for Nauru and Tuvalu: Secretariat of the Pacific Community. National Minimum Development Indicator Database. http://www.spc.int/nmdi/ (accessed 21 June 2017).

122 Key Indicators for Asia and the Pacific 2017Labor Force and Employment
Table 1.6: Employment in Agriculture, Industry, and Servicesa (% of total employment)
Regional MemberAgriculture
2000 2005 2010 2016Developing Member Economies Central and West Asia
Afghanistan 69.6 (2001) 69.6 (2004) ... 39.5Armenia 44.4 46.2 38.6 33.6Azerbaijan 39.1 38.7 38.2 36.3Georgia 52.8 (2001) 54.3 52.2 49.1Kazakhstan 31.4 31.9 28.3 16.2Kyrgyz Republic 53.1 38.5 31.2 29.3 (2015)Pakistan 48.4 43.0 45.0 42.3 (2015)Tajikistan 65.0 67.5 65.9 64.9 (2015)Turkmenistanb 47.6 48.2 (2004) ... ...Uzbekistan 34.4 29.1 26.8 27.7
East AsiaChina, People's Rep. ofc 50.0 44.8 36.7 27.7Hong Kong, China 0.3 0.3 0.0 0.0Korea, Rep. of 10.6 7.9 6.6 4.9Mongolia 48.6 39.9 33.5 30.4Taipei,China 7.8 5.9 5.2 4.9
South AsiaBangladesh 50.8 48.1 (2006) 47.5 42.7Bhutan 46.5 (2001) 43.6 59.4 58.0 (2015)India 59.9 56.1 53.2 (2009) ...Maldivesd 13.7 15.9 (2007) 4.3 10.4 (2014)Nepal ... ... 65.6 (2011) ...Sri Lankae 36.0 32.8 32.5 28.7 (2015)
Southeast AsiaBrunei Darussalam ... ... ... ...Cambodia 73.7 60.3 72.3 64.3 (2014)Indonesia 45.3 44.0 38.3 32.9 (2015)Lao PDR 82.7 (2001) 76.3 72.2 ...Malaysia 16.7 14.6 13.6 11.4Myanmar ... ... ... 53.2 (2015)Philippines 37.1 35.7 33.2 27.0Singaporef 0.1 0.1 0.2 0.1Thailand 44.2 38.6 38.2 31.2Viet Namg 65.1 55.1 49.5 41.8
The PacificCook Islandsh 7.2 (2001) 4.9 (2006) 4.3 (2011) ...Fiji i 1.5 1.1 1.7 40.8 (2014)Kiribati j ... 2.7 22.1 24.3 (2015)Marshall Islands 20.5 ... 11.0 ...Micronesia, Fed. States of 52.2 ... ... ...Nauru ... ... ... ...Palau 7.1 7.8 ... 6.4 (2015)Papua New Guinea ... ... ... ...Samoa 39.9 (2001) 35.4 (2006) 37.0 (2011) ...Solomon Islands k ... ... 41.5 (2009) ...Timor–Leste ... ... 51.0 40.5 (2013)Tonga ... 27.9 (2006) ... ...Tuvalu ... ... ... ...Vanuatu ... ... ... ...
Developed Member EconomiesAustralia 4.8 3.6 3.2 2.6Japan 5.1 4.4 4.0 3.4New Zealand 8.8 6.9 6.7 6.3

123PeopleRegional Trends and Tables
Labor Force and Employment
Table 1.6: Employment in Agriculture, Industry, and Servicesa (continued) (% of total employment)
Regional MemberIndustry
2000 2005 2010 2016Developing Member Economies Central and West Asia
Afghanistan 6.2 (2001) 6.2 (2004) ... 14.8Armenia 20.6 15.9 17.4 15.8Azerbaijan 12.1 12.4 13.7 14.3Georgia 5.8 (2001) 3.8 6.5 6.7Kazakhstan 18.2 17.9 18.7 20.6Kyrgyz Republic 10.5 17.6 21.1 20.9 (2015)Pakistan 11.5 20.3 20.9 23.6 (2015)Tajikistan 9.1 8.7 7.9 6.7 (2015)Turkmenistanb 13.0 13.8 (2004) ... ...Uzbekistan 12.7 13.2 22.7 23.0
East AsiaChina, People's Rep. ofc 22.5 23.8 28.7 28.8Hong Kong, China 19.6 14.4 11.2 11.9Korea, Rep. of 20.4 26.6 24.9 24.9Mongolia 14.1 16.8 16.2 19.0Taipei,China 28.1 36.4 35.9 35.9
South AsiaBangladesh 13.1 14.6 (2006) 17.6 20.5Bhutan 5.6 (2001) 17.2 6.6 9.6 (2015)India 16.3 18.8 21.5 (2009) ...Maldivesd 19.0 27.9 (2007) 9.4 18.8 (2014)Nepal ... ... 9.8 (2011) ...Sri Lankae 23.6 25.4 24.6 25.8 (2015)
Southeast AsiaBrunei Darussalam ... ... ... ...Cambodia 7.0 9.7 9.2 9.0 (2014)Indonesia 17.4 18.8 19.3 21.8 (2015)Lao PDR 8.7 (2001) ... 8.1 ...Malaysia 32.5 29.7 27.8 27.5Myanmar ... ... ... 15.5 (2015)Philippines 16.2 15.4 15.0 17.5Singaporef 25.7 21.7 21.8 16.0Thailand 20.2 22.4 20.8 23.7Viet Namg 13.1 17.6 21.0 24.8
The PacificCook Islandsh 6.0 (2001) 14.2 (2006) 11.7 (2011) ...Fiji i 30.8 30.8 23.9 12.5 (2014)Kiribati j ... 3.2 16.1 18.2 (2015)Marshall Islands 7.8 ... 0.7 ...Micronesia, Fed. States of ... ... ... ...Nauru ... ... ... ...Palau 0.7 2.6 ... 11.7 (2015)Papua New Guinea ... ... ... ...Samoa 19.7 (2001) 21.8 (2006) 12.2 (2011) ...Solomon Islands k ... ... 13.0 (2009) ...Timor–Leste ... ... 8.8 12.7 (2013)Tonga ... 27.8 (2006) ... ...Tuvalu ... ... ... ...Vanuatu ... ... ... ...
Developed Member EconomiesAustralia 21.5 21.1 21.0 19.5Japan 31.2 27.5 25.4 24.3New Zealand 12.6 22.4 20.6 20.9

124 Key Indicators for Asia and the Pacific 2017Labor Force and Employment
Table 1.6: Employment in Agriculture, Industry, and Servicesa (continued) (% of total employment)
Regional MemberServices
2000 2005 2010 2016Developing Member Economies Central and West Asia
Afghanistan 24.2 (2001) 24.2 (2004) ... 45.7Armenia 35.0 37.8 44.0 50.6Azerbaijan 48.7 48.8 48.1 49.3Georgia 41.4 (2001) 41.9 41.3 44.2Kazakhstan 50.5 50.2 53.0 63.2Kyrgyz Republic 36.5 43.9 47.7 49.8 (2015)Pakistan 40.0 36.7 34.2 34.2 (2015)Tajikistan 26.0 23.9 26.3 28.4 (2015)Turkmenistanb 39.4 38.0 (2004) ... ...Uzbekistan 52.8 57.7 50.5 49.3
East AsiaChina, People's Rep. ofc 27.5 31.4 34.6 43.5Hong Kong, China 79.8 85.1 88.9 88.2Korea, Rep. of 69.0 65.4 68.5 70.2Mongolia 37.2 43.3 50.2 50.7Taipei,China 64.1 57.7 58.8 59.2
South AsiaBangladesh 36.2 37.6 (2006) 35.3 36.9Bhutan 47.9 (2001) 39.2 33.7 32.4 (2015)India 23.7 25.1 25.3 (2009) ...Maldivesd 67.3 56.2 (2007) ... 70.8 (2014)Nepal ... ... 24.6 (2011) ...Sri Lankae 40.3 41.8 42.9 45.6 (2015)
Southeast AsiaBrunei Darussalam ... ... ... ...Cambodia 19.3 30.0 18.6 26.6 (2014)Indonesia 37.3 37.3 42.3 45.3 (2015)Lao PDR 8.6 (2001) ... 19.7 ...Malaysia 50.8 55.6 58.7 61.1Myanmar ... ... ... 31.3 (2015)Philippines 46.7 48.1 51.8 55.6Singaporef 74.2 78.2 77.9 83.9Thailand 35.6 39.0 41.0 45.2Viet Namg 21.8 27.3 29.5 33.4
The PacificCook Islandsh 86.7 (2001) 80.9 (2006) 84.0 (2011) ...Fiji i 67.7 68.1 74.4 46.3 (2014)Kiribati j ... 30.7 61.7 57.5 (2015)Marshall Islands 72.3 ... 88.2 ...Micronesia, Fed. States of ... ... ... ...Nauru ... ... ... ...Palau 92.2 89.6 ... 82.0 (2015)Papua New Guinea ... ... ... ...Samoa 40.4 (2001) 42.8 (2006) 50.9 (2011) ...Solomon Islands k ... ... 44.8 (2009) ...Timor–Leste ... ... 39.8 46.7 (2013)Tonga ... 44.3 (2006) ... ...Tuvalu ... ... ... ...Vanuatu ... ... ... ...
Developed Member EconomiesAustralia 73.7 75.3 75.9 77.9Japan 63.7 68.1 70.5 72.2New Zealand ... 70.7 72.6 72.8
... = data not available at cutoff date, Lao PDR = Lao People’s Democratic Republic.
a Data are based labor force concepts and definitions adopted by economies. Some values may not sum to 100 due to limitations on data availability. b The labor force data series includes individuals who are not registered.c Refers to persons engaged in social labor and receiving remuneration payment or earning business income.d Data for 2000 refer to persons 12 years old and over, and for 2006 onward, 15 years old and over. Figures include local population only. e Some data may not add up because (i) data for 2005 and 2011–2013 cover all islands; (ii) data for 2003 exclude northern provinces; (iii) data for 2004 exclude Mullaitivu and
Kilinochchi districts; and (iv) data for 2006–2010 and years before 2003 exclude northern and eastern provinces.f Refers to Singapore residents only. g Refers to total number of persons engaged in any activity regardless of age.h Covers all wage and salary earners from all islands. i Refers to paid employment as of end of June, except for 2000 and 2005, which refer to end of December.j Refers to cash work and unpaid village work. For 2005, employment figures by industry include only paid (cash work) workers.k Figure for 2009 refers to paid employment.
Source: Economy sources.

125PeopleRegional Trends and Tables
Poverty Indicators
Table 1.7: Poverty and Inequalitya
Regional MemberProportion of Population below
$1.90 a Day (2011 PPP) (%)Proportion of Population Living
below $3.10 a Day (2011 PPP) (%)Income Ratio of Highest
20% to Lowest 20% bGini
Coefficient2000 Latest year 2000 Latest year 2000 Latest year 2000 Latest year
Developing Member Economies Central and West Asia
Afghanistan ... ... ... ... ... ... ... ...Armenia 19.3 (2001) 2.3 (2014) 53.1 (2001) 14.6 (2014) 5.7 (2001) 4.7 (2014) 0.354 (2001) 0.315 (2014)Azerbaijan 2.7 (2001) 0.5 (2008) 16.3 (2001) 2.5 (2008) 6.0 (2001) 4.8 (2008) 0.365 (2001) 0.318 (2008)Georgia 21.0 9.8 (2014) 45.1 25.3 (2014) 8.6 8.2 (2014) 0.405 0.401 (2014)Kazakhstan 10.5 (2001) 0.0 (2013) 31.2 (2001) 0.3 (2013) 6.2 (2001) 3.6 (2013) 0.354 (2001) 0.263 (2013)Kyrgyz Republic 42.2 1.3 (2014) 75.7 17.5 (2014) 4.7 3.7 (2014) 0.310 0.268 (2014)Pakistanc 28.7 (2001) 6.1 (2013) 70.0 (2001) 36.9 (2013) 4.3 (2001) 4.4 (2013) 0.304 (2001) 0.307 (2013)Tajikistan 30.8 (2003) 19.5 (2014) 64.8 (2003) 56.7 (2014) 5.2 (2003) 4.5 (2014) 0.327 (2003) 0.308 (2014)Turkmenistan ... ... ... ... ... ... ... ...Uzbekistand 68.1 ... 88.7 ... 6.1 ... 0.361 ...
East AsiaChina, People’s Rep. of e 32.0f (2002) 1.9f (2013) 56.4f (2002) 11.1f (2013) ... 9.2 (2012) ... 0.422 (2012)Hong Kong, China ... ... ... ... ... ... ... ...Korea, Rep. of g ... ... ... ... ... ... ... 0.302 (2014)Mongolia 10.6 (2002) 0.2 (2014) 33.6 (2002) 2.7 (2014) 5.4 (2002) 5.0 (2014) 0.329 (2002) 0.320 (2014)Taipei,Chinah ... ... ... ... ... ... 0.294 0.279 (2015)
South AsiaBangladesh 33.7 18.5 (2010) 70.1 56.8 (2010) 4.9 4.7 (2010) 0.334 0.321 (2010)Bhutan 35.2 (2003) 2.2 (2012) 60.9 (2003) 13.3 (2012) 9.9 (2003) 6.8 (2012) 0.468 (2003) 0.388 (2012)Indiac 38.2f (2004) 21.2f (2011) 73.5f (2004) 58.0f (2011) ... 5.3 (2011) ... 0.352 (2011)Maldivesc 10.0 (2002) 7.3 (2009) 36.5 (2002) 23.3 (2009) 7.2 (2002) 7.1 (2009) 0.413 (2002) 0.384 (2009)Nepalc 46.1 (2003) 15.0 (2010) 73.8 (2003) 48.4 (2010) 7.9 (2003) 5.0 (2010) 0.438 (2003) 0.328 (2010)Sri Lankac 8.3 (2002) 1.9 (2012) 33.9 (2002) 14.6 (2012) 7.1 (2002) 6.6 (2012) 0.410 (2002) 0.392 (2012)
Southeast AsiaBrunei Darussalam ... ... ... ... ... ... ... ...Cambodia 18.6 (2004) 2.2 (2012) 53.3 (2004) 21.6 (2012) 5.6 (2004) 4.4 (2012) 0.355 (2004) 0.308 (2012)Indonesia 39.8f 8.3f (2014) 78.5f 36.4f (2014) ... 6.6 (2013) ... 0.395 (2013)Lao PDRc 26.1 (2002) 16.7 (2012) 61.7 (2002) 46.9 (2012) 5.4 (2002) 6.3 (2012) 0.347 (2002) 0.379 (2012)Malaysia 0.4 (2004) 0.3 (2009) 2.3 (2004) 2.7 (2009) 11.0 (2004) 11.3 (2009) 0.461 (2004) 0.463 (2009)Myanmar ... ... ... ... ... ... ... ...Philippines 18.4 13.1 (2012) 43.1 37.6 (2012) 9.7 8.4 (2012) 0.462 0.430 (2012)Singapore ... ... ... ... ... ... ... ...Thailand 2.6 0.0 (2013) 17.0 0.9 (2013) 8.1 6.5 (2013) 0.428 0.379 (2013)Viet Nam 38.8 (2002) 3.1 (2014) 69.3 (2002) 12.0 (2014) 6.1 (2002) 6.8 (2014) 0.373 (2002) 0.376 (2014)
The PacificCook Islands ... ... ... ... ... ... ... ...Fijic 5.5 (2002) 4.1 (2008) 21.9 (2002) 18.5 (2008) 7.4 (2002) 8.2 (2008) 0.396 (2002) 0.428 (2008)Kiribati 14.1 (2006) ... 34.7 (2006) ... 7.2 (2006) ... 0.376 (2006) ...Marshall Islands ... ... ... ... ... ... ... ...Micronesia, Fed. States of 11.4 (2005) 17.4 (2013) 28.5 (2005) 39.4 (2013) 9.1 (2005) 9.6 (2013) 0.431 (2005) 0.425 (2013)Nauru ... ... ... ... ... ... ... ...Palau ... ... ... ... ... ... ... ...Papua New Guineac ... 39.3 (2009) ... 64.7 (2009) ... 10.4 (2009) ... 0.439 (2009)Samoa ... 0.8 (2008) ... 8.4 (2008) ... 7.9 (2008) ... 0.427 (2008)Solomon Islands 45.6 (2005) ... 69.3 (2005) ... 10.5 (2005) ... 0.461 (2005) ...Timor–Lestei 44.2 (2001) ... 72.8 (2001) ... 6.4 (2001) ... 0.376 (2001) ...Tonga 2.8 (2001) 1.1 (2009) 7.6 (2001) 8.2 (2009) 7.1 (2001) 6.9 (2009) 0.378 (2001) 0.381 (2009)Tuvalu ... 2.7 (2010) ... 16.3 (2010) ... 7.7 (2010) ... 0.411 (2010)Vanuatu ... 15.4 (2010) ... 38.8 (2010) ... 6.6 (2010) ... 0.372 (2010)
Developed Member EconomiesAustralia ... ... ... ... 5.9 (2001) 5.9 (2010) 0.341 (2001) 0.349 (2010)Japan ... ... ... ... ... 5.4 (2008) ... 0.321 (2008)New Zealand ... ... ... ... ... ... ... 0.333 (2012)... = data not available at cutoff date, Lao PDR = Lao People’s Democratic Republic, PPP = purchasing power parity.
a Data are consumption-based except for Malaysia, which is income-based. For the Gini coefficient, the data for the Republic of Korea and New Zealand are based on disposable income post taxes and transfers. The estimates for the Gini coefficient for Taipei,China are based on disposable income per capita.
b Derived from income or expenditure share of the highest 20% and lowest 20% groups. c Household income and expenditure surveys for these economies were conducted in overlapping years. The table adopts the approach of the World Bank’s World
Development Indicators of using the initial year of the survey as the reference period for the poverty estimates.d The latest available data for Uzbekistan is for 2003: 66.8% for proportion of population below $1.90 a day (2011 PPP); 87.8% for proportion of population below $3.10
a day (2011 PPP); 5.8 for income ratio of highest 20% to lowest 20%; and 0.353 for Gini coefficient.e The earliest available data for the People’s Republic of China is for 2008: 9.4 for income ratio of highest 20% to lowest 20%; and 0.428 for Gini coefficient. f Values are weighted average of urban and rural populations.g The earliest available data for the Gini coefficient using the new income definition for the Republic of Korea is for 2012: 0.307.h The Gini coefficient for Taipei,China reflected in the table refers to Gini coefficient using per capita disposable income. The estimates using disposable income
of households are 0.326 for 2000 and 0.338 for 2015. i The latest data for Timor–Leste is for 2007: 46.8% for proportion of population below $1.90 a day (2011 PPP); 80.0% for proportion of population below $3.10 a day
(2011 PPP); 4.6 for income ratio of highest 20% to lowest 20%; and 0.316 for Gini coefficient.
Sources: World Bank. PovcalNet Database. http://iresearch.worldbank.org/PovcalNet/index.htm (accessed 14 July 2017); World Bank. World Development Indicators. http://data.worldbank.org/data-catalog/world-development-indicators (accessed 12 July 2017); Organisation for Economic Co-operation and Development. Income Distribution and Poverty. http://stats.oecd.org/index.aspx?queryid=66670 (accessed 7 July 2017); for Taipei,China: Directorate- General of Budget, Accounting and Statistics. http://eng.dgbas.gov.tw/mp.asp?mp=2 (accessed 5 July 2017); Asian Development Bank estimates.

126 Key Indicators for Asia and the Pacific 2017Poverty Indicators
Table 1.8: Human Development Index
Regional Member 2000 2005 2010 2011 2012 2013 2014 2015 Rank in 2015a
Developing Member Economies Central and West Asia 0.573 0.618 0.653 0.659 0.665 0.671 0.676 0.678
Afghanistan 0.340 0.405 0.454 0.463 0.470 0.476 0.479 0.479 169Armenia 0.644 0.692 0.729 0.732 0.736 0.739 0.741 0.743 84Azerbaijan 0.642 0.682 0.741 0.742 0.745 0.752 0.758 0.759 78Georgia 0.673 0.714 0.742 0.749 0.755 0.759 0.768 0.769 70Kazakhstan 0.685 0.747 0.766 0.774 0.782 0.789 0.793 0.794 56Kyrgyz Republic 0.593 0.613 0.632 0.638 0.647 0.656 0.662 0.664 120Pakistan 0.450 0.501 0.525 0.529 0.538 0.542 0.548 0.550 147Tajikistan 0.535 0.579 0.608 0.613 0.617 0.622 0.625 0.627 129Turkmenistan ... ... 0.665 0.672 0.678 0.683 0.688 0.692 111Uzbekistan 0.594 0.626 0.664 0.673 0.681 0.690 0.697 0.701 105
East Asia 0.706 0.774 0.811 0.817 0.822 0.829 0.833 0.835China, People’s Rep. of 0.592 0.646 0.700 0.703 0.713 0.723 0.734 0.738 90Hong Kong, China 0.825 0.870 0.898 0.905 0.907 0.913 0.916 0.917 12Korea, Rep. of 0.820 0.860 0.884 0.889 0.891 0.896 0.899 0.901 18Mongolia 0.588 0.649 0.701 0.712 0.720 0.729 0.733 0.735 92Taipei,Chinab ... 0.846 0.873 0.874 0.879 0.882 0.882 0.885 ...
South Asia 0.536 0.572 0.606 0.616 0.623 0.630 0.636 0.639Bangladesh 0.468 0.506 0.545 0.557 0.565 0.570 0.575 0.579 139Bhutan ... ... 0.572 0.581 0.589 0.596 0.604 0.607 132India 0.494 0.536 0.580 0.590 0.599 0.607 0.615 0.624 131Maldives 0.587 0.622 0.663 0.675 0.683 0.693 0.701 0.701 105Nepal 0.446 0.476 0.529 0.538 0.545 0.551 0.555 0.558 144Sri Lanka 0.686 0.718 0.746 0.752 0.757 0.760 0.764 0.766 73
Southeast Asia 0.612 0.645 0.684 0.690 0.696 0.701 0.705 0.708Brunei Darussalam 0.819 0.837 0.846 0.852 0.860 0.863 0.864 0.865 30Cambodia 0.412 0.483 0.533 0.540 0.546 0.553 0.558 0.563 143Indonesia 0.604 0.632 0.662 0.669 0.677 0.682 0.686 0.689 113Lao PDR 0.463 0.503 0.542 0.554 0.563 0.573 0.582 0.586 138Malaysia 0.725 0.732 0.774 0.776 0.779 0.783 0.787 0.789 59Myanmar 0.427 0.474 0.526 0.533 0.540 0.547 0.552 0.556 145Philippines 0.622 0.646 0.669 0.666 0.671 0.676 0.679 0.682 116Singapore 0.820 0.839 0.911 0.917 0.920 0.922 0.924 0.925 5Thailand 0.649 0.686 0.720 0.729 0.733 0.737 0.738 0.740 87Viet Nam 0.576 0.618 0.655 0.662 0.668 0.675 0.678 0.683 115
The Pacific 0.585 0.603 0.630 0.634 0.637 0.639 0.639 0.641Cook Islands ... ... ... ... ... ... ... ... ...Fiji 0.683 0.695 0.709 0.714 0.719 0.727 0.734 0.736 91Kiribati ... 0.576 0.585 0.581 0.589 0.597 0.586 0.588 137Marshall Islands ... ... ... ... ... ... ... ... ...Micronesia, Fed. States of 0.604 0.622 0.638 0.640 0.641 0.639 0.637 0.638 127Nauru ... ... ... ... ... ... ... ... ...Palau 0.741 0.758 0.770 0.775 0.779 0.782 0.783 0.788 60Papua New Guinea 0.422 0.454 0.494 0.501 0.506 0.511 0.515 0.516 154Samoa 0.645 0.677 0.693 0.698 0.700 0.701 0.702 0.704 104Solomon Islands 0.442 0.470 0.497 0.505 0.509 0.512 0.514 0.515 156Timor–Leste 0.470 0.511 0.607 0.618 0.620 0.612 0.603 0.606 133Tonga 0.674 0.695 0.712 0.717 0.718 0.716 0.718 0.721 101Tuvalu ... ... ... ... ... ... ... ... ...Vanuatu ... 0.572 0.591 0.592 0.591 0.596 0.598 0.597 134
Developed Member Economies 0.874 0.892 0.904 0.908 0.912 0.915 0.917 0.919Australia 0.899 0.915 0.927 0.930 0.933 0.936 0.937 0.939 2Japan 0.856 0.873 0.884 0.889 0.894 0.899 0.902 0.903 17New Zealand 0.868 0.888 0.901 0.904 0.908 0.910 0.913 0.915 13
... = data not available at cutoff date, Lao PDR = Lao People’s Democratic Republic.
a Rank among the 188 economies classified in United Nations Development Programme. Human Development Report 2016. New York.b Obtained from statistics bureau of Taipei,China.
Sources: United Nations Development Programme. Human Development Data (1990–2015). http://hdr.undp.org/en/data# (accessed 8 July 2017); for Taipei,China: Directorate General of Budget, Accounting and Statistics. http://eng.stat.gov.tw/ct.asp?xItem=25280&ctNode=6032&mp=5 (accessed 8 July 2017).
127PeopleRegional Trends and Tables
Social Indicators
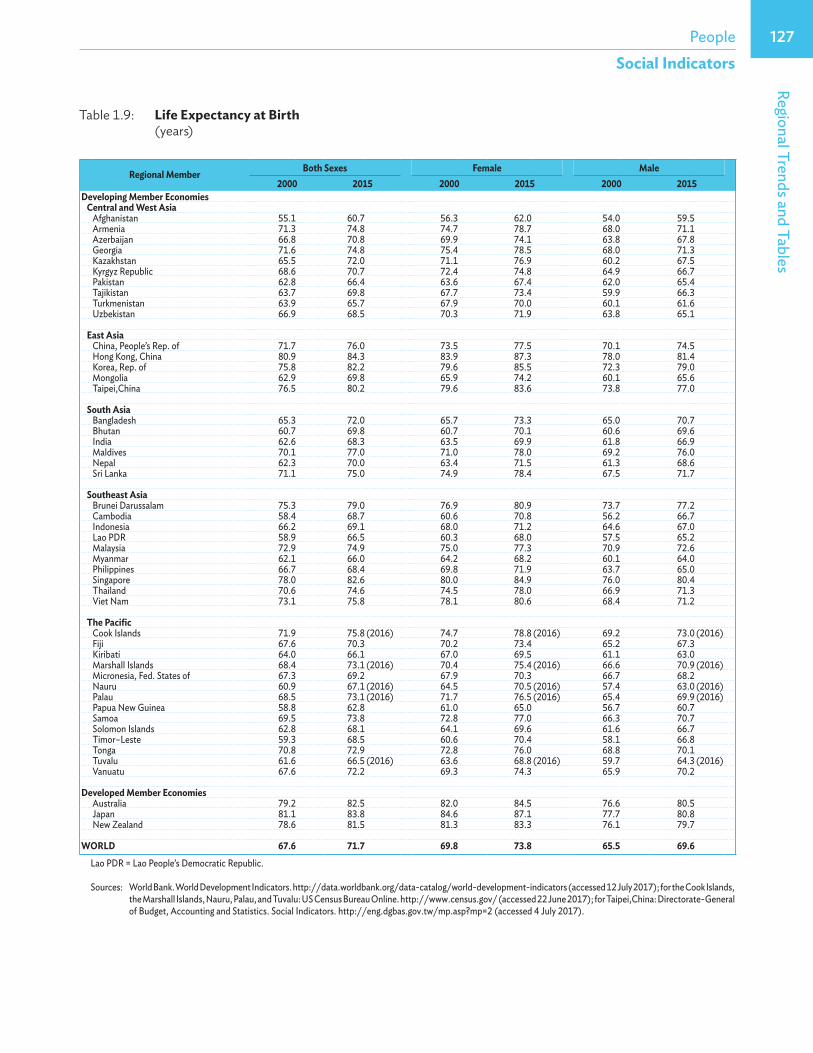
Table 1.9: Life Expectancy at Birth (years)
Regional Member Both Sexes Female Male2000 2015 2000 2015 2000 2015
Developing Member Economies Central and West Asia
Afghanistan 55.1 60.7 56.3 62.0 54.0 59.5Armenia 71.3 74.8 74.7 78.7 68.0 71.1Azerbaijan 66.8 70.8 69.9 74.1 63.8 67.8Georgia 71.6 74.8 75.4 78.5 68.0 71.3Kazakhstan 65.5 72.0 71.1 76.9 60.2 67.5Kyrgyz Republic 68.6 70.7 72.4 74.8 64.9 66.7Pakistan 62.8 66.4 63.6 67.4 62.0 65.4Tajikistan 63.7 69.8 67.7 73.4 59.9 66.3Turkmenistan 63.9 65.7 67.9 70.0 60.1 61.6Uzbekistan 66.9 68.5 70.3 71.9 63.8 65.1
East AsiaChina, People’s Rep. of 71.7 76.0 73.5 77.5 70.1 74.5Hong Kong, China 80.9 84.3 83.9 87.3 78.0 81.4Korea, Rep. of 75.8 82.2 79.6 85.5 72.3 79.0Mongolia 62.9 69.8 65.9 74.2 60.1 65.6Taipei,China 76.5 80.2 79.6 83.6 73.8 77.0
South AsiaBangladesh 65.3 72.0 65.7 73.3 65.0 70.7Bhutan 60.7 69.8 60.7 70.1 60.6 69.6India 62.6 68.3 63.5 69.9 61.8 66.9Maldives 70.1 77.0 71.0 78.0 69.2 76.0Nepal 62.3 70.0 63.4 71.5 61.3 68.6Sri Lanka 71.1 75.0 74.9 78.4 67.5 71.7
Southeast AsiaBrunei Darussalam 75.3 79.0 76.9 80.9 73.7 77.2Cambodia 58.4 68.7 60.6 70.8 56.2 66.7Indonesia 66.2 69.1 68.0 71.2 64.6 67.0Lao PDR 58.9 66.5 60.3 68.0 57.5 65.2Malaysia 72.9 74.9 75.0 77.3 70.9 72.6Myanmar 62.1 66.0 64.2 68.2 60.1 64.0Philippines 66.7 68.4 69.8 71.9 63.7 65.0Singapore 78.0 82.6 80.0 84.9 76.0 80.4Thailand 70.6 74.6 74.5 78.0 66.9 71.3Viet Nam 73.1 75.8 78.1 80.6 68.4 71.2
The PacificCook Islands 71.9 75.8 (2016) 74.7 78.8 (2016) 69.2 73.0 (2016)Fiji 67.6 70.3 70.2 73.4 65.2 67.3Kiribati 64.0 66.1 67.0 69.5 61.1 63.0Marshall Islands 68.4 73.1 (2016) 70.4 75.4 (2016) 66.6 70.9 (2016)Micronesia, Fed. States of 67.3 69.2 67.9 70.3 66.7 68.2Nauru 60.9 67.1 (2016) 64.5 70.5 (2016) 57.4 63.0 (2016)Palau 68.5 73.1 (2016) 71.7 76.5 (2016) 65.4 69.9 (2016)Papua New Guinea 58.8 62.8 61.0 65.0 56.7 60.7Samoa 69.5 73.8 72.8 77.0 66.3 70.7Solomon Islands 62.8 68.1 64.1 69.6 61.6 66.7Timor–Leste 59.3 68.5 60.6 70.4 58.1 66.8Tonga 70.8 72.9 72.8 76.0 68.8 70.1Tuvalu 61.6 66.5 (2016) 63.6 68.8 (2016) 59.7 64.3 (2016)Vanuatu 67.6 72.2 69.3 74.3 65.9 70.2
Developed Member EconomiesAustralia 79.2 82.5 82.0 84.5 76.6 80.5Japan 81.1 83.8 84.6 87.1 77.7 80.8New Zealand 78.6 81.5 81.3 83.3 76.1 79.7
WORLD 67.6 71.7 69.8 73.8 65.5 69.6Lao PDR = Lao People’s Democratic Republic.
Sources: World Bank. World Development Indicators. http://data.worldbank.org/data-catalog/world-development-indicators (accessed 12 July 2017); for the Cook Islands, the Marshall Islands, Nauru, Palau, and Tuvalu: US Census Bureau Online. http://www.census.gov/ (accessed 22 June 2017); for Taipei,China: Directorate-General of Budget, Accounting and Statistics. Social Indicators. http://eng.dgbas.gov.tw/mp.asp?mp=2 (accessed 4 July 2017).

128 Key Indicators for Asia and the Pacific 2017Social Indicators
Table 1.10: Births, Deaths, and Fertility Rates
Regional MemberCrude Birth Rate
(per 1,000 people)Crude Death Rate(per 1,000 people)
Total Fertility Rate(births per woman)
2000 2015 2000 2015 2000 2015Developing Member Economies Central and West Asia
Afghanistan 48.3 33.3 12.1 8.0 7.5 4.7Armenia 13.2 13.0 8.5 9.3 1.7 1.5Azerbaijan 14.5 17.2 5.8 5.7 2.0 2.0Georgia 12.0 13.4 10.0 11.5 1.6 1.8Kazakhstan 14.9 22.7 10.1 7.5 1.8 2.7Kyrgyz Republic 19.8 27.4 7.0 5.8 2.4 3.2Pakistan 32.0 28.8 8.7 7.3 4.6 3.6Tajikistan 30.6 30.2 7.8 5.6 4.0 3.5Turkmenistan 23.7 20.8 7.7 7.8 2.8 2.3Uzbekistan 21.4 23.5 5.5 4.9 2.6 2.5
East AsiaChina, People’s Rep. of 14.0 12.1 6.5 7.1 1.4 1.6Hong Kong, China 8.1 8.2 5.1 6.3 1.0 1.2Korea, Rep. of 13.3 8.6 5.2 5.4 1.5 1.2Mongolia 19.3 23.4 7.7 6.1 2.1 2.6Taipei,China 13.8 8.9 (2016) 5.7 7.3 (2016) 1.7 1.2 (2016)
South AsiaBangladesh 27.6 19.5 6.9 5.4 3.2 2.1Bhutan 27.6 17.4 8.8 6.2 3.6 2.0India 26.5 19.7 8.7 7.3 3.3 2.4Maldives 22.8 20.8 4.7 3.8 2.9 2.1Nepal 32.1 20.2 8.5 6.3 4.0 2.2Sri Lanka 18.5 15.6 7.0 6.8 2.2 2.1
Southeast AsiaBrunei Darussalam 21.9 15.7 3.0 3.0 2.3 1.9Cambodia 28.1 23.8 9.4 6.0 3.8 2.6Indonesia 21.5 19.6 7.3 7.2 2.5 2.4Lao PDR 31.9 26.3 9.8 6.6 4.3 2.9Malaysia 22.5 16.8 4.4 5.0 2.8 1.9Myanmar 24.3 17.5 9.1 8.3 2.9 2.2Philippines 29.6 23.3 6.2 6.8 3.8 2.9Singapore 13.7 9.7 4.5 4.8 1.6 1.2Thailand 14.4 10.5 6.9 8.0 1.7 1.5Viet Nam 17.5 16.9 5.5 5.8 2.0 2.0
The PacificCook Islands 23.1 14.1 (2016) 6.3 8.3 (2016) 3.2 2.2 (2016)Fiji 24.7 19.7 6.1 7.0 3.1 2.5Kiribati 30.6 28.5 7.6 7.0 4.1 3.7Marshall Islands 35.0 25.0 (2016) 5.3 4.2 (2016) 4.4 3.1 (2016)Micronesia, Fed. States of 29.9 23.6 6.3 6.1 4.3 3.2Nauru 27.9 24.4 (2016) 7.2 5.9 (2016) 3.5 2.8 (2016)Palau 14.5 13.4 (2014) 6.5 9.3 (2014) 2.0 (2005) 2.2Papua New Guinea 34.8 28.2 9.1 7.6 4.5 3.7Samoa 30.6 25.1 6.1 5.3 4.5 4.0Solomon Islands 35.6 29.3 7.7 5.7 4.7 3.9Timor–Leste 42.6 37.1 9.8 6.8 7.1 5.6Tonga 28.3 24.3 6.3 6.0 4.3 3.7Tuvalu 24.6 23.8 (2016) 10.8 8.6 (2016) 3.6 3.0 (2016)Vanuatu 32.4 26.2 6.2 4.7 4.4 3.3
Developed Member EconomiesAustralia 13.0 12.7 6.7 6.6 1.8 1.8Japan 9.4 7.9 7.7 10.2 1.4 1.5New Zealand 14.7 13.3 6.9 6.9 2.0 2.0
WORLD 21.6 19.1 8.5 7.7 2.7 2.4Lao PDR = Lao People’s Democratic Republic.
Sources: World Bank. World Development Indicators. http://data.worldbank.org/data-catalog/world-development-indicators (accessed 23 June 2017); for the Cook Islands, the Marshall Islands, Nauru, and Tuvalu: US Census Bureau Online. http://www.census.gov/ (accessed 23 June 2017); for Taipei,China: Directorate-General of Budget, Accounting and Statistics. Social Indicators. http://eng.dgbas.gov.tw/mp.asp?mp=2 (accessed 23 June 2017).
129PeopleRegional Trends and Tables
Social Indicators
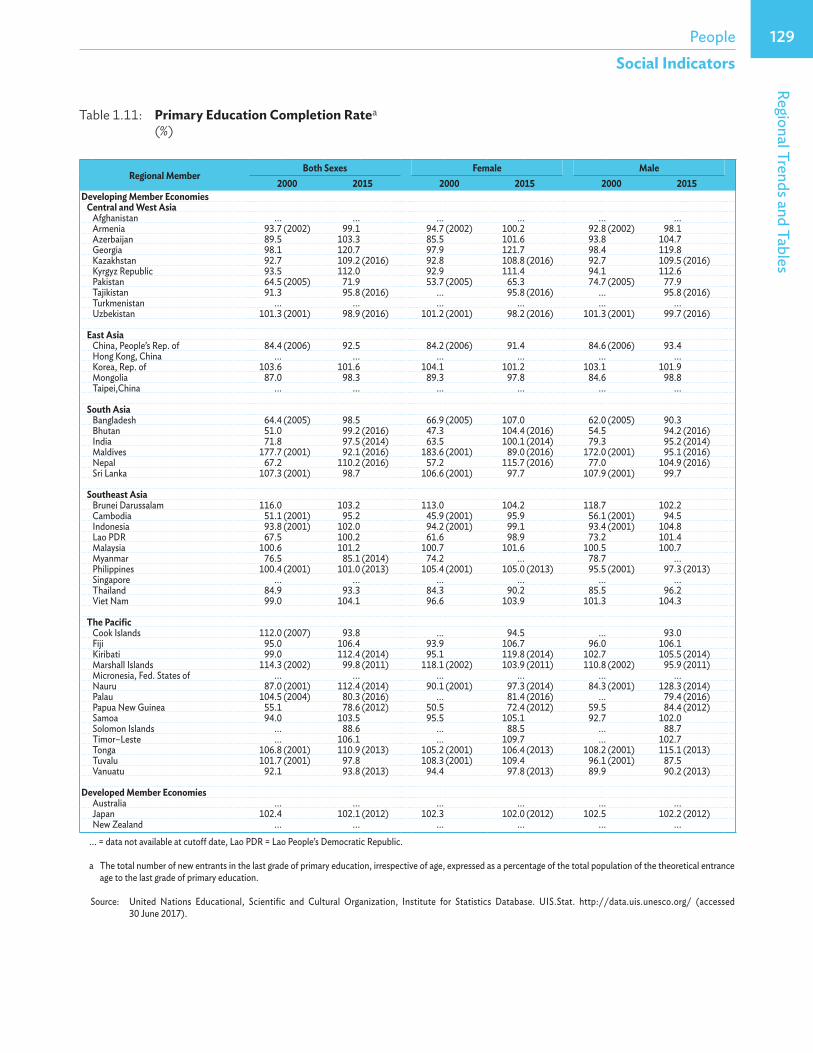
Table 1.11: Primary Education Completion Ratea (%)
Regional MemberBoth Sexes Female Male
2000 2015 2000 2015 2000 2015Developing Member Economies Central and West Asia
Afghanistan ... ... ... ... ... ...Armenia 93.7 (2002) 99.1 94.7 (2002) 100.2 92.8 (2002) 98.1Azerbaijan 89.5 103.3 85.5 101.6 93.8 104.7Georgia 98.1 120.7 97.9 121.7 98.4 119.8Kazakhstan 92.7 109.2 (2016) 92.8 108.8 (2016) 92.7 109.5 (2016)Kyrgyz Republic 93.5 112.0 92.9 111.4 94.1 112.6Pakistan 64.5 (2005) 71.9 53.7 (2005) 65.3 74.7 (2005) 77.9Tajikistan 91.3 95.8 (2016) ... 95.8 (2016) ... 95.8 (2016)Turkmenistan ... ... ... ... ... ...Uzbekistan 101.3 (2001) 98.9 (2016) 101.2 (2001) 98.2 (2016) 101.3 (2001) 99.7 (2016)
East AsiaChina, People’s Rep. of 84.4 (2006) 92.5 84.2 (2006) 91.4 84.6 (2006) 93.4Hong Kong, China ... ... ... ... ... ...Korea, Rep. of 103.6 101.6 104.1 101.2 103.1 101.9Mongolia 87.0 98.3 89.3 97.8 84.6 98.8Taipei,China ... ... ... ... ... ...
South AsiaBangladesh 64.4 (2005) 98.5 66.9 (2005) 107.0 62.0 (2005) 90.3Bhutan 51.0 99.2 (2016) 47.3 104.4 (2016) 54.5 94.2 (2016)India 71.8 97.5 (2014) 63.5 100.1 (2014) 79.3 95.2 (2014)Maldives 177.7 (2001) 92.1 (2016) 183.6 (2001) 89.0 (2016) 172.0 (2001) 95.1 (2016)Nepal 67.2 110.2 (2016) 57.2 115.7 (2016) 77.0 104.9 (2016)Sri Lanka 107.3 (2001) 98.7 106.6 (2001) 97.7 107.9 (2001) 99.7
Southeast AsiaBrunei Darussalam 116.0 103.2 113.0 104.2 118.7 102.2Cambodia 51.1 (2001) 95.2 45.9 (2001) 95.9 56.1 (2001) 94.5Indonesia 93.8 (2001) 102.0 94.2 (2001) 99.1 93.4 (2001) 104.8Lao PDR 67.5 100.2 61.6 98.9 73.2 101.4Malaysia 100.6 101.2 100.7 101.6 100.5 100.7Myanmar 76.5 85.1 (2014) 74.2 ... 78.7 ...Philippines 100.4 (2001) 101.0 (2013) 105.4 (2001) 105.0 (2013) 95.5 (2001) 97.3 (2013)Singapore ... ... ... ... ... ...Thailand 84.9 93.3 84.3 90.2 85.5 96.2Viet Nam 99.0 104.1 96.6 103.9 101.3 104.3
The PacificCook Islands 112.0 (2007) 93.8 ... 94.5 ... 93.0Fiji 95.0 106.4 93.9 106.7 96.0 106.1Kiribati 99.0 112.4 (2014) 95.1 119.8 (2014) 102.7 105.5 (2014)Marshall Islands 114.3 (2002) 99.8 (2011) 118.1 (2002) 103.9 (2011) 110.8 (2002) 95.9 (2011)Micronesia, Fed. States of ... ... ... ... ... ...Nauru 87.0 (2001) 112.4 (2014) 90.1 (2001) 97.3 (2014) 84.3 (2001) 128.3 (2014)Palau 104.5 (2004) 80.3 (2016) ... 81.4 (2016) ... 79.4 (2016)Papua New Guinea 55.1 78.6 (2012) 50.5 72.4 (2012) 59.5 84.4 (2012)Samoa 94.0 103.5 95.5 105.1 92.7 102.0Solomon Islands ... 88.6 ... 88.5 ... 88.7Timor–Leste ... 106.1 ... 109.7 ... 102.7Tonga 106.8 (2001) 110.9 (2013) 105.2 (2001) 106.4 (2013) 108.2 (2001) 115.1 (2013)Tuvalu 101.7 (2001) 97.8 108.3 (2001) 109.4 96.1 (2001) 87.5Vanuatu 92.1 93.8 (2013) 94.4 97.8 (2013) 89.9 90.2 (2013)
Developed Member EconomiesAustralia ... ... ... ... ... ...Japan 102.4 102.1 (2012) 102.3 102.0 (2012) 102.5 102.2 (2012)New Zealand ... ... ... ... ... ...
... = data not available at cutoff date, Lao PDR = Lao People’s Democratic Republic.
a The total number of new entrants in the last grade of primary education, irrespective of age, expressed as a percentage of the total population of the theoretical entrance age to the last grade of primary education.
Source: United Nations Educational, Scientific and Cultural Organization, Institute for Statistics Database. UIS.Stat. http://data.uis.unesco.org/ (accessed 30 June 2017).

130 Key Indicators for Asia and the Pacific 2017Social Indicators
Table 1.12: Adult Literacy Rate (15 years and over, %)
Regional Member Both Sexes Female Male2000 2011 2000 2011 2000 2011
Developing Member Economies Central and West Asia
Afghanistan ... 31.7 ... 17.6 ... 45.4Armenia 99.4 (2001) 99.7 99.2 (2001) 99.7 99.7 (2001) 99.8Azerbaijan 99.6 (2007) 99.8 (2016) 99.4 (2007) 99.7 (2016) 99.8 (2007) 99.9 (2016)Georgia 99.7 (2002) 99.6 (2014) 99.6 (2002) 99.5 (2014) 99.8 (2002) 99.7 (2014)Kazakhstan ... 99.8 (2010) ... 99.7 (2010) ... 99.8 (2010)Kyrgyz Republic ... 99.2 (2009) ... 99.0 (2009) ... 99.5 (2009)Pakistan 49.9 (2005) 57.0 (2014) 35.4 (2005) 44.3 (2014) 64.1 (2005) 69.1 (2014)Tajikistan 99.5 ... 99.2 ... 99.7 ...Turkmenistan ... ... ... ... ... ...Uzbekistan 98.6 100.0 (2015) 98.1 100.0 (2015) 99.2 100.0 (2015)
East AsiaChina, People’s Rep. of 90.9 95.1 (2010) 86.5 92.7 (2010) 95.1 97.5 (2010)Hong Kong, China ... ... ... ... ... ...Korea, Rep. of ... ... ... ... ... ...Mongolia 97.8 98.3 (2010) 97.5 98.3 (2010) 98.0 98.2 (2010)Taipei,China ... ... ... ... ... ...
South AsiaBangladesh 47.5 (2001) 72.8 (2016) 40.8 (2001) 69.9 (2016) 53.9 (2001) 75.6 (2016)Bhutan 52.8 (2005) 57.0 (2012) 38.7 (2005) 48.0 (2012) 65.0 (2005) 66.0 (2012)India 61.0 (2001) 69.3 47.8 (2001) 59.3 73.4 (2001) 78.9Maldives 98.4 (2006) 98.6 (2014) 98.4 (2006) 98.7 (2014) 98.4 (2006) 98.5 (2014)Nepal 48.6 (2001) 59.6 34.9 (2001) 48.8 62.7 (2001) 71.7Sri Lanka 90.7 (2001) 91.2 (2010) 89.1 (2001) 90.0 (2010) 92.3 (2001) 92.6 (2010)
Southeast AsiaBrunei Darussalam 92.7 (2001) 96.1 90.2 (2001) 94.7 95.2 (2001) 97.4Cambodia 73.6 (2004) 73.9 (2009) 64.1 (2004) 65.9 (2009) 84.7 (2004) 82.8 (2009)Indonesia 90.4 (2004) 95.4 (2016) 86.8 (2004) 93.6 (2016) 94.0 (2004) 97.2 (2016)Lao PDR 69.6 58.3 58.5 49.7 81.4 67.4Malaysia 88.7 93.1 (2010) 85.4 90.7 (2010) 92.0 95.4 (2010)Myanmar 89.9 75.6 (2016) 86.4 71.8 (2016) 93.9 80.0 (2016)Philippines 92.6 96.4 (2013) 92.7 96.8 (2013) 92.5 96.0 (2013)Singapore 92.5 97.0 (2016) 88.6 95.4 (2016) 96.6 98.7 (2016)Thailand 92.6 92.9 (2015) 90.5 91.2 (2015) 94.9 94.7 (2015)Viet Nam 90.2 93.5 (2009) 86.6 91.4 (2009) 93.9 95.8 (2009)
The PacificCook Islands ... ... ... ... ... ...Fiji ... ... ... ... ... ...Kiribati ... ... ... ... ... ...Marshall Islands ... 98.3 ... 98.2 ... 98.3Micronesia, Fed. States of ... ... ... ... ... ...Nauru ... ... ... ... ... ...Palau ... 96.6 (2015) ... 96.3 (2015) ... 96.8 (2015)Papua New Guinea 57.3 ... 50.9 ... 63.4 ...Samoa ... 99.0 ... 99.1 ... 98.9Solomon Islands ... ... ... ... ... ...Timor–Leste 37.6 (2001) 58.3 (2010) 30.0 (2001) 53.0 (2010) 45.3 (2001) 63.6 (2010)Tonga 99.0 (2006) 99.4 99.1 (2006) 99.4 99.0 (2006) 99.3Tuvalu ... ... ... ... ... ...Vanuatu ... ... ... ... ... ...
Developed Member EconomiesAustralia ... ... ... ... ... ...Japan ... ... ... ... ... ...New Zealand ... ... ... ... ... ...
... = data not available at cutoff date, Lao PDR = Lao People’s Democratic Republic.
Source: United Nations Educational, Scientific and Cultural Organization, Institute for Statistics Database. UIS.Stat. http://data.uis.unesco.org/ (accessed 28 July 2017).

131PeopleRegional Trends and Tables
Social Indicators
Table 1.13: Education Resources
Regional MemberPrimary Pupil–Teacher Ratio Secondary Pupil–Teacher Ratio
2000 2015 2000 2015Developing Member Economies Central and West Asia
Afghanistan 42.3 (2006) 44.3 31.6 (2007) 37.7Armenia 20.3 (2001) ... ... ...Azerbaijan 18.7 13.5 ... ...Georgia 16.8 9.0 7.5 7.2Kazakhstan 18.7 (2001) 18.6 (2016) ... 6.8 (2016)Kyrgyz Republic 24.1 26.2 13.3 12.5Pakistan 33.0 46.3 24.2 (2003) 21.1Tajikistan 21.8 22.2 (2016) 16.4 15.4 (2011)Turkmenistan ... ... ... ...Uzbekistan 21.4 20.4 (2016) 11.5 10.4 (2016)
East AsiaChina, People’s Rep. of 22.2 (2001) 16.3 17.1 13.8Hong Kong, China 21.5 13.7 18.8 (2001) 13.0Korea, Rep. of 32.1 16.5 (2014) 21.0 14.9 (2014)Mongolia 32.6 28.2 19.9 14.5 (2010)Taipei,Chinaa 19.0 12.3 (2016) 17.6 13.7 (2016)
South AsiaBangladesh 47.0 (2005) 36.1 38.4 35.2 (2013)Bhutan 41.1 38.0 (2016) 28.1 (2005) 14.3 (2014)India 40.0 31.5 33.6 31.7Maldives 22.7 10.3 (2016) 15.3 ...Nepal 38.0 22.4 (2016) 30.2 28.9 (2016)Sri Lanka 26.3 (2001) 23.2 ... 17.3 (2012)
Southeast AsiaBrunei Darussalam 13.7 10.0 10.9 8.8Cambodia 50.1 45.5 18.5 ...Indonesia 22.1 16.6 (2014) 14.6 15.5 (2014)Lao PDR 30.1 24.2 21.3 18.7Malaysia 19.6 11.5 18.4 12.0Myanmar 32.8 27.6 (2014) 31.9 31.8 (2014)Philippines 35.3 31.4 (2013) 36.4 (2001) 27.0 (2013)Singapore 20.4 (2007) 17.4 (2009) 17.0 (2007) 14.9 (2009)Thailand 20.8 16.9 24.0 (2001) 28.2Viet Nam 29.5 19.2 ... ...
The PacificCook Islands 17.8 17.2 13.9 13.9Fiji 28.1 28.0 (2012) 20.2 19.3 (2012)Kiribati 31.7 26.4 (2014) 21.0 (2001) 17.4 (2008)Marshall Islands 16.9 (2002) ... 16.7 (2002) ...Micronesia, Fed. States of ... 19.7 ... ...Nauru 21.5 39.5 (2014) 17.4 22.8 (2014)Palau 15.7 14.2 (2016) 15.1 18.8 (2016)Papua New Guinea 35.4 45.2 (2012) ... 27.4 (2012)Samoa 24.0 30.2 (2010) 21.2 21.5 (2010)Solomon Islands ... 25.7 10.1 25.9 (2012)Timor–Leste 61.9 (2001) 31.4 (2011) 28.0 (2001) 24.3 (2011)Tonga 22.1 21.9 (2014) 14.6 13.4 (2014)Tuvalu 19.7 12.7 ... 6.2Vanuatu 22.5 26.6 24.7 20.6
Developed Member EconomiesAustralia ... ... ... ...Japan 20.7 16.4 (2014) 14.0 11.7 (2012)New Zealand 18.4 14.4 (2014) 15.5 14.0 (2014)
... = data not available at cutoff date, Lao PDR = Lao People’s Democratic Republic.
a Data for 2016 secondary pupil–teacher ratio include those for vocational secondary schools.
Sources: United Nations Educational, Scientific and Cultural Organization, Institute for Statistics Database. UIS.Stat. http://data.uis.unesco.org/ (accessed 1 July 2017); for Taipei,China: Directorate-General of Budget, Accounting and Statistics. Social Indicators. http://eng.dgbas.gov.tw/mp.asp?mp=2 (accessed 1 July 2017).

132 Key Indicators for Asia and the Pacific 2017Social Indicators
Table 1.14: Health Care Resources (per 1,000 population)
Regional MemberPhysicians Hospital Beds
Initial year Latest year Initial year Latest yearDeveloping Member Economies Central and West Asia
Afghanistan 0.20 (2001) 0.30 (2014) 0.40 (2001) 0.50 (2012)Armenia ... 2.80 (2014) 5.47 (2000) 3.90 (2012)Azerbaijan ... 3.40 (2014) 8.68 (2000) 4.70 (2012)Georgia ... 4.78 (2014) 4.77 (2000) 2.60 (2012)Kazakhstan ... 3.27 (2014) 7.19 (2000) 7.20 (2012)Kyrgyz Republic ... 1.85 (2014) 7.40 (2000) 4.80 (2012)Pakistan 0.66 (2000) 0.81 (2014) 0.70 (2003) 0.60 (2012)Tajikistan 2.18 (2000) 1.71 (2014) 6.54 (2000) 5.50 (2011)Turkmenistan 4.36 (2002) 2.29 (2014) 4.90 (2004) 4.00 (2012)Uzbekistan ... 2.45 (2014) 5.33 (2000) 4.40 (2010)
East AsiaChina, People’s Rep. of 1.26 (2000) 1.49 (2011) 2.52 (2000) 3.80 (2011)Hong Kong, China ... ... ... ...Korea, Rep. of 1.73 (2004) 2.23 (2014) 6.10 (2000) 10.30 (2009)Mongolia 2.76 (2002) 2.88 (2011) 7.50 (2002) 6.80 (2012)Taipei,China 1.50 (2000) 2.14 (2015) 5.68 (2000) 6.90 (2015)
South AsiaBangladesh 0.24 (2001) 0.39 (2012) 0.30 (2001) 0.60 (2011)Bhutan 0.19 (2004) 0.26 (2014) 1.60 (2001) 1.80 (2012)India 0.53 (2000) 0.73 (2014) 0.69 (2002) 0.70 (2011)Maldives 1.01 (2004) 1.58 (2010) 1.70 (2000) 4.30 (2009)Nepal 0.21 (2004) ... 0.20 (2001) ...Sri Lanka 0.42 (2000) 0.73 (2010) 2.90 (2000) 3.60 (2012)
Southeast AsiaBrunei Darussalam 1.02 (2000) 1.47 (2012) 2.60 (2000) 2.80 (2012)Cambodia 0.17 (2000) 0.17 (2013) 0.60 (2001) 0.70 (2011)Indonesia 0.13 (2003) 0.20 (2012) 0.60 (2002) 0.90 (2012)Lao PDR 0.28 (2000) 0.18 (2012) 0.90 (2002) 1.50 (2012)Malaysia 0.69 (2000) 1.28 (2011) 1.80 (2001) 1.90 (2012)Myanmar 0.36 (2004) 0.57 (2012) 0.70 (2000) ...Philippines 0.57 (2000) ... 1.00 (2001) 1.00 (2011)Singapore 1.43 (2001) 1.91 (2013) 2.90 (2001) 2.00 (2011)Thailand 0.30 (2001) 0.39 (2010) 2.20 (2000) 2.10 (2010)Viet Nam 0.52 (2001) 1.18 (2013) 2.40 (2001) 2.00 (2010)
The PacificCook Islands 0.78 (2001) 1.19 (2009) ... ...Fiji 0.47 (2003) 0.44 (2009) 2.10 (2004) 2.10 (2009)Kiribati ... 0.20 (2013) 1.50 (2004) 1.30 (2011)Marshall Islands 0.60 (2007) 0.46 (2012) ... 2.70 (2010)Micronesia, Fed. States of 0.60 (2000) 0.19 (2009) 2.80 (2000) 3.20 (2009)Nauru 0.99 (2004) 1.00 (2010) 3.50 (2004) 5.00 (2010)Palau 1.30 (2006) 1.42 (2010) 5.90 (2006) 4.80 (2010)Papua New Guinea 0.05 (2000) 0.06 (2010) ... ...Samoa 0.28 (2003) 0.46 (2008) 3.30 (2000) ...Solomon Islands 0.13 (2003) 0.20 (2011) 2.20 (2003) 1.30 (2012)Timor–Leste 0.00 (2001) 0.08 (2011) ... 5.90 (2010)Tonga 0.36 (2001) 0.56 (2010) 3.20 (2001) 2.60 (2010)Tuvalu 0.63 (2002) 1.22 (2009) 5.60 (2001) ...Vanuatu 0.15 (2004) 0.19 (2012) 3.10 (2001) 1.70 (2008)
Developed Member EconomiesAustralia 2.48 (2001) 3.37 (2013) 7.80 (2000) 3.90 (2010)Japan 2.04 (2000) 2.30 (2012) 14.70 (2000) 13.70 (2009)New Zealand 2.31 (2001) 2.85 (2014) 6.20 (2002) 2.30 (2011)
... = data not available at cutoff date, 0.00 = magnitude is less than half of unit employed, Lao PDR = Lao People’s Democratic Republic.
Sources: For physicians (per 1,000 population): World Health Organization. Global Health Observatory. http://apps.who.int/gho/data/node.imr.HRH_26?lang=en (accessed 17 July 2017); for hospital beds (per 1,000 people): World Bank. World Development Indicators. http://data.worldbank.org (accessed 12 July 2017); for Taipei,China: Directorate-General of Budget, Accounting and Statistics. Monthly Bulletin of Statistics Online and Statistical Yearbook. http://eng.dgbas.gov.tw/mp.asp?mp=2 (accessed 28 June 2017).

133PeopleRegional Trends and Tables
Social Indicators
Table 1.15: Estimated Number of Adults Living with HIVa (aged 15 years and over, thousands)
Regional MemberAdults Women
2000 2015 2000 2015Developing Member Economies Central and West Asia
Afghanistan 1.8 6.7 0.5 1.9Armenia 1.0 3.6 0.2 0.7Azerbaijan 1.4 10.6 0.4 3.1Georgia 1.9 9.6 0.7 2.1Kazakhstan 4.0 22.9 0.6 7.1Kyrgyz Republic 0.8 8.0 0.2 2.6Pakistan 8.6 99.5 2.3 29.6Tajikistan 5.0 15.8 2.1 5.4Turkmenistan ... ... ... ...Uzbekistan 20.3 32.1 4.5 9.7
East AsiaChina, People’s Rep. of ... ... ... ...Hong Kong, China ... ... ... ...Korea, Rep. of ... ... ... ...Mongolia 0.0 0.4 0.0 0.1Taipei,China ... ... ... ...
South AsiaBangladesh 1.0 9.3 0.2 3.2Bhutan ... ... ... ...India 1,949.2 1,979.1 674.8 794.0Maldives ... ... ... ...Nepal 22.6 37.8 6.7 14.2Sri Lanka 0.6 4.1 0.2 1.3
Southeast AsiaBrunei Darussalam ... ... ... ...Cambodia 114.5 70.1 45.1 37.0Indonesia 41.5 675.5 9.3 246.9Lao PDR ... ... ... ...Malaysia 99.4 91.1 3.7 12.7Myanmar 187.1 215.3 44.5 77.2Philippines 2.6 42.1 0.9 4.5Singapore ... ... ... ...Thailand 616.0 434.0 176.5 179.7Viet Nam 101.1 250.2 15.3 76.5
The PacificCook Islands ... ... ... ...Fiji ... ... ... ...Kiribati ... ... ... ...Marshall Islands ... ... ... ...Micronesia, Fed. States of ... ... ... ...Nauru ... ... ... ...Palau ... ... ... ...Papua New Guinea 23.2 36.9 12.6 21.3Samoa ... ... ... ...Solomon Islands ... ... ... ...Timor–Leste ... ... ... ...Tonga ... ... ... ...Tuvalu ... ... ... ...Vanuatu ... ... ... ...
Developed Member EconomiesAustralia 15.3 26.8 1.2 2.8Japan ... ... ... ...New Zealand ... ... ... ...
... = data not available at cutoff date, 0.0 = magnitude is less than half of unit employed, Lao PDR = Lao People’s Democratic Republic.
a The modeled HIV estimates are calculated by UNAIDS using the Spectrum developed by the Futures Institute, and the Estimates and Projections Package (www.futuresinstitute.org).
Source: UNAIDS. AidsInfo Online Database. http://www.aidsinfoonline.org/devinfo/libraries/aspx/home.aspx (accessed 17 July 2017).