Jose Apesteguia, Jörg Oechssler - econstor.eu
32
econstor Make Your Publications Visible. A Service of zbw Leibniz-Informationszentrum Wirtschaft Leibniz Information Centre for Economics Apesteguia, Jose; Oechssler, Jörg; Weidenholzer, Simon Working Paper Copy trading Discussion Paper Series, No. 649 Provided in Cooperation with: Alfred Weber Institute, Department of Economics, University of Heidelberg Suggested Citation: Apesteguia, Jose; Oechssler, Jörg; Weidenholzer, Simon (2018) : Copy trading, Discussion Paper Series, No. 649, University of Heidelberg, Department of Economics, Heidelberg, http://dx.doi.org/10.11588/heidok.00024778 This Version is available at: http://hdl.handle.net/10419/207625 Standard-Nutzungsbedingungen: Die Dokumente auf EconStor dürfen zu eigenen wissenschaftlichen Zwecken und zum Privatgebrauch gespeichert und kopiert werden. Sie dürfen die Dokumente nicht für öffentliche oder kommerzielle Zwecke vervielfältigen, öffentlich ausstellen, öffentlich zugänglich machen, vertreiben oder anderweitig nutzen. Sofern die Verfasser die Dokumente unter Open-Content-Lizenzen (insbesondere CC-Lizenzen) zur Verfügung gestellt haben sollten, gelten abweichend von diesen Nutzungsbedingungen die in der dort genannten Lizenz gewährten Nutzungsrechte. Terms of use: Documents in EconStor may be saved and copied for your personal and scholarly purposes. You are not to copy documents for public or commercial purposes, to exhibit the documents publicly, to make them publicly available on the internet, or to distribute or otherwise use the documents in public. If the documents have been made available under an Open Content Licence (especially Creative Commons Licences), you may exercise further usage rights as specified in the indicated licence. www.econstor.eu
Transcript of Jose Apesteguia, Jörg Oechssler - econstor.eu
econstorMake Your Publications Visible.
A Service of
zbwLeibniz-InformationszentrumWirtschaftLeibniz Information Centrefor Economics
Apesteguia, Jose; Oechssler, Jörg; Weidenholzer, Simon
Working Paper
Copy trading
Discussion Paper Series, No. 649
Provided in Cooperation with:Alfred Weber Institute, Department of Economics, University of Heidelberg
Suggested Citation: Apesteguia, Jose; Oechssler, Jörg; Weidenholzer, Simon (2018) : Copytrading, Discussion Paper Series, No. 649, University of Heidelberg, Department of Economics,Heidelberg,http://dx.doi.org/10.11588/heidok.00024778
This Version is available at:http://hdl.handle.net/10419/207625
Standard-Nutzungsbedingungen:
Die Dokumente auf EconStor dürfen zu eigenen wissenschaftlichenZwecken und zum Privatgebrauch gespeichert und kopiert werden.
Sie dürfen die Dokumente nicht für öffentliche oder kommerzielleZwecke vervielfältigen, öffentlich ausstellen, öffentlich zugänglichmachen, vertreiben oder anderweitig nutzen.
Sofern die Verfasser die Dokumente unter Open-Content-Lizenzen(insbesondere CC-Lizenzen) zur Verfügung gestellt haben sollten,gelten abweichend von diesen Nutzungsbedingungen die in der dortgenannten Lizenz gewährten Nutzungsrechte.
Terms of use:
Documents in EconStor may be saved and copied for yourpersonal and scholarly purposes.
You are not to copy documents for public or commercialpurposes, to exhibit the documents publicly, to make thempublicly available on the internet, or to distribute or otherwiseuse the documents in public.
If the documents have been made available under an OpenContent Licence (especially Creative Commons Licences), youmay exercise further usage rights as specified in the indicatedlicence.
www.econstor.eu

Un ive rs i t y o f He ide lbe rg
Discussion Paper Series No. 649
Department of Economics
Copy Trading
Jose Apesteguia, Jörg Oechssler, and Simon Weidenholzer
June 2018
Copy trading∗
Jose Apesteguia, Jörg Oechssler, and Simon Weidenholzer†
June 27, 2018
Abstract
Copy trading allows traders in social networks to receive information on the success of
other agents in financial markets and to directly copy their trades. Internet platforms
like eToro, ZuluTrade, and Tradeo have attracted millions of users in recent years. The
present paper studies the implications of copy trading for the risk taking of investors.
Implementing an experimental financial asset market, we show that providing informa-
tion on the success of others leads to a significant increase in risk taking of subjects.
This increase in risk taking is even larger when subjects are provided with the option
to directly copy others. We conclude that copy trading reduces ex-ante welfare, and
leads to excessive risk taking.
JEL codes: C91, D81, G12, G20, G41.
Keywords: Copy trading; Financial markets; Social networks; Imitation; Experiment.
∗We would like to thank Patryk Bronka, Angelo Gutierrez and Pablo Lopez-Aguilar for outstandingresearch assistance. Seminar audiences at the Arne Ryde Conference Lund, at Bolzano, Heidelberg, HeiKa-
MaX, Experimental Finance Conference Heidelberg, EWEBE, Tilburg, University of International Business
and Economics (Beijing), UCSB, USC, WZB Berlin, provided useful comments. We are also thankful to
Andreas Reischmann for very useful discussions. Financial support by the University of Heidelberg and the
Bank of England is gratefully acknowledged.† Apesteguia: ICREA, Universitat Pompeu Fabra and Barcelona GSE, 08005 Barcelona, Spain, email:
[email protected]. Oechssler: Department of Economics, University of Heidelberg, Bergheimer Str.
58, 69115 Heidelberg, Germany, email: [email protected]. Weidenholzer: Department of Economics,
University of Essex, Wivenhoe Park, Colchester, CO4 3SQ, United Kingdom, email: [email protected].

1 Introduction
The last years have witnessed the proliferation of a variety of copy trading platforms.
These are online brokerage platforms where users, embedded in a social network, receive
information about the financial positions of others and, most importantly, can decide to
automatically copy the financial decisions of other users. That is, copy trading platforms
offer the possibility of allocating a monetary endowment to reproduce the financial strate-
gies of the user one wants to copy. There are currently more than a dozen such platforms,
with millions of users spread all over the world.1 This is a new trading mechanism with
potentially significant welfare consequences, both for the individual investors involved in
such platforms and for societies in general. In this paper we conduct, for the first time, a
series of controlled laboratory experiments to study several aspects of copy trading.
Copy trading platforms may influence behavior in various ways. It seems reasonable to
think, though, that their very nature, their main institutional characteristics, are conducive
of imitative behavior, both indirectly and directly. Indirectly, through providing informa-
tion on portfolios and success of others that users may try to emulate by themselves, and
directly by allowing agents to directly copy others by the click of a button. Copy trading
platforms, thus, provide an institutionalized framework for imitation to take place. As
already observed by Offerman and Schotter (2009) in a different context, when payoffs
are noisy, imitation may lead subjects to adopt risky choices. In the setting of a financial
market, where asset prices are naturally volatile, imitation — for example in the form of
copy trading — may have particularly stark implications. To see this, note that agents with
high earnings may have just been lucky. Under copy trading other agents are inclined to
imitate those lucky agents. To make matters worse, high returns might be associated with
high risk taking of the copied agents. Thus, successful agents might not only have been
lucky, but may have also taken more risk. Copiers may, hence, be more likely to adopt
risky investment strategies. Thus, copy trading may well result in excessive risk taking and
individually and socially suboptimal outcomes.
In this paper we examine copy trading and its implications for risk taking in a series
of laboratory experiments. The experimental laboratory allows us to control for a number
of key variables that would be very difficult, if not impossible, to do so in the field. For
example, in our studies we will measure risk preferences outside the financial markets,
1See Section 3 for a more detailed description of copy trading and for a survey of various copy trading
platforms.
1
which will permit us to determine optimal behavior in the choice of assets at the individual
level. Moreover, the experimental approach allows us to directly test the influence of the
main characteristics of copy trading platforms, namely, the provision of information on the
financial decision and success of others, and the possibility of copying others. That is, it
enables us to compare outcomes under copy trading to the counterfactual of not being able
to copy trade, and test whether this induces more risk taking behavior. Moreover, we will
have full control of the menu of financial assets, the portfolio of the investors, information
on the characteristics of the assets, and of the market results.
Our experiment consisted of three parts. In the first part we elicited subjects’ risk
preferences. The second part is composed of two blocks of investment decisions. In these
decisions subjects had to choose one of multiple assets whose prices evolved according to
a Brownian motion (approximated by a Binomial tree model in discrete time; Cox, Ross,
and Rubinstein, 1979). The assets were characterized by different state dependent rates of
return. Further, some assets featured tail risk, which we modeled as the probability of a
crash to a relatively low price. Subjects were made aware of all attributes of the available
assets. After choosing their assets, subjects for a number of periods had to decide whether
to sell the asset at the current price or keep it.
In the second block subjects were confronted with the same investment problem. De-
pending on the treatment, there were additional components. In the BASELINE treatment,
the second block consisted of the exact repetition of the investment situation subjects con-
fronted in the first block. In our main treatment, COPY, agents received a list containing
the decisions and realized profits in the first block of all the agents in BASELINE, ordered
from highest to lowest realized payoffs. Then, subjects could either make their own invest-
ment choice, or could choose to copy the unknown investment decisions in the second block
of a subject of their choice from the list. In the latter case, copiers then simply received the
payoffs the copied subjects had earned in the second block. In addition, we ran an INFO
treatment in which subjects received the same information on the first block decisions and
outcomes of the BASELINE participants than in COPY, but in this case did not have the
option of copying any investment strategy.
We are interested in the determinants of copying behavior. The comparison between
BASELINE and INFO allows to ascertain the behavioral effect of the mere provision of
information on others. The comparison between INFO and COPY shows the influence of
the main characteristic of copy trading platforms: the possibility of copying the financial
decision of others by the click of a button. The comparison of BASELINE and COPY
2
allows for the evaluation of the joint effect of the provision of information on others, and
the possibility of copying them.
Before any investment decision were made, subjects were provided with a tool that
allowed them to simulate price path realizations for each of the assets. The purpose of this
simulator was to familiarize subjects in a user friendly way with the possible outcomes of the
various assets and to mitigate the role of the additional information subjects received from
peers in the COPY and INFO treatments. Analogous tools are being offered in practice
by financial institutions to private investors, at the time of buying financial products such
as mortgages, or pension plans.
In the third, and last, part of the experiments, we collected some potentially important
information like gender, age, and education. We also implemented a questionnaire asking
for subjects’ experience in the stock market, their self assessment of their risk attitude,
and how they perceive their tendency to follow others. Additionally, we assessed subjects’
ability to calculate a simple expected value.
Thus, our experimental design uses a financial setting, that allows us to directly study,
for the first time, the influence of the key characteristics of copy trading platforms on
financial decision-making, while controlling for important background information, such as
risk preferences.
The main results are the following. We observe that when giving participants the
possibility of copying others a sizable fraction does so, and that the distribution of asset
choices shifts markedly towards riskier ones. Concretely, 35% of participants in COPY
chose to copy someone in the list and, of these, the vast majority copied somebody who
had chosen the riskiest possible asset in Block 1. Moreover, those who did not choose
to copy anybody also shifted their asset choices towards riskier assets, when compared
to the choices in the Block 2 of BASELINE. The latter observation is reinforced by the
shift towards riskier assets in the second block choices of participants in INFO. The mere
presentation of the ordered list of BASELINE investors prompts other investors to take
significantly more risks. We therefore observe that the type of information provided and the
possibility of copying others present in copy trading platforms, is ex-ante welfare reducing,
as investors choose suboptimal assets, when judged either from the perspective of the risk
aversion revealed in the asset choices of Block 1, or from the lottery choices in Part 1.
We further address the question of who decides to become a copier. Here we find that
risk aversion plays a determinant role. The more risk averse subjects are, the more likely
they are to copy others. Ironically, it is thus those with a revealed low tolerance for risk
3

taking who are enticed through copy trading to take on more risk.
The remaining of the paper is organized as follows. Section 2 briefly reviews the most
relevant literature. In Section 3 we explain in some detail how the copy trading platforms
work. Section 4 details the experimental design and establishes the theoretical framework.
Section 5 reports the experimental results. Section 6 discusses our results and concludes.
The Appendix contains the proof to the main theoretical result of Section 4 and the ex-
perimental instructions.
2 Related Literature
Our paper relates to several strands of literature. First, imitation as a behavioral heuristic
has attracted the attention of the economics literature. It has been shown that imita-
tion can represent an attractive decision procedure in certain circumstances (Alós-Ferrer
and Schlag, 2009), but it can lead to sub-optimal outcomes in other settings, such as
Cournot games (Vega-Redondo, 1999; Apesteguia, Huck, and Oechssler, 2007). Imitation
has also been shown to play an important role in traditional investment decision making
(see e.g. Scharfstein and Stein, 1990; De Long, Shleifer, Summers, and Waldmann, 1990;
or Bikhchandani, Hirshleifer, and Welch, 1992).
The closest papers to us are Offerman and Schotter (2009) and Baghestanian, Gortner,
and van der Weele (2016). While these contributions experimentally study the implications
of providing information on peers on risk taking in economic decision making, we are
the first to explicitly study copy trading in an experimental setting. In contrast to our
financial setting, Offerman and Schotter (2009) use a production choice and a takeover
game to study the role of peer information in environments where payoffs are influenced
by a random component. While imitation is not optimal in their setting, they nonetheless
find that it plays an important role in explaining subjects’ behavior and may lead to
more risky behavior. Further, in our setting the potential scope of imitation is further
limited by the asset simulator. Baghestanian et al. (2016) experimentally study double
auctions of Arrow-Debreu securities with and without peer information. In their setting,
observing other traders yields less risky portfolios. This might be caused by the provision
of information of states of the world that are not realized, thus making less risky portfolios
more salient. In addition to explicitly allowing subjects to copy others at the click of a
button, we deviate from these contributions by studying a financial task designed to closely
resemble the setting of copy trading platforms.
4
There are also a number of recent papers that study copy trading platforms empirically.
Using data from the copy trading platform eToro, Pan, Altshuler, and Pentland (2012) find
that followed traders are, often but not always, the most successful. In addition, they show
that users of the trading platform tend to increase the trading strategy volatility and market
overreaction. Further, Liu et al. (2014) show that copied trades have a larger probability
of positive returns than standard trades, but the return on investment of successful copy
trades is smaller than the return of standard successful trades. Further, in case of negative
returns, losses are typically higher for copied trades. Also using data from eToro, Pelster
and Hoffmann (2018) show that investors who are being copied by other investors are more
likely to suffer from a disposition effect.
Publicly available performance rankings are one aspect of copy trading but they might
by themselves have an effect on investors. For example, Kirchler, Lindner, and Weitzel
(2017) find that rankings increase the risk taking of underperforming financial market pro-
fessionals. Of course, rankings in the mutual fund industry make chasing past performance
a very common phenomenon (see e.g. Sirri and Tufano, 1998 who find that only the very
top performing funds experience inflows). However, in contrast to our study, the welfare
effects of chasing past performance are less clear. If performance is not consistent, chasing
past performance does not help but need not hurt investors (apart from high fees).
The binomial tree model we use to implement a stylized financial market has been
used elsewhere in the economic and finance literature to study a variety of questions.
For instance, Oprea et al. (2009) and Sandri et al. (2010) study circumstances under
which individuals optimally (de)-invest in assets, the prices of which evolve according to
binomial tree models. Further, Ensthaler et al. (2017) demonstrate in a binomial tree
model framework that subjects face difficulties predicting the median and skewness of
asset price distributions resulting from multiplicative growth processes. Note that the use
of the asset simulator in our experiment should mitigate these concerns.
3 Copy Trading Platforms
The rise of network platforms such as Uber, Twitter, or TripAdvisor has profoundly shaped
social interactions and fundamentally changed entire industries such as transport, news
media, or tourism. Using similar ideas, specialized social networking platforms that cater
to financial investors have been created, thus giving rise to social trading. While still in its
infancy, social trading might have similar transformative impact on the finance industry.
5
Social trading platforms typically also double as online brokerage firms, providing their
members the possibility to trade financial assets via a web-interface or a mobile app. In
addition to these traditional trading features, social trading platforms provide individual
investors with means to communicate with each other (through e.g. a chat function or
public posts) and enable them to access information on current and past investments.
Many of these platforms supplement the exchange of information by allowing traders to
directly copy the investment choices of other traders.
Copying another investor entails dedicating a share of one’s budget to follow the trades
of the copied individual (from now on we call such investors “leaders”). After an investor
has decided to copy a given leader, all trades of the leader are replicated for the copier
simultaneously and in real time.2 All trades are proportional to one’s budget, i.e. if leaders
invest 1% of their portfolio, copiers do so as well. The copier may at any time decide to
un-copy the leader at which time the relationship ends and all copied positions are closed
at the current market price. Unlike more traditional investment vehicles, such as mutual
funds, there are no regulations in place limiting the conduct of leaders.
Platforms usually also provide ways to rank traders according to certain performance
criteria such as return in the previous month or year or percentage of profitable trades.
Additional filters allow to narrow down the rankings by criteria such as time active, country
of origin, or markets in which the trader is active. Some platforms additionally assign
risk scores to investors, taking into account indicators such as leverage, volatility of the
instruments an investor chooses, and portfolio diversification.
Most platforms reward investors for being copied. For instance, ZuluTrade offers its
“signal providers” in foreign exchange trading a commission of 0.5pip on trading volume
executed through a copier. Similarly, eToro under its “popular investor” program offers
fixed payments and up to 2% of annual assets under management. In addition, popular
investors may receive up to 100% spread rebate on their own trades.3 These and similar
schemes provide incentives for traders to allow others to observe and copy their trades,
rather than trading privately.
At the time of writing there are at least a dozen active copy trading platforms. One of
the larger of these, eToro, has 4.5 million subscribers and according to its CEO has had an
2When deciding whether to copy another investor the copier may also choose whether this should in-
clude currently open positions. Some platforms additionally allow investors to place stop orders on the
performance of the copied individual.3See https://www.etoro.com/en/popular-investor/ and https://www.zulutrade.co.uk/trader-program
6
annual trading volume in excess of 300bn dollars in 2016.4 Table 1 provides an overview and
some information on ranked traders active on four large copy platforms.5 Evidently, there
are few investors, relative to the number of investors appearing in the rankings, who are
copied by others. Specifically, the proportion of those copied ranges from 1.13% to 8.71%.
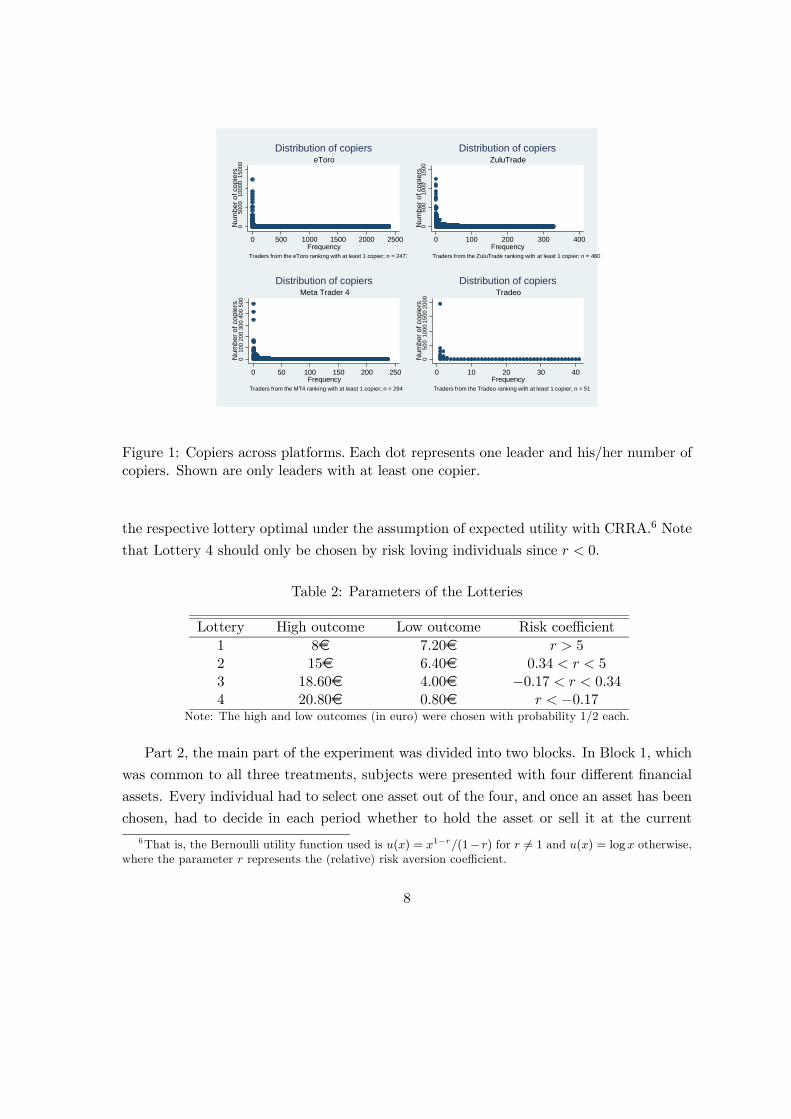
Figure 1 plots the distribution of copiers across the four platforms under consideration.
This reveals two further stylized facts about copy trading: Firstly, the vast majority of
copied traders are only copied by a few other traders. The fraction of those copied by only
one other trader (among those copied) ranges from 20.7% (ZuluTrade) to 59.5% (eToro).
Secondly, a few traders account for the majority of copied trades. The top 5% of copied
traders accounts for 61.1% (ZuluTrade) to 92.8% (eToro) of copier relationships.
Table 1: Copy trading platforms
Platform Age in years Ranked users Number of leaders Share of leaders
eToro 14 193 701 2 417 125%
ZuluTrade 10 36 416 460 126%
Tradeo 13 4 686 53 113%
Meta Trader 4 13 3 376 294 871%
4 Experimental Design and Theoretical Predictions
Our experiments consisted of three parts; Part 1 involves a standard risk elicitation exer-
cise, Part 2 contains the main financial asset decision problem, and Part 3 implements a
questionnaire. We conducted three treatments, that differed only in the second block of
the second part. We now explain the details of the experiment.
In Part 1 we elicit risk preferences in a modified Eckel and Grossman (2002) decision
task. Individuals had to choose one out of the four lotteries in Table 2, where in each
lottery there was a high and a low outcome, both of which occured with probability 1/2.
Table 2 also reports the range of coefficients of relative risk aversion, , that makes choosing
4See https://www.etoro.com/en/about/ and 09:16 in an interview with eToro CEO Yoni Assia
https://www.youtube.com/watch?v=P2yRjHAAPeU&vl=en5Data was obtained in May 2018 using a Python script to automatically collect publicly available infor-
mation on investors in copy trading platforms.
7
050
0010
000
1500
0N
umbe
r of c
opie
rs0 500 1000 1500 2000 2500
FrequencyTraders from the eToro ranking with at least 1 copier; n = 2471
eToroDistribution of copiers
050
010
0015
00N
umbe
r of c
opie
rs
0 100 200 300 400Frequency
Traders from the ZuluTrade ranking with at least 1 copier; n = 460
ZuluTradeDistribution of copiers
010
020
030
040
050
0N
umbe
r of c
opie
rs
0 50 100 150 200 250Frequency
Traders from the MT4 ranking with at least 1 copier; n = 294
Meta Trader 4Distribution of copiers
050
010
0015
0020
00N
umbe
r of c
opie
rs
0 10 20 30 40Frequency
Traders from the Tradeo ranking with at least 1 copier; n = 51
TradeoDistribution of copiers
Figure 1: Copiers across platforms. Each dot represents one leader and his/her number of
copiers. Shown are only leaders with at least one copier.
the respective lottery optimal under the assumption of expected utility with CRRA.6 Note
that Lottery 4 should only be chosen by risk loving individuals since 0.
Table 2: Parameters of the Lotteries
Lottery High outcome Low outcome Risk coefficient
1 8 7.20 5
2 15 6.40 034 5
3 18.60 4.00 −017 034
4 20.80 0.80 −017Note: The high and low outcomes (in euro) were chosen with probability 1/2 each.
Part 2, the main part of the experiment was divided into two blocks. In Block 1, which
was common to all three treatments, subjects were presented with four different financial
assets. Every individual had to select one asset out of the four, and once an asset has been
chosen, had to decide in each period whether to hold the asset or sell it at the current
6That is, the Bernoulli utility function used is () = 1−(1− ) for 6= 1 and () = log otherwise,where the parameter represents the (relative) risk aversion coefficient.
8
price. After an asset was sold, this block was finished for the subject, no further trading
could take place.
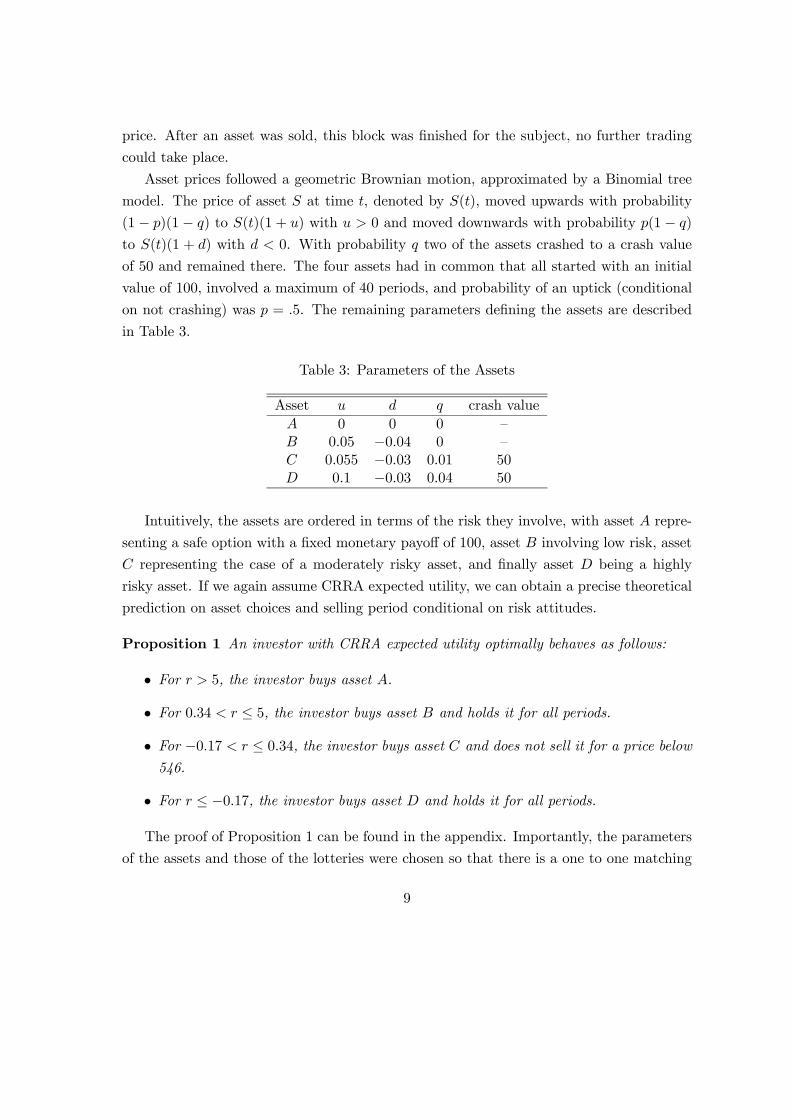
Asset prices followed a geometric Brownian motion, approximated by a Binomial tree
model. The price of asset at time , denoted by (), moved upwards with probability
(1− )(1− ) to ()(1 + ) with 0 and moved downwards with probability (1− )
to ()(1 + ) with 0. With probability two of the assets crashed to a crash value
of 50 and remained there. The four assets had in common that all started with an initial
value of 100, involved a maximum of 40 periods, and probability of an uptick (conditional
on not crashing) was = 5. The remaining parameters defining the assets are described
in Table 3.
Table 3: Parameters of the Assets
Asset crash value
0 0 0 —
005 −004 0 —
0055 −003 001 50
01 −003 004 50
Intuitively, the assets are ordered in terms of the risk they involve, with asset repre-
senting a safe option with a fixed monetary payoff of 100, asset involving low risk, asset
representing the case of a moderately risky asset, and finally asset being a highly
risky asset. If we again assume CRRA expected utility, we can obtain a precise theoretical
prediction on asset choices and selling period conditional on risk attitudes.
Proposition 1 An investor with CRRA expected utility optimally behaves as follows:
• For 5, the investor buys asset .
• For 034 ≤ 5, the investor buys asset and holds it for all periods.
• For −017 ≤ 034, the investor buys asset and does not sell it for a price below
546.
• For ≤ −017, the investor buys asset and holds it for all periods.
The proof of Proposition 1 can be found in the appendix. Importantly, the parameters
of the assets and those of the lotteries were chosen so that there is a one to one matching
9

between the lottery choice in Part 1 of the experiment and the asset choice in Part 2,
under the assumption of CRRA expected utility. Hence, we can, in principle, predict asset
choices based on the lottery choices.
In order to facilitate the choices of the subjects, we provided subjects with an asset
simulator at the begining of Part 2. In the asset simulator, subjects could simulate assets
, and . Each simulation of an asset would graph one possible 40-period realization.
The realizations were independent across clicks and individuals. Individuals could simulate
any of the assets as many times as they wanted. We recorded the simulation activity for
each individual. After participants indicated that they had run enough simulations, they
entered the decision stage.
There were three treatments that differed only with respect to Block 2 of Part 2. In
treatment BASELINE participants repeated the same asset choice conditions as in Block
1. That is, they had to choose again one of the four assets described above and then decide
when to sell.
In treatments INFO and COPY, before deciding which asset to choose in Block 2,
participants received information on the Block 1 choices of assets and associated payoffs of
all 80 subjects that participated in treatment BASELINE. Subjects were told that these
data were generated by subjects in an earlier experiment and that “(t)hey were in the same
situation as you, i.e. it was the first time they played this game.” The list was ordered from
highest to lowest realized payoffs, and presented in blocks of 5 entries. Table 4 reports a
sample of the information provided, where the last column was only present in treatment
COPY. After inspecting the ranking list, participants had to choose one of the assets, and
then period after period had to decide whether to sell the asset at that given moment of
time, or hold it one more period.
In treatment COPY, participants received exactly the same information as those in
treatment INFO. However, now, in order to reproduce the main feature of copy trading
platforms, participants could copy another subject (leader) by pressing the “Copy” botton
in Table 4. In this case, the copier would obtain exactly the same payoff the leader had
obtained in Block 2 produced by whatever the leader’s choice was in Block 2. That is,
copying implied that one eventually chooses the same asset, sells in the same period, and
obtains the same payoffs as the leaders in their second blocks, but all this information is
unknown at the time of copying.
Finally, Part 3 contained a questionnaire where in addition to standard information
(gender, age, field of studies, etc.), we gathered further background information on self-
10
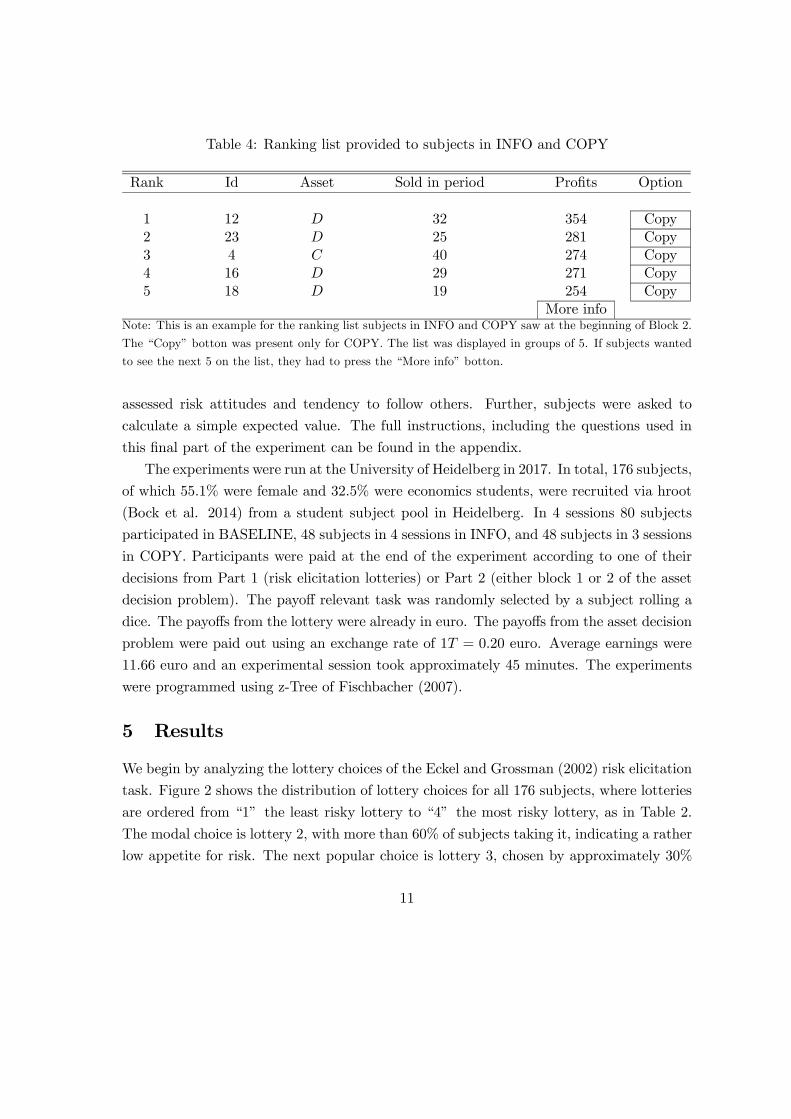
Table 4: Ranking list provided to subjects in INFO and COPY
Rank Id Asset Sold in period Profits Option
1 12 32 354 Copy
2 23 25 281 Copy
3 4 40 274 Copy
4 16 29 271 Copy
5 18 19 254 Copy
More infoNote: This is an example for the ranking list subjects in INFO and COPY saw at the beginning of Block 2.
The “Copy” botton was present only for COPY. The list was displayed in groups of 5. If subjects wanted
to see the next 5 on the list, they had to press the “More info” botton.
assessed risk attitudes and tendency to follow others. Further, subjects were asked to
calculate a simple expected value. The full instructions, including the questions used in
this final part of the experiment can be found in the appendix.
The experiments were run at the University of Heidelberg in 2017. In total, 176 subjects,
of which 55.1% were female and 32.5% were economics students, were recruited via hroot
(Bock et al. 2014) from a student subject pool in Heidelberg. In 4 sessions 80 subjects
participated in BASELINE, 48 subjects in 4 sessions in INFO, and 48 subjects in 3 sessions
in COPY. Participants were paid at the end of the experiment according to one of their
decisions from Part 1 (risk elicitation lotteries) or Part 2 (either block 1 or 2 of the asset
decision problem). The payoff relevant task was randomly selected by a subject rolling a
dice. The payoffs from the lottery were already in euro. The payoffs from the asset decision
problem were paid out using an exchange rate of 1 = 020 euro. Average earnings were
11.66 euro and an experimental session took approximately 45 minutes. The experiments
were programmed using z-Tree of Fischbacher (2007).
5 Results
We begin by analyzing the lottery choices of the Eckel and Grossman (2002) risk elicitation
task. Figure 2 shows the distribution of lottery choices for all 176 subjects, where lotteries
are ordered from “1” the least risky lottery to “4” the most risky lottery, as in Table 2.
The modal choice is lottery 2, with more than 60% of subjects taking it, indicating a rather
low appetite for risk. The next popular choice is lottery 3, chosen by approximately 30%
11
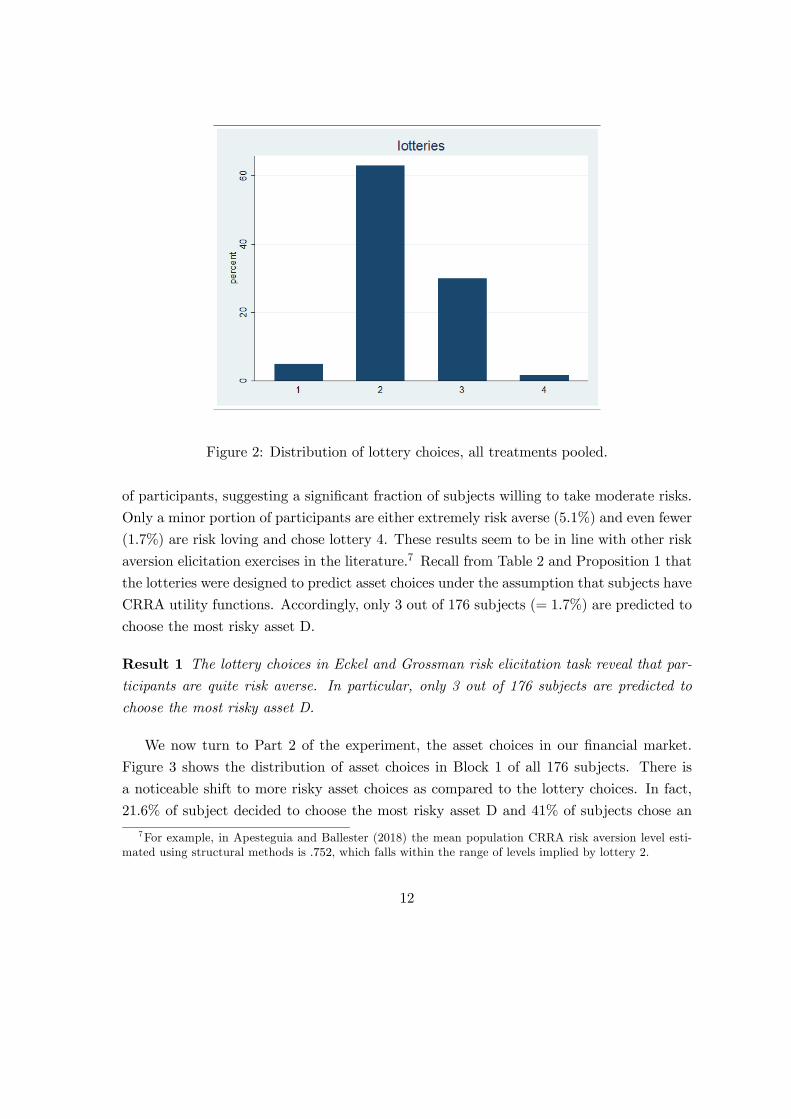
Figure 2: Distribution of lottery choices, all treatments pooled.
of participants, suggesting a significant fraction of subjects willing to take moderate risks.
Only a minor portion of participants are either extremely risk averse (5.1%) and even fewer
(1.7%) are risk loving and chose lottery 4. These results seem to be in line with other risk
aversion elicitation exercises in the literature.7 Recall from Table 2 and Proposition 1 that
the lotteries were designed to predict asset choices under the assumption that subjects have
CRRA utility functions. Accordingly, only 3 out of 176 subjects (= 17%) are predicted to
choose the most risky asset D.
Result 1 The lottery choices in Eckel and Grossman risk elicitation task reveal that par-
ticipants are quite risk averse. In particular, only 3 out of 176 subjects are predicted to
choose the most risky asset D.
We now turn to Part 2 of the experiment, the asset choices in our financial market.
Figure 3 shows the distribution of asset choices in Block 1 of all 176 subjects. There is
a noticeable shift to more risky asset choices as compared to the lottery choices. In fact,
21.6% of subject decided to choose the most risky asset D and 41% of subjects chose an
7For example, in Apesteguia and Ballester (2018) the mean population CRRA risk aversion level esti-
mated using structural methods is 752, which falls within the range of levels implied by lottery 2.
12

asset that was more risky than their chosen lottery. The distribution of asset choices is
significantly different from the distribution of lottery choices according to a Wilcoxon test
( 0001).8 However, asset and lottery choices are significantly positively correlated
( = 023 0001) and, although only 45% of subjects chose exactly the asset predicted
by their lottery choice, 86% of subjects chose an asset at most one asset lower or higher
than their predicted asset.
It seems, therefore, that the financial asset markets makes the population of subjects
behave in a riskier manner than the standard lottery choice problem. There may be different
reasons behind this observation. For example, it may be the case that the financial market
is cognitively more demanding, provoking subjects to behave more erratically. However,
our experimental design offered in a user friendly way the possibility of simulating as
many realizations of the assets as one wished. This reduced the complexity of the financial
decision problem and should have mitigated the impact of cognitive abilities. Furthermore,
the fact that the choice distribution shifted in one particular direction, namely towards
more risk taking, suggests that complexity is not the only driving force behind this result.
It may well be that the mere framing of a decision problem in terms of financial products
changes the mind of the participants into a more risk tolerant state. We believe that this is
an interesting observation in itself, that deserves to be carefully addressed in future works.9
Result 2 The distribution of asset choices in Block 1 of Part 2 reveals lower levels of risk
aversion than the lottery choices of Part 1.
Of primary interest is of course how the demand for assets changes in Block 2. One of
the reasons why we included two blocks even for treatment BASELINE was to allow for the
possibility that subjects would change their asset demand simply because they had already
experience from the first block. To avoid this confound we now compare asset choice in
Block 2 for each treatment. Figure 4 shows the distributions of assets choices in Block
2 separately for the three treatments, where, for the moment, we exclude the copiers in
COPY. It is indeed the case that asset choices in BASELINE become more risky in Block
8All -values reported in this paper refer to two-sided tests.9There is research in psychology showing risk aversion to be domain-specific (see, e.g., Weber et al.,
2002). Likewise, using actual financial decisions, Einav et al. (2012) find that risk preferences may differ
e.g. across insurance and saving decisions. However, they identify a general risk component operating
across domains.
13
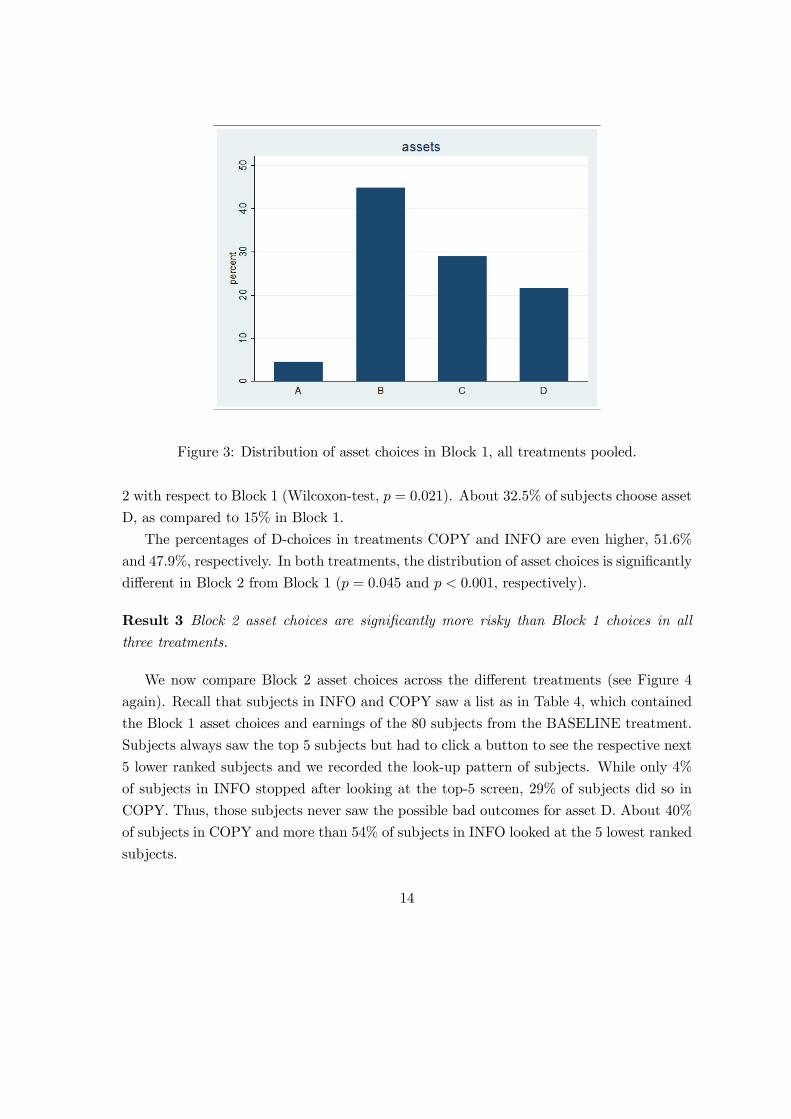
Figure 3: Distribution of asset choices in Block 1, all treatments pooled.
2 with respect to Block 1 (Wilcoxon-test, = 0021). About 32.5% of subjects choose asset
D, as compared to 15% in Block 1.
The percentages of D-choices in treatments COPY and INFO are even higher, 51.6%
and 47.9%, respectively. In both treatments, the distribution of asset choices is significantly
different in Block 2 from Block 1 ( = 0045 and 0001, respectively).
Result 3 Block 2 asset choices are significantly more risky than Block 1 choices in all
three treatments.
We now compare Block 2 asset choices across the different treatments (see Figure 4
again). Recall that subjects in INFO and COPY saw a list as in Table 4, which contained
the Block 1 asset choices and earnings of the 80 subjects from the BASELINE treatment.
Subjects always saw the top 5 subjects but had to click a button to see the respective next
5 lower ranked subjects and we recorded the look-up pattern of subjects. While only 4%
of subjects in INFO stopped after looking at the top-5 screen, 29% of subjects did so in
COPY. Thus, those subjects never saw the possible bad outcomes for asset D. About 40%
of subjects in COPY and more than 54% of subjects in INFO looked at the 5 lowest ranked
subjects.
14
010
2030
4050
010
2030
4050
A B C D A B C D
A B C D
BASELINE COPY
INFOperc
ent
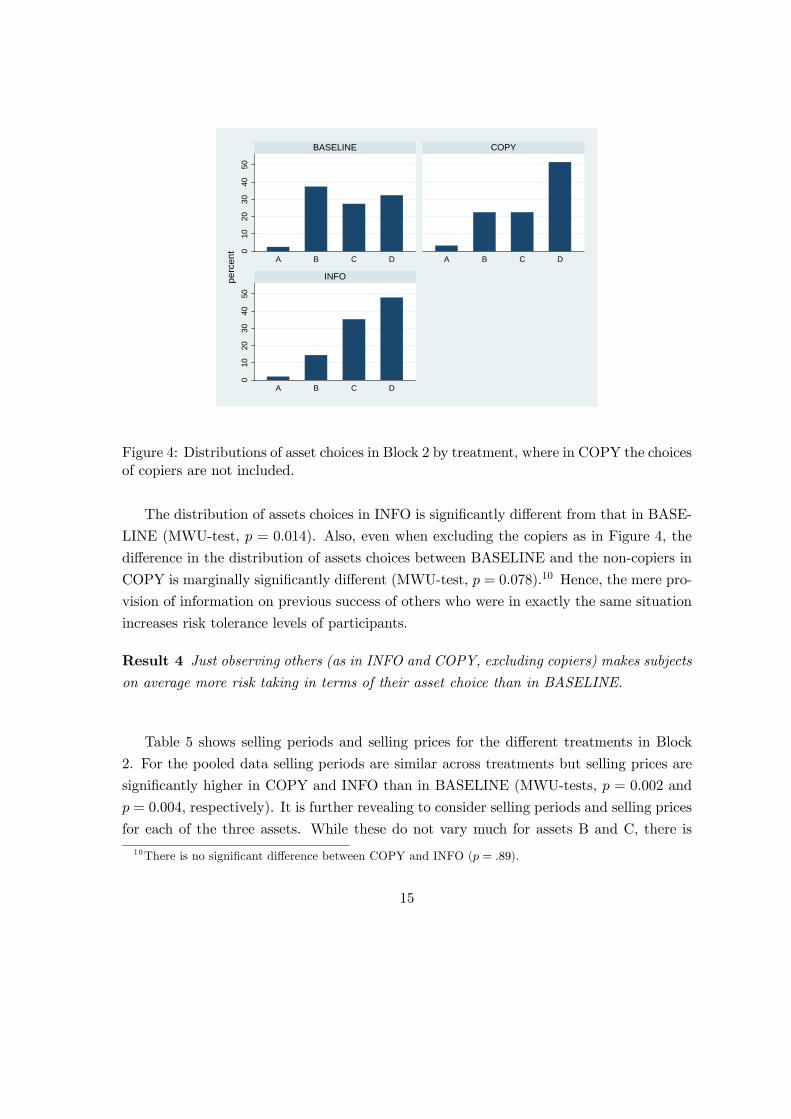
Figure 4: Distributions of asset choices in Block 2 by treatment, where in COPY the choices
of copiers are not included.
The distribution of assets choices in INFO is significantly different from that in BASE-
LINE (MWU-test, = 0014). Also, even when excluding the copiers as in Figure 4, the
difference in the distribution of assets choices between BASELINE and the non-copiers in
COPY is marginally significantly different (MWU-test, = 0078).10 Hence, the mere pro-
vision of information on previous success of others who were in exactly the same situation
increases risk tolerance levels of participants.
Result 4 Just observing others (as in INFO and COPY, excluding copiers) makes subjects
on average more risk taking in terms of their asset choice than in BASELINE.
Table 5 shows selling periods and selling prices for the different treatments in Block
2. For the pooled data selling periods are similar across treatments but selling prices are
significantly higher in COPY and INFO than in BASELINE (MWU-tests, = 0002 and
= 0004, respectively). It is further revealing to consider selling periods and selling prices
for each of the three assets. While these do not vary much for assets B and C, there is
10There is no significant difference between COPY and INFO ( = 89).
15
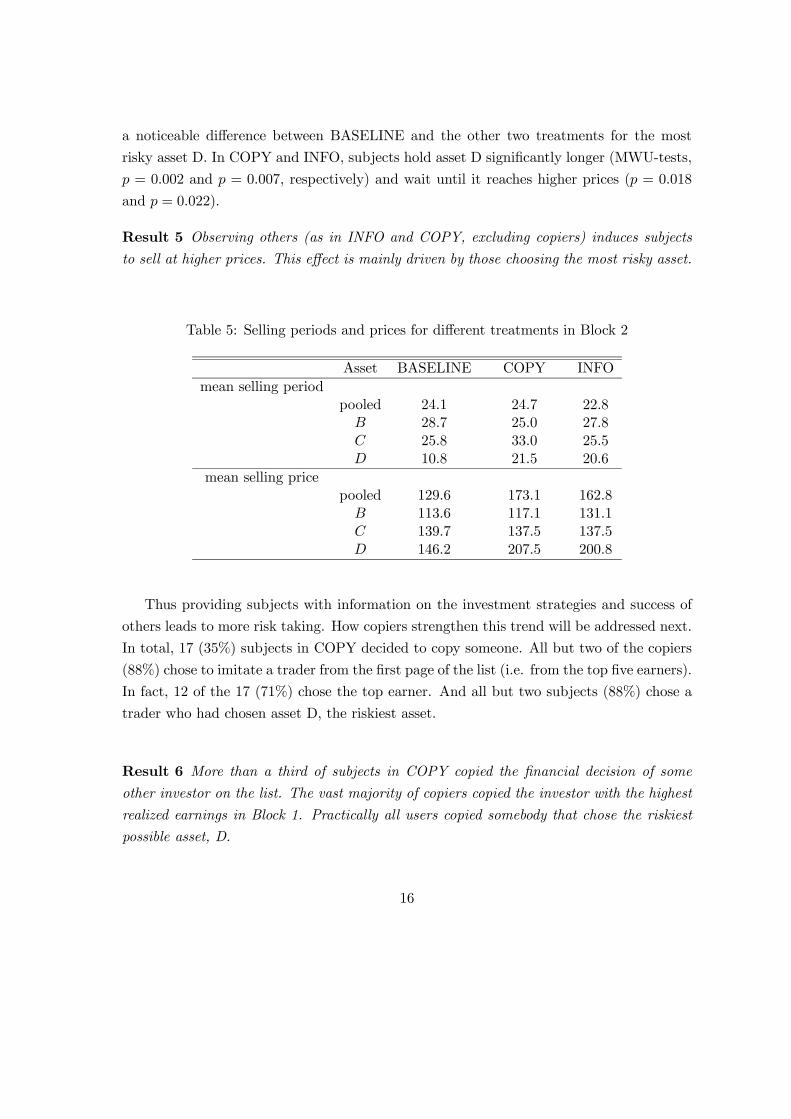
a noticeable difference between BASELINE and the other two treatments for the most
risky asset D. In COPY and INFO, subjects hold asset D significantly longer (MWU-tests,
= 0002 and = 0007, respectively) and wait until it reaches higher prices ( = 0018
and = 0022).
Result 5 Observing others (as in INFO and COPY, excluding copiers) induces subjects
to sell at higher prices. This effect is mainly driven by those choosing the most risky asset.
Table 5: Selling periods and prices for different treatments in Block 2
Asset BASELINE COPY INFO
mean selling period
pooled 241 247 228
287 250 278
258 330 255
108 215 206
mean selling price
pooled 1296 1731 1628
1136 1171 1311
1397 1375 1375
1462 2075 2008
Thus providing subjects with information on the investment strategies and success of
others leads to more risk taking. How copiers strengthen this trend will be addressed next.
In total, 17 (35%) subjects in COPY decided to copy someone. All but two of the copiers
(88%) chose to imitate a trader from the first page of the list (i.e. from the top five earners).
In fact, 12 of the 17 (71%) chose the top earner. And all but two subjects (88%) chose a
trader who had chosen asset D, the riskiest asset.
Result 6 More than a third of subjects in COPY copied the financial decision of some
other investor on the list. The vast majority of copiers copied the investor with the highest
realized earnings in Block 1. Practically all users copied somebody that chose the riskiest
possible asset, D.
16
020
4060
perc
ent
A B C D
chosen copied
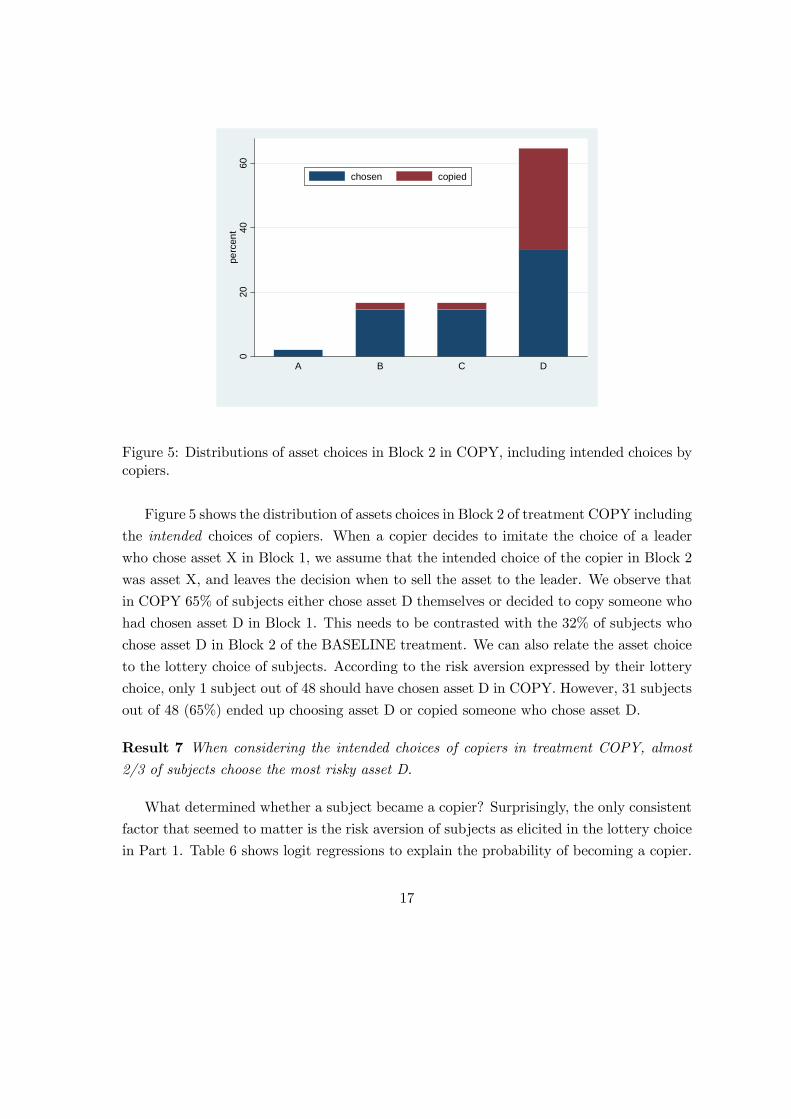
Figure 5: Distributions of asset choices in Block 2 in COPY, including intended choices by
copiers.
Figure 5 shows the distribution of assets choices in Block 2 of treatment COPY including
the intended choices of copiers. When a copier decides to imitate the choice of a leader
who chose asset X in Block 1, we assume that the intended choice of the copier in Block 2
was asset X, and leaves the decision when to sell the asset to the leader. We observe that
in COPY 65% of subjects either chose asset D themselves or decided to copy someone who
had chosen asset D in Block 1. This needs to be contrasted with the 32% of subjects who
chose asset D in Block 2 of the BASELINE treatment. We can also relate the asset choice
to the lottery choice of subjects. According to the risk aversion expressed by their lottery
choice, only 1 subject out of 48 should have chosen asset D in COPY. However, 31 subjects
out of 48 (65%) ended up choosing asset D or copied someone who chose asset D.
Result 7 When considering the intended choices of copiers in treatment COPY, almost
2/3 of subjects choose the most risky asset D.
What determined whether a subject became a copier? Surprisingly, the only consistent
factor that seemed to matter is the risk aversion of subjects as elicited in the lottery choice
in Part 1. Table 6 shows logit regressions to explain the probability of becoming a copier.
17
In all three regressions, the more risk averse subjects (i.e. the lower the lottery number)
are, the more likely they copy others, albeit the effect is only weakly significant in the
latter two specifications. The marginal effects implied by these regressions are sizeable.
For instance, specification (1) implies that subjects with one lottery class lower exhibited
a 33% higher probability to copy.11
Neither the chosen asset in Block 1 nor the realized earnings from Block 1 have a
significant effect. In regression 2 we add variables gathered from the questionnaire. None
of them has a significant effect. Finally, in regression 3 we add the “crash experience”
of subjects, i.e. whether they experienced a crash in Block 1 or what percentage of their
simulations with asset C and D, respectively, crashed. Again, none of them had a significant
effect. There is a weakly significant effect of the field of studies (for other fields than
economics or science) and an effect of the look-up pattern of subjects: If subjects only look
at the top-5 ranking, they are more likely to copy.
Result 8 The main driving force for investors to copy the financial decisions of a previous
investor is their risk aversion level. The lower the tolerance to risk, as elicited in the lottery
problem, the higher is the probability of copying.
We can check the predictions of Proposition 1 with respect to the holding periods for
the respective assets. Proposition 1 predicts that subjects with CRRA utility would hold a
chosen asset until the last period except for asset C, where the subject would sell not below
546, a price that was never reached in the experiment. Thus, effectively, the prediction
is that all subjects would hold their asset until the end of a block. Yet, 66% of subjects
sold asset B prematurely, 90% sold asset C prematurely, and not even 1% of subjects held
asset D until the end of a block. Furthermore, only about 7% of assets were sold below
the starting value of 100. Overall this shows a fairly strong disposition effect (Shefrin and
Statman, 1985), as assets are almost never sold at a loss but quickly sold once a small
profit is made.12
11The marginal effects in specifications (2) and (3) are 28% and 26%, respectively.12Magnani (2015) finds a disposition effect in experimental asset markets that are similar to the ones in
our experiment. The disposition effect also plays a crucial role on social trading platforms and increases as
traders become exposed to the network (Heimer, 2016), are for the first time copied (Pelster and Hofmann,
2018) or price information is made more salient (Frydman and Wang, 2017). Note, however that our design
abstracted from all of these additionaly important factors.
18

Table 6: Probability of becoming a copier: logit regressions
(1) (2) (3)
lottery −164∗∗ −151∗ −168∗(077) (083) (096)
asset in Block 1 018 022 043
(041) (048) (076)
earnings in Block 1 001 001 −000(001) (001) (001)
imitindex 012 013
(029) (038)
female 043 006
(081) (094)
expected value correct −015 −037(083) (096)
field of study: sciences −113 −089(106) (131)
field of study: others −134 −219∗(094) (118)
asset crash in Block 1 −167(225)
% of simulations crashed asset D 036
(158)
% of simulations crashed asset C −222(166)
viewed only top 5 181∗
(093)
constant 163 209 438∗∗
(157) (220) (358)
48 47 47Note: “imitindex” is an index created by taking the differences in responses to questionnaire questions 4 and
5 and to 6 and 7, respectively, and averaging them. Female is a gender dummy. “Expected value correct”
is 1 if the subject could calculate the expected value of a simple lottery. Standard errors in parentheses.∗ 010∗∗ 005∗∗∗ 001
19
Result 9 There is a noticeable disposition effect as subjects hold losers and sell winners
prematurely.
It is tempting to speculate on the welfare consequences of such choices. As we shall
discuss next, this is not at all a straightforward exercise. One option would be to look at
ex post realized payoffs for the different subjects. However, it should be fairly obvious that
ex post payoffs are unsuitable for welfare statements. The fact that someone was lucky and
received a high ex post payoff, does not rectify a suboptimal ex ante decision.13 Welfare
can only be evaluated once we know subjects’ true risk preferences, and decisions have to
be evaluated in an ex ante sense. In a revealed preference sense we have three decisions
(the lottery choice and the asset choices in Blocks 1 and 2) which may reveal subjects’
risk preferences. Which of these choices is the best welfare benchmark is difficult to judge.
But in any case, the asset choices in Block 2 of COPY and INFO are more distorted and
the number of inconsistencies of choices increases in the direction of more risk aversion,
independently of whether they are judged from the perspective of the lottery choice or the
Block 1 asset choice. Arguably, some of these decisions must have been suboptimal unless
preferences changed during the short time span involved in the experiment towards more
risk aversion, something that seems very unlikely.
However, our main point remains the fact that choices in INFO and COPY are more
distorted than in BASELINE and this implies that copy trading makes ex-ante welfare
reducing choices of investors more likely.
6 Discussion
In this paper we have experimentally shown that providing investors with information on
previous investment decisions and the success of other traders may lead to an increase in
risk taking. This effect is further exacerbated when agents are allowed to directly copy
other traders. Imitation through either of these channels leads to a reduction of investor’s
ex-ante welfare, as established through the elicitation of risk preferences and as manifested
in counterfactual investment decisions where imitation is not possible. Our results, thus,
suggest that social trading (with or without the option to directly copy others) may be
13To prove this point, subjects in our COPY treatment actually received the highest average payoffs. This
was mostly due to the fact that the first ranked subject, whom 12 of the 17 copiers followed, unexpectedly
chose the moderate asset B in Block 2 and received a relatively high payoff with it.
20
detrimental to consumer welfare and as such may require increased interest and scrutiny
from academics and policy makers alike.
We believe that the implications of copy trading on risk taking may be even stronger
on real world copy trading platforms: While we have recruited our participants from a
student subject pool, investors on copy trading platforms likely join these platforms with
the explicit intent to engage in copy trading. Further, the design of our experiment made
the role of luck very salient. In the real world, however, investors’ beliefs on the skills and
information of leaders might be more optimistic. In addition, whereas our experimental
setup allowed subjects to easily asses how risky previous investments of other investors
were, such an assessment is much more difficult in the real world. From a social perspective,
imitation encourages traders to follow similar investment strategies and could, thus, lead
to financial risk through resulting herding and contribute to the formation of financial
bubbles. We believe our results are a serious call of attention to copy trading platforms
that are proliferating nowadays, and hope the results will trigger more research in the near
future.
We believe that the optimal regulatory approach towards social trading should encom-
pass a variety of dimensions and that further research is required to guide it. One possibly
fruitful area for consideration lies in studying the factors that potentially mitigate excessive
risk taking in social trading. This may include analyzing the role of framing of information
provision or classifying traders according to their risk taking, as already done by some copy
trading platforms. These risk classifications are typically performed by evaluating previ-
ous investments decisions with respect to leverage, portfolio diversification, volatility of the
chosen assets, etc. This seems to be a step in the right direction and helps to identify reck-
less and disproportionately exposed traders. However, it only tames the risk-proliferating
nature of copy trading: While past behavior gives some indication of risk attitudes of an
individual trader, it may not be a good predictor of future behavior. Further, there are
hundreds of thousands of traders active on copy trading platforms. So even when control-
ling for risk, chances are that -within a certain risk category- the most risk taking investors
will still dominate the rankings. A possibly more fruitful avenue could be to advice copiers
to copy multiple (diversely invested) traders, thus increasing diversification and reducing
exposure to risk. We believe that a better understanding of the implications of the institu-
tional properties of copy trading platforms may ultimately lead to improved outcomes for
individual traders and society at large. We hope that this paper is but a first step in this
direction.
21
7 Appendix
7.1 Proof of Proposition 1
Comparison of vs. : Let us analyze first optimal behavior in asset . Consider the last
period where a choice between holding the asset or selling it must be made, i.e. = 40.
The level of risk aversion ∗ that makes the investor indifferent between selling asset at
= 40, or holding it, is the one solving the following equality:
(()) = (1− )(()(1 + )) + (()(1 + ))
that given the CRRA functional form is equivalent to solve:
1 = (1− )(1 + )1−∗+ (1 + )1−
∗ (1)
Note that the equality is independent of the actual value of wealth. Hence, the investor
sells if and only if ≥ ∗.Consider now period = 39. We have shown in the previous paragraph that if ≥ ∗
the investor sells at = 40, and hence the decision to hold or sell asset at = 39 is
described by equation (1), and consequently by ∗. If ∗, the level of risk aversion ethat makes the investor indifferent between selling asset at = 39, or holding it until
the end, is the one solving the following equality:
(()) = (1− )2(()(1 + )2) + 2(()(1 + )2) + 2(1− )(()(1 + )(1 + ))
that using the CRRA functional form reduces to:
1 = [(1− )(1 + )1− + (1 + )1−]2 (2)
Clearly, ∗ solves (1) if and only if it solves (2), and hence ∗ = e. Therefore, if ≥ ∗
the investor sells at = 39 and if ∗ the investor holds until the end.
Continuing backwards in the analysis of the decision tree, it is immediate that the
above argument extends. Namely, at any period , if ≥ ∗ the investor sells, and if ∗
compares the value of the asset at , (), with the continuation value of holding it until
the end, leading to the following comparison:
1 = [(1− )(1 + )1− + (1 + )1−]40−+1 (3)
The critical risk aversion value of (3) is ∗, and hence we conclude that the DM sells at
= 1 whenever ≥ ∗ and holds it until the end of the process otherwise. For our set of
22

parameters, ∗ = 5 Note that since the sure wealth of asset coincides with the starting
value of asset , this also represents the risk aversion value where the DM is indifferent
between holding asset or asset for all periods.
Comparison of vs. : With the probability of a crash, the decision is more complex.
The decision to hold an asset for one more period depends on current wealth since the
relative size of the crash () − 50 is increasing in (). Consider asset at the final
period 40. Given a level of relative risk aversion , there exists at most a critical price ̄40
such that for all () ̄40 the DM would sell the asset. It is defined by
(̄40) = (1− )¡(̄40(1 + ) + (1− )(̄40(1 + )
¢+ (50) (4)
In period 39, the DM faces a similar problem but has more options. He can sell the asset
at the current price or he can decide whether to sell the asset in period 40 conditional on
whether the price went up or down in period 39. This option value makes holding the asset
in period 39 slightly more attractive and leads to ̄39 ̄40. By the same logic, ̄ ̄40
for all 40 Thus, ̄40 is a lower bound for the selling price. Those time-dependent
reservation values make for a very complex analysis. However, as it turns out, they are
irrelevant for the parameters we consider, as we now argue.
Consider first the utility value of holding asset until the end. We can calculate the
expected utility resulting from this as
40X=0
µ40
¶(1− )40−
£¡(0)(1 + )(1 + )40−
¢(1− )40 +
¡1− (1− )40
¢(50)
¤ (5)
Using (5) we find numerically that a DM with = 034 would prefer asset and with
= 035 would prefer asset . At = 034 we can calculate ̄40 = 546 using (4) proving
the claim that a DM with = 034 would not sell below 546. Since ̄ is decreasing in ,
all DM with lower , would have even higher critical prices, proving the claim.
Since the process reaches 546 only very rarely, the role of the critical prices can be
ignored: For example, using ̄40 in all periods increases the expected utility only by 14×10−8 %.
Comparison of vs.: For 05 and asset , the critical ̄ are never binding (there
are no rational solutions to (4)). Thus, we can again use (5) to calculate numerically the
where a DM would switch from asset to . We find that for −017 a DM would
prefer asset . ¤
23
7.2 Experimental Instructions
Introduction
Welcome to the AWI Lab. The experiment will take about one hour, and at the end
of the experiment, you will be paid in cash. The payment you receive for the experiment
depends on your own decisions and on chance.
You can make all your choices at your computer. Please do not talk to other partic-
ipants. If you have any questions, please raise your hand, and someone will come over.
Now please read the instructions carefully. You may use paper and pencil and take notes
any time.
Timing
Today’s experiment is composed of three parts. Part 1 is a questionnaire on lottery
choices. Part 2 consists of 2 rounds in which you will have to choose among various financial
assets. Part 3 contains another questionnaire.
Payment
At the end of the experiment one of your decisions from Part 1 or 2 will be randomly
selected for payment. This is done by you rolling a die. If the die shows “1” or “2”, your
payment depends on Part 1. If the die shows “3” or “4”, the payment depends on the
outcome of Part 2, round 1. Finally, if the die shows “5” or “6”, the payment depends on
the outcome of Part 2, round 2.
You will receive your payment in cash at the end of the experiment. Each participant
will only learn his/her own payment.
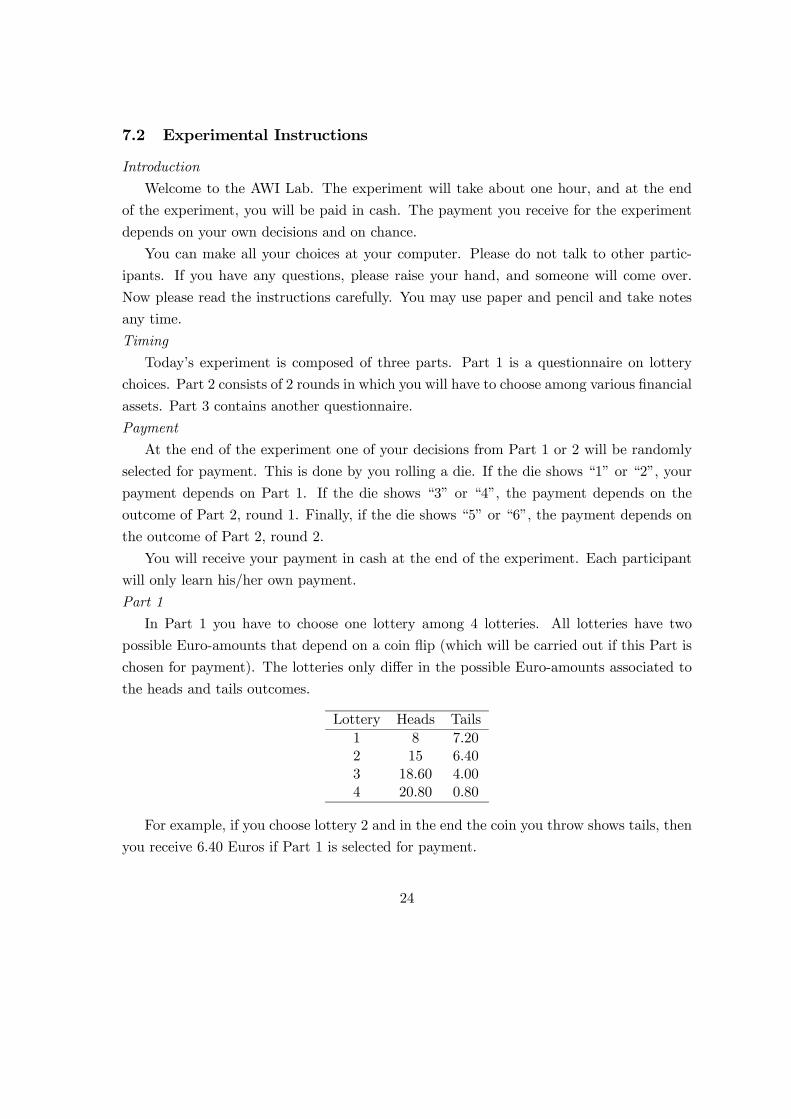
Part 1
In Part 1 you have to choose one lottery among 4 lotteries. All lotteries have two
possible Euro-amounts that depend on a coin flip (which will be carried out if this Part is
chosen for payment). The lotteries only differ in the possible Euro-amounts associated to
the heads and tails outcomes.
Lottery Heads Tails
1 8 7.20
2 15 6.40
3 18.60 4.00
4 20.80 0.80
For example, if you choose lottery 2 and in the end the coin you throw shows tails, then
you receive 6.40 Euros if Part 1 is selected for payment.
24

Part 2
In Part 2 there are two rounds, which are independent of each other. At the beginning
of each round you have to select one of four possible financial assets: , , , or .
The prices of the assets follow different random processes over 40 periods. All assets
start with a price of 100 Taler (T).
• The price of asset is constant at 100 T for all 40 periods.
• The price of asset in each period moves up by 5% with probability 12and moves
down by 4% with probability 12.
• For asset in each period there is a 1% chance that there is a market crash and the
price of asset moves to 50T and stays there until the end. If there is no crash, the
price of asset in each period moves up by 5.5% with probability 12and moves down
by 3% with probability 12.
• For asset in each period there is a 4% chance that there is a market crash and the
price of asset moves to 50T and stays there until the end. If there is no crash, the
price of asset in each period moves up by 10% with probability 12and moves down
by 3% with probability 12.
Price movements in one period are independent of price movements in earlier periods.
After each period you see graphically the price path of the asset you have chosen. Then
you have to decide whether you want to hold the asset until the next period or whether
you want to sell it at the current price.
Before deciding which asset to choose, you have the option of simulating realizations of
the different assets. Note that there are very many different realizations of the stochastic
process. The computer will randomly simulate some of these. To start the simulation, you
can press the button “Simulations” below the asset you want to simulate. You can press
as many times as you wish, and for all the assets you want.
Your payoff is determined by the price at which you sell your asset (or, if you keep it
until period 40, by the final price). At the end, each Taler is worth 0.20 Euro. In round 2
of Part 2 you have to choose again among the same 4 assets. Before you do this, you can
see the results of a group of subjects who participated in an earlier experiment. They were
in the same situation as you, i.e. it was the first time they played this game.14
14These last two sentences were present only in the instructions of INFO and COPY.
25

You have now the option to “copy” one of the subjects on the list. When you copy a
subject, the computer chooses for you the same asset and holding decisions as the chosen
subject in his or her second round (recall that the results in the list are from the subjects?
first round). In other words, you will get exactly the same payoff as the chosen subject in
his/her second round. Alternatively, you can decide on an asset by yourself and decide on
how long to hold it.15
Once all subjects are finished with this part, we move on to Part 3, which is a comput-
erized questionnaire.
Part 3
This is the last part of the experiment. It consists in answering a few questions.
1. Your field of study:
• economics• natural sciences• math• other
2. Your gender: male 0 female
3. If you win 100 euro with probability 12 and 20 euro with probability 12, what is
the expected value of this gamble?
4. “When I buy a new smartphone (or laptop), I usually just pick from the one’s that
were recommended to me by friends.” I agree with this statement, on a scale from 0
to 5, at ...
5. “When I buy a new smartphone (or laptop), I usually read all test reports and then
decide for the best one even if none of my friends has such a phone.” I agree with
this statement, on a scale from 0 to 5, at ...
6. How do you see yourself: Are you generally a person who is going his own way?
7. How do you see yourself: Are you generally a person who follows the lead of others?
15This paragraph was only in the instructions for treatment COPY.
26
References
[1] Alós-Ferrer, C and K. Schlag (2009), “Imitation and Learning,” in The Handbook of
Rational and Social Choice, ed. by P. Anand, P. Pattanaik, and C. Puppe. Oxford
University Press.
[2] Apesteguia, J. and M.A. Ballester (2018), “Monotone Stochastic Choice Models: The
Case of Risk and Time Preferences,” Journal of Political Economy, 126(1):74—106.
[3] Apesteguia, J., S. Huck and J. Oechssler (2007), “Imitation Theory and Experimental
Evidence,” Journal of Economic Theory, 136:217—235.
[4] Baghestanian, S., P.J. Gortner and J.J. van der Weele (2016), “Peer Effects and Risk
Sharing in Experimental Asset Markets,” mimeo, University of Amsterdam.
[5] Bikhchandani, S., D. Hirshleifer and I. Welch (1992), “A Theory of Fads, Fashion, Cus-
tom, and Cultural Change as Informational Cascades,” Journal of Political Economy,
100(5):992—1026.
[6] Bock, O., I. Baetge, and A. Nicklisch (2014), “hroot: Hamburg registration and orga-
nization online tool,” European Economic Review, 71:117—120.
[7] Cox, J.C., Ross, S.A., and Rubinstein M (1979), “Option pricing: A simplified ap-
proach,” Journal of Financial Economics, 7(3):229—263.
[8] De Long, J.B., A. Shleifer, L.H. Summers, and R.J. Waldmann (1990), “Noise Trader
Risk in Financial Markets,” Journal of Political Economy, 98(4):703—738.
[9] Eckel, C. and P. Grossman (2002), “Sex Differences and Statistical Stereotyping in
Attitudes Toward Financial Risk,” Evolution and Human Behavior, 23(4):281-295.
[10] Einav, L, A. Finkelstein, I. Pascu, and M.R Cullen (2012), “How General Are Risk
Preferences? Choices under Uncertainty in Different Domain,” American Economic
Review 102(6):2606-2638.
[11] Ensthaler, L., O. Nottmeyer, G. Weizsäcker and C. Zankiewicz (2017), “Hidden Skew-
ness: On the Difficulty of Multiplicative Compounding Under Random Shocks,” Man-
agement Science, 64(4):1693 - 1706.
27
[12] Fischbacher, U. (2007), “z-Tree: Zurich Toolbox for ready-made economic experi-
ments,” Experimental Economics 10(2):171-178.
[13] Frydman, C. and Wang, B. (2017), “The Impact of Salience on Investor Behavior:
Evidence from a Natural Experiment,” mimeo.
[14] Heimer, R. (2016), “Peer Pressure: Social Interaction and the Disposition Effect”,
Review of Financial Studies, 29:3177-3209.
[15] Kirchler, M., F. Lindner, and U. Weitzel (2017) “Rankings and Risk-Taking in the
Finance Industry”, Journal of Finance, forthcoming.
[16] Liu Y.Y., J.C. Nacher, T. Ochiai, M. Martino and Y. Altshuler (2014), “Prospect
Theory for Online Financial Trading,” PLoS ONE 9(10).
[17] Magnani, J. (2015), “Testing for the disposition effect on optimal stopping decisions,”
American Economic Review, 105(5): 371-375.
[18] Offerman, T., and A. Schotter (2009), “Imitation and Luck: An Experimental Study
on Social Sampling, Games and Economic Behavior, 65(2):461—502.
[19] Oprea, R., D. Friedman and S. T. Anderson (2009), “Learning to Wait: A Laboratory
Investigation,” Review of Economic Studies, 76(3):1103—1124.
[20] Pan W., Y. Altshuler and A. Pentland (2012), “Decoding Social Influence and the Wis-
dom of the Crowd in Financial Trading Network,” Proceedings of the 2012 ASE/IEEE
International Conference on Social Computing.
[21] Pelster, M. and A. Hoffmann (2018), “About the Fear of Reputational Loss: Social
Trading and the Disposition Effect”, mimeo, University of Paderborn.
[22] Sandri, S., Schade, C., Musshoff, O., and Odening, M. (2010), “Holding on for too
long? An experimental study on inertia in entrepreneurs’ and non-entrepreneurs’
disinvestment choices.” Journal of Economic Behavior and Organization, 76(1):30-44.
[23] Scharfstein, D.S. and J.C. Stein (1990), “Herd Behavior and Investment,” American
Economic Review, 80(3):465—79.
[24] Shefrin, H. and Statman, M. (1985), “The Disposition to Sell Winners Too Early and
Ride Losers Too Long: Theory and Evidence.” Journal of Finance, 40:777—790.
28

[25] Sirri, E. R., and P. Tufano (1998), “Costly search and mutual fund flows”, Journal of
Finance, 53(5):1589—1622.
[26] Vega-Redondo, F. (1997), “The Evolution of Walrasian Behavior,” Econometrica,
65:375—384.
[27] Weber, E.U., A.-R. Blais, and N.E. Betz (2002),“A Domain-specific Risk-attitude
Scale: Measuring Risk Perceptions and Risk Behaviors,” Journal of Behavioral Deci-
sion Making, 15:263—290.
29