
Introduction to GIS / GISc 01 / 25 / 2017 - Personal … · Defining Geographic Information Systems...
59
3/3/2017 1 Introduction to GIS / GISc 01 / 25 / 2017 Topics Today: • GIS components • GIS knowledge • GIS functions (intro) • Validation and Verification • Problem Solving Six Components of a GISystem Networ k People Hardware Software Data Procedure s
Transcript of Introduction to GIS / GISc 01 / 25 / 2017 - Personal … · Defining Geographic Information Systems...

3/3/2017
1
Introduction to GIS / GISc01 / 25 / 2017
Topics Today:• GIS components• GIS knowledge• GIS functions (intro)• Validation and Verification• Problem Solving
Six Components of a GISystem
Network
People
Hardware
Software
Data
Procedures

3/3/2017
2
What is GIScience?
GISc advocates claim that:• the procedures of users, and
• the functions of GIS software (geographic knowledge)
in conjunction with the • data stored in tabular databases
accommodate the ability for both • Idiographic, and
• Nomothetic analysis simultaneously,
thus GISc is born!
Do you agree? Think about it for a while~
Nomothetic and Idiographic
• Epistemological terms to describe two distinct approaches to producing and comprehending knowledge
• Epistemology – ‘theories of knowledge’ or ‘ways of knowing’
• Nomothetic – concerned with the ‘universal’ and the general• Usually quantitative
• Idiographic – concerned with the ‘unique’ and the particular• Usually qualitative

3/3/2017
3
One of many definitions for GISc
A system of integrated, computer‐based tools for end‐to‐end processing (capture, storage, retrieval, analysis, display) of data using location on the earth’s surface for integration in support of integrated decision making.
• set of integrated tools for spatial analysis
• encompasses end‐to‐end processing of data• capture, storage, retrieval, analysis/modification, display
• uses explicit location on earth’s surface to relate data
• aimed at decision support (and on‐going operations)
What is GIS?
• GIS’s are spatial (geographic) databases that support a myriad of organizations and activities
• Therefore, they are crucial to operation of organizations
• Organizations like: US EPA; US NGA; US DoD; US DHS; US NOAA; US NPS; US FEMA; PA DEP; PA DCNR; PennDOT; Federal Express; Chase Manhattan Bank; Sears; USA Today
• Or Apple, FourSquare, Facebook, Googel, Giant Eagle… the list goes on, and on, and on~

3/3/2017
4
… from Longley, et. al~
• GIS is ‐‐‐• A container of maps in digital form
• A computerized tool for solving geographic problems
• A spatial decision support system
• A mechanized inventory of geographically distributed features
• A tool for revealing what is otherwise invisible in geographic information
Defining Geographic Information Systems (GIS)
• The common ground between information processing and the many fields using spatial analysis techniques (Tomlinson, 1972)
• A powerful set of tools for collecting, storing, retrieving, transforming, and displaying spatial data from the real world (Burroughs, 1986)
• A computerized database management system for the capture, storage, retrieval, analysis and display of spatial (locationallydefined) data (NCGIA, 1987)
• A decision support system involving the integration of spatially referenced data in a problem solving environment (Cowen, 1988)
3/3/2017
5
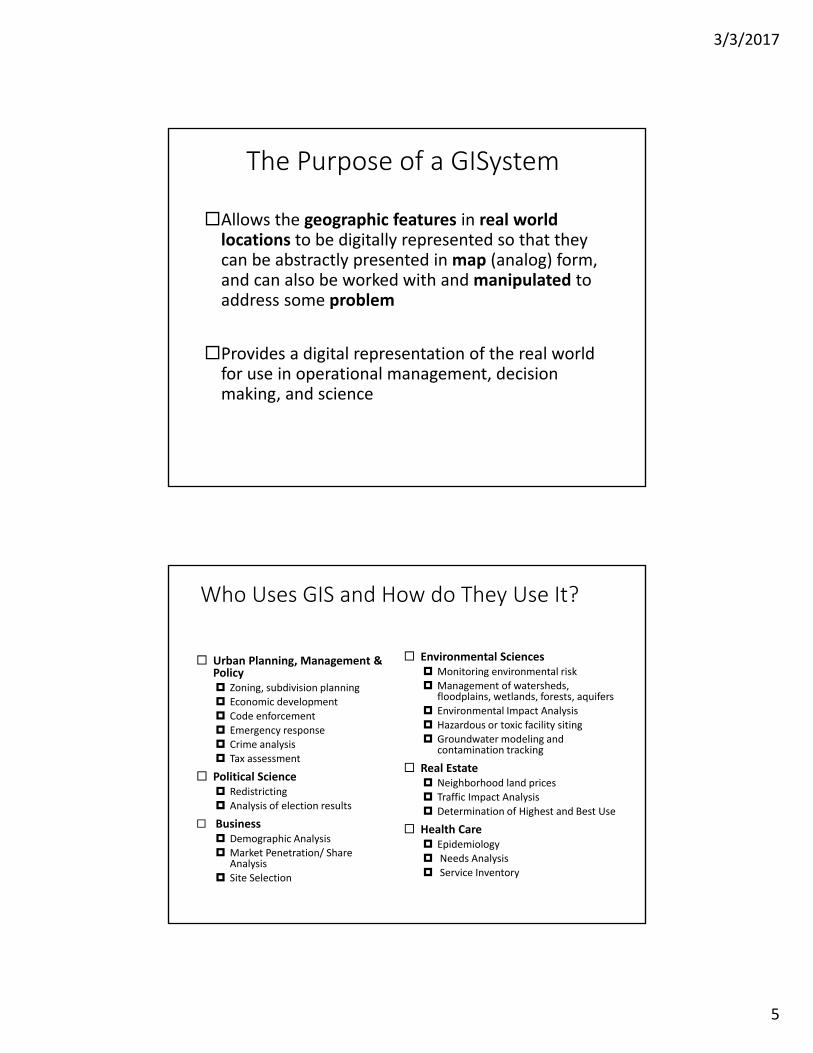
The Purpose of a GISystem
Allows the geographic features in real world locations to be digitally represented so that they can be abstractly presented in map (analog) form, and can also be worked with and manipulated to address some problem
Provides a digital representation of the real world for use in operational management, decision making, and science
Who Uses GIS and How do They Use It?
Urban Planning, Management & Policy Zoning, subdivision planning Economic development
Code enforcement
Emergency response Crime analysis
Tax assessment
Political Science Redistricting
Analysis of election results
Business Demographic Analysis Market Penetration/ Share
Analysis
Site Selection
Environmental Sciences Monitoring environmental risk Management of watersheds,
floodplains, wetlands, forests, aquifers
Environmental Impact Analysis
Hazardous or toxic facility siting Groundwater modeling and
contamination tracking
Real Estate Neighborhood land prices
Traffic Impact Analysis
Determination of Highest and Best Use
Health Care Epidemiology Needs Analysis
Service Inventory
3/3/2017
6
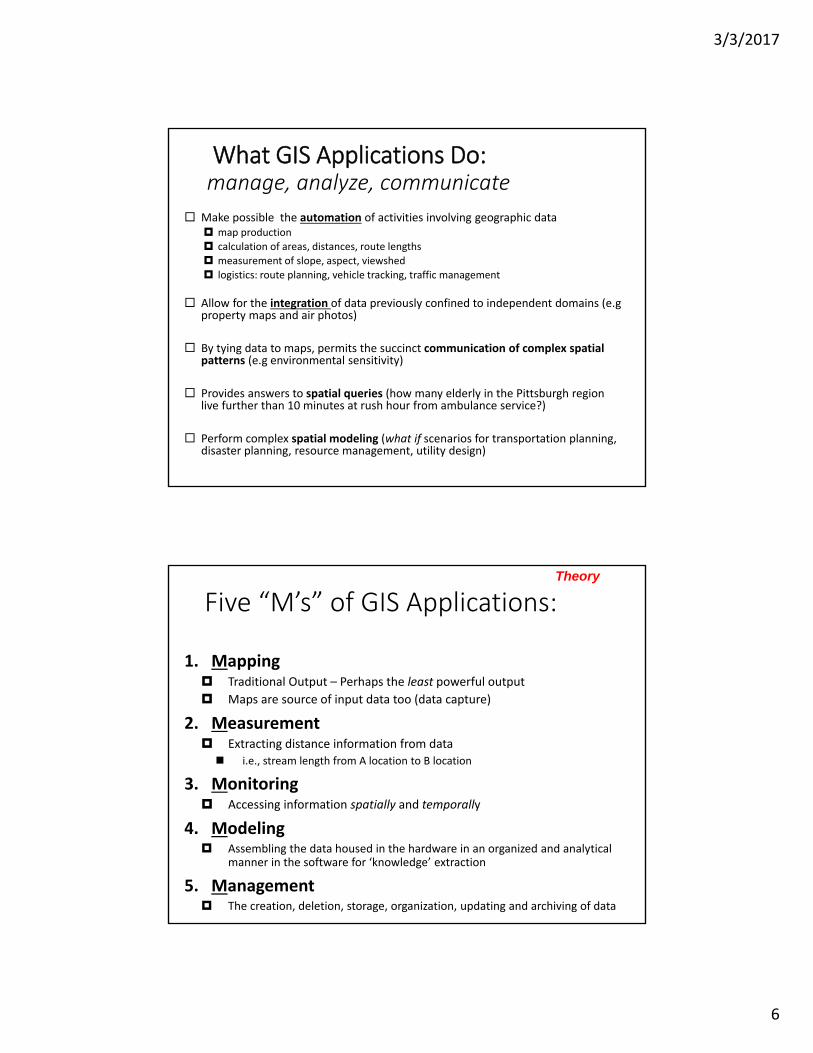
What GIS Applications Do:manage, analyze, communicate
Make possible the automation of activities involving geographic data map production calculation of areas, distances, route lengths
measurement of slope, aspect, viewshed
logistics: route planning, vehicle tracking, traffic management
Allow for the integration of data previously confined to independent domains (e.gproperty maps and air photos)
By tying data to maps, permits the succinct communication of complex spatial patterns (e.g environmental sensitivity)
Provides answers to spatial queries (how many elderly in the Pittsburgh region live further than 10 minutes at rush hour from ambulance service?)
Perform complex spatial modeling (what if scenarios for transportation planning, disaster planning, resource management, utility design)
Five “M’s” of GIS Applications:
1. Mapping Traditional Output – Perhaps the least powerful output
Maps are source of input data too (data capture)
2. Measurement Extracting distance information from data i.e., stream length from A location to B location
3. Monitoring Accessing information spatially and temporally
4. Modeling Assembling the data housed in the hardware in an organized and analytical
manner in the software for ‘knowledge’ extraction
5. Management The creation, deletion, storage, organization, updating and archiving of data
Theory

3/3/2017
7
Functional Elements of a GIS The Functional “Steps” in a “Typical” GIS Project
I. Data acquisition (never underestimate the cost!) paper maps
digital files
remote sensing/satellite
fieldwork
II. Preprocessing: preparation & integration format conversion
digitizing and/or scanning
edge matching and rectification
III. Data Management
variable selection & definition
table design (performance v. usability)
CRUD policies/procedures: Create (data entry), Retrieve (view), Update (change), Deletion (remove)
IV. Manipulation and Analysis (all the user cares about!)
address matching
network analysis
terrain modeling (e.g. slopes, aspects)
V. Product Generation
tabular reports
graphics (maps and charts)
Practice
Steps FOLLOWING project scoping:
The GIS Data Model: Geographic Integration of Information
• Data is organized in layers, coverages orthemes (synonomous concepts), with each theme representing some phenomena on the earth’s surface
• Layers are integrated using explicit location on the earth’s surface, thus geographical location is the organizing principal.

3/3/2017
8
Changing Domain and Role of GIS
2010
1998
1992
1985
Source: Forer and Unwin, 1998
Evidence and Wisdom:
• Evidence is somewhere between Information and Knowledge
• Evidence –• can be a thing or things helpful in forming a conclusion or judgment
• to indicate clearly; exemplify or prove
• in science, evidence usually goes toward supporting or rejecting an hypothesis
• scientific evidence is usually empirical
• Wisdom is at the top of the decision making process hierarchy
• Wisdom –• knowledge of what is true or right coupled with just judgment as to action
• Insight into a process (whether physical or conceptual)
• the ability to optimally (effectively and efficiently) apply perceptions and knowledge and so produce the desired results

3/3/2017
9
Validation vs. Verification
• Validation‐• The process of checking to see if something satisfies a certain criteria
• to give official sanction, confirmation, or approval to; substantiate
• Models are often validated
• Verification‐• evidence that establishes or confirms the accuracy or truth of something
• the process of research, examination, etc., required to prove or establish authenticity or validity of results
• Results should be verified (but this is rarely done)
Qualitycontrol
Qualityassurance
Problem Solving:
• How do we solve problems?• Do we first define what we want to know?
• Are we confronted with a situation in which we have no solutions or answers?
• What is the difference between a solution and an answer?
• We must define the problem‐
• We must determine what kind of data is needed to provide a solution to the problem
• Then, we must understand how to make information from the data

3/3/2017
10
From Data to Information to Knowledge: Basic way:
Categorization of Data (idea)User‐determined characteristics to be sought out in the data
Used to Identify patterns in data
Patterns are interpreted as information
Information used in problem solving
Classification of Data (method)Method to determine differences or similarities of data based on knowledge (often based on rules)Rules are determined on agreed upon procedures
Should be based on knowledge (and a little wisdom, too)
How Do We Represent These Data Types in a GIS?
•The Raster and Vector data models…

3/3/2017
11
Rasters and Vectors
• How to represent phenomena conceived as fields or discrete objects?
• Raster• Divide the world into square cells
• Register the corners to the Earth
• Represent discrete objects as collections of one or more cells
• Represent fields by assigning attribute values to cells
• More commonly used to represent fields than discrete objects
0 1 2 3 4 5 6 7 8 90 R T1 R T2 H R3 R4 R R5 R6 R T T H7 R T T8 R9 R
Real World
Vector RepresentationRaster Representation
Concept of Vector and Raster
line
polygon
point

3/3/2017
12
Characteristics of Rasters
• Pixel size• The size of the cell or picture element, defining the level of spatial detail
• All variation within pixels is lost
• Assignment scheme• The value of a cell may be an average over the cell, or a total within the cell, or the commonest value in the cell
• It may also be the value found at the cell’s central point
Legend
Mixed conifer
Douglas fir
Oak savannah
Grassland
Each color represents a different value of a nominal-scale field denoting land cover class
Raster representation

3/3/2017
13
1
1
2
3
4
5
6
7
8
9
10
1 2 3 4 5 6 7 8 9 100
X
Y
Data Sets: then array is populated with data
4
4
4
4
5
5
5
1
1
1
4
4
4
4
4
5
4
1
1
1
3
3
4
4
4
4
4
4
1
3
3
3
4
4
1
4
4
4
3
13
3
1
1
1
4
5
4
3
3
2
1
1
4
5
5
5
2
2
2
1
4
4
5
4
4
2
2
2
1
1
4
4
4
4
2
2
2
3
1
4
4
1. Water
2. Urban (High-Density Built-Environment)
3. Residential (Low-Density Built-Environment)
4. Agriculture / Grass (Open Space)
5. Forest

3/3/2017
14
Data Sets: data is then coded and displays like‐patterns (using color)
4
4
4
4
5
5
5
1
1
1
4
4
4
4
4
5
4
1
1
1
3
3
4
4
4
4
4
4
1
3
3
3
4
4
1
4
4
4
3
13
3
1
1
1
4
5
4
3
3
2
1
1
4
5
5
5
2
2
2
1
4
4
5
4
4
2
2
2
1
1
4
4
4
4
2
2
2
3
1
4
4
1. Water
2. Urban (High-Density Built-Environment)
3. Residential (Low-Density Built-Environment)
4. Agriculture / Grass (Open Space)
5. Forest
Data Sets: but is still just data until the user makes information from it
4
4
4
4
5
5
5
1
1
1
4
4
4
4
4
5
4
1
1
1
3
3
4
4
4
4
4
4
1
3
3
3
4
4
1
4
4
4
3
13
3
1
1
1
4
5
4
3
3
2
1
1
4
5
5
5
2
2
2
1
4
4
5
4
4
2
2
2
1
1
4
4
4
4
2
2
2
3
1
4
4
1. Water
2. Urban (High-Density Built-Environment)
3. Residential (Low-Density Built-Environment)
4. Agriculture / Grass (Open Space)
5. Forest

3/3/2017
15
Representing Data using RasterModel
• Area is covered by grid (usually) with equal‐sized cells
• Location ‐ of each cell calculated from origin of grid: “two down, three over” • (usually from upper left, but lower left in ARCVIEW)
• Called raster cells or pixels (picture elements) • raster data often called image data
• Attributes ‐ are recorded by assigning each cell a single value based on the majority feature (attribute) in the cell, such as land use type
0 1 2 3 4 5 6 7 8 90 1 1 1 1 1 4 4 5 5 51 1 1 1 1 1 4 4 5 5 52 1 1 1 1 1 4 4 5 5 53 1 1 1 1 1 4 4 5 5 54 1 1 1 1 1 4 4 5 5 55 2 2 2 2 2 2 2 3 3 36 2 2 2 2 2 2 2 3 3 37 2 2 2 2 2 2 2 3 3 38 2 2 4 4 2 2 2 3 3 39 2 2 4 4 2 2 2 3 3 3
commercial
industrial
Res. pub
lic
Res.
Representing Data using RasterModel
• Easy to do overlays/analyses, just by ‘combining’ corresponding cell values: • “crime index” = juvenile + adult crime rate
• (I think it’s potentially improper…)
• why raster is faster, at least for some things
• Simple data structure:• directly store each layer as a single table
• analogous to a “spreadsheet”)
• no computer database‐management‐system (DBMS) required
• although GIS systems incorporate them
commercial
industrial
Res. pub
lic
Res.

3/3/2017
16

3/3/2017
17
Legend
Mixed conifer
Douglas fir
Oak savannah
Grassland
Each color represents a different value of a nominal-scale field denoting land cover class
Raster representation
Raster Data Sets:• Data – Landsat TM(1992) & ETM+ (2002)
10/02/1992 10/06/2002
17/32 17/32

3/3/2017
18
Classified Data:
Vector Data
• Used to represent points, lines, and areas
• All are represented using coordinates• One per point
• Areas as polygons• Straight lines between points, connecting back to the start
• Point locations recorded as coordinates
• Lines as polylines• Straight lines between points
3/3/2017
19
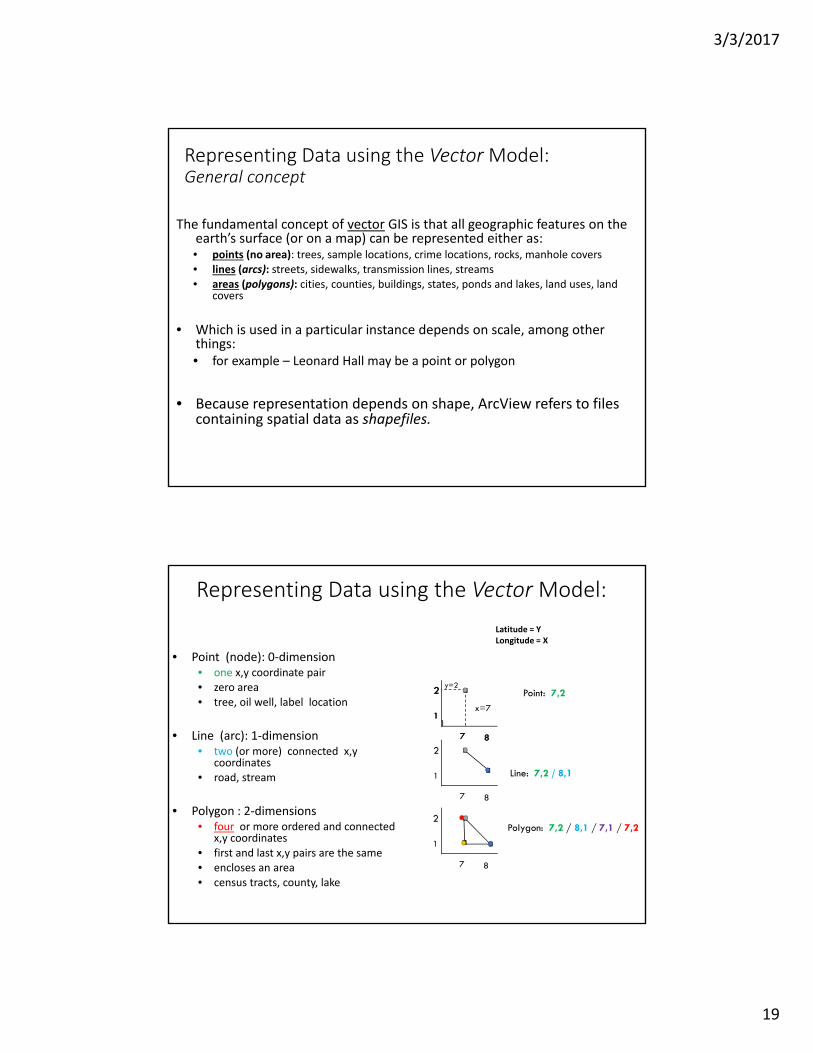
Representing Data using the VectorModel: General concept
The fundamental concept of vector GIS is that all geographic features on the earth’s surface (or on a map) can be represented either as:• points (no area): trees, sample locations, crime locations, rocks, manhole covers• lines (arcs): streets, sidewalks, transmission lines, streams• areas (polygons): cities, counties, buildings, states, ponds and lakes, land uses, land
covers
• Which is used in a particular instance depends on scale, among other things: • for example – Leonard Hall may be a point or polygon
• Because representation depends on shape, ArcView refers to files containing spatial data as shapefiles.
1
Representing Data using the VectorModel:
• Point (node): 0‐dimension• one x,y coordinate pair• zero area• tree, oil well, label location
• Line (arc): 1‐dimension• two (or more) connected x,y
coordinates• road, stream
• Polygon : 2‐dimensions• four or more ordered and connected
x,y coordinates • first and last x,y pairs are the same• encloses an area• census tracts, county, lake
1
2
7 8
x=7
Point: 7,2y=2
Line: 7,2 / 8,1
Polygon: 7,2 / 8,1 / 7,1 / 7,2
1
2
7 8
1
2
7 8
1
2
7 8
Latitude = YLongitude = X

3/3/2017
20
Latitude is the Y axis, longitude is the X axis
Latitude lines run east‐west. They are parallel to each other. The further north you go is determined by latitude. And latitude values (Y‐values) range between ‐90 and +90 degrees
Longitude lines run north‐south. They converge at the poles. And X‐coordinates are between ‐180 and +180, which are called longitudes.
Attribute data on the right are linked to spatial data by the label ID of map features

3/3/2017
21
Representing Data using the VectorModel:Data implementation
Coordinates TablePoint ID x y
1 1 32 2 13 4 14 1 25 3 2
1
2 3
4 5
X
YCommon identifiers provide link to:
coordinates table (for where)
attributes table (for what or when)
Point ID Crime time1 robbery 9:302 assault 11:303 drug 5:004 robbery 2:305 b & e 3:00
Concepts are those of a relational data base, which is really a prerequisite for the vector model (or need object-oriented computing environment)
Features in the theme (coverage) have unique identifiers--point ID, polygon ID, arc ID, etcUsually referred to as the Feature ID (FID)
(Vector) Topology: What is it?Programmed rules in GISs like ArcGIS that establish spatial relationships between features (points, lines, polygons)
• Spatial Relationships• each arc has a beginning and
ending node
• arcs connect to other arcs at nodes
• connected arcs form polygon boundaries
• arcs have polygons on their left and right
• containment
• Spatial Properties• length, directionality of arc
• connectivity
• area, perimeter of polygons
• adjacency or contiguity
• point or line ‐in‐polygon

3/3/2017
22
The Vector Data Model: Topological vs. Non‐topological Spatial Data
• Topological Vector Data – contains data regarding the (spatial) relationships between features
• Ex. ArcGIS coverages, geodatabases
• Non‐topological – no data regarding spatial relationships is recorded or stored
• Ex. ArcGIS shapefiles
The data structure of a point data model
Point (node): 0-dimension• single x,y coordinate pair• zero area(Example: tree, oil well, label location)
(0,0)
3 (2,2)
2 (4,4)
4 (6,2)
1 (2,9)
ID X,Y
1 2,9
2 4,4
3 2,2
4 6,2
Point List
X
Y

3/3/2017
23
The data structure of a line data model
Line (arc): 2-dimension• From Nodes (points) – T Nodes (points)•x,y coordinate pair(s) depend # of Nodes and vertices• zero area(Example: tree, oil well, label location)
The data structure of an area (polygon) data model

3/3/2017
24
GIS Data Models: Raster vs. Vector
• Raster data model• location is referenced by a grid
cell in a rectangular array
• attribute is represented as a single value for that cell
• many data comes in this form • images from remote sensing
(LANDSAT, SPOT, QuickBird)
• scanned maps
• elevation data from USGS
• best for continuous features:• elevation
• temperature
• soil type
• land use
• Vector data model• location referenced by x,y,z
coordinates, which can be linked to form lines and polygons
• attributes referenced through unique ID number to tables
• many data comes in this form• DIME and TIGER files from US
Census
• DLG from USGS for streams, roads, etc
• census data (tabular)
• best for features with discrete boundaries
• property lines
• political boundaries
• transportation
Vector and Raster Comparison and Conversion

3/3/2017
25
Do you see a pattern here?

3/3/2017
26
Review: Representing Geography
• When representing real‐world geographic objects in a digital form, there are 3 governing principles:
1. The representations in a GIS have spatial coordinates
2. The characteristics of the representations are selective (based on what attributes we wish to represent), and therefore incomplete
•The world is infinite and the computer is finite
3. We use models to represent the real‐world in two ways:•As clearly defined, discrete objects with known shapes or boundaries
•(represented as vector data models)
•As continuous data that extends over space, that we think of as fields •(represented as raster data models)
EnvironmentalSystemsResearchInstitute
ArcGeographicInformationSystemsv. 10
Today:
• Licensing options• ArcView• ArcEditor• ArcInfo
• GUI description
• Components of ArcGIS• ArcMap• ArcCatalog• ArcToolbox
• Setting up your project• Data organization / workspace• ‘Geodatabases’• Project files (.mxd)• Relative & absolute paths• Data Frame Properties

3/3/2017
27
ArcGIS Desktop – 3 license levels
ArcGIS Desktop is available in different levels, each with additional functionality
The 3 levels are:
1. ArcView BASIC
2. ArcEditor STANDARD
3. ArcInfo ADVANCED
ArcView
ArcEditor
ArcInfo
ArcGIS Desktop – ArcViewWith ArcView, you can• Author maps and interact with your data by generating reports and charts and printing and embedding your maps in other documents and applications
• Use map templates to create consistent style in your maps
• Build process models, scripts, and workflows to visualize and analyze your data
• Read, import, and manage more than 70 different data types and formats including demographics, facilities, CAD drawings, imagery, Web services, multimedia, and metadata
• Print, publish, and share GIS data
• Use tools such as Find, Identify, Measure, and Hyperlink
ArcView
ArcEditor
ArcInfo

3/3/2017
28
ArcGIS Desktop – ArcEditorWith ArcEditor, you can• Have multiple users to simultaneously modify and edit data
• Build and maintain spatial relationships between features using topology rules and a process called validation
• Support multiple workflows, manage work order processing, and implement QA procedures for validating edits
• Monitor the database over time and evaluate what‐if scenarios
• Perform raster‐to‐vector conversion and create data from scanned maps
ArcView
ArcEditor
ArcInfo
ArcGIS Desktop – ArcInfoWith ArcInfo, you can• Perform advanced GIS data analysis and modeling
• Use tools designed for overlay analysis, proximity analysis, surface analysis, and raster processing and conversion
• Publish and convert data in many formats
• Create and manage personal geodatabases, multiuser geodatabases, and feature datasets
• Use high‐end cartography tools to generate professional‐quality, publication‐ready maps
• Design customized symbols and place sophisticated annotation and labels on your maps
ArcView
ArcEditor
ArcInfo

3/3/2017
29
ArcGIS – How is it Structured?
• Mapfile – What is it?• Document that…
• Data Frame – What is it?• Organizational entities…
• Data Layer – What is it?• Spatial data sets…
ArcGIS Mapfile

3/3/2017
30
ArcGIS Mapfile
• How do mapfiles work?• They contain pointers to spatial and non‐spatial data
• (not the data itself)
• You save them as .mxd files and as long as they have access to the base data, you are in “good shape”
• Example • H:\introgis\streams.shp
• or E:\assignment1\streams.shp
Mapfile Example

3/3/2017
31
ArcGIS: Data Frames and Data Layers –What is the Difference?
• Data Frames • Represent some “domain” in space that can have some properties (that you can assign)
• Scale, coordinate system, labeling, etc.
• Contain data layers that occur within this domain that are in the same coordinate space
ArcGIS: Data Frames and Data Layers –What is the Difference?

3/3/2017
32
ArcGIS: Data Frames and Data Layers –What is the Difference?
• Data layers are graphic representations of spatial data layers (in a map file)
• They are accessed by “adding data” to a mapfile…• the data will then appear in the table of contents
• Data layers also have properties that are separate and distinct from those of data frames
• sometimes this is hard to keep track of…but we’ll manage
ArcGIS – Data Layers

3/3/2017
33
Organization of your data/workspace
• Workspaces are the directories, databases, and file folders on disk that hold numerous datasets, including geodatabases, as well as external datasets in many file formats—for example, folders containing shapefiles, JPEG images, DXF CAD files, dBASE tables, or Excel spreadsheets
• You can create and manage your workspaces in ArcCatalog as well as make connections to other workspaces
• Your workspaces may consist of a single file folder containing many datasets and other related documents that are organized around themes or projects
Organization of your data/workspace
• You can organize projects by layer type such as workspaces for roads, water, parcels, administrative boundaries, and so forth
• For example, the Shopping Mall Project workspace organizes datasets in folders by the theme of the data

3/3/2017
34
Organization of your data/workspace
• In other situations, you may want to organize workspaces around a project such as a road development project or new power plant project
• You can also organize workspaces within workspaces
• The New Power Plant workspace below contains sub‐workspaces for each element of the major development project
Proper organization of your data and workspace results in a logical ‘catalog tree’

3/3/2017
35
Graphical User Interface (GUI) /ArcMap Display Interface
Setting up your Project File (.mxd)
File → Map Document Proper es
Go to ‘Pathnames’ and click ‘Store relative pathnames to data sources’

3/3/2017
36
First thing to do is to ‘tell’ .mxd/project file which coordinate system, projection, and datum to use in the data frame
Setting up your Project File (.mxd)
Go to the ‘View’ pull‐down menu and navigate to ‘Data Frame Properties’
In the ‘Data Frame Properties’ click the ‘Coordinate System’ tab…Now what???

3/3/2017
37
Querying the database,Boolean Operators,
ANDTopological OVERLAY FUNCTIONS
IN gis(or, ‘Geoprocessing’)
Multiple Layer Operations
• How can we conceptualize “multiple layer” operations?
2 Kinds:• Those that do not change the geometry of spatial data
• Those that do change the geometry of spatial data, necessitating changes and updates to (vector) shapes

3/3/2017
38
Multiple Layer Operations
• Multiple layer operations that do not change the geometry of spatial data
• Select by Location• Spatial relationship is specified, spatial features are selected, but spatial data is not geometrically altered
• Spatial Join• Data is appended from a “source” spatial data table to a “destination” spatial data table based on common location, again spatial data is not altered
Select by Location
• Relationships between layers (that you can specify):• Intersect
• within distance of
• Completely contain
• Are completely within
• Have their center in
• Touch the boundary of

3/3/2017
39
The GIS Data Model: Geographic Integration of Information
• Data is organized in layers, coverages or themes (synonymous concepts), with each theme representing some phenomena on the earth’s surface
• Layers are integrated using explicit location on the earth’s surface, thus geographical location is the organizing principal
3/3/2017
40
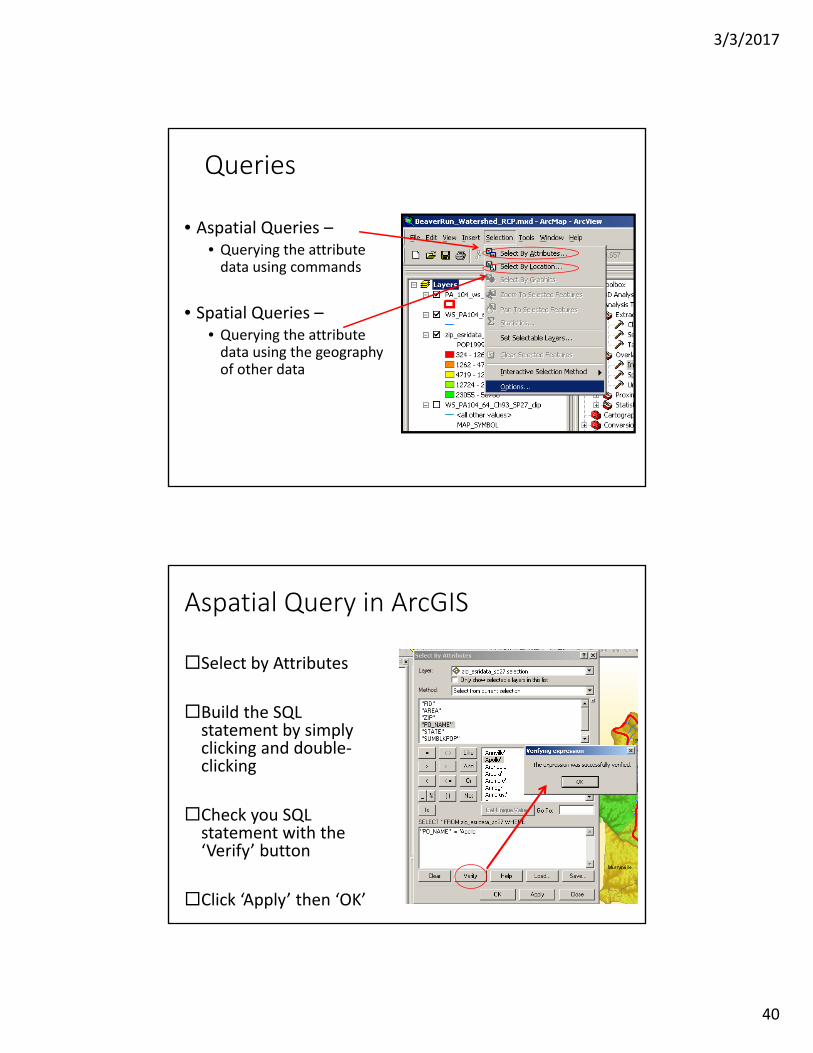
Queries
• Aspatial Queries –• Querying the attribute data using commands
• Spatial Queries –• Querying the attribute data using the geography of other data
Aspatial Query in ArcGIS
Select by Attributes
Build the SQL statement by simply clicking and double‐clicking
Check you SQL statement with the ‘Verify’ button
Click ‘Apply’ then ‘OK’
3/3/2017
41
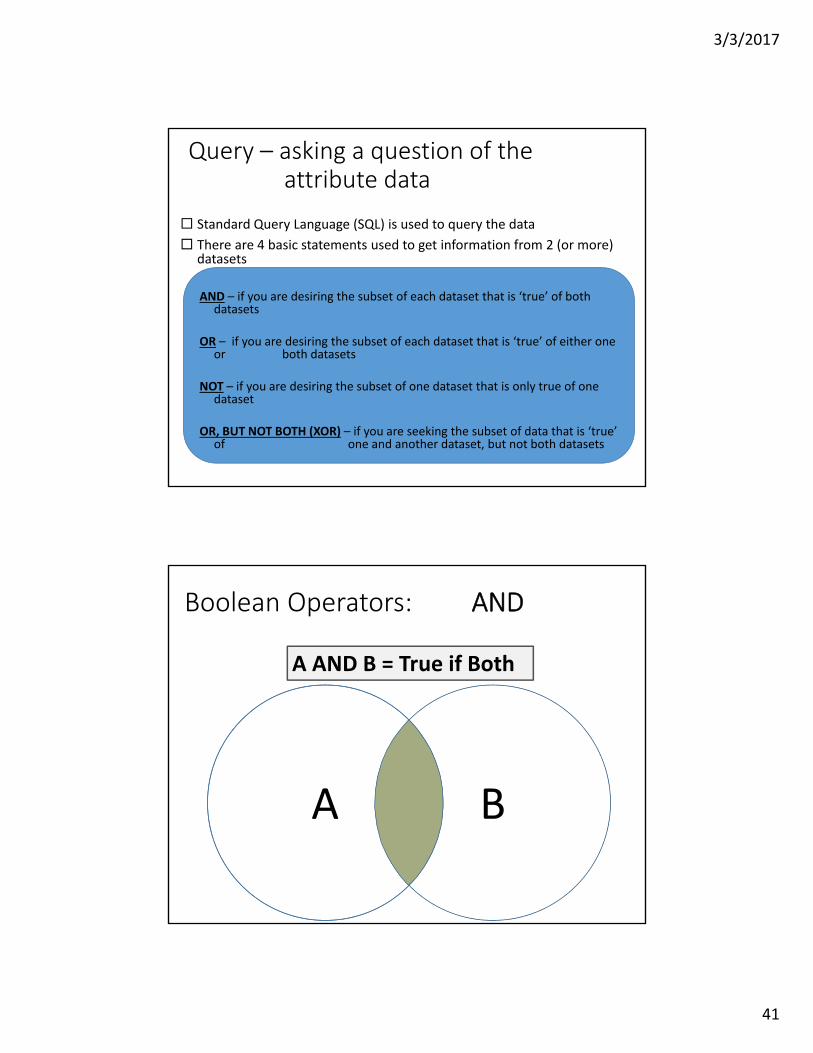
Query – asking a question of the attribute data
Standard Query Language (SQL) is used to query the data
There are 4 basic statements used to get information from 2 (or more) datasets
AND – if you are desiring the subset of each dataset that is ‘true’ of both datasets
OR – if you are desiring the subset of each dataset that is ‘true’ of either one or both datasets
NOT – if you are desiring the subset of one dataset that is only true of one dataset
OR, BUT NOT BOTH (XOR) – if you are seeking the subset of data that is ‘true’ of one and another dataset, but not both datasets
Boolean Operators: AND
A B
A AND B = True if Both

3/3/2017
42
Boolean Operators: AND
A AND B = True if Both
Boolean Operators: OR
AA B
A OR B = True if one or other
A

3/3/2017
43
Boolean Operators: OR
A
A OR B = True if one or other
Boolean Operators: NOT
AA
A NOT B = True if Neither
B

3/3/2017
44
Boolean Operators: NOT
AA
A NOT B = True if Neither
Boolean Operators: A XOR B
A B
A OR B, but not both (XOR)

3/3/2017
45
Boolean Operators: A XOR B
A OR B, but not both (XOR)
Polygon on Polygon Vector Overlay Operations
CLIP
SELECT (NOT)
SPLIT
XOR
UNION
INTERSECT
INPUT LAYER 1 INPUT LAYER 2 OUTPUT LAYER
Splits 1 into manylayers based on 2
Overlays polygons and keeps all of both [1 OR 2]
Overlays but keeps onlyportions of layer 1that fallwithin layer 2 [1 AND 2]
Cuts out a piece of layer 1using layer 2 as cookie cutter[1 AND 2]
Erases (deletes) part of layer 1using layer 2 [1 NOT 2]
Layer 1 or 2, but not both[1 XOR 2]
3/3/2017
46
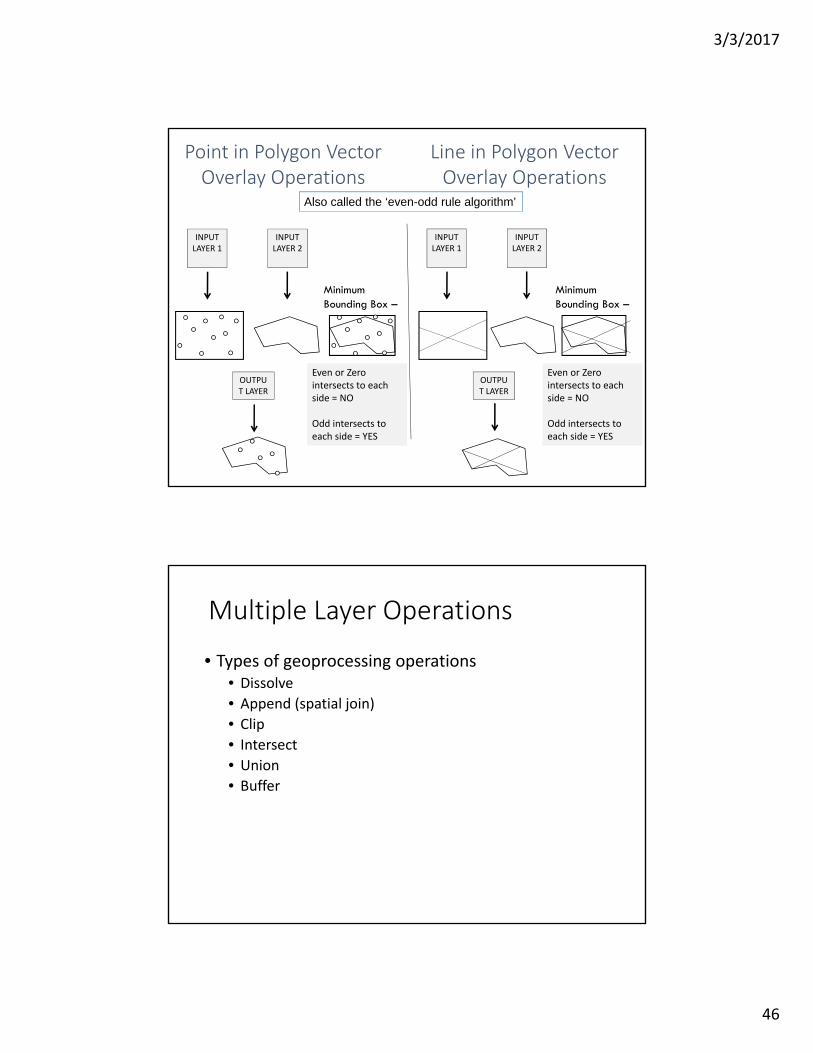
Line in Polygon VectorOverlay Operations
Point in Polygon Vector Overlay Operations
INPUT LAYER 1
INPUT LAYER 2
OUTPUT LAYER
INPUT LAYER 1
INPUT LAYER 2
OUTPUT LAYER
Even or Zero intersects to each side = NO
Odd intersects to each side = YES
MinimumBounding Box –
MinimumBounding Box –
Even or Zero intersects to each side = NO
Odd intersects to each side = YES
Also called the ‘even-odd rule algorithm’
Multiple Layer Operations
• Types of geoprocessing operations• Dissolve
• Append (spatial join)
• Clip
• Intersect
• Union
• Buffer

3/3/2017
47
Dissolve Operation
Change in geometry based on common attribute values
Clip Operation
The “Clip feature” is used as a cookie cutter

3/3/2017
48
Buffer Operation
Proximity is measured from target features
Union

3/3/2017
49
Union
Union and Intersect

3/3/2017
50
Union is an AND operation that produces a 3rd output dataset
BCA
Data Capture• Primary Sources• Secondary Sources
• Vector• Raster

3/3/2017
51
Overview
• Introduction
• Primary data capture
• Secondary data capture
• Data transfer
• Capturing attribute data
• Managing a data capture project
Data Collection• One of most expensive GIS activities
• Many diverse sources
• Two broad types of collection– Data capture (direct collection)– Data transfer
• Two broad capture methods– Primary (direct measurement)– Secondary (indirect derivation)

3/3/2017
52
Data Collection Techniques
Raster Vector
Primary
Digital remote sensing images GPS measurements
Digital aerial photographs Survey measurements
SecondaryScanned maps Topographic surveys
DEMs from maps Toponymy data sets from atlases
Stages in Data Collection Projects
Planning
Preparation
Digitizing / TransferEditing / Improvement
Evaluation
3/3/2017
53
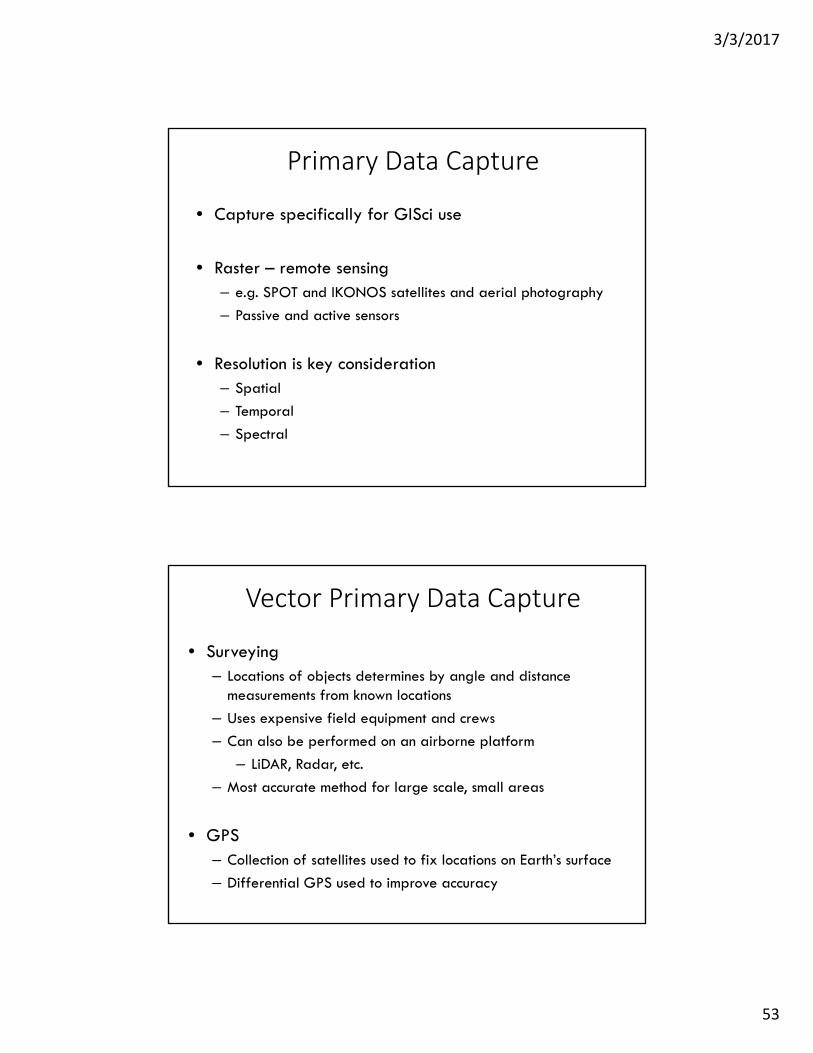
Primary Data Capture
• Capture specifically for GISci use
• Raster – remote sensing– e.g. SPOT and IKONOS satellites and aerial photography
– Passive and active sensors
• Resolution is key consideration– Spatial
– Temporal
– Spectral
Vector Primary Data Capture
• Surveying– Locations of objects determines by angle and distance
measurements from known locations
– Uses expensive field equipment and crews
– Can also be performed on an airborne platform
– LiDAR, Radar, etc.
– Most accurate method for large scale, small areas
• GPS– Collection of satellites used to fix locations on Earth’s surface
– Differential GPS used to improve accuracy

3/3/2017
54
Total Station

3/3/2017
55

3/3/2017
56
Secondary Geographic Data Capture
• Data collected for other purposes can be converted for use in GIS
• Raster conversion– Scanning of maps, aerial photographs, documents, etc
– Important scanning parameters are spatial and spectral (bit depth) resolution
Vector Secondary Data Capture
• Collection of vector objects from maps, photographs, plans, etc.
• Digitizing– Manual (table) – Heads-up and vectorization
• Photogrammetry – the science and technology of making measurements from photographs, etc.
• COGO – Coordinate Geometry

3/3/2017
57
Scanner
The most prevalent wayTo capture non-digital raster data
Scanners are:•Flatbed•Scrolling•Drum
Vector Over Raster
‘Heads-up’ data capture means the by-handdigitization of objects in vector format from a raster data source
i.e., tracing by hand-

3/3/2017
58
Digitizer
(A) undershoots and overshoots(B) invalid polygons
(C) sliver polygons
Types of human errors in digitizing:

3/3/2017
59
Error induced by data cleaning
Mismatches of adjacent spatial data sources that require rubber‐sheeting
Rubber-sheeting – is a procedurefor adjusting the coordinates of allthe data points in a dataset that allow a more accurate match between known locations and a few data points within a dataset
Rubber-sheeting preserves the Interconnectivity between points and objects through stretching, orreorienting their interconnectinglines
Object edges don’t align
Object edges align afterrubber-sheeting, butsometimes itcauses problemselsewhere