IBM Watson Marketing Insights - IBM Analytics … · engagement/watson-marketing-insights/). v...
61
IBM Watson Marketing Insights IBM
Transcript of IBM Watson Marketing Insights - IBM Analytics … · engagement/watson-marketing-insights/). v...
IBM Watson Marketing Insights
IBM
NoteBefore using this information and the product it supports, read the information in “Notices” on page 55.
Product Information
This document applies to IBM Watson Marketing Insights version 1.0.0 and may also apply to subsequent releases.
Licensed Materials - Property of IBM
© Copyright IBM Corporation 2017.US Government Users Restricted Rights – Use, duplication or disclosure restricted by GSA ADP Schedule Contractwith IBM Corp.
Contents
Chapter 1. Overview . . . . . . . . . 1Explore the customer home page . . . . . . . 3
Chapter 2. Getting started . . . . . . . 7
Chapter 3. Managing . . . . . . . . . 11Viewing audiences . . . . . . . . . . . . 11Selecting an audience . . . . . . . . . . . 12Creating an audience manually . . . . . . . . 12Creating an audience from an insight. . . . . . 13Copying an audience . . . . . . . . . . . 14View tagged audiences . . . . . . . . . . 14
Applying and clearing tags . . . . . . . . 15Editing and deleting tags . . . . . . . . . 16
Audience sharing through UBX. . . . . . . . 16Sharing your audiences through UBX. . . . . 16Managing how you share audiences throughUBX . . . . . . . . . . . . . . . . 17
Publish an audience to IBM Watson CampaignAutomation . . . . . . . . . . . . . . 18Saving audience data to your desktop . . . . . 19
Chapter 4. Analyzing . . . . . . . . . 21Explore customer attrition . . . . . . . . . 21
Review recommended audiences . . . . . . 21Review high-risk customers by engagementsegment . . . . . . . . . . . . . . 22Review top drivers of attrition . . . . . . . 24
Review attrition over time . . . . . . . . 25Explore customer engagement . . . . . . . . 26
Review predicted movement . . . . . . . 27Review historical movement . . . . . . . . 29Review active audience profiles. . . . . . . 31
Review the customer scorecard . . . . . . . . 33
Chapter 5. Scenarios. . . . . . . . . 37Customer overview scenario. . . . . . . . . 37
Step 1: Exploring the customer overview . . . 37Step 2: Creating an audience from an insight . . 39Step 3: Publishing the audience to IBM WatsonCampaign Automation . . . . . . . . . 41
Brand engagement trends scenario. . . . . . . 41Step 1: Exploring the engagement insight . . . 41Step 2: Creating a custom audience . . . . . 42Step 3: Exporting the audience . . . . . . . 45
Brand engagement and attrition risk scenario . . . 45Step 1: Exploring the brand engagement trends 45Step 2: Exploring the attrition risk . . . . . . 46Step 3: Creating a custom audience . . . . . 49Step 4: Exploring the attrition predictors. . . . 50Step 5: Sharing the audience in UBX . . . . . 51
Chapter 6. Predictive model sampledata . . . . . . . . . . . . . . . . 53
Notices . . . . . . . . . . . . . . 55
© Copyright IBM Corp. 2017 iii

iv IBM Watson Marketing Insights
Chapter 1. Overview
IBM® Watson™ Marketing Insights helps you explore data to understand andpredict customer behavior. Companies can use this invaluable information toidentify various groups of customers and create targeted marketing campaigns thatfocus specifically on these groups.
Watson Marketing Insights Standard Edition
Watson Marketing Insights Standard Edition is a core offering in the IBM WatsonMarketing portfolio. Core offerings can include multiple editions and add-ons.Watson Marketing Insights offerings are designed around the portfolio precisionmodel that features multiple editions to meet an organization's current businessneeds. Watson Marketing Insights Standard Edition includes 250,000 entity IDs(also known as customer records). Add-on parts for additional volumes of entityIDs are available either at initial purchase or at a later time.
Accessibility features
Accessibility features help users who have a physical disability, such as restrictedmobility or limited vision, to use information technology products. IBM HTMLdocumentation has accessibility features. For accessible documentation, see the IBMKnowledge Center (www.ibm.com/support/knowledgecenter/SSTNFA).
Active customers
A customer database typically contains profiles for all customers, including activeand inactive customers. Customer activity is defined by an attrition indicatorattribute in their profile. Because you want to focus on retaining customers, WatsonMarketing Insights includes a default filter for active customers only.
Analytic techniques
Watson Marketing Insights uses various analytic techniques, including machinelearning, predictive models, statistical analysis, heuristics, and calculations, todetect key customer attributes by analyzing past customer behavior.
For each customer, it generates the following values:v An attrition score - the likelihood of losing a customer.
For example, attrition score might be based on a combination of attributes suchas number of complaints, number of abandoned carts, number of items returned,and number of purchases in the last quarter. The attributes used to defineattrition score are determined by your organization.
v A customer lifetime value (CLTV) - the monetary value of a customer.For example, CTLV might be based on a combination of attributes such as lengthof time as a customer, number of purchases in the last month, and the totalvalue of all purchases. The attributes used to define CLTV are determined byyour organization.
v An engagement score - a fixed value assigned according to a customer'sengagement segment.For example “Highly engaged” = 100, “Disengaged” = 20.
© Copyright IBM Corp. 2017 1
v A pulse score - a percentage value that represents a customer's aggregate health.The value is based on a weighted combination of a customer's current attritionscore, CLTV, and engagement score.
Because customer values are automatically generated, they can change wheneverthe analytics are processed.
Insights
An insight is a significant trend, pattern, or observation detected in the customerdata that can highlight a specific engagement or attrition risk. It can also highlighta combination of factors, such as customer lifetime value (CLTV) and attrition risk.Watson Marketing Insights generates insights into customer behavior, weightsthem, and then ranks them in order of importance.
All ranked insights are available on the Watson Marketing Insights home page. Thefive highest ranked insights are shown in the top priority insights, with allremaining insights shown in the additional insights. You can also view each insightin more detail through a lens that provides a specific view of the data.
Because insights are automatically generated, they can change whenever theanalytics are processed.
Security considerations
The following information explains how security is implemented in WatsonMarketing Insights.v User security - user IDs and passwords are managed using an IBM ID. A
subscriber manages their list of users from My IBM - Products and Services.v API keys - an API key for the Watson Marketing Insights subscriber is provided
in the technical welcome kit. Invited users can log a customer support ticket torequest their own API key.
v Secure web communications - all access to the Watson Marketing Insights UIand APIs occurs by using HTTPS and TLS/SSL certificates. Valid certificatesensure the identity of the Watson Marketing Insights servers, and the encryptionof the data transmission.
v Data file uploading and downloading - before you upload data to the ObjectStorage account provided with the Watson Marketing Insights subscription, datafiles must be encrypted with Fernet encryption to ensure that only encrypteddata is held in the data centers.Files placed into Object Storage by Watson Marketing Insights are encryptedusing Fernet and must be decrypted by the user.For more information on encrypting an decrypting files, see the IBM WatsonMarketing Insights API Guide (http://developer.ibm.com/customer-engagement/watson-marketing-insights/).
v Integration with IBM Watson Campaign Automation is configured with anauthentication key that is shared by all users of a Watson Marketing Insightssubscriber. When a Watson Marketing Insights user imports or publishes data,they use the security permissions configured for the subscriber's authenticationkey in IBM Watson Campaign Automation.
2 IBM Watson Marketing Insights
Explore the customer home pageThe IBM Watson Marketing Insights home page provides an overview of recentcustomer activity and predictions about future behavior, for all active customers inyour company's database. It also provides insights into areas where you are at riskof losing customers.
You can use the home page to find which groups of customers have a high risk ofleaving or are soon to become disengaged. You can also identify brand engagementproblems.
The home page is divided into these areas: a historical summary, top priorityinsights, a customer snapshot, and additional insights.
Historical summary
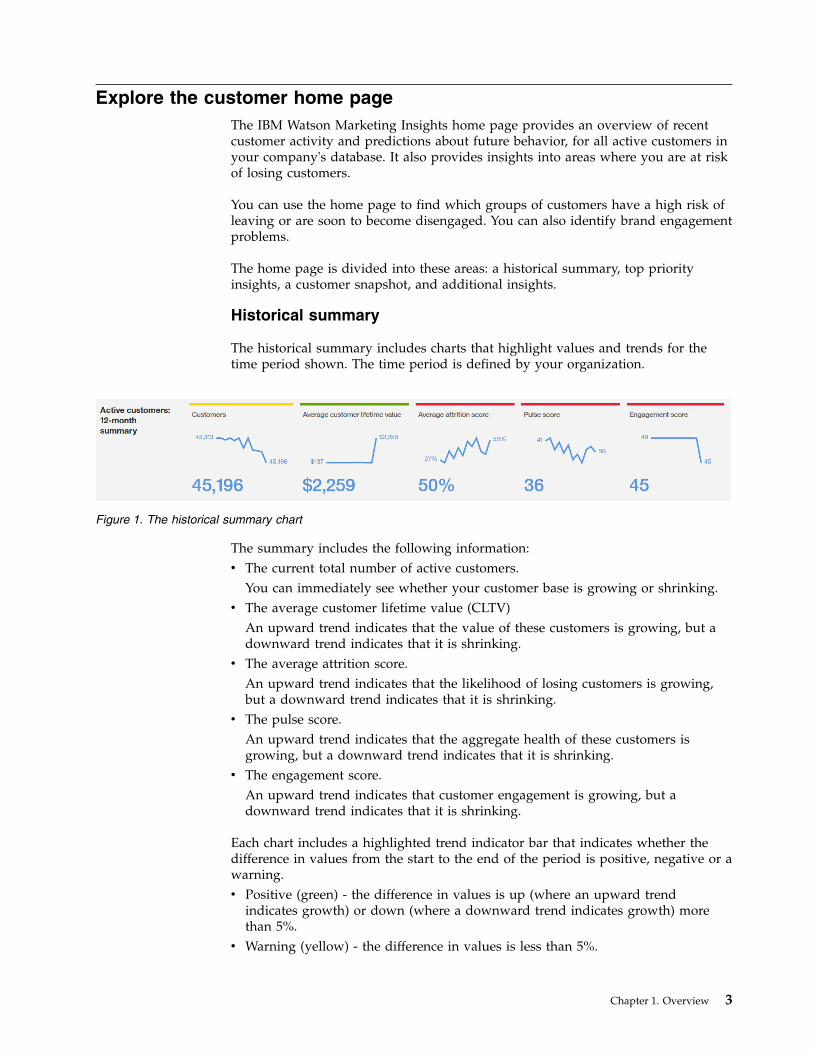
The historical summary includes charts that highlight values and trends for thetime period shown. The time period is defined by your organization.
The summary includes the following information:v The current total number of active customers.
You can immediately see whether your customer base is growing or shrinking.v The average customer lifetime value (CLTV)
An upward trend indicates that the value of these customers is growing, but adownward trend indicates that it is shrinking.
v The average attrition score.An upward trend indicates that the likelihood of losing customers is growing,but a downward trend indicates that it is shrinking.
v The pulse score.An upward trend indicates that the aggregate health of these customers isgrowing, but a downward trend indicates that it is shrinking.
v The engagement score.An upward trend indicates that customer engagement is growing, but adownward trend indicates that it is shrinking.
Each chart includes a highlighted trend indicator bar that indicates whether thedifference in values from the start to the end of the period is positive, negative or awarning.v Positive (green) - the difference in values is up (where an upward trend
indicates growth) or down (where a downward trend indicates growth) morethan 5%.
v Warning (yellow) - the difference in values is less than 5%.
Figure 1. The historical summary chart
Chapter 1. Overview 3
v Negative (red) - the difference in values is down (where an upward trendindicates growth) or up (where a downward trend indicates growth) more than5%.
In Figure 1 on page 3, you can see a historical summary of active customers for thelast 12 months. In this time, the number of customers grew, but less than 5%.Growth in CLTV is positive. The change in risk of attrition, pulse score, andengagement score are all negative.
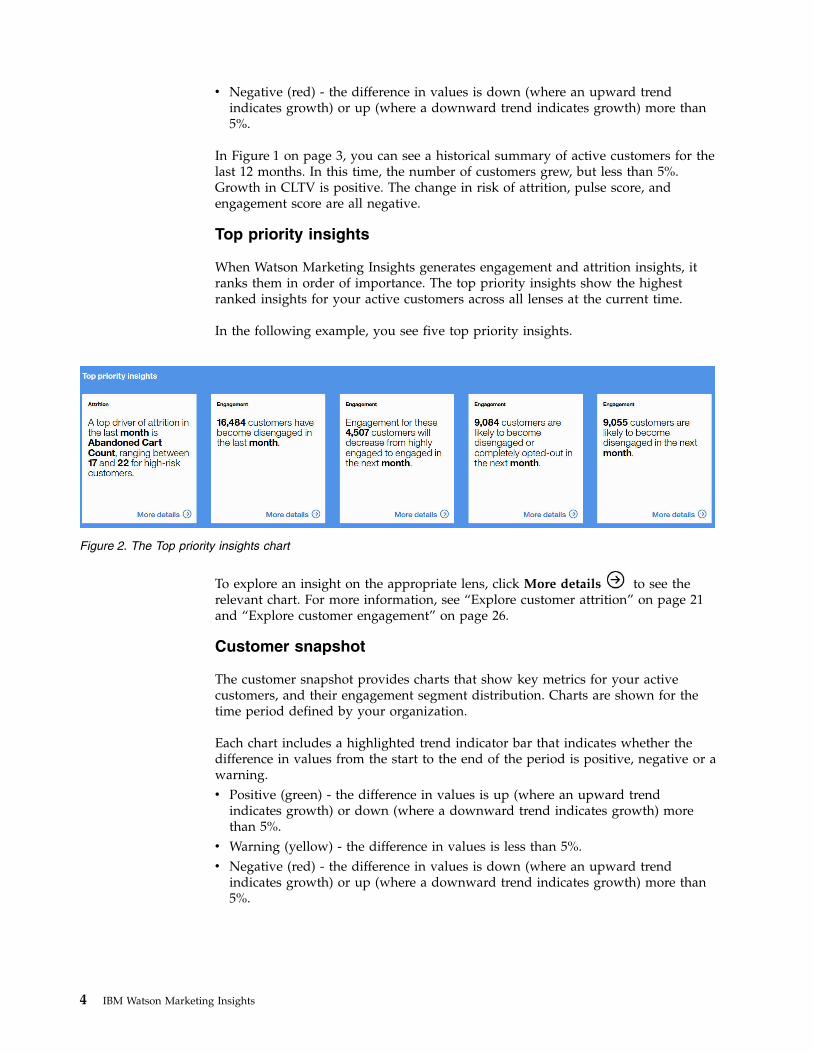
Top priority insights
When Watson Marketing Insights generates engagement and attrition insights, itranks them in order of importance. The top priority insights show the highestranked insights for your active customers across all lenses at the current time.
In the following example, you see five top priority insights.
To explore an insight on the appropriate lens, click More details to see therelevant chart. For more information, see “Explore customer attrition” on page 21and “Explore customer engagement” on page 26.
Customer snapshot
The customer snapshot provides charts that show key metrics for your activecustomers, and their engagement segment distribution. Charts are shown for thetime period defined by your organization.
Each chart includes a highlighted trend indicator bar that indicates whether thedifference in values from the start to the end of the period is positive, negative or awarning.v Positive (green) - the difference in values is up (where an upward trend
indicates growth) or down (where a downward trend indicates growth) morethan 5%.
v Warning (yellow) - the difference in values is less than 5%.v Negative (red) - the difference in values is down (where an upward trend
indicates growth) or up (where a downward trend indicates growth) more than5%.
Figure 2. The Top priority insights chart
4 IBM Watson Marketing Insights
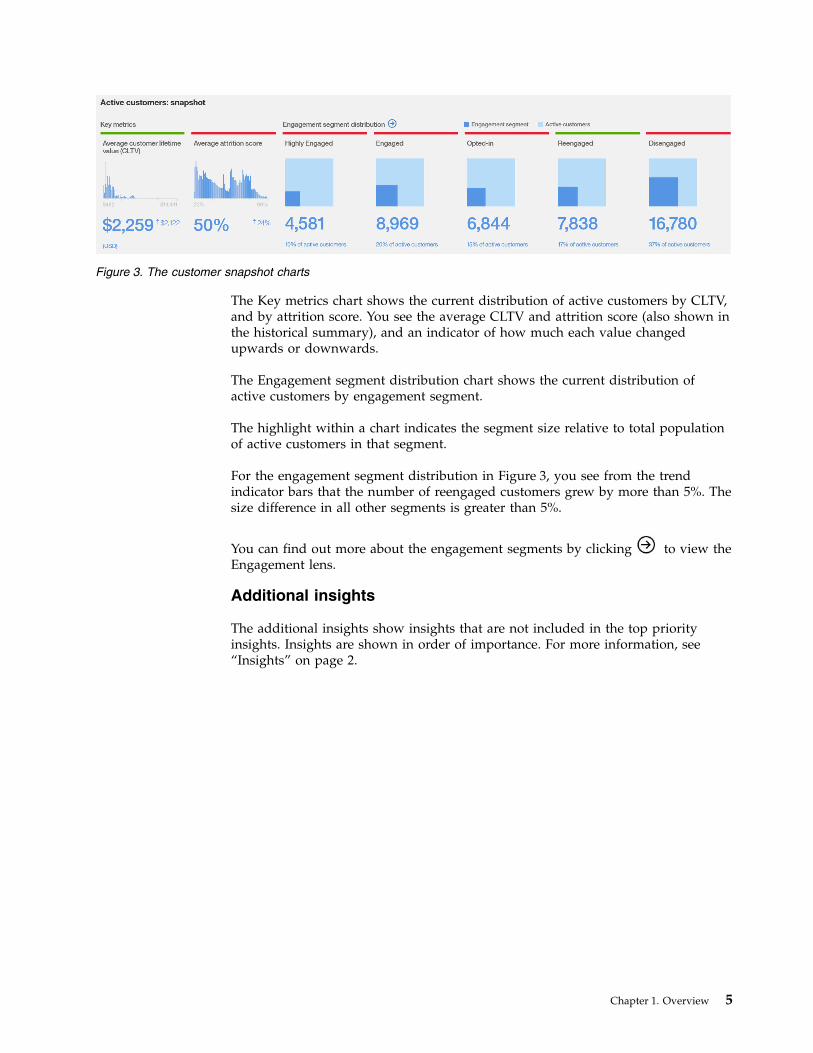
The Key metrics chart shows the current distribution of active customers by CLTV,and by attrition score. You see the average CLTV and attrition score (also shown inthe historical summary), and an indicator of how much each value changedupwards or downwards.
The Engagement segment distribution chart shows the current distribution ofactive customers by engagement segment.
The highlight within a chart indicates the segment size relative to total populationof active customers in that segment.
For the engagement segment distribution in Figure 3, you see from the trendindicator bars that the number of reengaged customers grew by more than 5%. Thesize difference in all other segments is greater than 5%.
You can find out more about the engagement segments by clicking
to view theEngagement lens.
Additional insights
The additional insights show insights that are not included in the top priorityinsights. Insights are shown in order of importance. For more information, see“Insights” on page 2.
Figure 3. The customer snapshot charts
Chapter 1. Overview 5
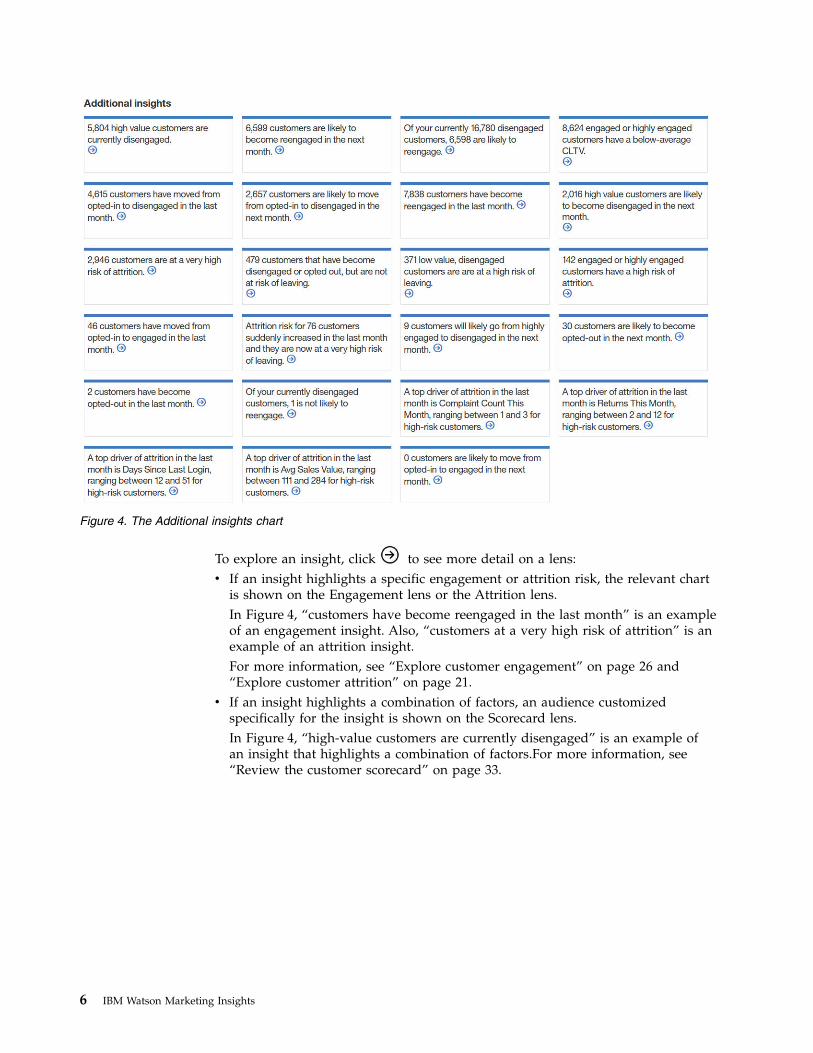
To explore an insight, click
to see more detail on a lens:v If an insight highlights a specific engagement or attrition risk, the relevant chart
is shown on the Engagement lens or the Attrition lens.In Figure 4, “customers have become reengaged in the last month” is an exampleof an engagement insight. Also, “customers at a very high risk of attrition” is anexample of an attrition insight.For more information, see “Explore customer engagement” on page 26 and“Explore customer attrition” on page 21.
v If an insight highlights a combination of factors, an audience customizedspecifically for the insight is shown on the Scorecard lens.In Figure 4, “high-value customers are currently disengaged” is an example ofan insight that highlights a combination of factors.For more information, see“Review the customer scorecard” on page 33.
Figure 4. The Additional insights chart
6 IBM Watson Marketing Insights
Chapter 2. Getting started
Get up and running with IBM Watson Marketing Insights in four easy steps.v Register Watson Marketing Insights as an endpoint in IBM Universal Behavior
Exchange (UBX).v Understand the available views of customer engagement and attrition.v Identify target audiences.v Act on the audience details and insights.
Before you begin
Some simple preparations are required before you can start working with WatsonMarketing Insights.
You need an IBMiD to access Watson Marketing Insights. If you don't already havean IBMiD, you can get one here: https://www.ibm.com/account/us-en/signup/register.html.
You also need your Watson Marketing Insights welcome kit. It containsinformation that you must enter during the startup process.
You can start working with your customer data as soon as you access WatsonMarketing Insights. Your system administrator uploads the initial collection ofcustomer data that you will work with. The data is refreshed periodically,according to a frequency that is set during the initial configuration.
Step 1 - Register Watson Marketing Insights as an endpoint inUBX
Watson Marketing Insights publishes audience data by sharing it through IBMUniversal Behavior Exchange (UBX). To publish audiences that you define inWatson Marketing Insights, you must register Watson Marketing Insights as anendpoint in your UBX user account. You must access UBX to complete this task.
During the registration process, the endpoint registration wizard prompts you toprovide an API key. You can find the API key in your Watson Marketing Insightstechnical welcome kit. Do not lose or share this key. Like a password, it controlsaccess to your sensitive data.
When the Watson Marketing Insights endpoint is active in your UBX account,contact Watson Marketing Insights Support ([email protected]) to provide yourUBX account name. To determine your account name, in UBX, click your username to display Login details. The login details include the user account name.
For more information about registering an endpoint in UBX, see Registeringendpoints.
Step 2 - Understand customer engagement and attrition
Quickly and clearly understanding the most important attributes about yourcustomers is vital to designing effective marketing campaigns. Watson Marketing
© Copyright IBM Corp. 2017 7
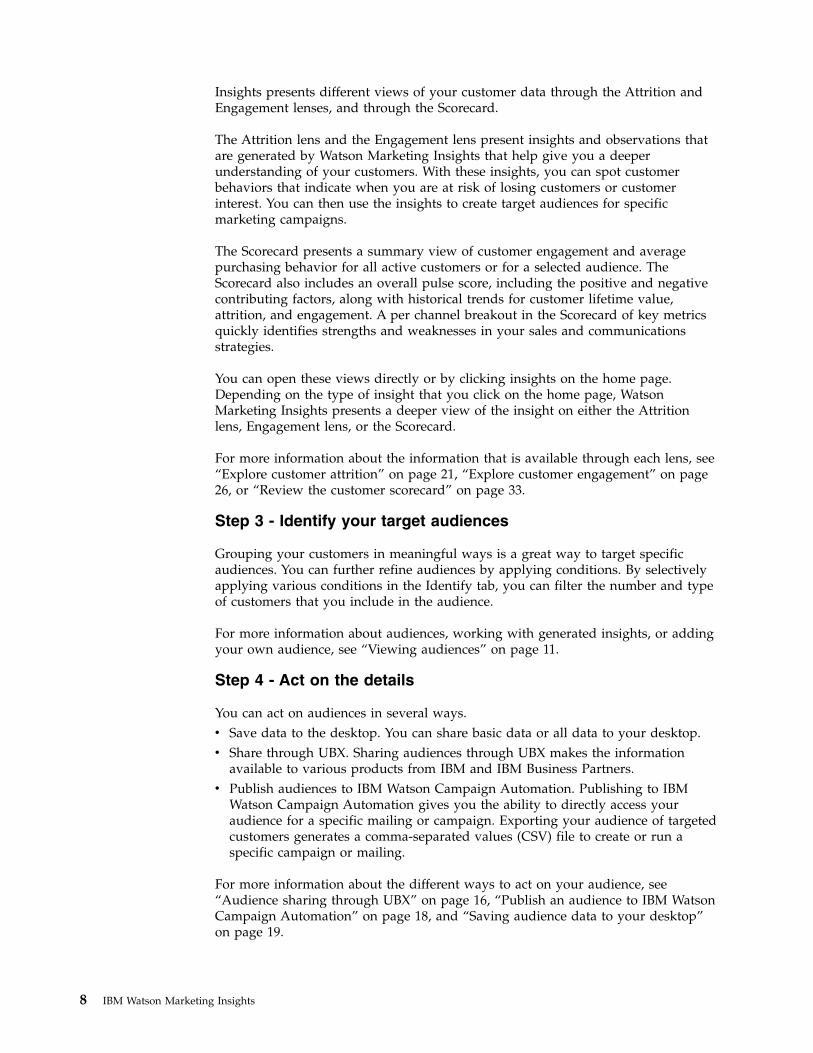
Insights presents different views of your customer data through the Attrition andEngagement lenses, and through the Scorecard.
The Attrition lens and the Engagement lens present insights and observations thatare generated by Watson Marketing Insights that help give you a deeperunderstanding of your customers. With these insights, you can spot customerbehaviors that indicate when you are at risk of losing customers or customerinterest. You can then use the insights to create target audiences for specificmarketing campaigns.
The Scorecard presents a summary view of customer engagement and averagepurchasing behavior for all active customers or for a selected audience. TheScorecard also includes an overall pulse score, including the positive and negativecontributing factors, along with historical trends for customer lifetime value,attrition, and engagement. A per channel breakout in the Scorecard of key metricsquickly identifies strengths and weaknesses in your sales and communicationsstrategies.
You can open these views directly or by clicking insights on the home page.Depending on the type of insight that you click on the home page, WatsonMarketing Insights presents a deeper view of the insight on either the Attritionlens, Engagement lens, or the Scorecard.
For more information about the information that is available through each lens, see“Explore customer attrition” on page 21, “Explore customer engagement” on page26, or “Review the customer scorecard” on page 33.
Step 3 - Identify your target audiences
Grouping your customers in meaningful ways is a great way to target specificaudiences. You can further refine audiences by applying conditions. By selectivelyapplying various conditions in the Identify tab, you can filter the number and typeof customers that you include in the audience.
For more information about audiences, working with generated insights, or addingyour own audience, see “Viewing audiences” on page 11.
Step 4 - Act on the details
You can act on audiences in several ways.v Save data to the desktop. You can share basic data or all data to your desktop.v Share through UBX. Sharing audiences through UBX makes the information
available to various products from IBM and IBM Business Partners.v Publish audiences to IBM Watson Campaign Automation. Publishing to IBM
Watson Campaign Automation gives you the ability to directly access youraudience for a specific mailing or campaign. Exporting your audience of targetedcustomers generates a comma-separated values (CSV) file to create or run aspecific campaign or mailing.
For more information about the different ways to act on your audience, see“Audience sharing through UBX” on page 16, “Publish an audience to IBM WatsonCampaign Automation” on page 18, and “Saving audience data to your desktop”on page 19.
8 IBM Watson Marketing Insights

Supported browsers
Use Watson Marketing Insights on supported browsers to avoid functional orinterface issues.
Watson Marketing Insights is supported on the following browsers:v Google Chrome version 51+v Internet Explorer version 11+v Firefox version 45+
Chapter 2. Getting started 9

10 IBM Watson Marketing Insights
Chapter 3. Managing
These topics describe how to manage audiences in IBM Watson Marketing Insights.
Viewing audiencesAn audience contains one or more conditions to filter the number of customers.For example, you might define an audience to include only married customerswho own their homes.
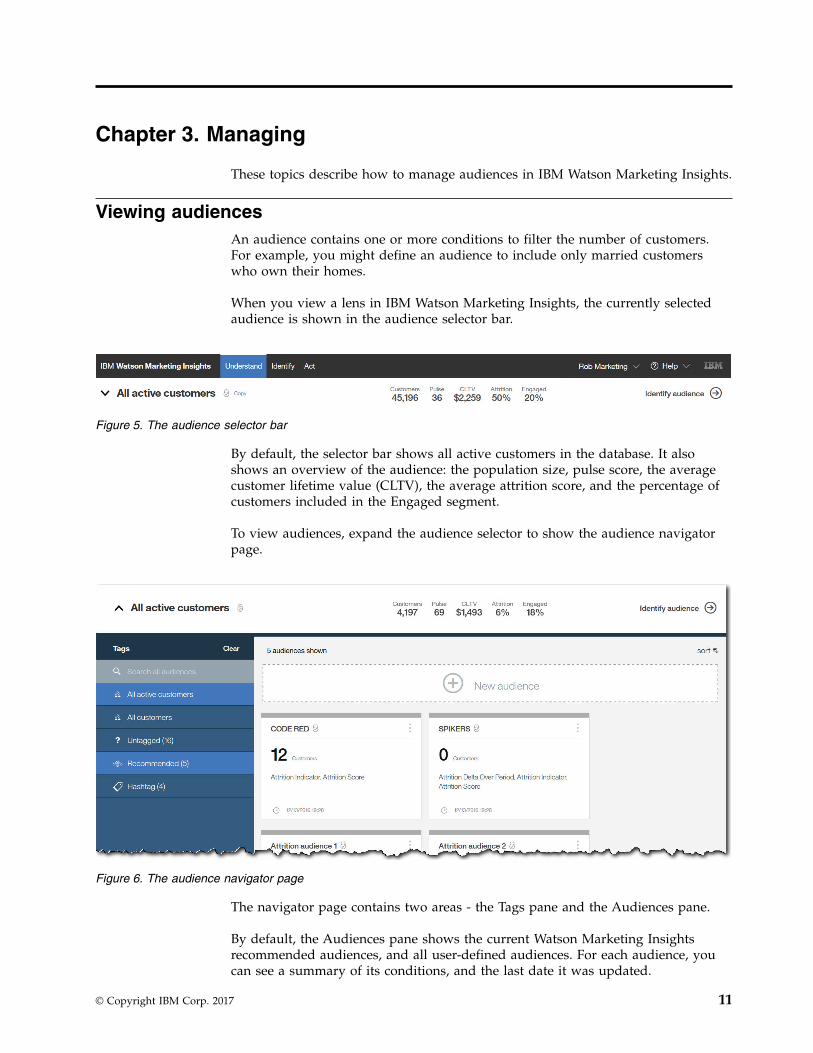
When you view a lens in IBM Watson Marketing Insights, the currently selectedaudience is shown in the audience selector bar.
By default, the selector bar shows all active customers in the database. It alsoshows an overview of the audience: the population size, pulse score, the averagecustomer lifetime value (CLTV), the average attrition score, and the percentage ofcustomers included in the Engaged segment.
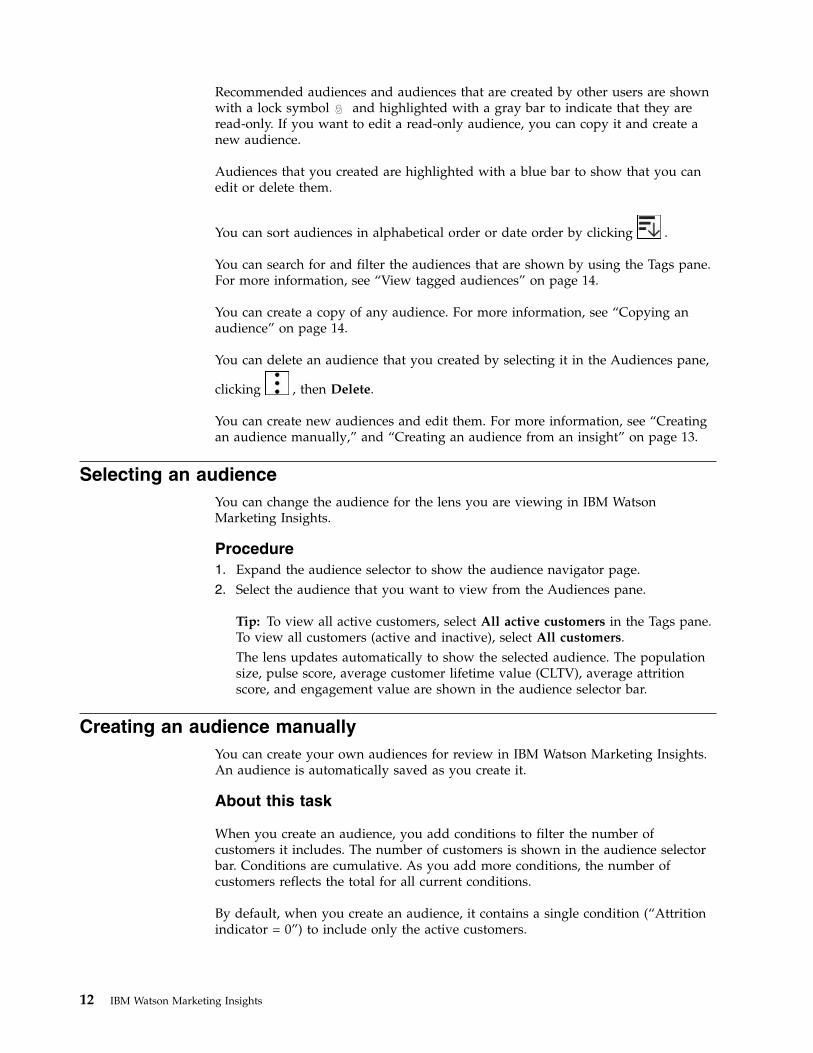
To view audiences, expand the audience selector to show the audience navigatorpage.
The navigator page contains two areas - the Tags pane and the Audiences pane.
By default, the Audiences pane shows the current Watson Marketing Insightsrecommended audiences, and all user-defined audiences. For each audience, youcan see a summary of its conditions, and the last date it was updated.
Figure 5. The audience selector bar
Figure 6. The audience navigator page
© Copyright IBM Corp. 2017 11
Recommended audiences and audiences that are created by other users are shownwith a lock symbol
and highlighted with a gray bar to indicate that they are
read-only. If you want to edit a read-only audience, you can copy it and create anew audience.
Audiences that you created are highlighted with a blue bar to show that you canedit or delete them.
You can sort audiences in alphabetical order or date order by clicking .
You can search for and filter the audiences that are shown by using the Tags pane.For more information, see “View tagged audiences” on page 14.
You can create a copy of any audience. For more information, see “Copying anaudience” on page 14.
You can delete an audience that you created by selecting it in the Audiences pane,
clicking , then Delete.
You can create new audiences and edit them. For more information, see “Creatingan audience manually,” and “Creating an audience from an insight” on page 13.
Selecting an audienceYou can change the audience for the lens you are viewing in IBM WatsonMarketing Insights.
Procedure1. Expand the audience selector to show the audience navigator page.2. Select the audience that you want to view from the Audiences pane.
Tip: To view all active customers, select All active customers in the Tags pane.To view all customers (active and inactive), select All customers.The lens updates automatically to show the selected audience. The populationsize, pulse score, average customer lifetime value (CLTV), average attritionscore, and engagement value are shown in the audience selector bar.
Creating an audience manuallyYou can create your own audiences for review in IBM Watson Marketing Insights.An audience is automatically saved as you create it.
About this task
When you create an audience, you add conditions to filter the number ofcustomers it includes. The number of customers is shown in the audience selectorbar. Conditions are cumulative. As you add more conditions, the number ofcustomers reflects the total for all current conditions.
By default, when you create an audience, it contains a single condition (“Attritionindicator = 0”) to include only the active customers.
12 IBM Watson Marketing Insights
The number of customers in a chart reflects all conditions in the audiencedefinition. Suppose that you have three conditions, “City = Chicago”, “Gender =Male”, and “ Family stage = Married”. If you select the chart for the Gendercondition, it shows customers for all three conditions combined.
Procedure1. In the Identify tab, either click Copy next to the audience name, or click in the
New audience area.A new untitled audience is created.
2. To add a title to the audience, click Untitled audience and type a name.3. To define the audience, add conditions to the audience:
a. Click Add a condition in the audience definition pane.The Add a condition dialog opens.
b. Select an attribute that you want to include in the condition, and click Next.In the audience definition pane, a new condition card is displayed with theselected attribute.
c. Specify the values for the attribute.The condition is now defined.
d. Optionally, you can add further conditions to the audience definition, byclicking Add a condition in the audience definition pane.
4. Type a Description that defines the audience.5. To add a keyword tag for the audience, select an existing tag or type a new tag
in Tags.For more information, see “View tagged audiences” on page 14.
Creating an audience from an insightWhen you select an insight in a chart on a lens, you can create an audience basedon the customers included in the insight.
About this task
IBM Watson Marketing Insights combines the conditions for the currently selectedaudience with the insight conditions to create the new audience. For example,suppose the audience that you are viewing has one condition “City = Chicago”,and the insight has two conditions “Attrition score > 80”, and “Complaints = 3”.When you create an audience from the insight, Watson Marketing Insights createsan audience that includes all three conditions.
Procedure1. View a chart with insights on the Attrition lens or Engagement lens.
2. Select the insight for which you want to create an audience, and click .For examples of how to select an insight in a chart on the Attrition lens, see“Review high-risk customers by engagement segment” on page 22, and“Review top drivers of attrition” on page 24.For examples of how to select an insight in a chart on the Engagement lens, see“Review predicted movement” on page 27, and “Review historical movement”on page 29.The Insight bar shows the audience that is created from the insight.
Chapter 3. Managing 13
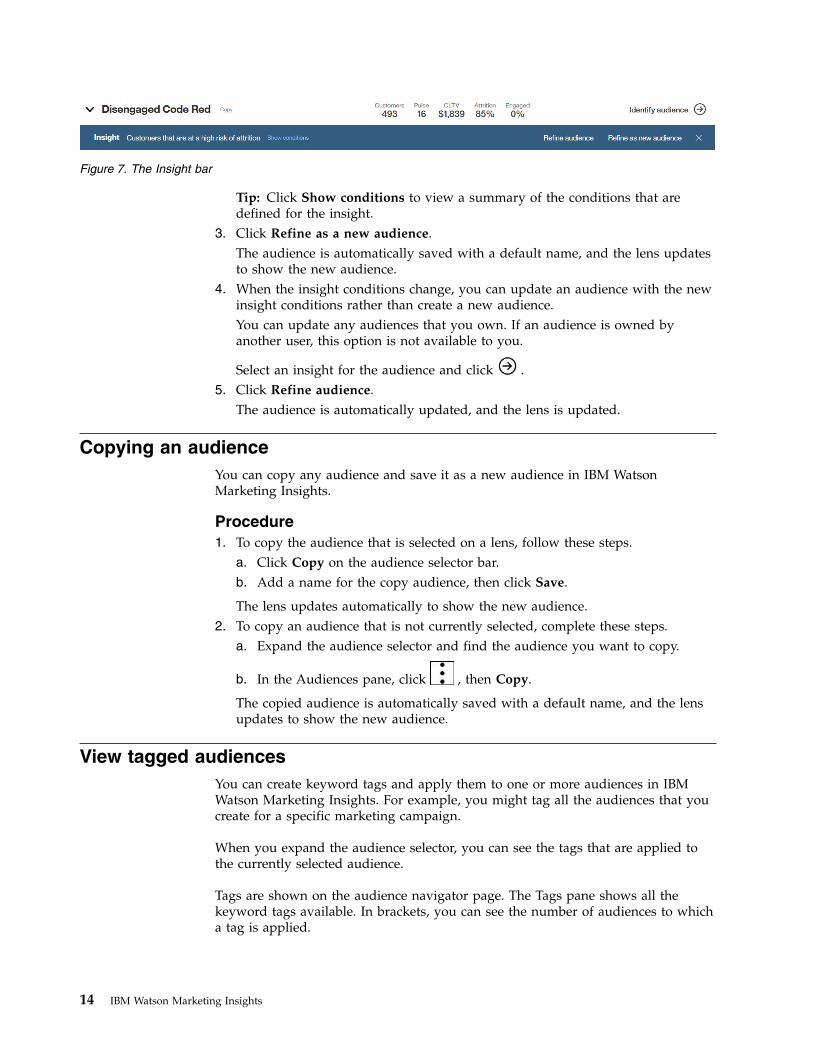
Tip: Click Show conditions to view a summary of the conditions that aredefined for the insight.
3. Click Refine as a new audience.The audience is automatically saved with a default name, and the lens updatesto show the new audience.
4. When the insight conditions change, you can update an audience with the newinsight conditions rather than create a new audience.You can update any audiences that you own. If an audience is owned byanother user, this option is not available to you.
Select an insight for the audience and click .5. Click Refine audience.
The audience is automatically updated, and the lens is updated.
Copying an audienceYou can copy any audience and save it as a new audience in IBM WatsonMarketing Insights.
Procedure1. To copy the audience that is selected on a lens, follow these steps.
a. Click Copy on the audience selector bar.b. Add a name for the copy audience, then click Save.
The lens updates automatically to show the new audience.2. To copy an audience that is not currently selected, complete these steps.
a. Expand the audience selector and find the audience you want to copy.
b. In the Audiences pane, click , then Copy.
The copied audience is automatically saved with a default name, and the lensupdates to show the new audience.
View tagged audiencesYou can create keyword tags and apply them to one or more audiences in IBMWatson Marketing Insights. For example, you might tag all the audiences that youcreate for a specific marketing campaign.
When you expand the audience selector, you can see the tags that are applied tothe currently selected audience.
Tags are shown on the audience navigator page. The Tags pane shows all thekeyword tags available. In brackets, you can see the number of audiences to whicha tag is applied.
Figure 7. The Insight bar
14 IBM Watson Marketing Insights
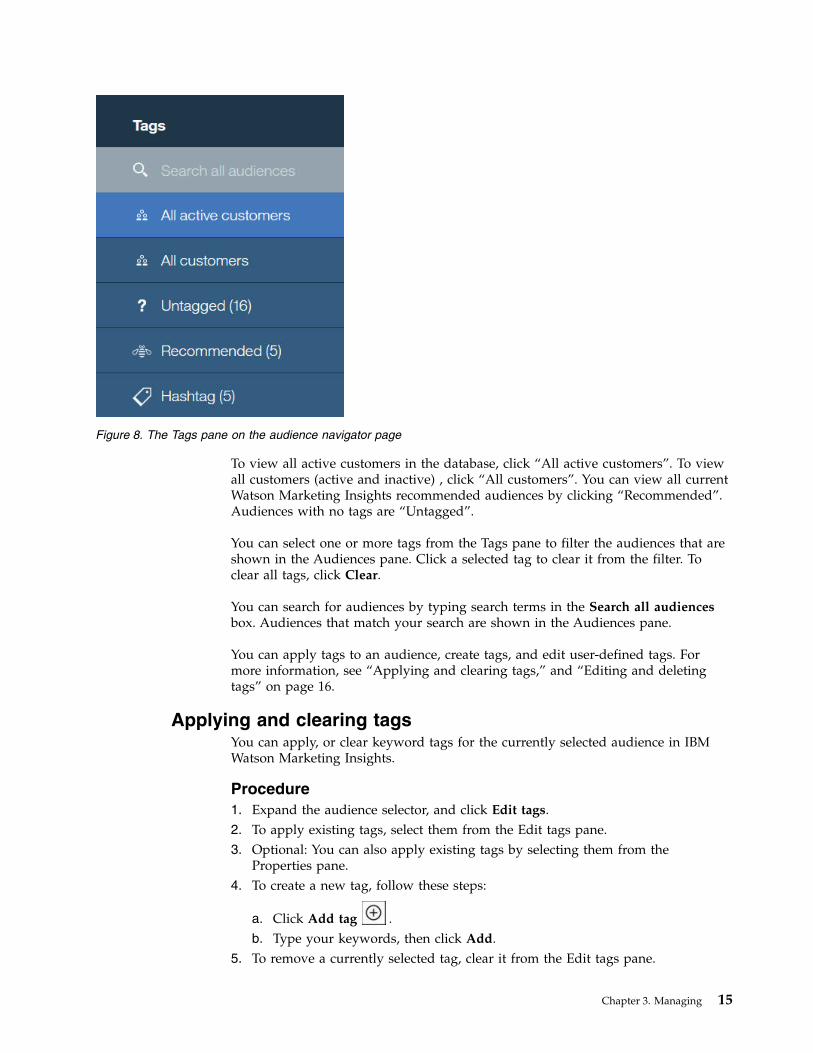
To view all active customers in the database, click “All active customers”. To viewall customers (active and inactive) , click “All customers”. You can view all currentWatson Marketing Insights recommended audiences by clicking “Recommended”.Audiences with no tags are “Untagged”.
You can select one or more tags from the Tags pane to filter the audiences that areshown in the Audiences pane. Click a selected tag to clear it from the filter. Toclear all tags, click Clear.
You can search for audiences by typing search terms in the Search all audiencesbox. Audiences that match your search are shown in the Audiences pane.
You can apply tags to an audience, create tags, and edit user-defined tags. Formore information, see “Applying and clearing tags,” and “Editing and deletingtags” on page 16.
Applying and clearing tagsYou can apply, or clear keyword tags for the currently selected audience in IBMWatson Marketing Insights.
Procedure1. Expand the audience selector, and click Edit tags.2. To apply existing tags, select them from the Edit tags pane.3. Optional: You can also apply existing tags by selecting them from the
Properties pane.4. To create a new tag, follow these steps:
a. Click Add tag .b. Type your keywords, then click Add.
5. To remove a currently selected tag, clear it from the Edit tags pane.
Figure 8. The Tags pane on the audience navigator page
Chapter 3. Managing 15
6. Optional: You can also clear a currently selected tag by selecting it from theProperties pane.
7. Click Done to update the tags.
Editing and deleting tagsYou can edit and delete user-defined tags in IBM Watson Marketing Insights. Youcannot edit or delete tags that are applied to read-only audiences.
Procedure1. Expand the audience selector, and click the Edit tags.2. In the Edit tags pane, select the tag to edit.
3. To rename a selected tag, click , and then click Rename.
4. To delete a selected tag, click , and then click Delete.5. Optional: You can also delete an existing tag from the Properties pane.6. Click Done to close the Edit tags pane.
Audience sharing through UBXYou can use IBM Universal Behavior Exchange (UBX) to share audiences that youcreate in IBM Watson Marketing Insights with products from IBM and selectedIBM Business Partners that integrate with UBX.
To share audiences that you create in Watson Marketing Insights through UBX, youmust register Watson Marketing Insights as an endpoint in your UBX user account.After you register Watson Marketing Insights with UBX, it appears in the UBXinterface for your account as an audience source endpoint.
When you share an audience through UBX in Watson Marketing Insights, itappears in UBX as an available audience under the Watson Marketing Insightsendpoint. In UBX, you can then share the audience with an audience destinationendpoint. Various products from IBM and IBM Business Partners integrate withUBX as audience destinations.
Note: The audience data remains with Watson Marketing Insights until you sharethe data with a destination endpoint. UBX does not store the audience data.
For more information about registering Watson Marketing Insights as an endpointin UBX, see “Step 1 - Register Watson Marketing Insights as an endpoint in UBX”on page 7.
Sharing your audiences through UBXIBM Watson Marketing Insights provides an option to make audiences that youcreate in Watson Marketing Insights available for sharing with other productsthrough IBM Universal Behavior Exchange (UBX).
About this task
Sharing an audience that you create in Watson Marketing Insights through UBXgives you a way to quickly use insights and observations in Watson MarketingInsights to act in other products that you have registered with UBX. For example,if you create an audience that identifies high value, at risk customers that prefer
16 IBM Watson Marketing Insights
contact by email, you can use UBX to deliver the audience to IBM WatsonCampaign Automation to start an email campaign, but only if you have alsoregistered IBM Watson Campaign Automation in your UBX account.
In UBX, you can share audiences according to a schedule, either at a singlespecified date and time, or recurrently at a specified frequency. In WatsonMarketing Insights, customer data is refreshed according to a schedule that isdefined by your system administrator. To ensure that you always share the mostcurrent audience data, coordinate scheduled audience sharing in UBX to occurafter scheduled data refresh in Watson Marketing Insights.
Note: Recommended audiences and audiences that are created by other WatsonMarketing Insights users display as read-only.
Procedure1. You can start sharing an audience either from the Identify tab or the Act tab.
a. On the Identify tab, select an audience and click Take action on theaudience selector bar.
b. On the Act tab, select the audience with the audience selector.
The Act tab then displays several publishing options for the selected audience,including Share via UBX.
2. Select Share via UBX.3. Click Send audience.
Results
When Watson Marketing Insights finishes making the audience available to UBX, amessage displays and Share via UBX changes to Unshare via UBX.
In UBX, the published audience appears in the Audiences tab as a selection underthe Watson Marketing Insights endpoint.
Managing how you share audiences through UBXYou can control sharing of the audiences that you create in IBM Watson MarketingInsights. However, you cannot control sharing of recommended audiences andaudiences that are created by other Watson Marketing Insights users.
About this task
As the creator of an audience, you can control when to make the audienceavailable in IBM Universal Behavior Exchange (UBX) by sharing the audience. Youcan also control sharing of audiences that you copy. You can remove any of yourpreviously shared audiences from the list of available audiences in UBX byunsharing them in Watson Marketing Insights.
You have less control over audiences that are created by other Watson MarketingInsights users or audiences that are created by Watson Marketing Insights asrecommended audiences.
Audiences that are created by other Watson Marketing Insights users in yourorganization appear as read-only. You cannot share or prevent sharing of theseaudiences. However, you can share a read-only audience by copying and renamingthe audience.
Chapter 3. Managing 17
By default, Watson Marketing Insights shares recommended audiences throughUBX. You cannot prevent sharing of recommended audiences through UBX.
Procedure1. From either the Identify tab or the Act tab, you can start removing an audience
as an available audience in UBX.a. On the Identify tab, select an audience and click Take action on the
audience selector bar.b. On the Act tab, select the audience with the audience selector.
The Act tab then displays several publishing options for the selected audience,including Unshare via UBX.
2. Select Unshare via UBX.3. Click Send audience to remove the audience from the list of Watson Marketing
Insights audiences that are available for sharing through UBX.
Results
When you unshare the audience, a message displays and the Unshare via UBXoption changes to Share via UBX. To make the audience available in UBX later,you must share the audience again.
Note: Unsharing an audience that is shared according to a schedule in UBX causesan error in UBX. To avoid errors, cancel all UBX audience sharing schedules thatreference the audience that you unshare in Watson Marketing Insights.
Publish an audience to IBM Watson Campaign AutomationYou can publish an audience to IBM Watson Campaign Automation to use as thebasis for creating campaigns. To publish an audience, it must be shared in IBMUniversal Behavior Exchange (UBX) first. IBM Watson Marketing Insights checkswhether an audience is already shared, and automatically shares it beforepublishing, if necessary.
About this task
You can publish audiences created by you but not read-only audiences (WatsonMarketing Insights recommended audiences and those audiences created by otherusers). If you want to publish a read-only audience, you can copy it.
Procedure1. If you are viewing the Identify tab, and you want to publish the currently
selected audience, click Take action on the audience selector bar.Otherwise, select an audience from the audience selector, and click the Act tab.
2. Select Publish to IBM Watson Campaign Automation.3. Click Send audience.
Results
When the audience is published, a message is shown.
18 IBM Watson Marketing Insights
Saving audience data to your desktopYou can save audience data to your desktop. Data is saved to a comma-separatedvalues (csv) file.
About this task
You can save data for all customers, an IBM Watson Marketing Insightsrecommended audience, or any user-defined audience.
Procedure1. If you are viewing the Identify tab, and you want to save data for the currently
selected audience, click Take action on the audience selector bar.Otherwise, select an audience from the audience selector, and click the Act tab.
2. Select the package of data to save.v Select Save basic data to desktop to save only basic customer details.v Select Save all data to desktop to save all available customer data.
3. Click Send audience to save the data.
Results
When the data is saved, a message is shown, and you are prompted to open orsave the csv file.
Chapter 3. Managing 19

20 IBM Watson Marketing Insights
Chapter 4. Analyzing
These topics describe how to analyze customer behavior using different lenses inIBM Watson Marketing Insights to focus customer attrition, and customerengagement.
To view a lens, click the Understand tab, then select an option from the lens pane.
Explore customer attritionYou use the Attrition lens in IBM Watson Marketing Insights to explore the risk oflosing customers. You can find out the reasons for risk, and understand thebehavior of these customers. You can also identify select groups of customers thatyou want to target with marketing campaigns to retain them.
You can start to explore customer attrition by following one of these workflows:v Review the current audiences at risk of attrition as recommended by Watson
Marketing Insights.For more information, see “Review recommended audiences.”
v Create your own audiences for review.For more information, see “Creating an audience manually” on page 12 and“Creating an audience from an insight” on page 13.
Review recommended audiencesIBM Watson Marketing Insights automatically generates lists of customers (knownas recommended audiences) with the highest predicted risk of attrition.
Predictions are made by analyzing and comparing the behavior of active customersand inactive customers. First, an attrition score is generated for each customer.Next, the recommended audiences are created by examining high risk customers,and finding any similarities or associations among the top predictors of attrition.
Recommended audiences can change whenever the analytics are processed andreveal new insights into customer behavior. Because they are dynamic, you cannotedit them.
The Recommended audiences chart shows the current top recommended audienceswith the highest risk of attrition.
© Copyright IBM Corp. 2017 21
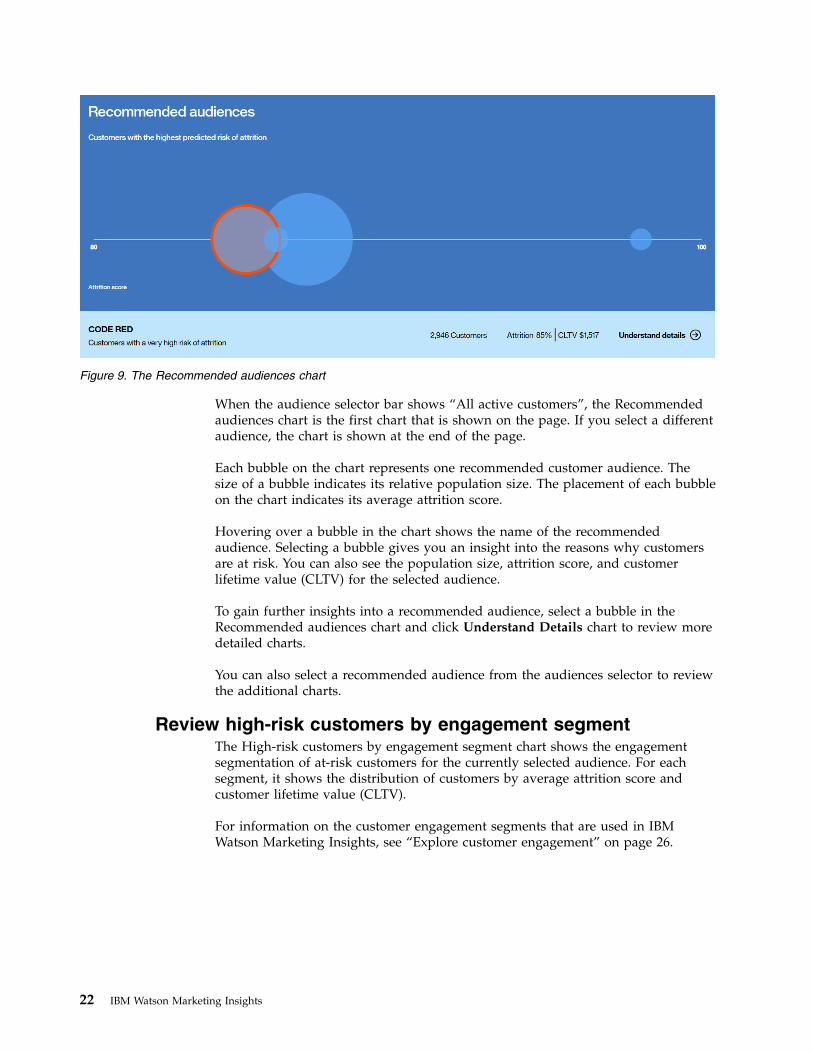
When the audience selector bar shows “All active customers”, the Recommendedaudiences chart is the first chart that is shown on the page. If you select a differentaudience, the chart is shown at the end of the page.
Each bubble on the chart represents one recommended customer audience. Thesize of a bubble indicates its relative population size. The placement of each bubbleon the chart indicates its average attrition score.
Hovering over a bubble in the chart shows the name of the recommendedaudience. Selecting a bubble gives you an insight into the reasons why customersare at risk. You can also see the population size, attrition score, and customerlifetime value (CLTV) for the selected audience.
To gain further insights into a recommended audience, select a bubble in theRecommended audiences chart and click Understand Details chart to review moredetailed charts.
You can also select a recommended audience from the audiences selector to reviewthe additional charts.
Review high-risk customers by engagement segmentThe High-risk customers by engagement segment chart shows the engagementsegmentation of at-risk customers for the currently selected audience. For eachsegment, it shows the distribution of customers by average attrition score andcustomer lifetime value (CLTV).
For information on the customer engagement segments that are used in IBMWatson Marketing Insights, see “Explore customer engagement” on page 26.
Figure 9. The Recommended audiences chart
22 IBM Watson Marketing Insights
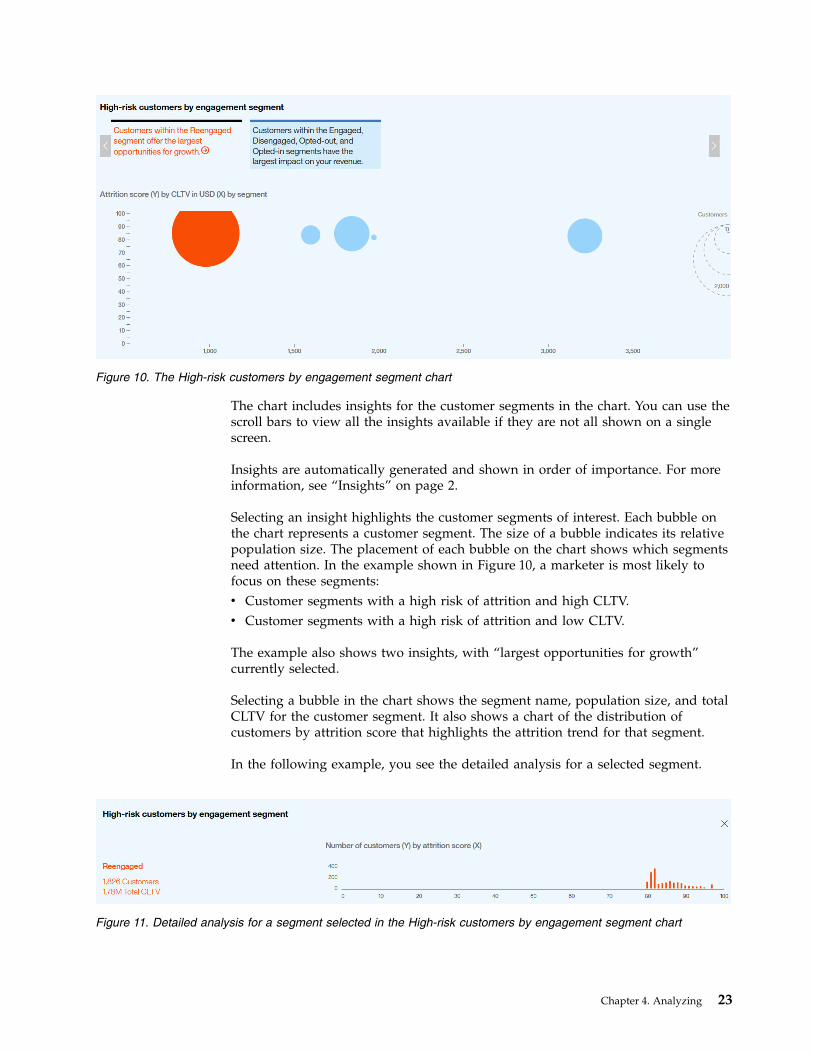
The chart includes insights for the customer segments in the chart. You can use thescroll bars to view all the insights available if they are not all shown on a singlescreen.
Insights are automatically generated and shown in order of importance. For moreinformation, see “Insights” on page 2.
Selecting an insight highlights the customer segments of interest. Each bubble onthe chart represents a customer segment. The size of a bubble indicates its relativepopulation size. The placement of each bubble on the chart shows which segmentsneed attention. In the example shown in Figure 10, a marketer is most likely tofocus on these segments:v Customer segments with a high risk of attrition and high CLTV.v Customer segments with a high risk of attrition and low CLTV.
The example also shows two insights, with “largest opportunities for growth”currently selected.
Selecting a bubble in the chart shows the segment name, population size, and totalCLTV for the customer segment. It also shows a chart of the distribution ofcustomers by attrition score that highlights the attrition trend for that segment.
In the following example, you see the detailed analysis for a selected segment.
Figure 10. The High-risk customers by engagement segment chart
Figure 11. Detailed analysis for a segment selected in the High-risk customers by engagement segment chart
Chapter 4. Analyzing 23
You can create an audience based on the customers included in an insight. Forexample, you might create an audience for customers within the “largestopportunities for growth” insight.
For more information, see “Creating an audience from an insight” on page 13.
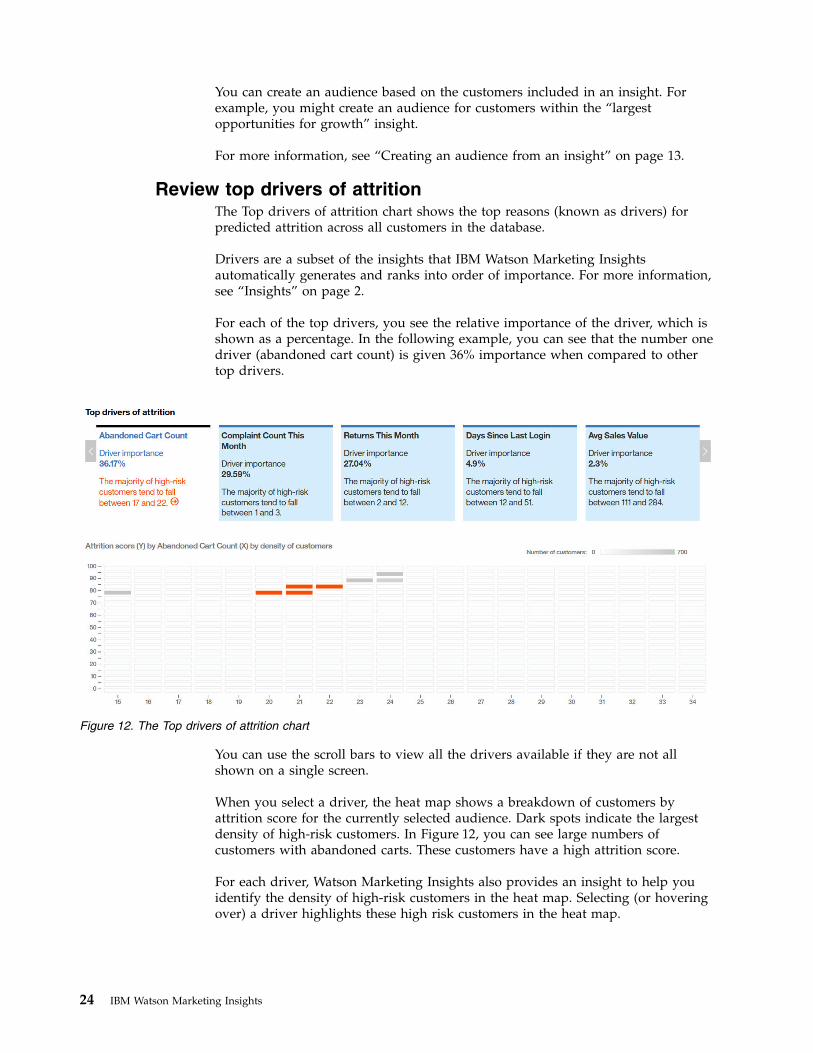
Review top drivers of attritionThe Top drivers of attrition chart shows the top reasons (known as drivers) forpredicted attrition across all customers in the database.
Drivers are a subset of the insights that IBM Watson Marketing Insightsautomatically generates and ranks into order of importance. For more information,see “Insights” on page 2.
For each of the top drivers, you see the relative importance of the driver, which isshown as a percentage. In the following example, you can see that the number onedriver (abandoned cart count) is given 36% importance when compared to othertop drivers.
You can use the scroll bars to view all the drivers available if they are not allshown on a single screen.
When you select a driver, the heat map shows a breakdown of customers byattrition score for the currently selected audience. Dark spots indicate the largestdensity of high-risk customers. In Figure 12, you can see large numbers ofcustomers with abandoned carts. These customers have a high attrition score.
For each driver, Watson Marketing Insights also provides an insight to help youidentify the density of high-risk customers in the heat map. Selecting (or hoveringover) a driver highlights these high risk customers in the heat map.
Figure 12. The Top drivers of attrition chart
24 IBM Watson Marketing Insights
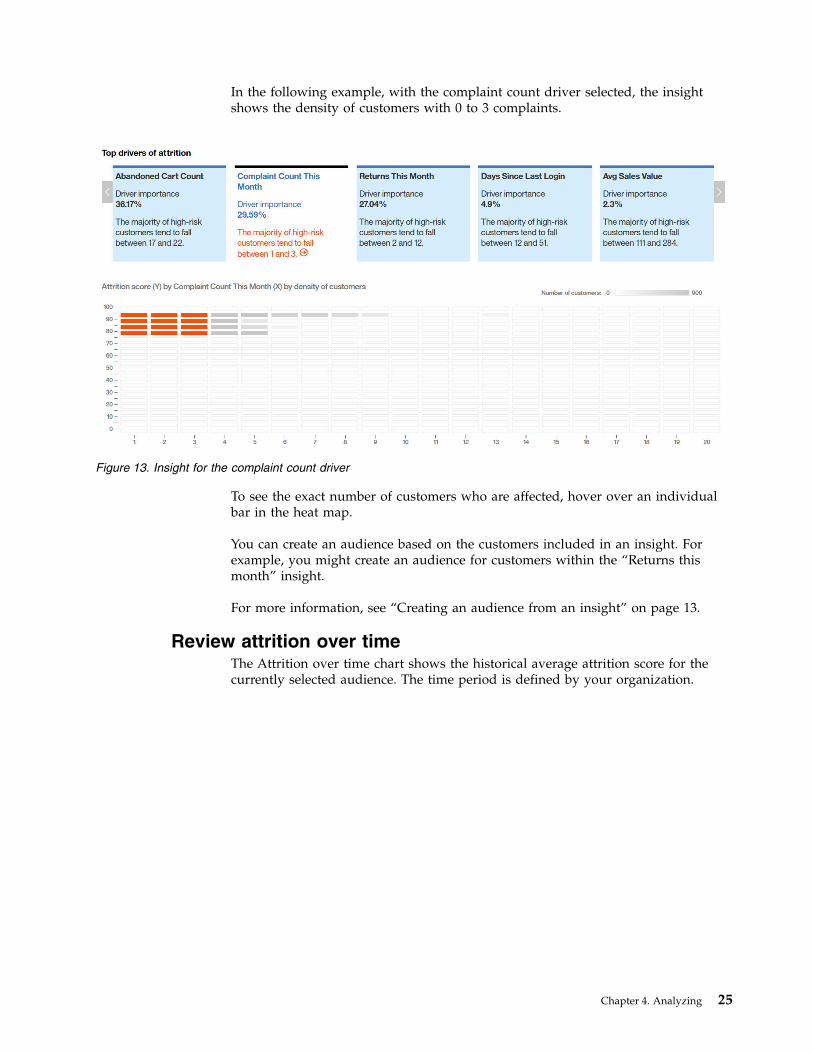
In the following example, with the complaint count driver selected, the insightshows the density of customers with 0 to 3 complaints.
To see the exact number of customers who are affected, hover over an individualbar in the heat map.
You can create an audience based on the customers included in an insight. Forexample, you might create an audience for customers within the “Returns thismonth” insight.
For more information, see “Creating an audience from an insight” on page 13.
Review attrition over timeThe Attrition over time chart shows the historical average attrition score for thecurrently selected audience. The time period is defined by your organization.
Figure 13. Insight for the complaint count driver
Chapter 4. Analyzing 25
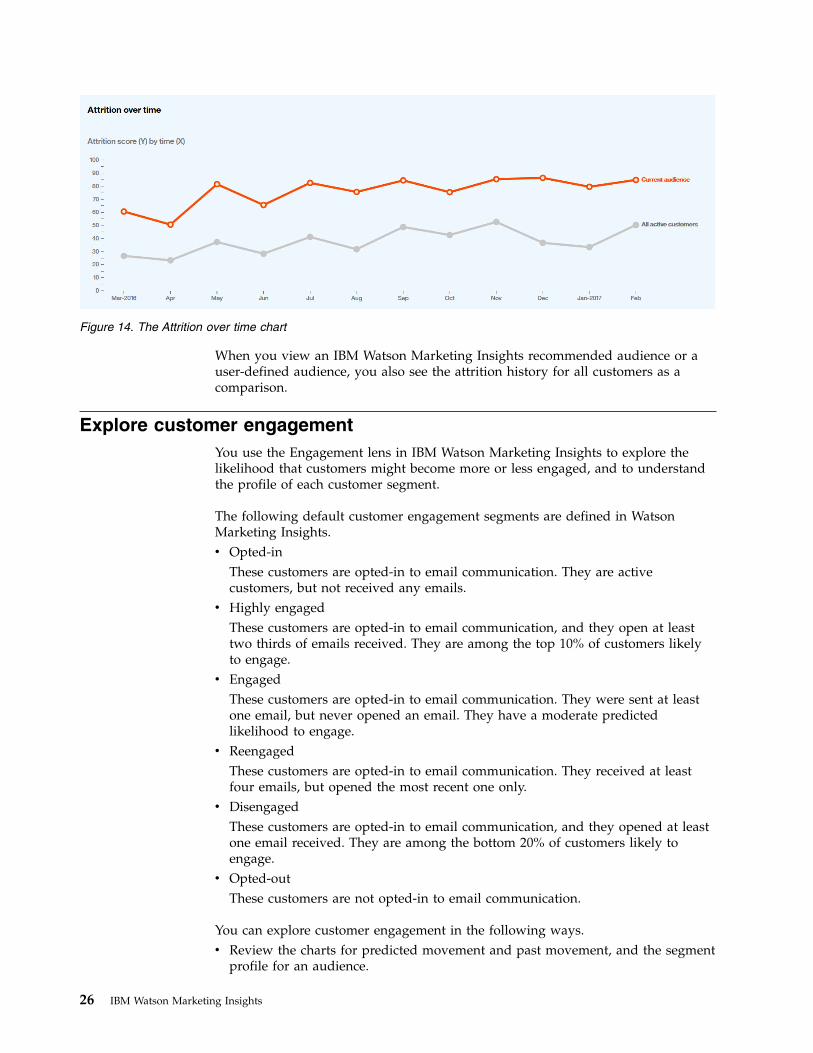
When you view an IBM Watson Marketing Insights recommended audience or auser-defined audience, you also see the attrition history for all customers as acomparison.
Explore customer engagementYou use the Engagement lens in IBM Watson Marketing Insights to explore thelikelihood that customers might become more or less engaged, and to understandthe profile of each customer segment.
The following default customer engagement segments are defined in WatsonMarketing Insights.v Opted-in
These customers are opted-in to email communication. They are activecustomers, but not received any emails.
v Highly engagedThese customers are opted-in to email communication, and they open at leasttwo thirds of emails received. They are among the top 10% of customers likelyto engage.
v EngagedThese customers are opted-in to email communication. They were sent at leastone email, but never opened an email. They have a moderate predictedlikelihood to engage.
v ReengagedThese customers are opted-in to email communication. They received at leastfour emails, but opened the most recent one only.
v DisengagedThese customers are opted-in to email communication, and they opened at leastone email received. They are among the bottom 20% of customers likely toengage.
v Opted-outThese customers are not opted-in to email communication.
You can explore customer engagement in the following ways.v Review the charts for predicted movement and past movement, and the segment
profile for an audience.
Figure 14. The Attrition over time chart
26 IBM Watson Marketing Insights
v Create your own audiences for review.For more information, see “Creating an audience manually” on page 12 and“Creating an audience from an insight” on page 13.
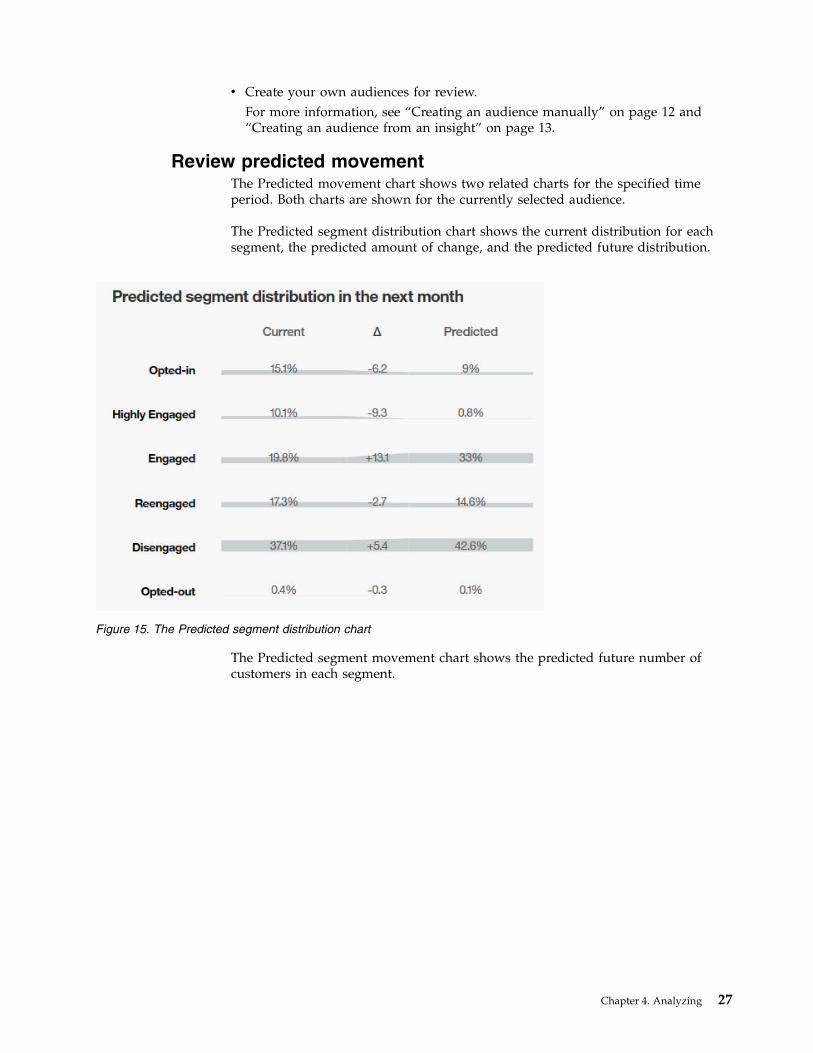
Review predicted movementThe Predicted movement chart shows two related charts for the specified timeperiod. Both charts are shown for the currently selected audience.
The Predicted segment distribution chart shows the current distribution for eachsegment, the predicted amount of change, and the predicted future distribution.
The Predicted segment movement chart shows the predicted future number ofcustomers in each segment.
Figure 15. The Predicted segment distribution chart
Chapter 4. Analyzing 27
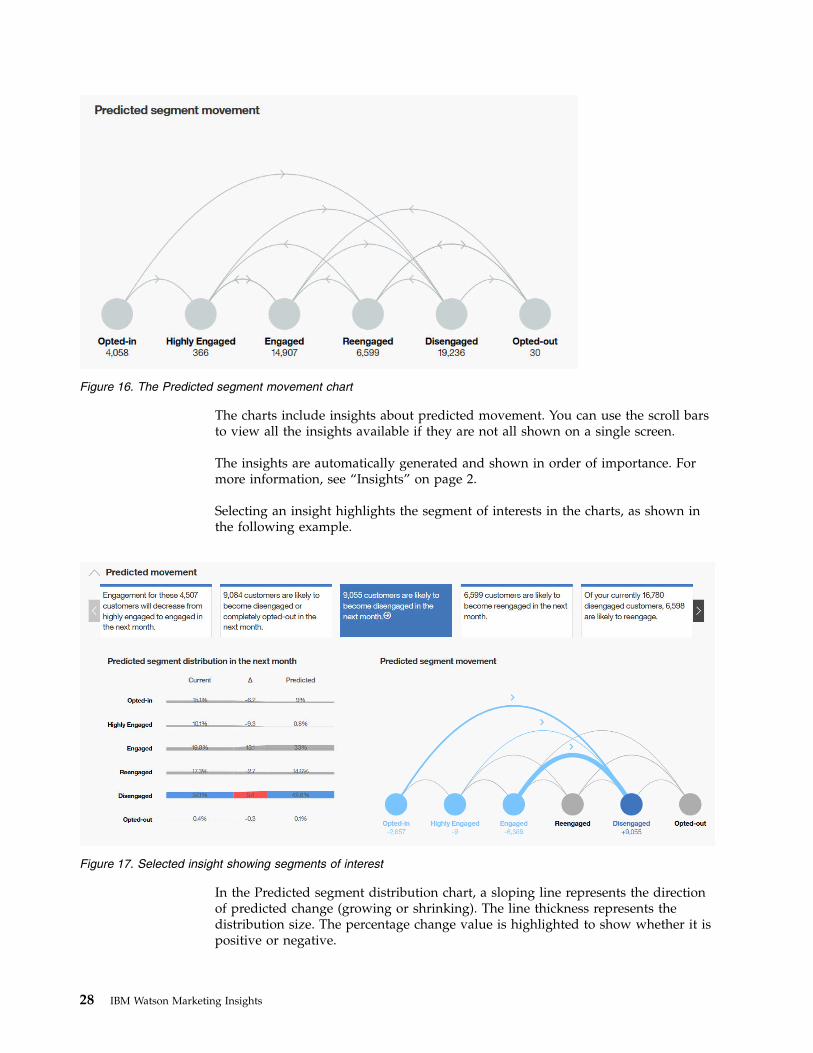
The charts include insights about predicted movement. You can use the scroll barsto view all the insights available if they are not all shown on a single screen.
The insights are automatically generated and shown in order of importance. Formore information, see “Insights” on page 2.
Selecting an insight highlights the segment of interests in the charts, as shown inthe following example.
In the Predicted segment distribution chart, a sloping line represents the directionof predicted change (growing or shrinking). The line thickness represents thedistribution size. The percentage change value is highlighted to show whether it ispositive or negative.
Figure 16. The Predicted segment movement chart
Figure 17. Selected insight showing segments of interest
28 IBM Watson Marketing Insights
In the Predicted segment movement chart, dark spots represent the target segmentsthat are predicted to gain customers. Light spots represent the segments that arepredicted to lose customers to the target segment. Each highlighted line shows themovement of customers, and the line thickness represents the relative number ofcustomers predicted to move. The actual number of customers is shown undereach highlighted segment.
In the previous example, the insight for customers likely to become disengaged isselected. The Disengaged segment is highlighted in the Predicted segmentdistribution chart, showing an upward change. The Opted-in, Highly engaged, andEngaged segments are highlighted in the Predicted segment movement chart witharrows that indicate they are losing customers to the Disengaged segment.
You can create an audience based on the customers included in an insight. Forexample, you might create an audience with 9,055 customers from the “customerslikely to become disengaged in the next month” insight.
For more information, see “Creating an audience from an insight” on page 13.
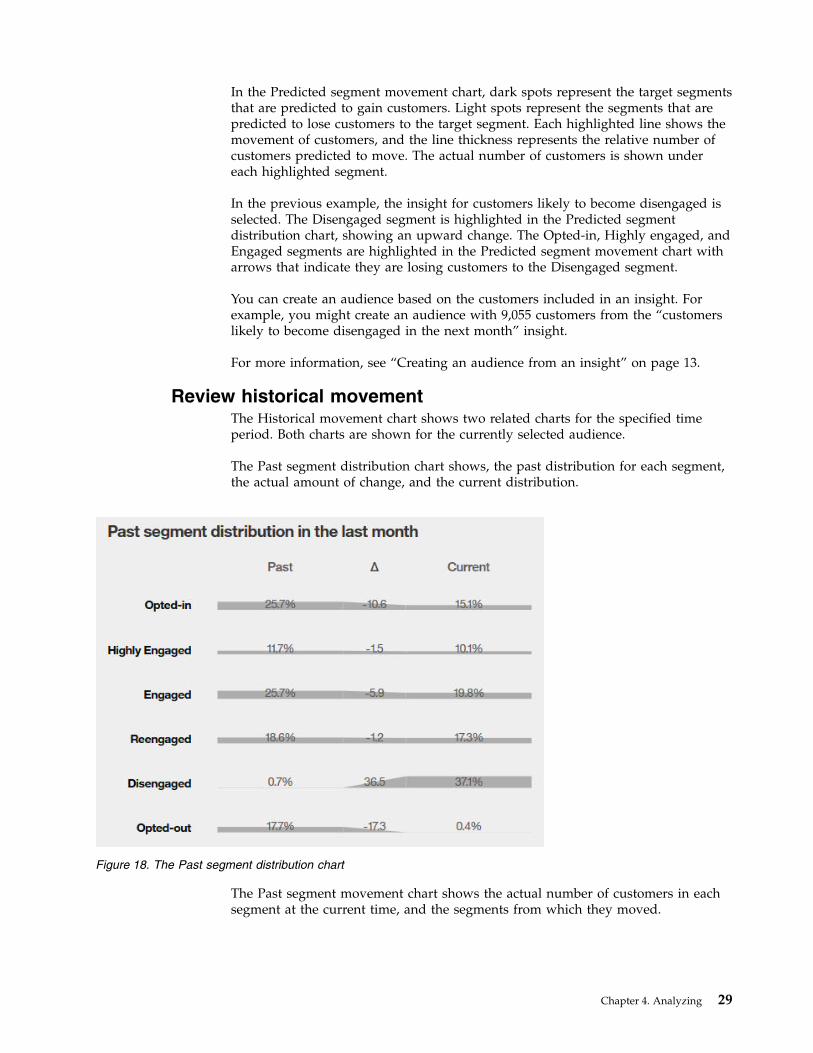
Review historical movementThe Historical movement chart shows two related charts for the specified timeperiod. Both charts are shown for the currently selected audience.
The Past segment distribution chart shows, the past distribution for each segment,the actual amount of change, and the current distribution.
The Past segment movement chart shows the actual number of customers in eachsegment at the current time, and the segments from which they moved.
Figure 18. The Past segment distribution chart
Chapter 4. Analyzing 29
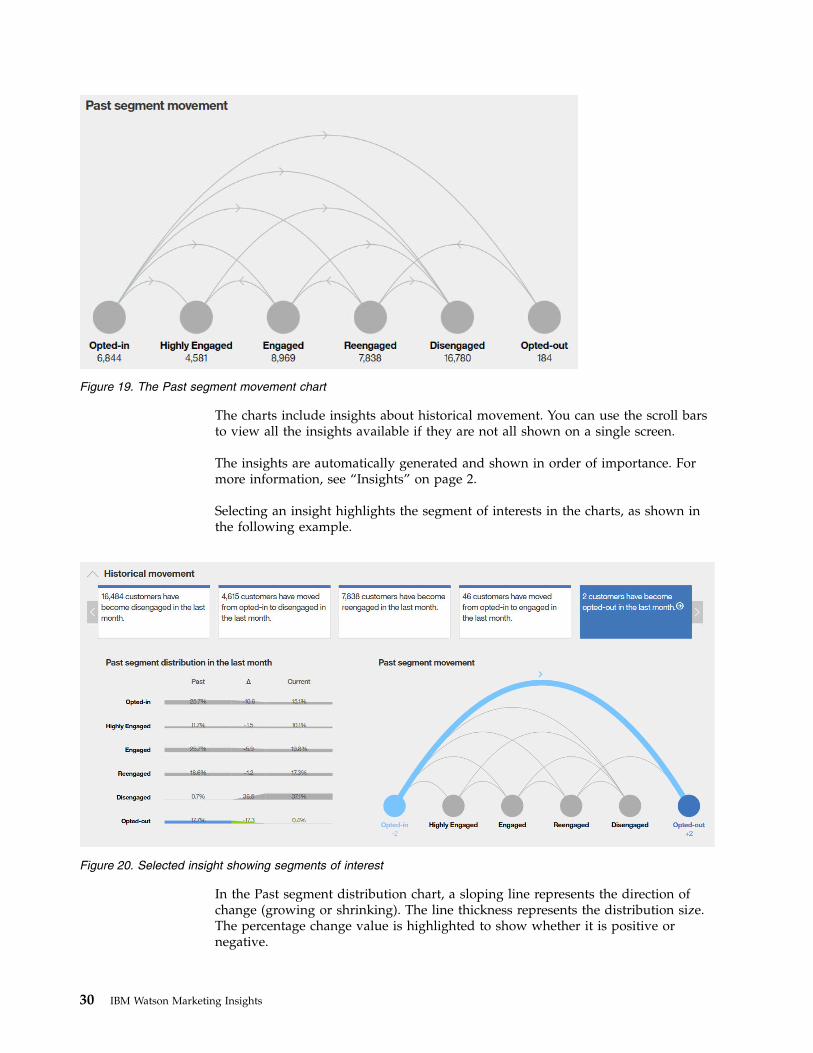
The charts include insights about historical movement. You can use the scroll barsto view all the insights available if they are not all shown on a single screen.
The insights are automatically generated and shown in order of importance. Formore information, see “Insights” on page 2.
Selecting an insight highlights the segment of interests in the charts, as shown inthe following example.
In the Past segment distribution chart, a sloping line represents the direction ofchange (growing or shrinking). The line thickness represents the distribution size.The percentage change value is highlighted to show whether it is positive ornegative.
Figure 19. The Past segment movement chart
Figure 20. Selected insight showing segments of interest
30 IBM Watson Marketing Insights
In the Past segment movement chart, each highlighted line represents a segmentthat gained or lost customers to the target segment. The line thickness representsthe relative number of customers who moved. The actual number of customers isshown under each highlighted segment.
In the previous example, the insight for customers who became opted-out isselected. The Opted-out segment is highlighted in the Past segment distributionchart, showing a downward change. The Opted-in segment is highlighted in thePast audience segment chart with an arrow that indicates it is losing customers tothe Opted-out segment.
You can create an audience based on the customers included in an insight. Forexample, you might create an audience with 46 customers from the “customerswho moved from opted-in to engaged in the last month” insight.
For more information, see “Creating an audience from an insight” on page 13.
Review active audience profilesThe Active audience profiles chart shows a detailed profile of each active segmentin the currently selected audience.
You can compare the profiles to find out which segments might need moreattention.
Chapter 4. Analyzing 31
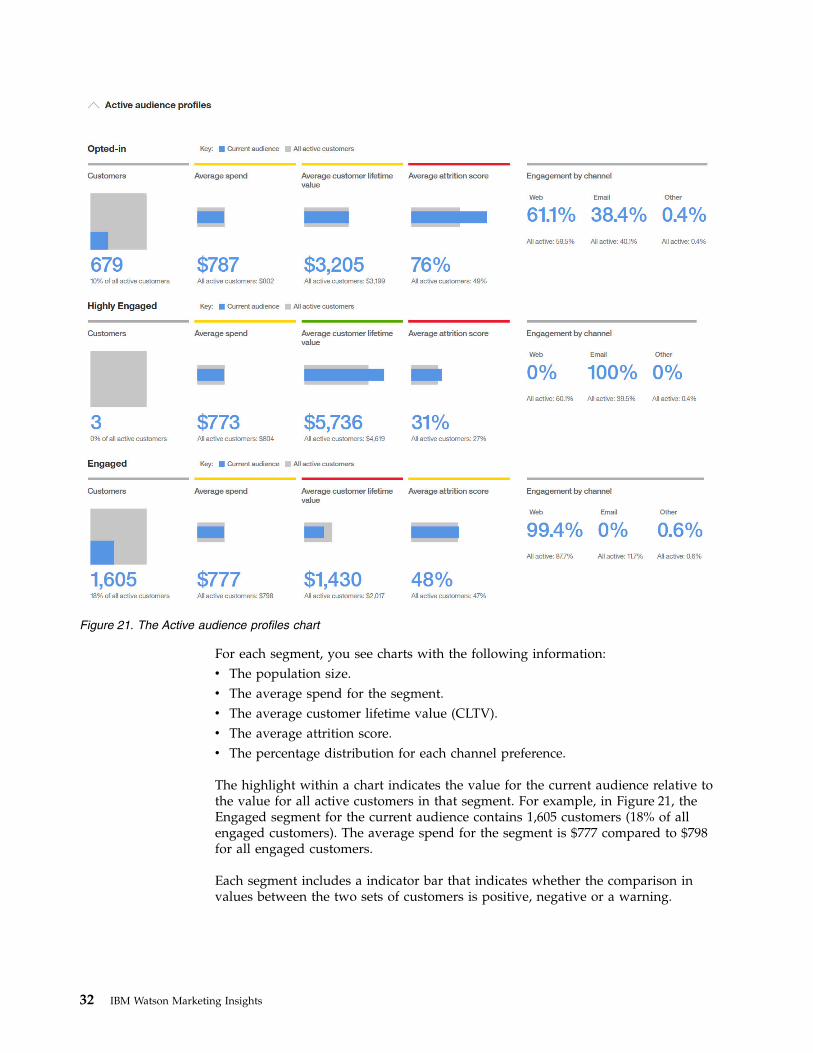
For each segment, you see charts with the following information:v The population size.v The average spend for the segment.v The average customer lifetime value (CLTV).v The average attrition score.v The percentage distribution for each channel preference.
The highlight within a chart indicates the value for the current audience relative tothe value for all active customers in that segment. For example, in Figure 21, theEngaged segment for the current audience contains 1,605 customers (18% of allengaged customers). The average spend for the segment is $777 compared to $798for all engaged customers.
Each segment includes a indicator bar that indicates whether the comparison invalues between the two sets of customers is positive, negative or a warning.
Figure 21. The Active audience profiles chart
32 IBM Watson Marketing Insights
Review the customer scorecardYou use the scorecard in IBM Watson Marketing Insights to review current valuesand historical trends for pulse score, key metrics, purchasing behavior, andengagement segment distributions.
All information is shown for the currently selected audience. When you view aWatson Marketing Insights recommended audience or a user-defined audience, youalso see current values and trends for all active customers as a comparison.
Each chart includes a highlighted trend indicator bar that indicates whether thepercentage difference in current values for the selected audience and all customersis positive, negative or a warning.v Positive (green) - the difference in values is up (where an upward trend
indicates growth) or down (where a downward trend indicates growth) morethan 5%.
v Warning (yellow) - the difference in values is less than 5%.v Negative (red) - the difference in values is down (where an upward trend
indicates growth) or up (where a downward trend indicates growth) more than5%.
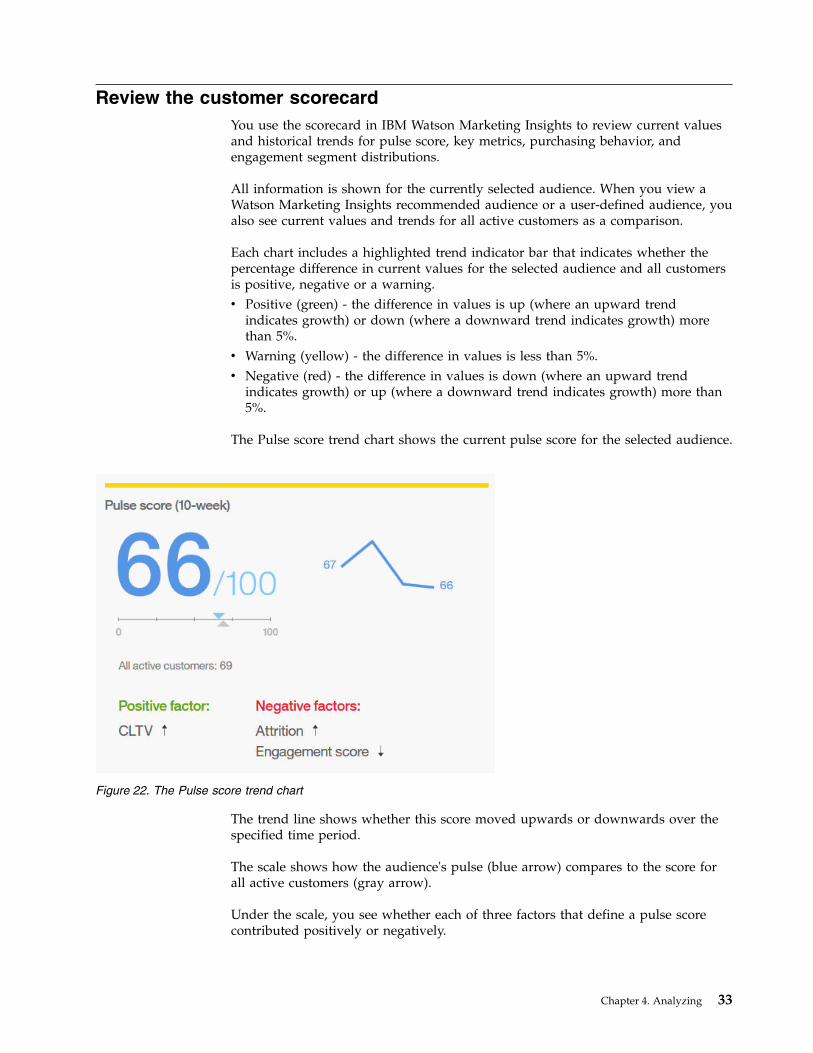
The Pulse score trend chart shows the current pulse score for the selected audience.
The trend line shows whether this score moved upwards or downwards over thespecified time period.
The scale shows how the audience's pulse (blue arrow) compares to the score forall active customers (gray arrow).
Under the scale, you see whether each of three factors that define a pulse scorecontributed positively or negatively.
Figure 22. The Pulse score trend chart
Chapter 4. Analyzing 33
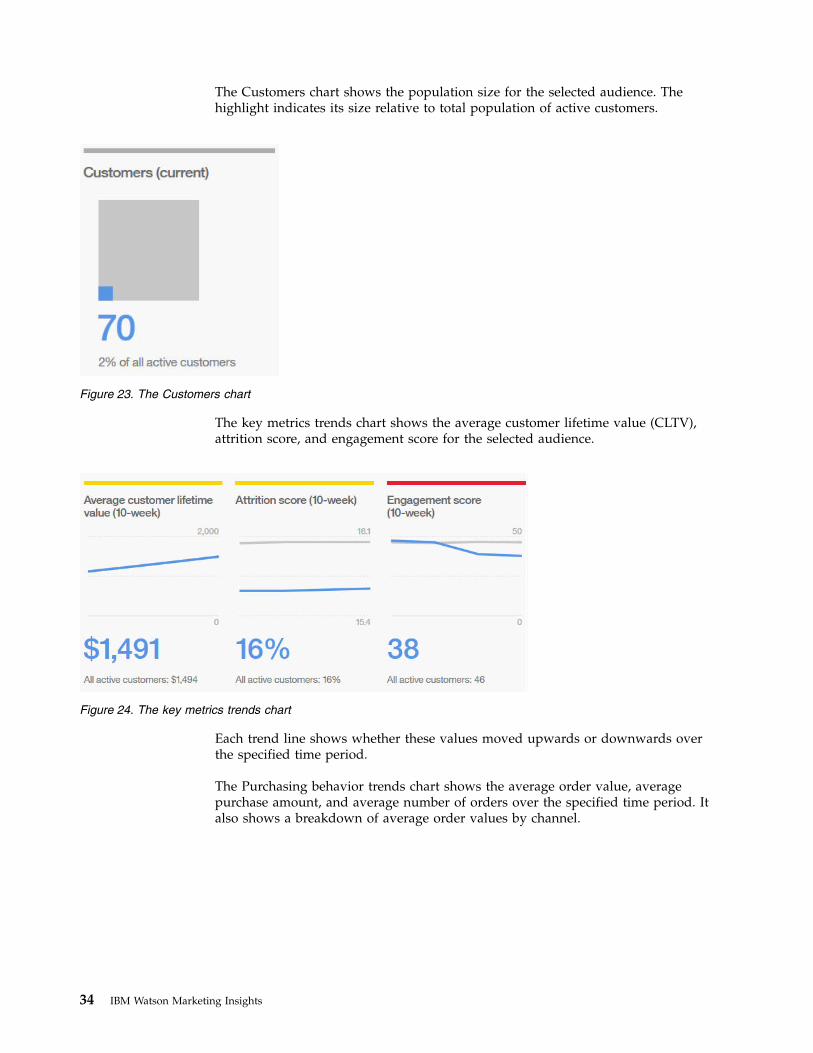
The Customers chart shows the population size for the selected audience. Thehighlight indicates its size relative to total population of active customers.
The key metrics trends chart shows the average customer lifetime value (CLTV),attrition score, and engagement score for the selected audience.
Each trend line shows whether these values moved upwards or downwards overthe specified time period.
The Purchasing behavior trends chart shows the average order value, averagepurchase amount, and average number of orders over the specified time period. Italso shows a breakdown of average order values by channel.
Figure 23. The Customers chart
Figure 24. The key metrics trends chart
34 IBM Watson Marketing Insights
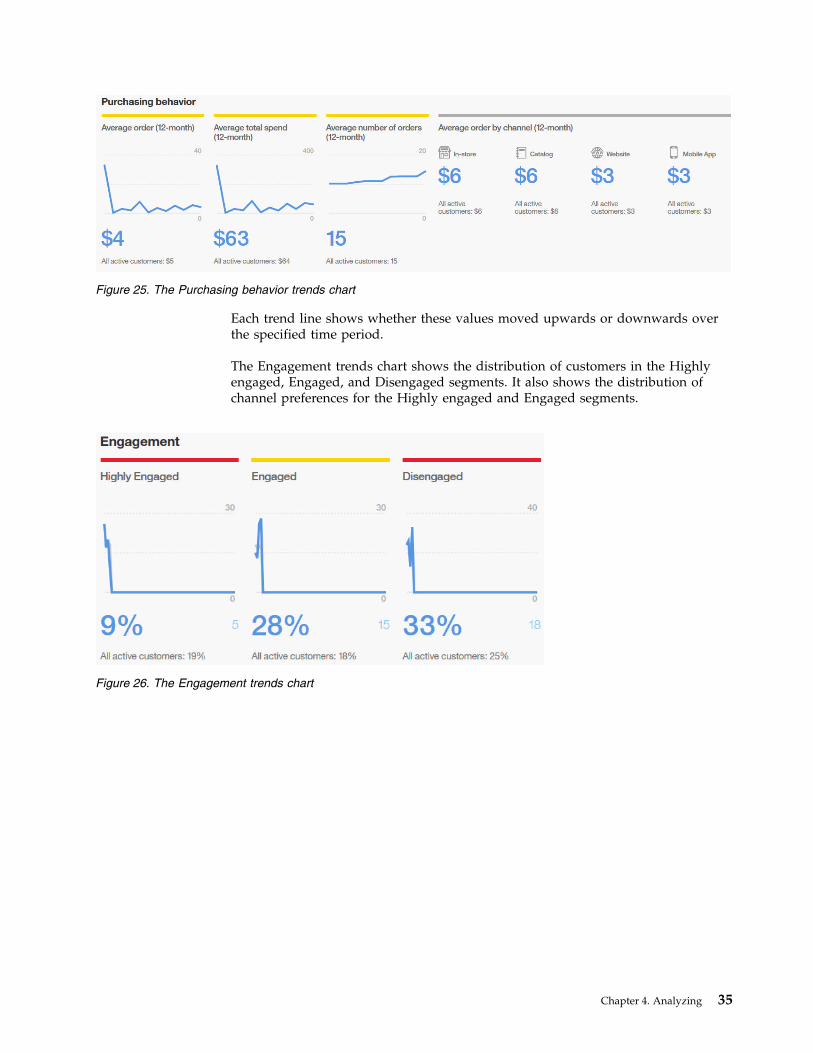
Each trend line shows whether these values moved upwards or downwards overthe specified time period.
The Engagement trends chart shows the distribution of customers in the Highlyengaged, Engaged, and Disengaged segments. It also shows the distribution ofchannel preferences for the Highly engaged and Engaged segments.
Figure 25. The Purchasing behavior trends chart
Figure 26. The Engagement trends chart
Chapter 4. Analyzing 35

36 IBM Watson Marketing Insights
Chapter 5. Scenarios
In these scenarios, you're a marketer and channel owner, who is responsible fordesigning personalized, effective interactions across your channel's productofferings.
You often struggle with the following areas.v Gaining a quick and clear understanding of your customers' most important
attributes.v Converting insights into actionable, and targeted, audiences.v Grouping, or segmenting, customers in meaningful ways.v Relying too heavily on data scientists to provide data for your work.v Carrying out repetitive tasks reliably and efficiently.v Incorporating a deep understanding of customers into your daily work.v Access to relevant and current, insights to allow innovative business discussions.
Your channel is underperforming because you cannot automate or adapt marketingcampaigns without timely customer insights.
With IBM Watson Marketing Insights, you can attract, retain, and grow customers.
You can gain a deeper understanding of your customers by getting answers toquestions.v What is important to know about your customers?v Why are your customers leaving?v How do you find the common attributes of a target audience?
When you understand your customers, you can anticipate their behaviors byanswering further questions.v Are you selecting relevant customers for a campaign?v Which customers are most valuable?v Which customers are most at risk of leaving?v What is the likelihood of the composition of a customer segment changing?
Scenarios are based on sample data provided in the preview environment.
Customer overview scenarioThis scenario focuses on exploring top priority insights in the IBM WatsonMarketing Insights sample data, and generating a target audience that you canexport.
Step 1: Exploring the customer overviewLet's start with exploring the customer overview on the IBM Watson MarketingInsights home page.
© Copyright IBM Corp. 2017 37
About this task
The customer overview provides a current day snapshot of all your customers. Italso highlights the top priority customer insights.
You want answers to these questions.v How brand-engaged are your customers?v Are you losing customers, and if so, why?v On average, is customer value growing or shrinking?
You also want to be able to quickly identify the following customers because yousend them campaign offers regularly.v Customers who are likely to soon become disengaged.v Customers who are at extreme risk of leaving.v Customers with a recent negative experience that made them unhappy and at
risk of leaving.
Procedure
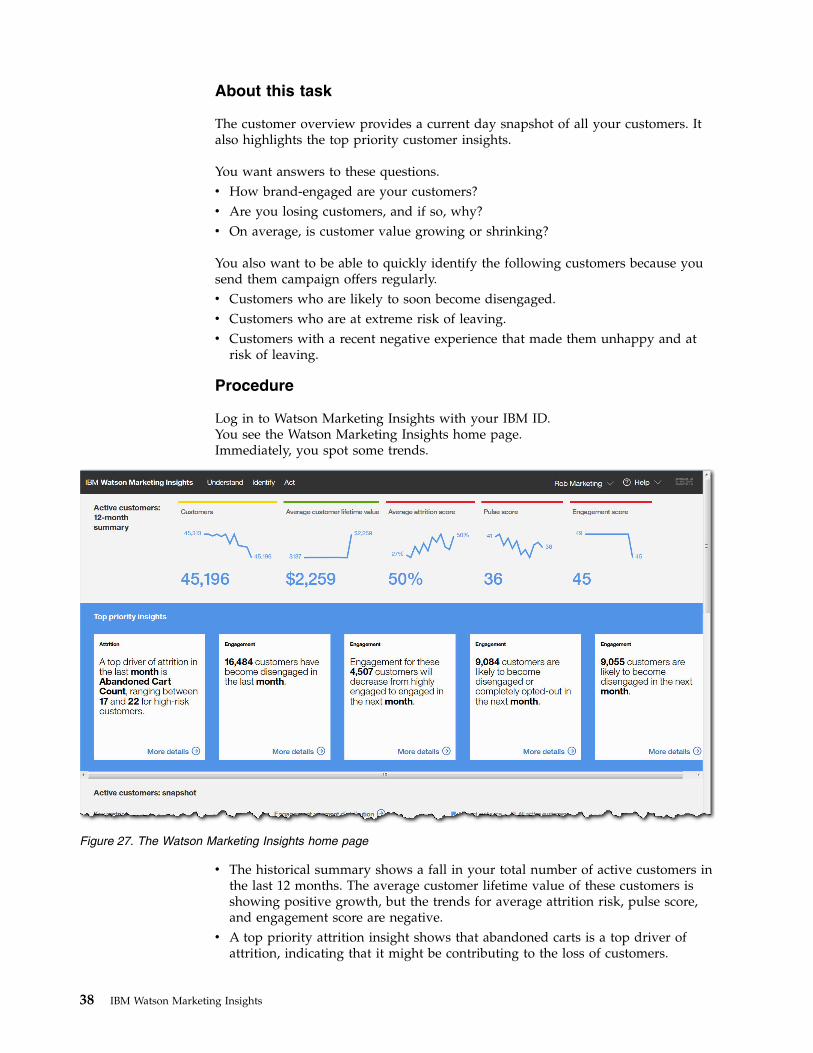
Log in to Watson Marketing Insights with your IBM ID.You see the Watson Marketing Insights home page.Immediately, you spot some trends.
v The historical summary shows a fall in your total number of active customers inthe last 12 months. The average customer lifetime value of these customers isshowing positive growth, but the trends for average attrition risk, pulse score,and engagement score are negative.
v A top priority attrition insight shows that abandoned carts is a top driver ofattrition, indicating that it might be contributing to the loss of customers.
Figure 27. The Watson Marketing Insights home page
38 IBM Watson Marketing Insights
v A top priority engagement insight shows that 9,055 customers are likely tobecome disengaged next month.
v A top priority insight shows that over 16,000 are currently disengaged. Forcomparison, the customer snapshot shows that this number exceeds the totalnumber of customers who are currently engaged.
v The customer snapshot shows that 15% of active customers are opted-in toemails, but were not yet sent any offers.
v An additional attrition insight shows over 2,900 customers with a very high riskof attrition.
Results
With Watson Marketing Insights, you can quickly create an audience of customerswho are likely to become disengaged so you can target them with your regularcampaign. You can then focus on exploring other issues in more detail later.
Step 2: Creating an audience from an insightYou want to create an up-to-date audience of customers who are likely to becomedisengaged so you are ready to target them with your regular campaign.
Procedure
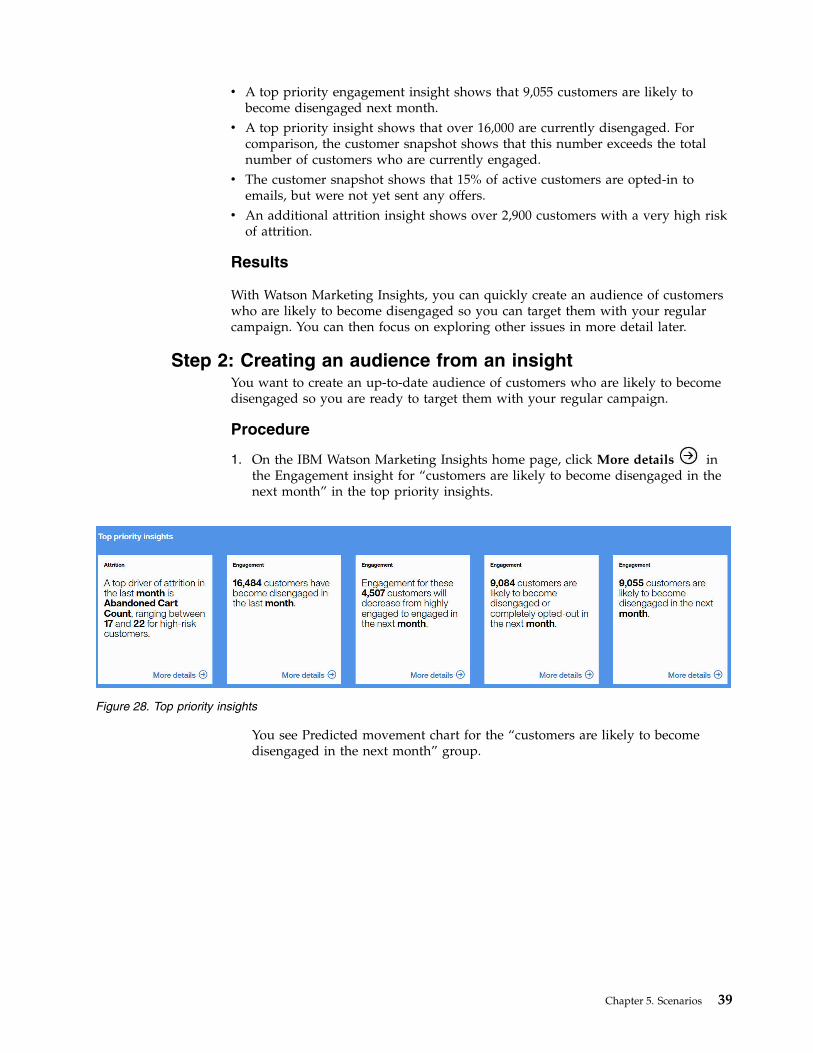
1. On the IBM Watson Marketing Insights home page, click More details inthe Engagement insight for “customers are likely to become disengaged in thenext month” in the top priority insights.
You see Predicted movement chart for the “customers are likely to becomedisengaged in the next month” group.
Figure 28. Top priority insights
Chapter 5. Scenarios 39
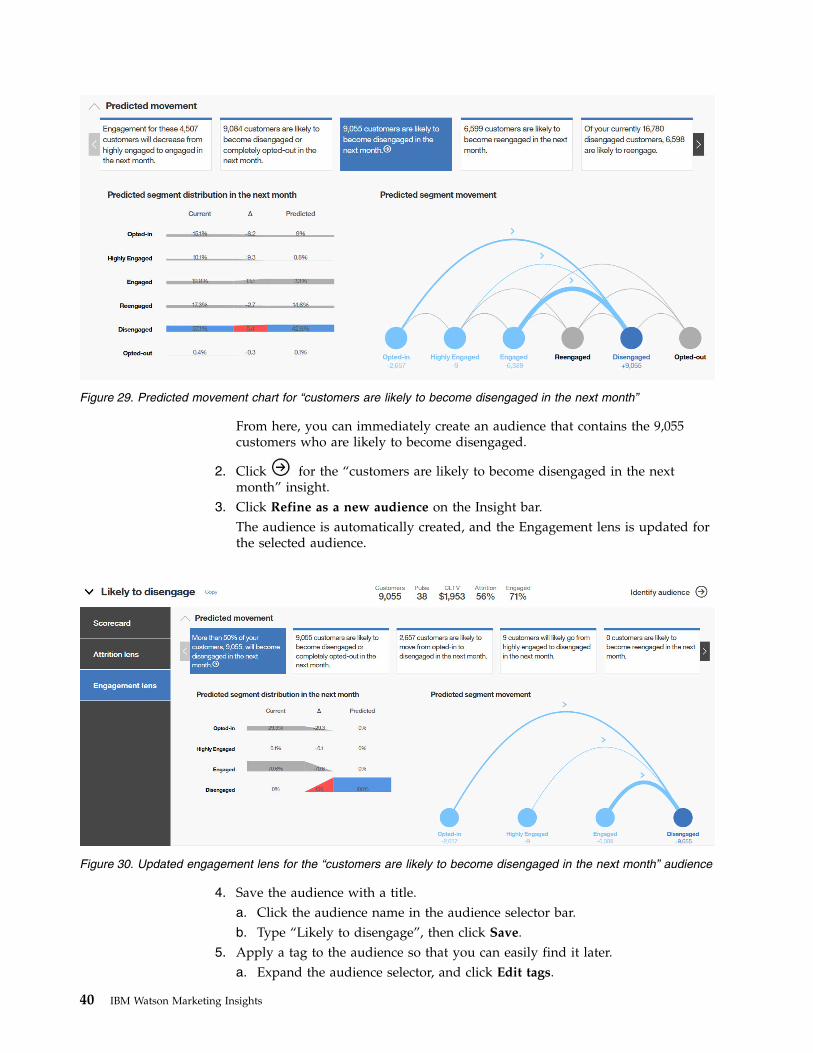
From here, you can immediately create an audience that contains the 9,055customers who are likely to become disengaged.
2. Click
for the “customers are likely to become disengaged in the nextmonth” insight.
3. Click Refine as a new audience on the Insight bar.The audience is automatically created, and the Engagement lens is updated forthe selected audience.
4. Save the audience with a title.a. Click the audience name in the audience selector bar.b. Type “Likely to disengage”, then click Save.
5. Apply a tag to the audience so that you can easily find it later.a. Expand the audience selector, and click Edit tags.
Figure 29. Predicted movement chart for “customers are likely to become disengaged in the next month”
Figure 30. Updated engagement lens for the “customers are likely to become disengaged in the next month” audience
40 IBM Watson Marketing Insights
b. Click Add tag, then type “My campaigns”.c. Click Add.
Step 3: Publishing the audience to IBM Watson CampaignAutomation
Finally, you are ready to publish the “Likely to disengage” audience to IBMWatson Campaign Automation and start your regular campaign.
Before you begin
Publishing to IBM Watson Campaign Automation is available only to customerswho register IBM Watson Marketing Insights as an endpoint in IBM UniversalBehavior Exchange (UBX).
Procedure1. On the Watson Marketing Insights Engagement lens, click the Act tab.2. Select Publish to IBM Watson Campaign Automation, then click Send
audience.If Watson Marketing Insights is not registered as an endpoint in UBX, you donot see this option. You can export the audience data to your desktop:v Select Save basic data to desktop, then click Send audience.v Save the file.
Brand engagement trends scenarioThis scenario focuses on understanding more about the audience in the IBMWatson Marketing Insights sample data whose customers are likely to becomedisengaged, and anticipating their future behavior.
Complete the “Customer overview scenario” on page 37 before you start.
Step 1: Exploring the engagement insightYou noted in the customer overview scenario that a top priority engagementinsight shows that over 9000 customers are likely to become disengaged in the nextmonth. This issue might have a serious impact on revenue, so you decide toexplore this insight in more detail.
Procedure1. Click IBM Watson Marketing Insights to return to the home page.
2. Click More details in the Engagement insight for “customers are likely tobecome disengaged in the next month” in the top priority insights.You see Predicted movement chart for the “customers are likely to becomedisengaged in the next month” group.
Chapter 5. Scenarios 41
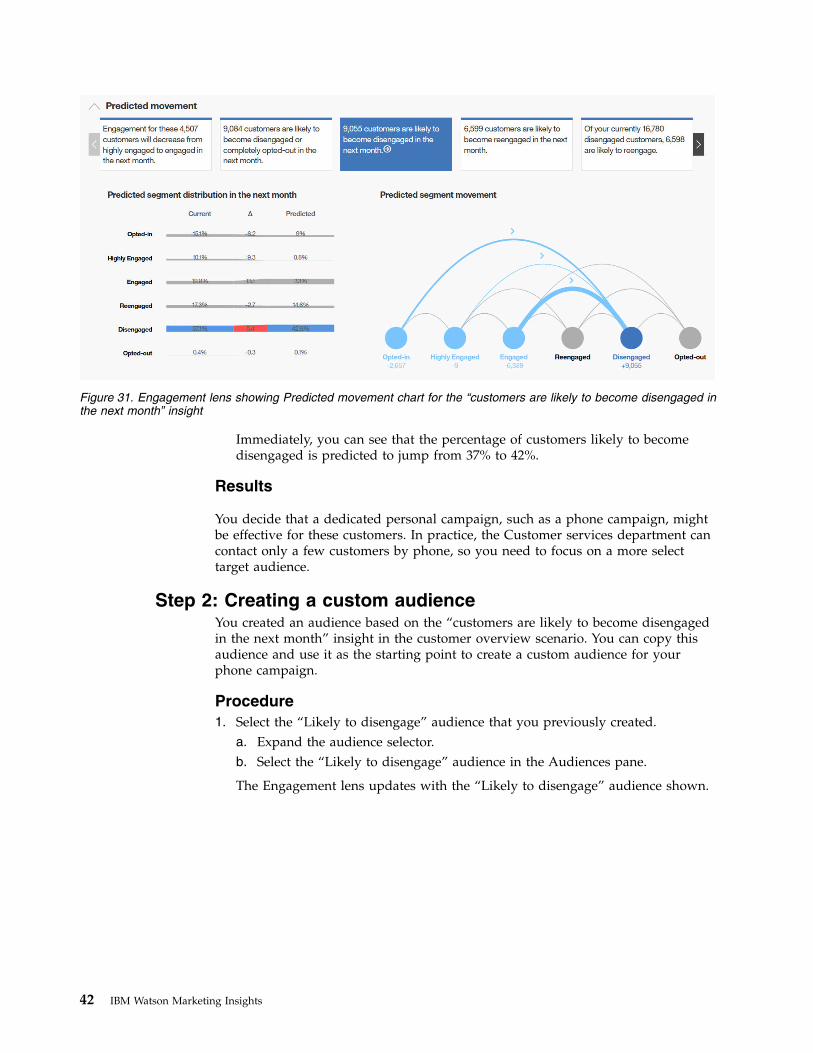
Immediately, you can see that the percentage of customers likely to becomedisengaged is predicted to jump from 37% to 42%.
Results
You decide that a dedicated personal campaign, such as a phone campaign, mightbe effective for these customers. In practice, the Customer services department cancontact only a few customers by phone, so you need to focus on a more selecttarget audience.
Step 2: Creating a custom audienceYou created an audience based on the “customers are likely to become disengagedin the next month” insight in the customer overview scenario. You can copy thisaudience and use it as the starting point to create a custom audience for yourphone campaign.
Procedure1. Select the “Likely to disengage” audience that you previously created.
a. Expand the audience selector.b. Select the “Likely to disengage” audience in the Audiences pane.
The Engagement lens updates with the “Likely to disengage” audience shown.
Figure 31. Engagement lens showing Predicted movement chart for the “customers are likely to become disengaged inthe next month” insight
42 IBM Watson Marketing Insights
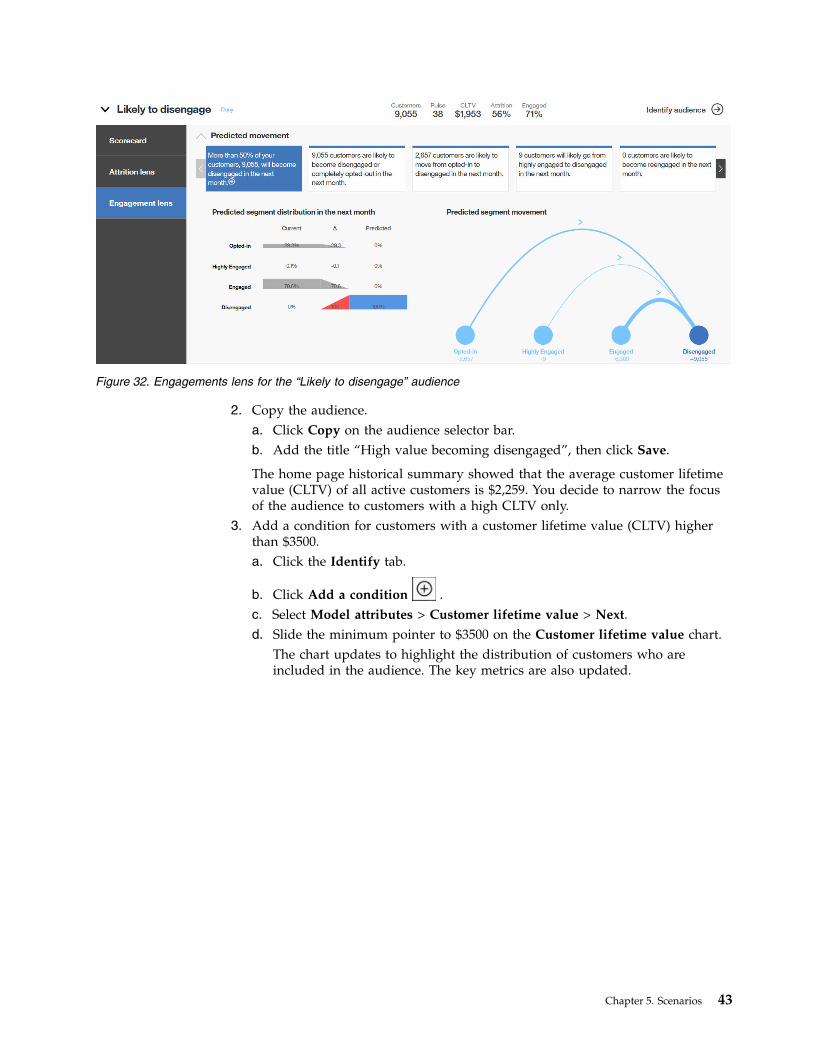
2. Copy the audience.a. Click Copy on the audience selector bar.b. Add the title “High value becoming disengaged”, then click Save.
The home page historical summary showed that the average customer lifetimevalue (CLTV) of all active customers is $2,259. You decide to narrow the focusof the audience to customers with a high CLTV only.
3. Add a condition for customers with a customer lifetime value (CLTV) higherthan $3500.a. Click the Identify tab.
b. Click Add a condition .c. Select Model attributes > Customer lifetime value > Next.d. Slide the minimum pointer to $3500 on the Customer lifetime value chart.
The chart updates to highlight the distribution of customers who areincluded in the audience. The key metrics are also updated.
Figure 32. Engagements lens for the “Likely to disengage” audience
Chapter 5. Scenarios 43
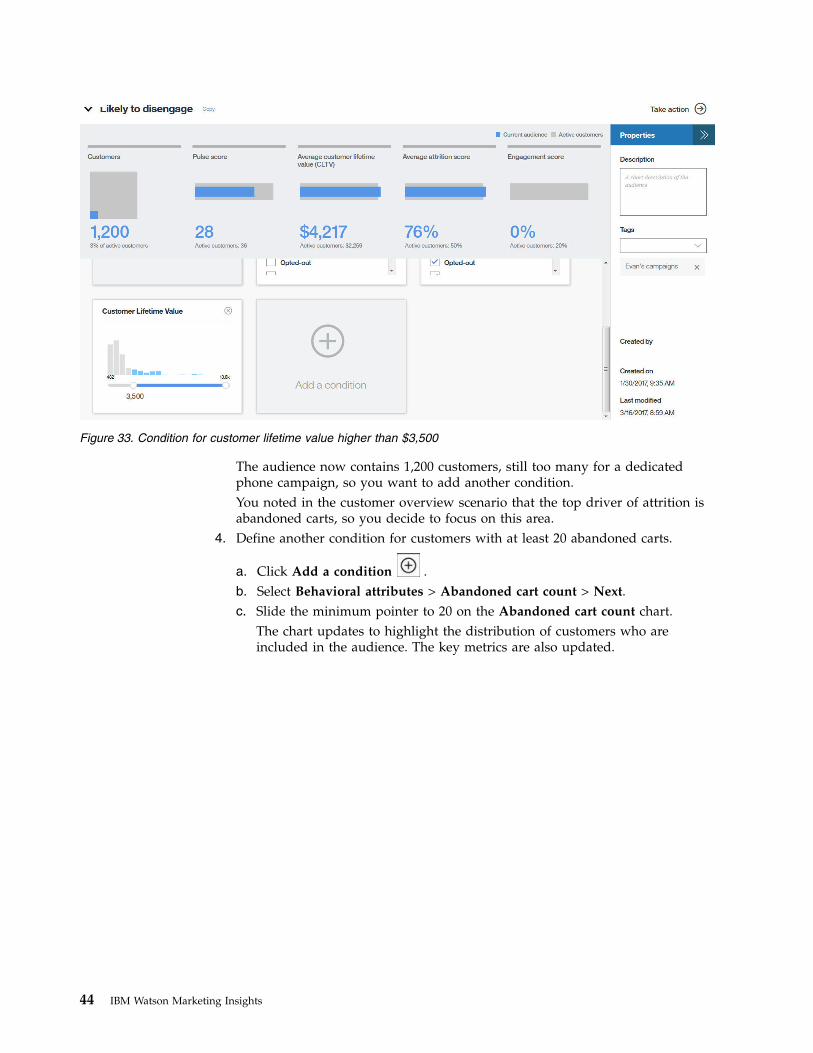
The audience now contains 1,200 customers, still too many for a dedicatedphone campaign, so you want to add another condition.You noted in the customer overview scenario that the top driver of attrition isabandoned carts, so you decide to focus on this area.
4. Define another condition for customers with at least 20 abandoned carts.
a. Click Add a condition .b. Select Behavioral attributes > Abandoned cart count > Next.c. Slide the minimum pointer to 20 on the Abandoned cart count chart.
The chart updates to highlight the distribution of customers who areincluded in the audience. The key metrics are also updated.
Figure 33. Condition for customer lifetime value higher than $3,500
44 IBM Watson Marketing Insights
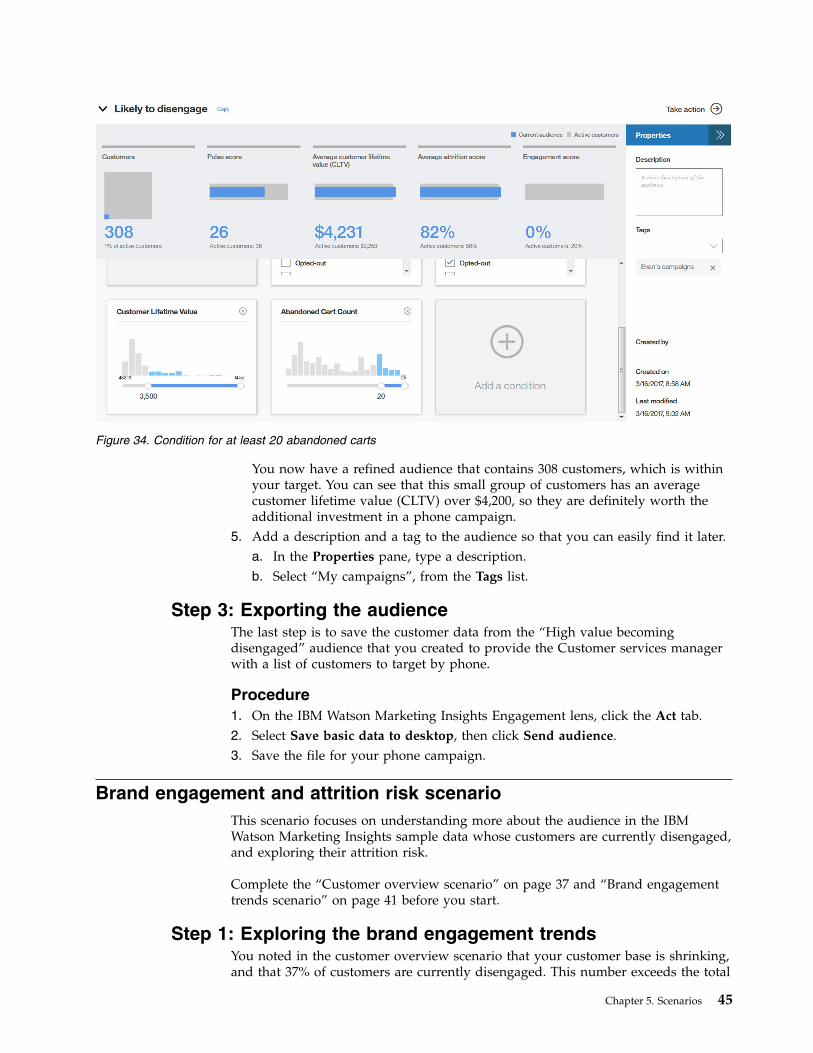
You now have a refined audience that contains 308 customers, which is withinyour target. You can see that this small group of customers has an averagecustomer lifetime value (CLTV) over $4,200, so they are definitely worth theadditional investment in a phone campaign.
5. Add a description and a tag to the audience so that you can easily find it later.a. In the Properties pane, type a description.b. Select “My campaigns”, from the Tags list.
Step 3: Exporting the audienceThe last step is to save the customer data from the “High value becomingdisengaged” audience that you created to provide the Customer services managerwith a list of customers to target by phone.
Procedure1. On the IBM Watson Marketing Insights Engagement lens, click the Act tab.2. Select Save basic data to desktop, then click Send audience.3. Save the file for your phone campaign.
Brand engagement and attrition risk scenarioThis scenario focuses on understanding more about the audience in the IBMWatson Marketing Insights sample data whose customers are currently disengaged,and exploring their attrition risk.
Complete the “Customer overview scenario” on page 37 and “Brand engagementtrends scenario” on page 41 before you start.
Step 1: Exploring the brand engagement trendsYou noted in the customer overview scenario that your customer base is shrinking,and that 37% of customers are currently disengaged. This number exceeds the total
Figure 34. Condition for at least 20 abandoned carts
Chapter 5. Scenarios 45
number of customers who are currently engaged, which indicates that you mighthave a brand engagement problem. You want to explore customers who haverecently become disengaged.
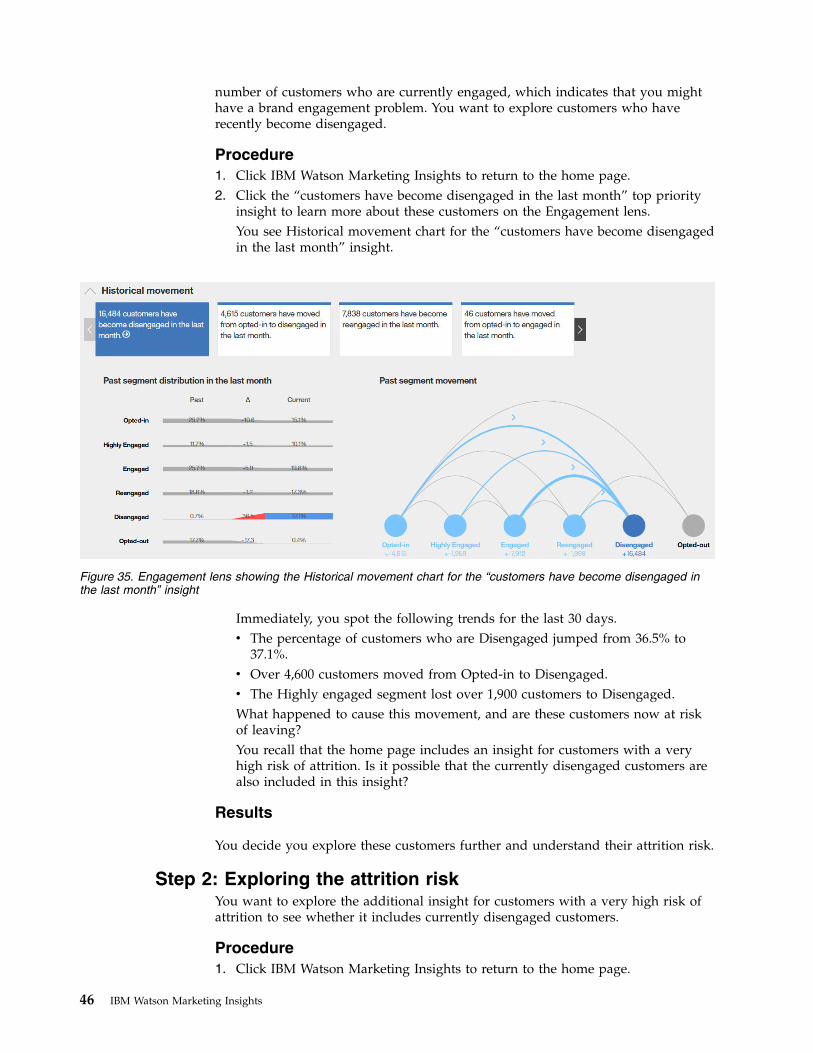
Procedure1. Click IBM Watson Marketing Insights to return to the home page.2. Click the “customers have become disengaged in the last month” top priority
insight to learn more about these customers on the Engagement lens.You see Historical movement chart for the “customers have become disengagedin the last month” insight.
Immediately, you spot the following trends for the last 30 days.v The percentage of customers who are Disengaged jumped from 36.5% to
37.1%.v Over 4,600 customers moved from Opted-in to Disengaged.v The Highly engaged segment lost over 1,900 customers to Disengaged.What happened to cause this movement, and are these customers now at riskof leaving?You recall that the home page includes an insight for customers with a veryhigh risk of attrition. Is it possible that the currently disengaged customers arealso included in this insight?
Results
You decide you explore these customers further and understand their attrition risk.
Step 2: Exploring the attrition riskYou want to explore the additional insight for customers with a very high risk ofattrition to see whether it includes currently disengaged customers.
Procedure1. Click IBM Watson Marketing Insights to return to the home page.
Figure 35. Engagement lens showing the Historical movement chart for the “customers have become disengaged inthe last month” insight
46 IBM Watson Marketing Insights
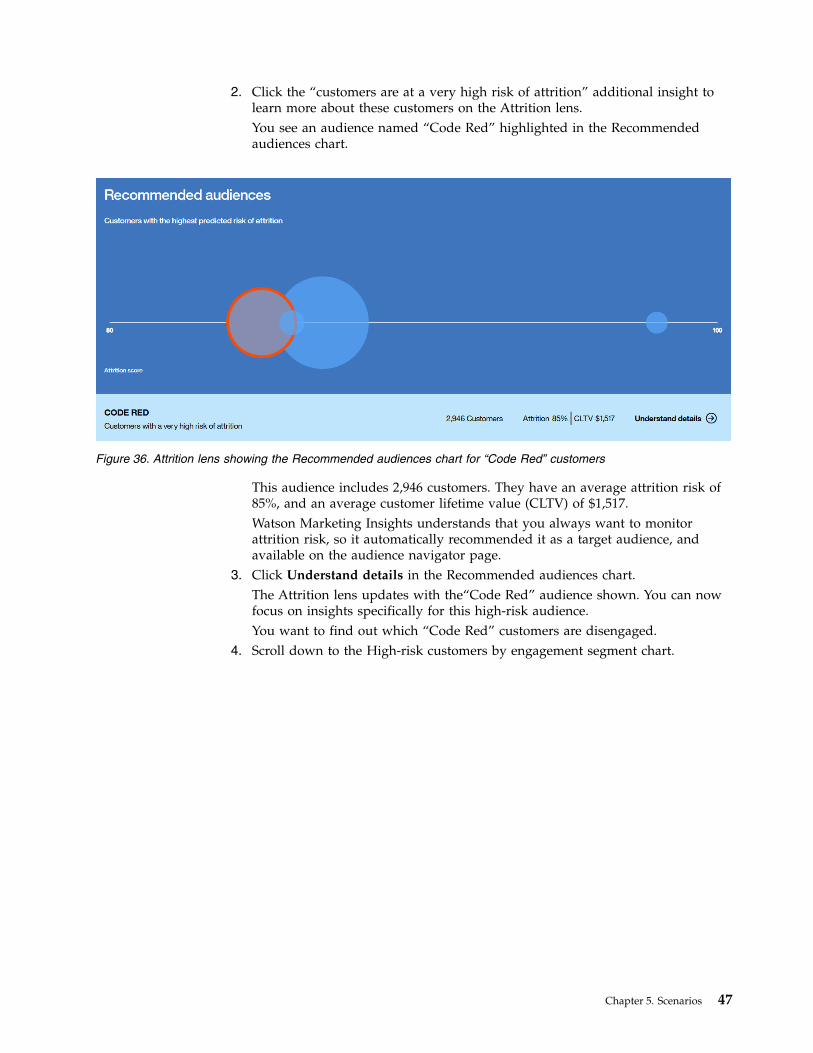
2. Click the “customers are at a very high risk of attrition” additional insight tolearn more about these customers on the Attrition lens.You see an audience named “Code Red” highlighted in the Recommendedaudiences chart.
This audience includes 2,946 customers. They have an average attrition risk of85%, and an average customer lifetime value (CLTV) of $1,517.Watson Marketing Insights understands that you always want to monitorattrition risk, so it automatically recommended it as a target audience, andavailable on the audience navigator page.
3. Click Understand details in the Recommended audiences chart.The Attrition lens updates with the“Code Red” audience shown. You can nowfocus on insights specifically for this high-risk audience.You want to find out which “Code Red” customers are disengaged.
4. Scroll down to the High-risk customers by engagement segment chart.
Figure 36. Attrition lens showing the Recommended audiences chart for “Code Red” customers
Chapter 5. Scenarios 47
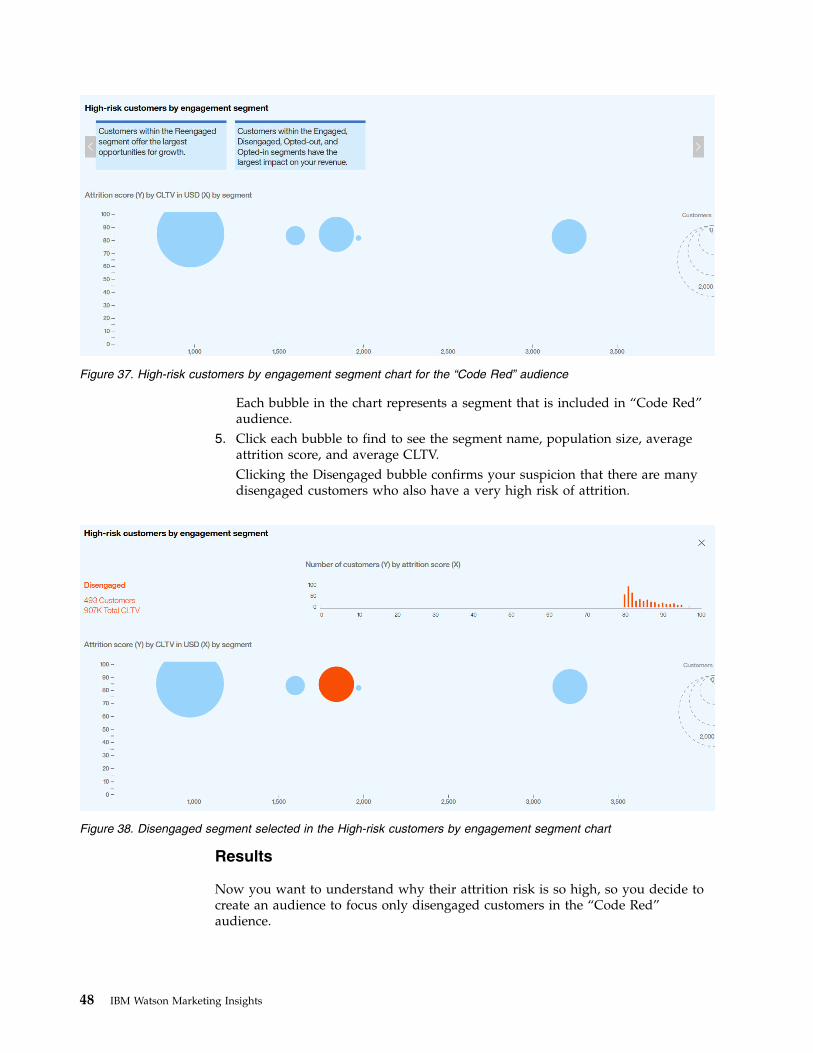
Each bubble in the chart represents a segment that is included in “Code Red”audience.
5. Click each bubble to find to see the segment name, population size, averageattrition score, and average CLTV.Clicking the Disengaged bubble confirms your suspicion that there are manydisengaged customers who also have a very high risk of attrition.
Results
Now you want to understand why their attrition risk is so high, so you decide tocreate an audience to focus only disengaged customers in the “Code Red”audience.
Figure 37. High-risk customers by engagement segment chart for the “Code Red” audience
Figure 38. Disengaged segment selected in the High-risk customers by engagement segment chart
48 IBM Watson Marketing Insights
Step 3: Creating a custom audienceYou want create an audience for disengaged customers in the “Code Red”audience so that you can explore the attrition predictors for this audience.
About this task
The “Code Red” audience already includes a condition for customers with anattrition score over 80. You need to add a condition to narrow it to disengagedcustomers only. You cannot edit the “Code Red” audience because it wasautomatically generated by IBM Watson Marketing Insights, but you can create acopy to use as the starting point to create a custom audience.
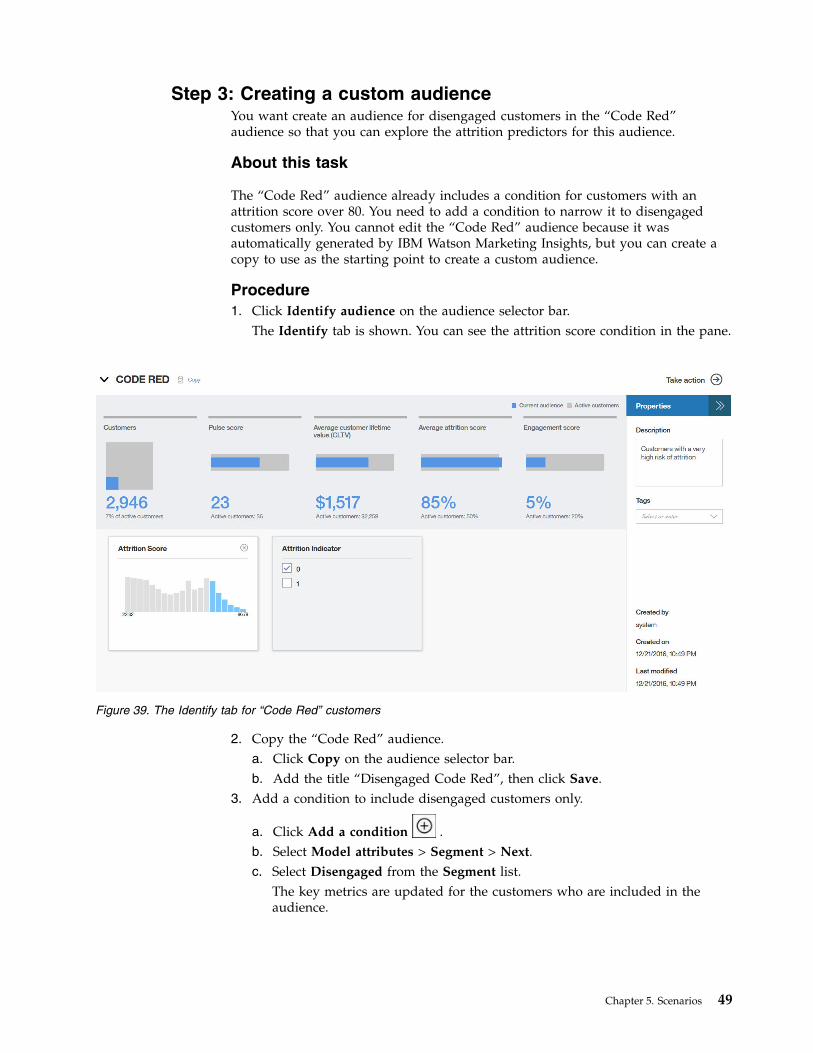
Procedure1. Click Identify audience on the audience selector bar.
The Identify tab is shown. You can see the attrition score condition in the pane.
2. Copy the “Code Red” audience.a. Click Copy on the audience selector bar.b. Add the title “Disengaged Code Red”, then click Save.
3. Add a condition to include disengaged customers only.
a. Click Add a condition .b. Select Model attributes > Segment > Next.c. Select Disengaged from the Segment list.
The key metrics are updated for the customers who are included in theaudience.
Figure 39. The Identify tab for “Code Red” customers
Chapter 5. Scenarios 49
Results
You can now explore the “Disengaged Code Red” audience in more detail.
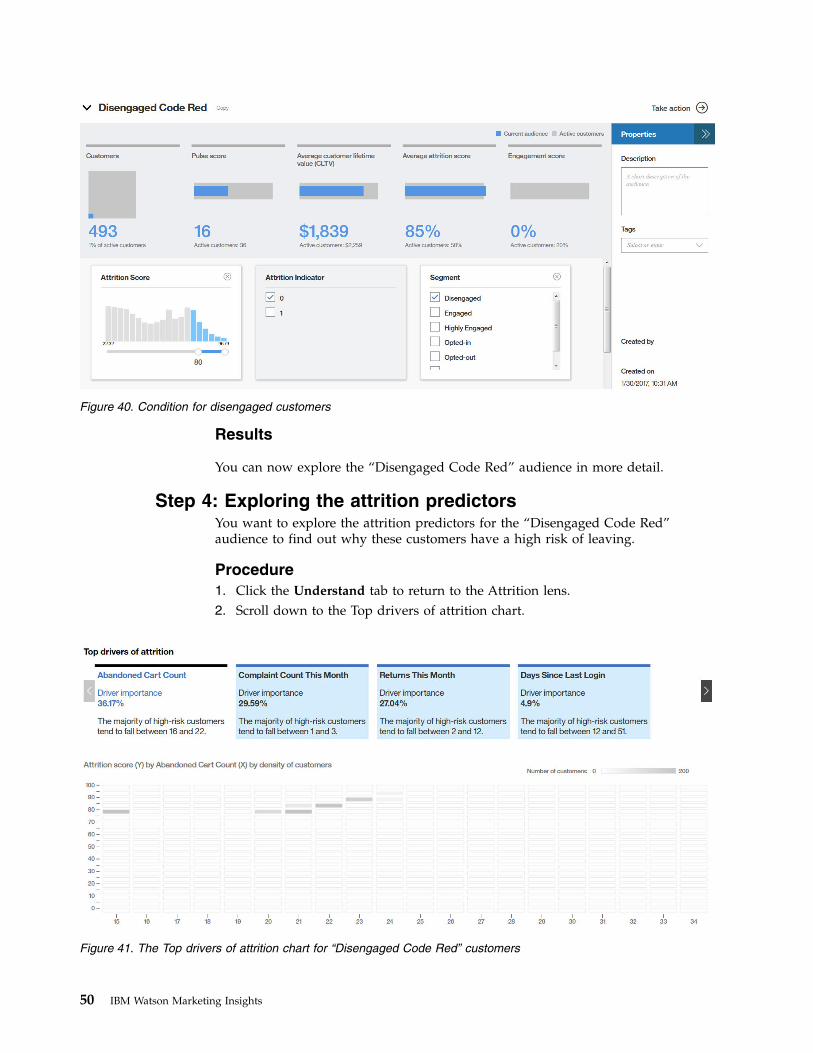
Step 4: Exploring the attrition predictorsYou want to explore the attrition predictors for the “Disengaged Code Red”audience to find out why these customers have a high risk of leaving.
Procedure1. Click the Understand tab to return to the Attrition lens.2. Scroll down to the Top drivers of attrition chart.
Figure 40. Condition for disengaged customers
Figure 41. The Top drivers of attrition chart for “Disengaged Code Red” customers
50 IBM Watson Marketing Insights
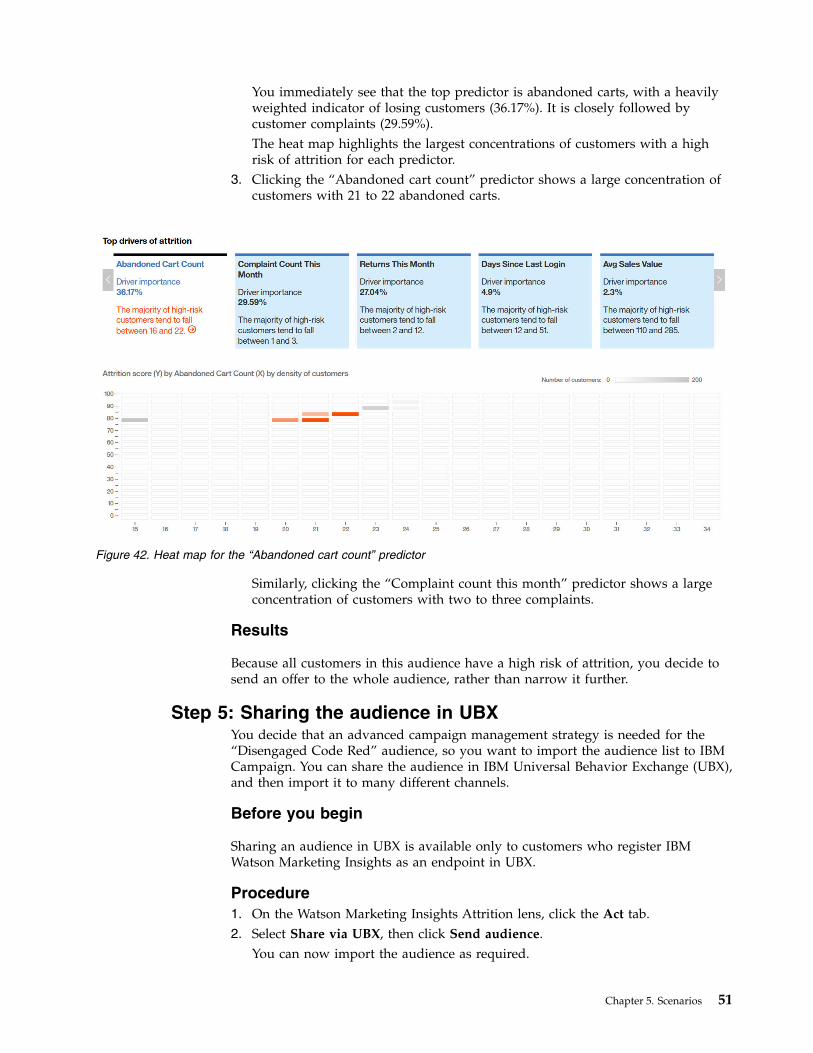
You immediately see that the top predictor is abandoned carts, with a heavilyweighted indicator of losing customers (36.17%). It is closely followed bycustomer complaints (29.59%).The heat map highlights the largest concentrations of customers with a highrisk of attrition for each predictor.
3. Clicking the “Abandoned cart count” predictor shows a large concentration ofcustomers with 21 to 22 abandoned carts.
Similarly, clicking the “Complaint count this month” predictor shows a largeconcentration of customers with two to three complaints.
Results
Because all customers in this audience have a high risk of attrition, you decide tosend an offer to the whole audience, rather than narrow it further.
Step 5: Sharing the audience in UBXYou decide that an advanced campaign management strategy is needed for the“Disengaged Code Red” audience, so you want to import the audience list to IBMCampaign. You can share the audience in IBM Universal Behavior Exchange (UBX),and then import it to many different channels.
Before you begin
Sharing an audience in UBX is available only to customers who register IBMWatson Marketing Insights as an endpoint in UBX.
Procedure1. On the Watson Marketing Insights Attrition lens, click the Act tab.2. Select Share via UBX, then click Send audience.
You can now import the audience as required.
Figure 42. Heat map for the “Abandoned cart count” predictor
Chapter 5. Scenarios 51

If Watson Marketing Insights is not registered as an endpoint in UBX, you donot see this option. You can export the audience data to your desktop:v Select Save basic data to desktop, then click Send audience.v Save the file.
52 IBM Watson Marketing Insights
Chapter 6. Predictive model sample data
This appendix provides definitions of items in the IBM Watson Marketing Insightspredictive models available in the preview environment.
Customer profiles
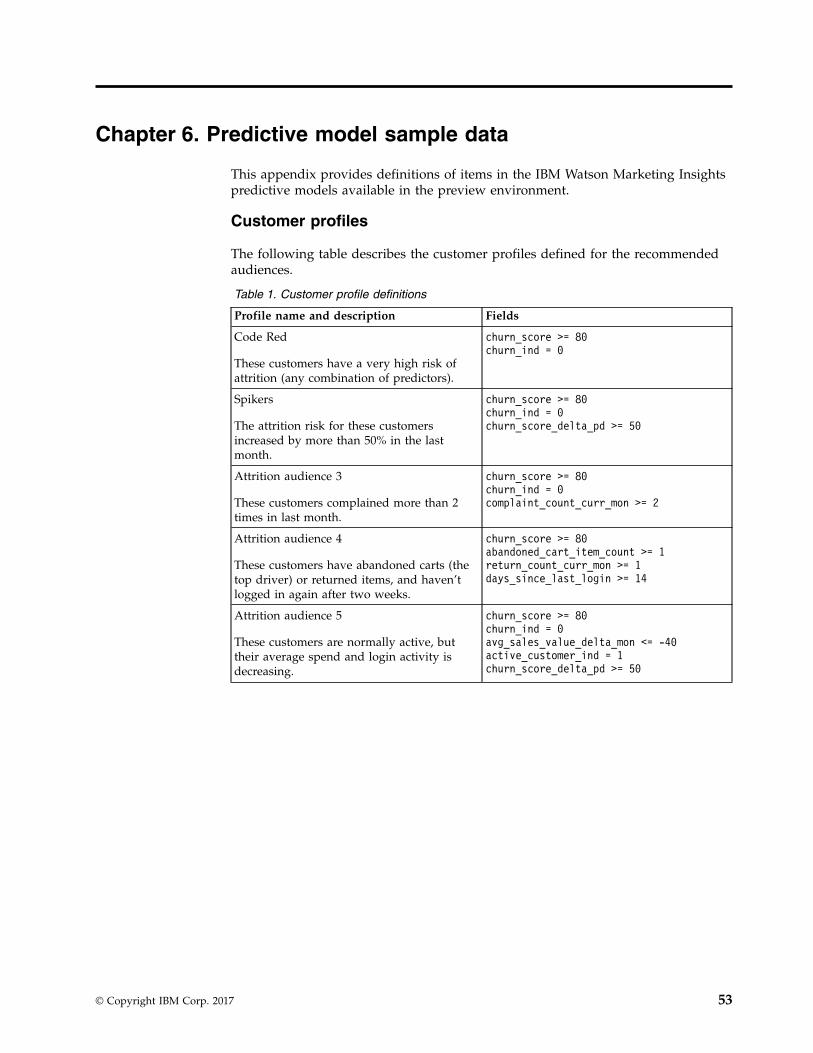
The following table describes the customer profiles defined for the recommendedaudiences.
Table 1. Customer profile definitions
Profile name and description Fields
Code Red
These customers have a very high risk ofattrition (any combination of predictors).
churn_score >= 80churn_ind = 0
Spikers
The attrition risk for these customersincreased by more than 50% in the lastmonth.
churn_score >= 80churn_ind = 0churn_score_delta_pd >= 50
Attrition audience 3
These customers complained more than 2times in last month.
churn_score >= 80churn_ind = 0complaint_count_curr_mon >= 2
Attrition audience 4
These customers have abandoned carts (thetop driver) or returned items, and haven’tlogged in again after two weeks.
churn_score >= 80abandoned_cart_item_count >= 1return_count_curr_mon >= 1days_since_last_login >= 14
Attrition audience 5
These customers are normally active, buttheir average spend and login activity isdecreasing.
churn_score >= 80churn_ind = 0avg_sales_value_delta_mon <= -40active_customer_ind = 1churn_score_delta_pd >= 50
© Copyright IBM Corp. 2017 53

54 IBM Watson Marketing Insights
Notices
This information was developed for products and services offered worldwide.
This material may be available from IBM in other languages. However, you may berequired to own a copy of the product or product version in that language in orderto access it.
IBM may not offer the products, services, or features discussed in this document inother countries. Consult your local IBM representative for information on theproducts and services currently available in your area. Any reference to an IBMproduct, program, or service is not intended to state or imply that only that IBMproduct, program, or service may be used. Any functionally equivalent product,program, or service that does not infringe any IBM intellectual property right maybe used instead. However, it is the user's responsibility to evaluate and verify theoperation of any non-IBM product, program, or service. This document maydescribe products, services, or features that are not included in the Program orlicense entitlement that you have purchased.
IBM may have patents or pending patent applications covering subject matterdescribed in this document. The furnishing of this document does not grant youany license to these patents. You can send license inquiries, in writing, to:
IBM Director of LicensingIBM CorporationNorth Castle DriveArmonk, NY 10504-1785U.S.A.
For license inquiries regarding double-byte (DBCS) information, contact the IBMIntellectual Property Department in your country or send inquiries, in writing, to:
Intellectual Property LicensingLegal and Intellectual Property LawIBM Japan Ltd.19-21, Nihonbashi-Hakozakicho, Chuo-kuTokyo 103-8510, Japan
The following paragraph does not apply to the United Kingdom or any othercountry where such provisions are inconsistent with local law: INTERNATIONALBUSINESS MACHINES CORPORATION PROVIDES THIS PUBLICATION “AS IS”WITHOUT WARRANTY OF ANY KIND, EITHER EXPRESS OR IMPLIED,INCLUDING, BUT NOT LIMITED TO, THE IMPLIED WARRANTIES OFNON-INFRINGEMENT, MERCHANTABILITY OR FITNESS FOR A PARTICULARPURPOSE. Some states do not allow disclaimer of express or implied warranties incertain transactions, therefore, this statement may not apply to you.
This information could include technical inaccuracies or typographical errors.Changes are periodically made to the information herein; these changes will beincorporated in new editions of the publication. IBM may make improvementsand/or changes in the product(s) and/or the program(s) described in thispublication at any time without notice.
© Copyright IBM Corp. 2017 55
Any references in this information to non-IBM Web sites are provided forconvenience only and do not in any manner serve as an endorsement of those Websites. The materials at those Web sites are not part of the materials for this IBMproduct and use of those Web sites is at your own risk.
IBM may use or distribute any of the information you supply in any way itbelieves appropriate without incurring any obligation to you.
Licensees of this program who wish to have information about it for the purposeof enabling: (i) the exchange of information between independently createdprograms and other programs (including this one) and (ii) the mutual use of theinformation which has been exchanged, should contact:
IBM Software GroupAttention: Licensing3755 Riverside Dr.Ottawa, ONK1V 1B7Canada
Such information may be available, subject to appropriate terms and conditions,including in some cases, payment of a fee.
The licensed program described in this document and all licensed materialavailable for it are provided by IBM under terms of the IBM Customer Agreement,IBM International Program License Agreement or any equivalent agreementbetween us.
Any performance data contained herein was determined in a controlledenvironment. Therefore, the results obtained in other operating environments mayvary significantly. Some measurements may have been made on development-levelsystems and there is no guarantee that these measurements will be the same ongenerally available systems. Furthermore, some measurements may have beenestimated through extrapolation. Actual results may vary. Users of this documentshould verify the applicable data for their specific environment.
Information concerning non-IBM products was obtained from the suppliers ofthose products, their published announcements or other publicly available sources.IBM has not tested those products and cannot confirm the accuracy ofperformance, compatibility or any other claims related to non-IBM products.Questions on the capabilities of non-IBM products should be addressed to thesuppliers of those products.
All statements regarding IBM's future direction or intent are subject to change orwithdrawal without notice, and represent goals and objectives only.
This information is for planning purposes only. The information herein is subject tochange before the products described become available.
This information contains examples of data and reports used in daily businessoperations. To illustrate them as completely as possible, the examples include thenames of individuals, companies, brands, and products. All of these names arefictitious and any similarity to the names and addresses used by an actual businessenterprise is entirely coincidental.
56 IBM Watson Marketing Insights
If you are viewing this information softcopy, the photographs and colorillustrations may not appear.
Depending upon the configurations deployed, this Software Offering may usesession cookies that collect each user'sv namev user namev password
for purposes ofv session managementv authenticationv usage tracking or functional purposes other than session management,
authentication, enhanced user usability and single sign-on configuration
These cookies cannot be disabled.
If the configurations deployed for this Software Offering provide you as customerthe ability to collect personally identifiable information from end users via cookiesand other technologies, you should seek your own legal advice about any lawsapplicable to such data collection, including any requirements for notice andconsent.
For more information about the use of various technologies, including cookies, forthese purposes, see IBM's Privacy Policy at http://www.ibm.com/privacy andIBM's Online Privacy Statement at http://www.ibm.com/privacy/details in thesection entitled “Cookies, Web Beacons and Other Technologies" and the "IBMSoftware Products and Software-as-a-Service Privacy Statement” athttp://www.ibm.com/software/info/product-privacy.
Trademarks
IBM, the IBM logo and ibm.com are trademarks or registered trademarks ofInternational Business Machines Corp., registered in many jurisdictions worldwide.Other product and service names might be trademarks of IBM or other companies.A current list of IBM trademarks is available on the Web at “ Copyright andtrademark information ” at www.ibm.com/legal/copytrade.shtml.
Notices 57

![[IBM Korea 김상훈] Watson Explorer](https://static.fdocument.pub/doc/165x107/5870048b1a28ab427f8b5bf9/ibm-korea-watson-explorer.jpg)