Healthcare Business Strategy - Hitachi Global · 6/1/2016 · Growth of market (CAGR:9%) ・Growth...
33
© Hitachi, Ltd. 2016. All rights reserved. Hitachi IR Day 2016 Healthcare Business Strategy Masaya Watanabe Vice President and Executive Officer, CEO of Healthcare Business Unit Hitachi, Ltd. June 1, 2016
Transcript of Healthcare Business Strategy - Hitachi Global · 6/1/2016 · Growth of market (CAGR:9%) ・Growth...
© Hitachi, Ltd. 2016. All rights reserved.
株式会社日立製作所
June 1, 2016
Hitachi IR Day 2016
Healthcare Business Strategy
Masaya Watanabe
Vice President and Executive Officer, CEO of Healthcare Business Unit Hitachi, Ltd.
June 1, 2016
© Hitachi, Ltd. 2016. All rights reserved.
ヘルスケア事業戦略
[Contents]
1. Review of FY2015
2. Business Overview and Overall Strategies
3. Innovation and Collaborative Creation for New Growth
4. Change of Portfolio and Main Business
5. Reinforcement of Business Structure and Investment
6. Conclusion
Healthcare Business Strategy
[Contents]
© Hitachi, Ltd. 2016. All rights reserved.
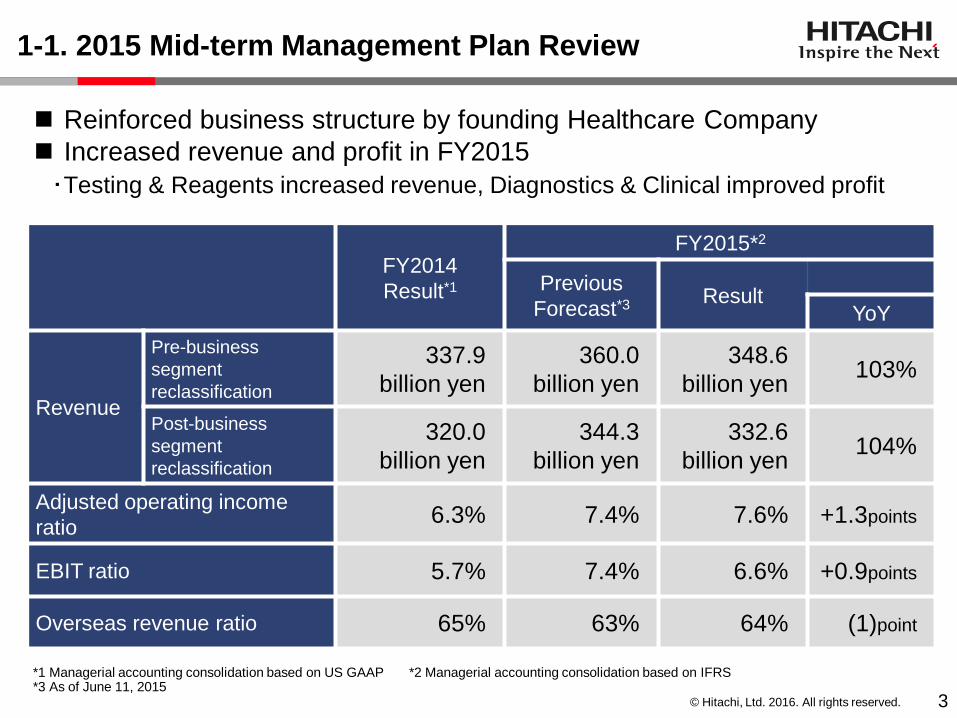
1-1. 2015 Mid-term Management Plan Review
FY2014
Result*1
FY2015*2
Previous
Forecast*3 Result YoY
Revenue
Pre-business
segment
reclassification
337.9
billion yen
360.0
billion yen
348.6
billion yen 103%
Post-business
segment
reclassification
320.0
billion yen
344.3
billion yen
332.6
billion yen 104%
Adjusted operating income
ratio 6.3% 7.4% 7.6% +1.3points
EBIT ratio 5.7% 7.4% 6.6% +0.9points
Overseas revenue ratio 65% 63% 64% (1)point
Reinforced business structure by founding Healthcare Company
Increased revenue and profit in FY2015
・Testing & Reagents increased revenue, Diagnostics & Clinical improved profit
*1 Managerial accounting consolidation based on US GAAP *2 Managerial accounting consolidation based on IFRS *3 As of June 11, 2015
3
© Hitachi, Ltd. 2016. All rights reserved.
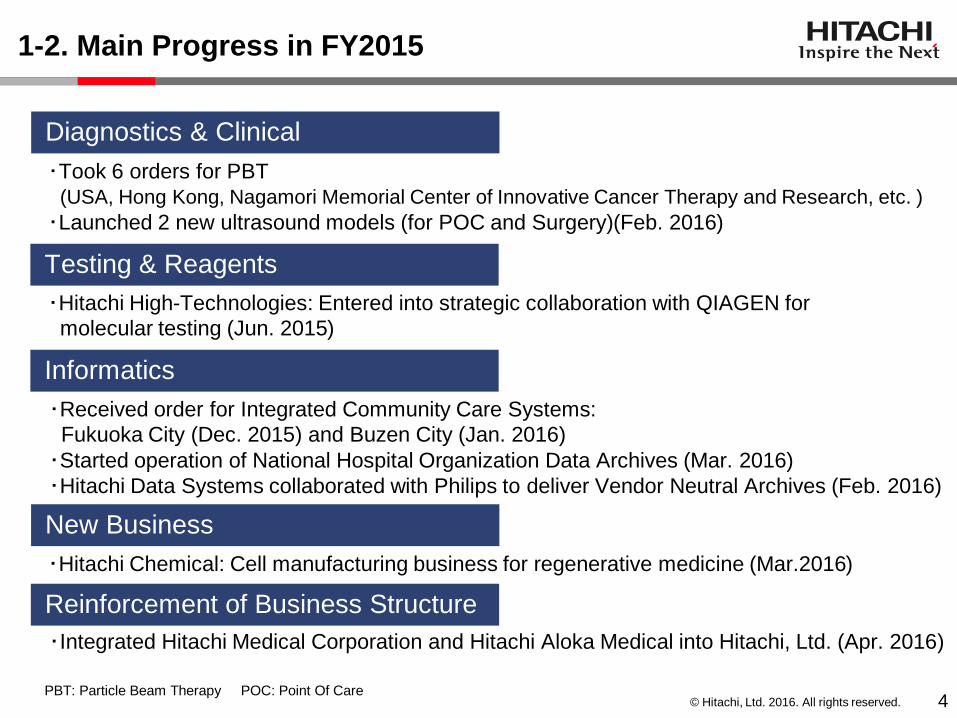
1-2. Main Progress in FY2015
・Integrated Hitachi Medical Corporation and Hitachi Aloka Medical into Hitachi, Ltd. (Apr. 2016)
・Took 6 orders for PBT
(USA, Hong Kong, Nagamori Memorial Center of Innovative Cancer Therapy and Research, etc. )
・Launched 2 new ultrasound models (for POC and Surgery)(Feb. 2016)
・Received order for Integrated Community Care Systems:
Fukuoka City (Dec. 2015) and Buzen City (Jan. 2016)
・Started operation of National Hospital Organization Data Archives (Mar. 2016)
・Hitachi Data Systems collaborated with Philips to deliver Vendor Neutral Archives (Feb. 2016)
・Hitachi High-Technologies: Entered into strategic collaboration with QIAGEN for
molecular testing (Jun. 2015)
・Hitachi Chemical: Cell manufacturing business for regenerative medicine (Mar.2016)
PBT: Particle Beam Therapy POC: Point Of Care
Diagnostics & Clinical
Testing & Reagents
Informatics
New Business
Reinforcement of Business Structure
4
© Hitachi, Ltd. 2016. All rights reserved.
ヘルスケア事業戦略
[Contents]
1. Review of FY2015
2. Business Overview and Overall Strategies
3. Innovation and Collaborative Creation for New Growth
4. Change of Portfolio and Main Business
5. Reinforcement of Business Structure and Investment
6. Conclusion
Healthcare Business Strategy
[Contents]
© Hitachi, Ltd. 2016. All rights reserved.
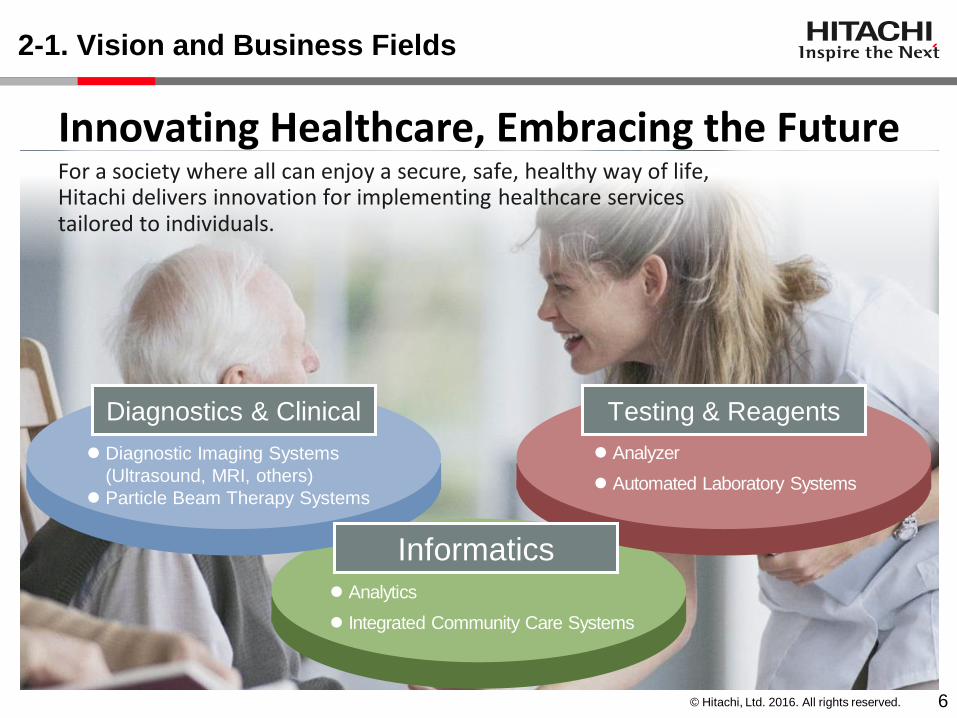
2-1. Vision and Business Fields
For a society where all can enjoy a secure, safe, healthy way of life, Hitachi delivers innovation for implementing healthcare services tailored to individuals.
Innovating Healthcare, Embracing the Future
Diagnostic Imaging Systems
(Ultrasound, MRI, others)
Particle Beam Therapy Systems
Diagnostics & Clinical
Analyzer
Automated Laboratory Systems
Testing & Reagents
Informatics
Analytics
Integrated Community Care Systems
6
© Hitachi, Ltd. 2016. All rights reserved.
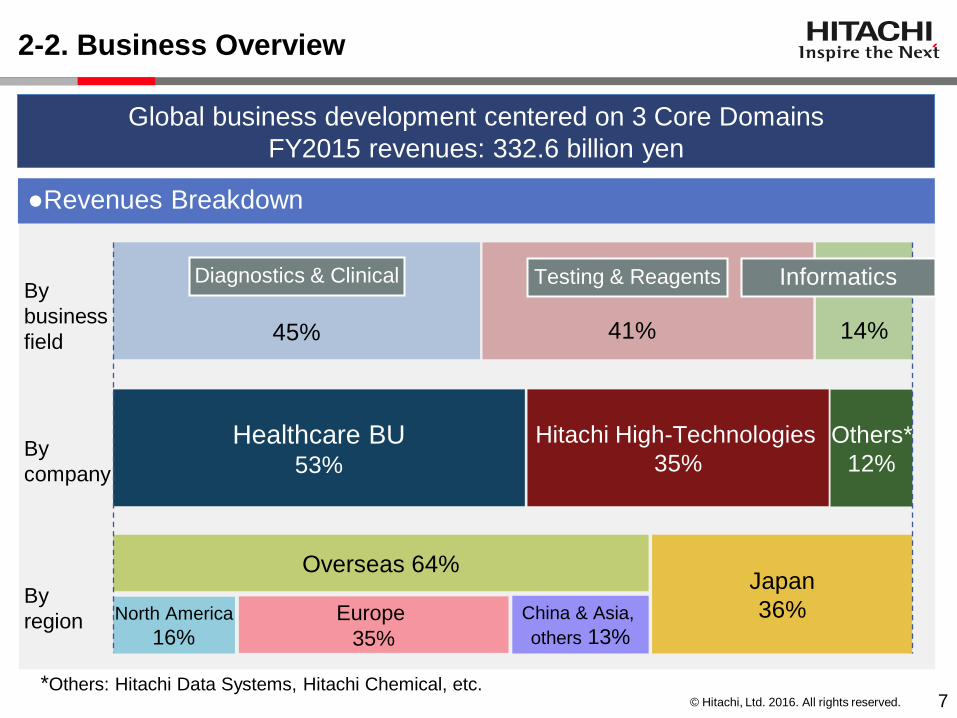
2-2. Business Overview
●Revenues Breakdown
14%
41%
45%
Diagnostics & Clinical By
business
field
Others*
12%
Hitachi High-Technologies
35% Healthcare BU
53% By
company
Overseas 64% Japan
36% North America
16% Europe
35%
China & Asia,
others 13%
By
region
Testing & Reagents
*Others: Hitachi Data Systems, Hitachi Chemical, etc.
Global business development centered on 3 Core Domains
FY2015 revenues: 332.6 billion yen
Informatics
7
© Hitachi, Ltd. 2016. All rights reserved.
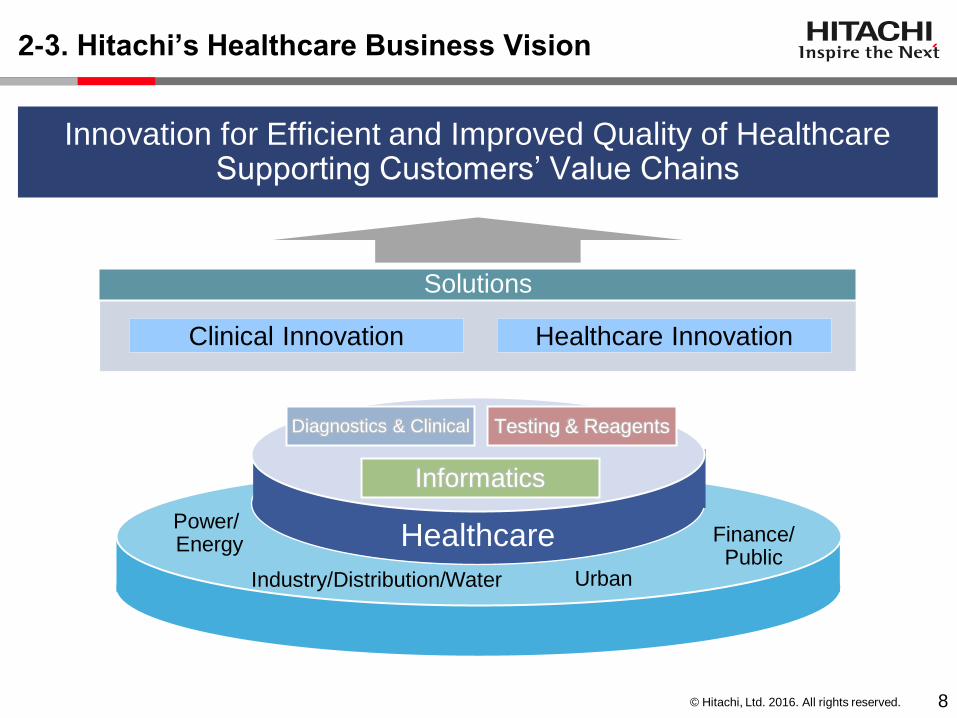
2-3. Hitachi’s Healthcare Business Vision
Innovation for Efficient and Improved Quality of Healthcare Supporting Customers’ Value Chains
ヘルスケア
Power/ Energy Finance/
Public Urban Industry/Distribution/Water
Healthcare
Informatics
Testing & Reagents Diagnostics & Clinical
Solutions
Healthcare Innovation Clinical Innovation
8
© Hitachi, Ltd. 2016. All rights reserved.
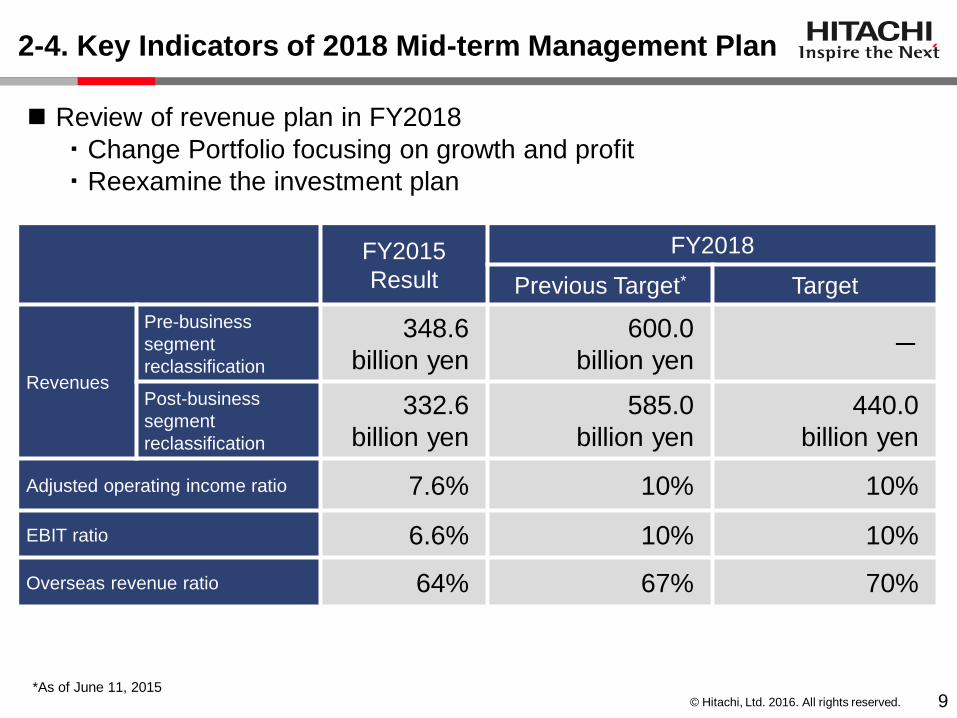
FY2015
Result
FY2018
Previous Target* Target
Revenues
Pre-business
segment
reclassification
348.6
billion yen
600.0
billion yen -
Post-business
segment
reclassification
332.6
billion yen
585.0
billion yen
440.0
billion yen
Adjusted operating income ratio 7.6% 10% 10%
EBIT ratio 6.6% 10% 10%
Overseas revenue ratio 64% 67% 70%
Review of revenue plan in FY2018
・Change Portfolio focusing on growth and profit
・Reexamine the investment plan
*As of June 11, 2015
2-4. Key Indicators of 2018 Mid-term Management Plan
9
© Hitachi, Ltd. 2016. All rights reserved. 10
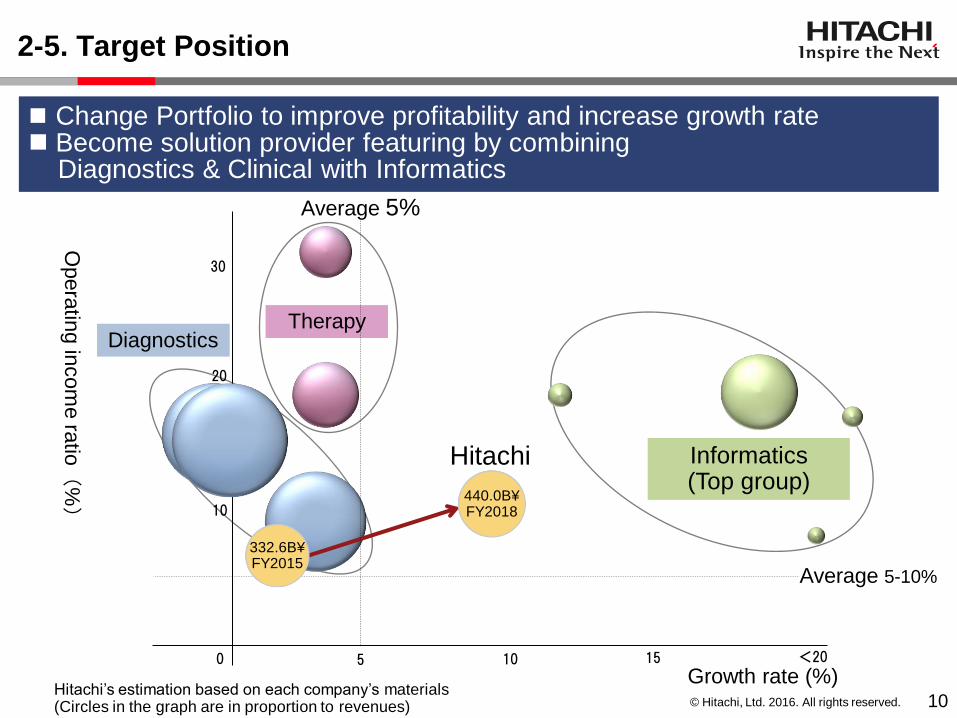
Change Portfolio to improve profitability and increase growth rate Become solution provider featuring by combining Diagnostics & Clinical with Informatics
2-5. Target Position
Hitachi’s estimation based on each company’s materials (Circles in the graph are in proportion to revenues)
Opera
ting in
com
e ra
tio
(%
)
Growth rate (%)
10
20
0 <20 10
Hitachi
30
Informatics (Top group)
Therapy
5
15
15
Average 5%
Average 5-10%
Diagnostics
440.0B¥ FY2018
332.6B¥ FY2015
© Hitachi, Ltd. 2016. All rights reserved.
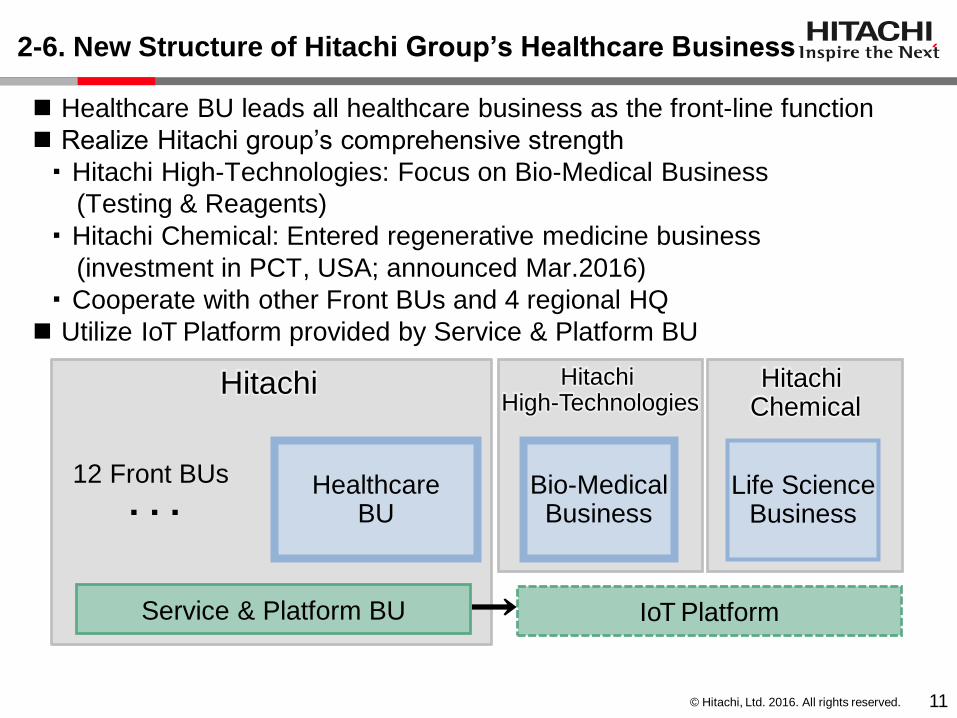
2-6. New Structure of Hitachi Group’s Healthcare Business
Healthcare BU leads all healthcare business as the front-line function
Realize Hitachi group’s comprehensive strength
・ Hitachi High-Technologies: Focus on Bio-Medical Business
(Testing & Reagents)
・ Hitachi Chemical: Entered regenerative medicine business
(investment in PCT, USA; announced Mar.2016) ・ Cooperate with other Front BUs and 4 regional HQ Utilize IoT Platform provided by Service & Platform BU
Hitachi High-Technologies
Hitachi Chemical
12 Front BUs
Hitachi
Bio-Medical Business
Healthcare BU
Life Science Business
IoT Platform Service & Platform BU →
・ ・ ・
11
© Hitachi, Ltd. 2016. All rights reserved.
ヘルスケア事業戦略
[Contents]
1. Review of FY2015
2. Business Overview and Overall Strategies
3. Innovation and Collaborative Creation for New Growth
4. Change of Portfolio and Main Business
5. Reinforcement of Business Structure and Investment
6. Conclusion
Healthcare Business Strategy
© Hitachi, Ltd. 2016. All rights reserved.
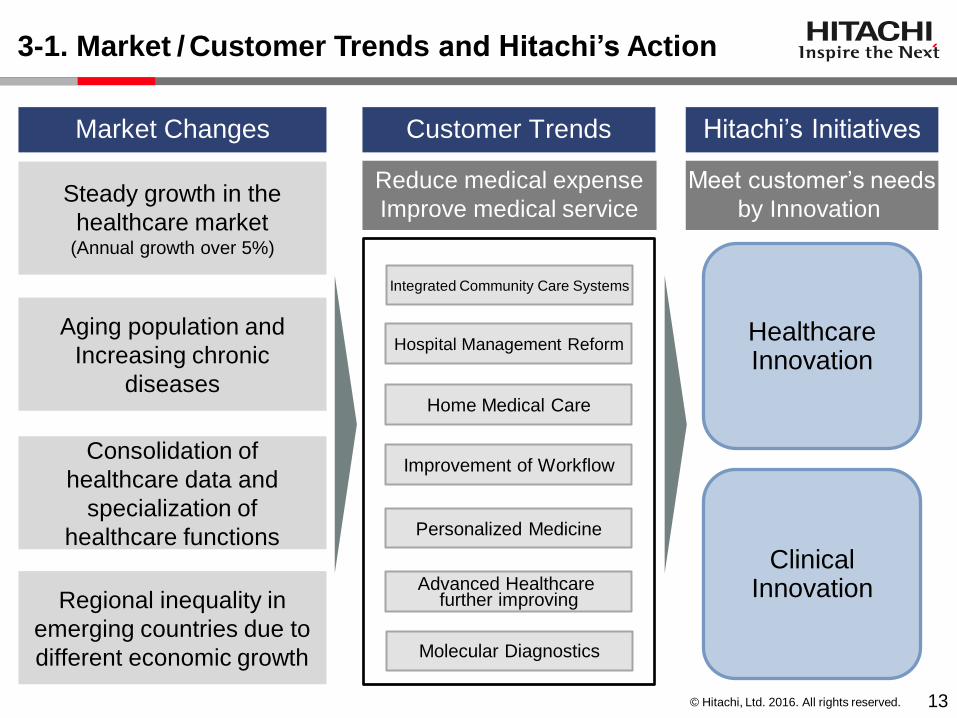
3-1. Market / Customer Trends and Hitachi’s Action
Aging population and
Increasing chronic
diseases
Regional inequality in
emerging countries due to
different economic growth
Steady growth in the
healthcare market (Annual growth over 5%)
Consolidation of
healthcare data and
specialization of
healthcare functions
Market Changes Hitachi’s Initiatives Customer Trends
Reduce medical expense
Improve medical service
Healthcare Innovation
Clinical Innovation
Meet customer’s needs
by Innovation
Integrated Community Care Systems
Hospital Management Reform
Home Medical Care
Improvement of Workflow
Personalized Medicine
Advanced Healthcare further improving
13
Molecular Diagnostics
© Hitachi, Ltd. 2016. All rights reserved.
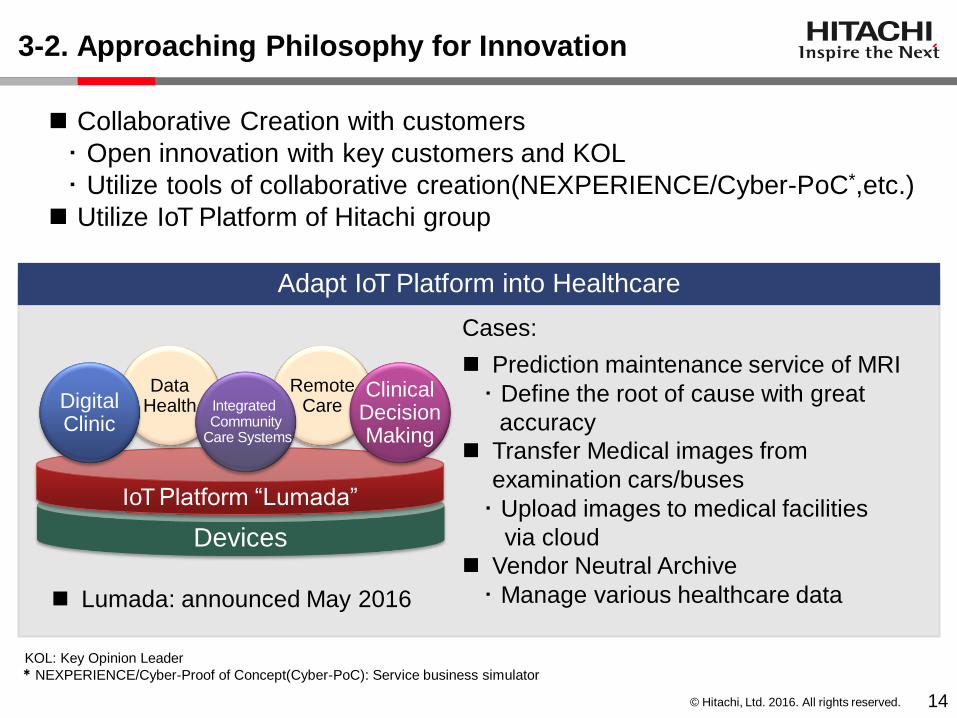
3-2. Approaching Philosophy for Innovation
Collaborative Creation with customers
・ Open innovation with key customers and KOL
・ Utilize tools of collaborative creation(NEXPERIENCE/Cyber-PoC*,etc.)
Utilize IoT Platform of Hitachi group
Lumada: announced May 2016
Cases:
Prediction maintenance service of MRI
・ Define the root of cause with great
accuracy
Transfer Medical images from
examination cars/buses
・ Upload images to medical facilities
via cloud
Vendor Neutral Archive
・ Manage various healthcare data
Devices
IoT Platform “Lumada”
Adapt IoT Platform into Healthcare
Remote Care
Data Health Integrated
Community Care Systems
Digital Clinic
Clinical Decision Making
KOL: Key Opinion Leader * NEXPERIENCE/Cyber-Proof of Concept(Cyber-PoC): Service business simulator
14
© Hitachi, Ltd. 2016. All rights reserved.
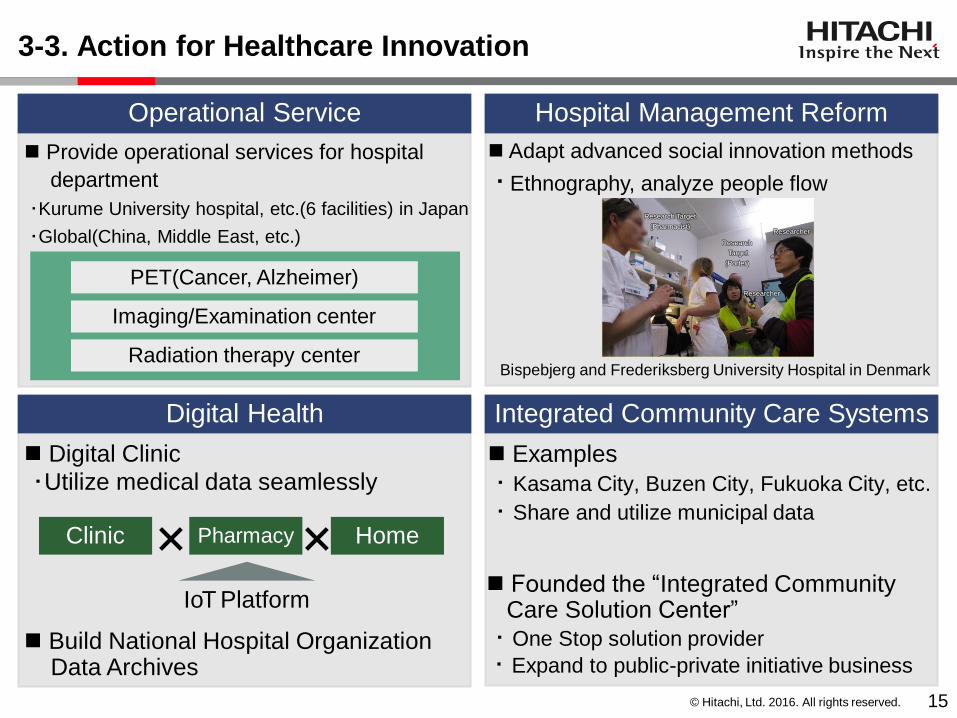
3-3. Action for Healthcare Innovation
Digital Health Integrated Community Care Systems
Hospital Management Reform Operational Service
Provide operational services for hospital
department
・Kurume University hospital, etc.(6 facilities) in Japan
・Global(China, Middle East, etc.)
Adapt advanced social innovation methods
・ Ethnography, analyze people flow
Researcher
Research Target
(Pharmacist)
Research
Target
(Porter)
Researcher
Imaging/Examination center
PET(Cancer, Alzheimer)
Radiation therapy center
IoT Platform
Clinic Home × Pharmacy × Founded the “Integrated Community Care Solution Center”
・ One Stop solution provider
・ Expand to public-private initiative business
Digital Clinic
・Utilize medical data seamlessly
Build National Hospital Organization Data Archives
Examples
・ Kasama City, Buzen City, Fukuoka City, etc.
・ Share and utilize municipal data
Bispebjerg and Frederiksberg University Hospital in Denmark
15
© Hitachi, Ltd. 2016. All rights reserved.
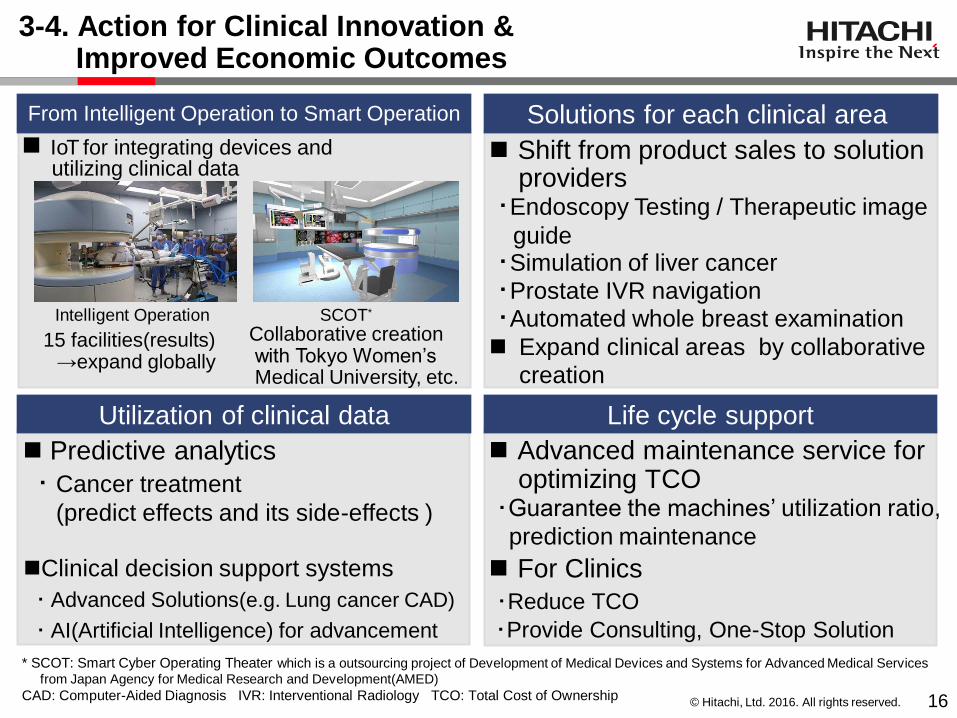
3-4. Action for Clinical Innovation & Improved Economic Outcomes
全体の取り組みと
Intelligent Operation SCOT*
15 facilities(results) →expand globally
Collaborative creation with Tokyo Women’s Medical University, etc.
IoT for integrating devices and utilizing clinical data
Predictive analytics
・ Cancer treatment
(predict effects and its side-effects )
Utilization of clinical data Life cycle support
From Intelligent Operation to Smart Operation Solutions for each clinical area
Shift from product sales to solution providers ・Endoscopy Testing / Therapeutic image
guide ・Simulation of liver cancer
・Prostate IVR navigation ・Automated whole breast examination Expand clinical areas by collaborative
creation
* SCOT: Smart Cyber Operating Theater which is a outsourcing project of Development of Medical Devices and Systems for Advanced Medical Services
from Japan Agency for Medical Research and Development(AMED)
CAD: Computer-Aided Diagnosis IVR: Interventional Radiology TCO: Total Cost of Ownership 16
Advanced maintenance service for optimizing TCO ・Guarantee the machines’ utilization ratio,
prediction maintenance
For Clinics
・Reduce TCO
・Provide Consulting, One-Stop Solution
Clinical decision support systems
・ Advanced Solutions(e.g. Lung cancer CAD)
・ AI(Artificial Intelligence) for advancement
© Hitachi, Ltd. 2016. All rights reserved.
ヘルスケア事業戦略
1. Review of FY2015
2. Business Overview and Overall Strategies
3. Innovation and Collaborative Creation for New Growth
4. Change Portfolio and Main Business
5. Reinforcement of Business Structure and Investment
6. Conclusion
Healthcare Business Strategy
[Contents]
© Hitachi, Ltd. 2016. All rights reserved.
FY2018 Target
Innovatio
n fo
r Gro
wth
Diagnostics
&
Clinical
Informatics
Current Position
Testing &
Reagents
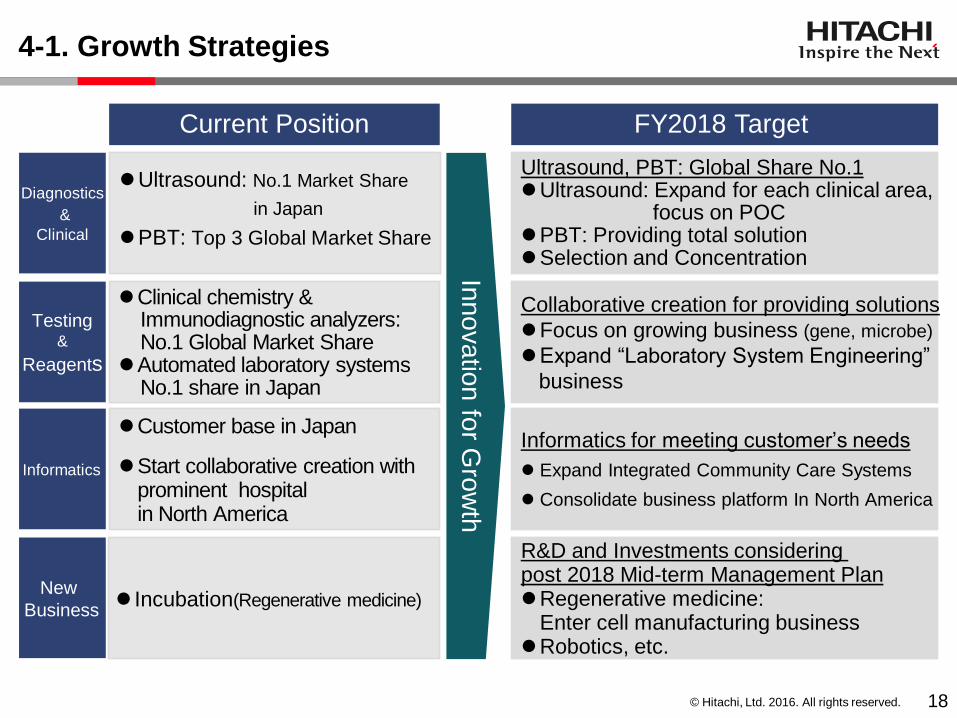
4-1. Growth Strategies
New
Business
Ultrasound: No.1 Market Share
in Japan
PBT: Top 3 Global Market Share
Customer base in Japan
Start collaborative creation with prominent hospital in North America
Ultrasound, PBT: Global Share No.1 Ultrasound: Expand for each clinical area, focus on POC PBT: Providing total solution Selection and Concentration
Informatics for meeting customer’s needs
Expand Integrated Community Care Systems
Consolidate business platform In North America
Clinical chemistry & Immunodiagnostic analyzers: No.1 Global Market Share Automated laboratory systems No.1 share in Japan
Collaborative creation for providing solutions
Focus on growing business (gene, microbe)
Expand “Laboratory System Engineering”
business
Incubation(Regenerative medicine)
R&D and Investments considering post 2018 Mid-term Management Plan Regenerative medicine:
Enter cell manufacturing business Robotics, etc.
18
© Hitachi, Ltd. 2016. All rights reserved.
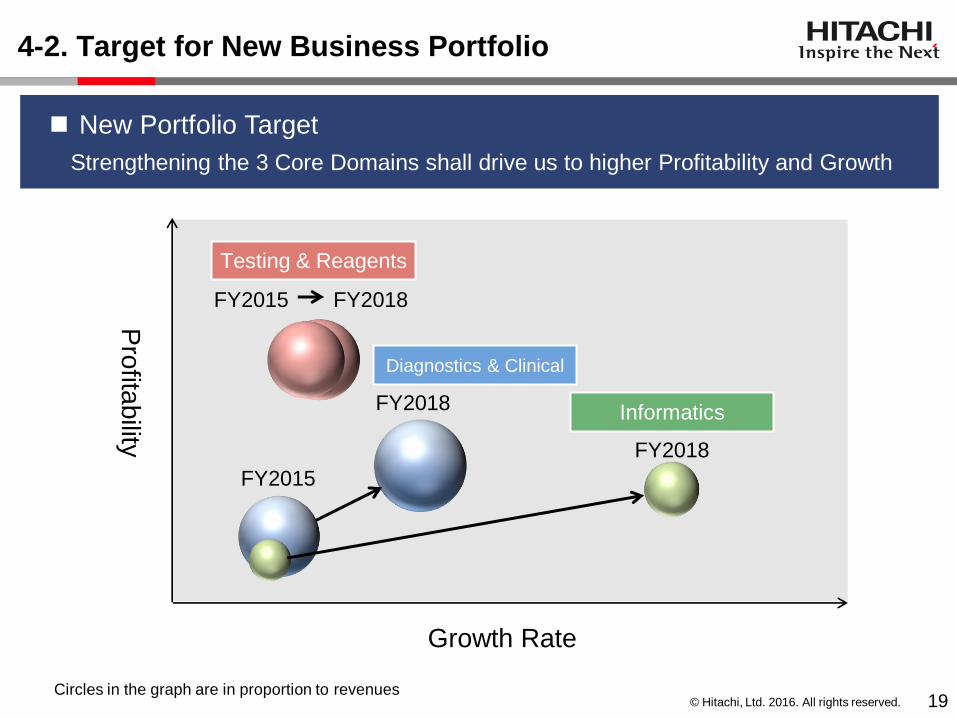
4-2. Target for New Business Portfolio
New Portfolio Target
Strengthening the 3 Core Domains shall drive us to higher Profitability and Growth
19
FY2015 FY2018
Pro
fitability
Growth Rate
FY2018
FY2018
FY2015
Informatics
Testing & Reagents
Diagnostics & Clinical
Circles in the graph are in proportion to revenues
© Hitachi, Ltd. 2016. All rights reserved.
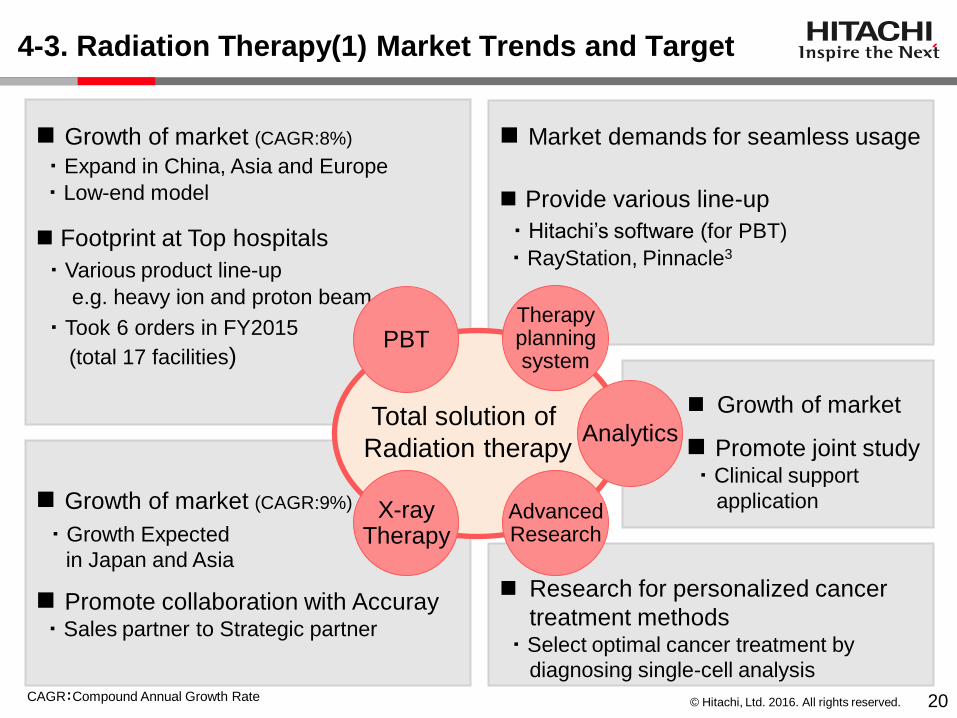
Promote collaboration with Accuray ・Sales partner to Strategic partner
Growth of market (CAGR:9%)
・Growth Expected
in Japan and Asia
Growth of market (CAGR:8%)
・Expand in China, Asia and Europe
・Low-end model
Footprint at Top hospitals
・Various product line-up
e.g. heavy ion and proton beam
・Took 6 orders in FY2015
(total 17 facilities) PBT
X-ray Therapy
Analytics Total solution of
Radiation therapy
Growth of market
Therapy planning system
Research for personalized cancer
treatment methods ・Select optimal cancer treatment by
diagnosing single-cell analysis
Market demands for seamless usage
Advanced Research
Provide various line-up
・Hitachi’s software (for PBT)
・RayStation, Pinnacle3
20
4-3. Radiation Therapy(1) Market Trends and Target
Promote joint study ・Clinical support
application
CAGR:Compound Annual Growth Rate
© Hitachi, Ltd. 2016. All rights reserved.
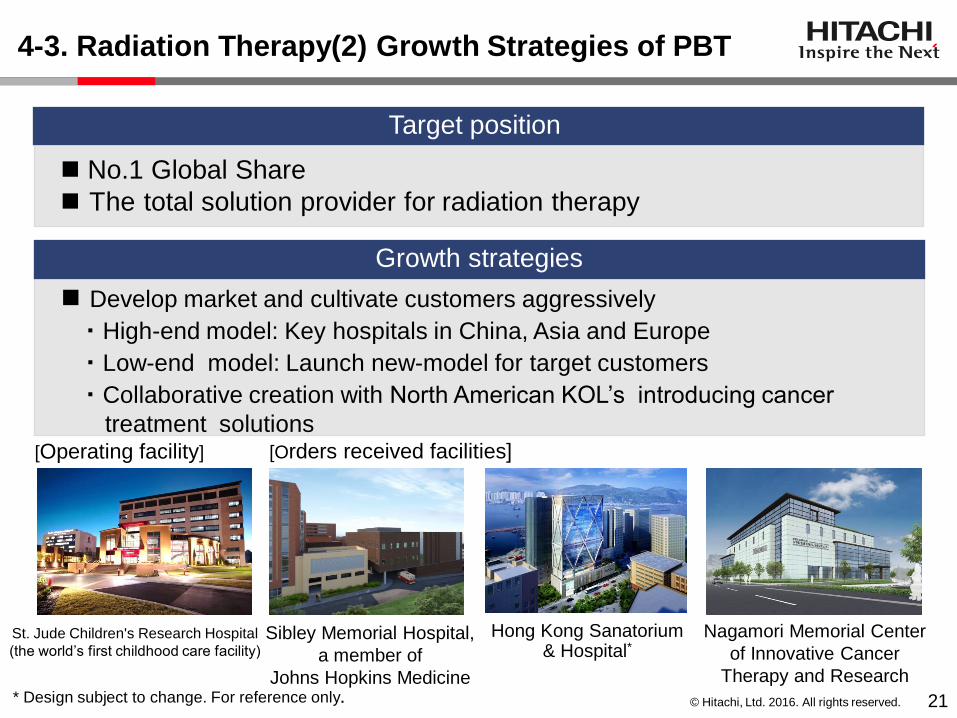
Develop market and cultivate customers aggressively
・High-end model: Key hospitals in China, Asia and Europe
・Low-end model: Launch new-model for target customers
・Collaborative creation with North American KOL’s introducing cancer
treatment solutions
Growth strategies
No.1 Global Share The total solution provider for radiation therapy
Target position
Hong Kong Sanatorium & Hospital*
Nagamori Memorial Center
of Innovative Cancer
Therapy and Research * Design subject to change. For reference only.
[Orders received facilities]
Sibley Memorial Hospital,
a member of
Johns Hopkins Medicine
St. Jude Children's Research Hospital
(the world’s first childhood care facility)
[Operating facility]
21
4-3. Radiation Therapy(2) Growth Strategies of PBT
© Hitachi, Ltd. 2016. All rights reserved.
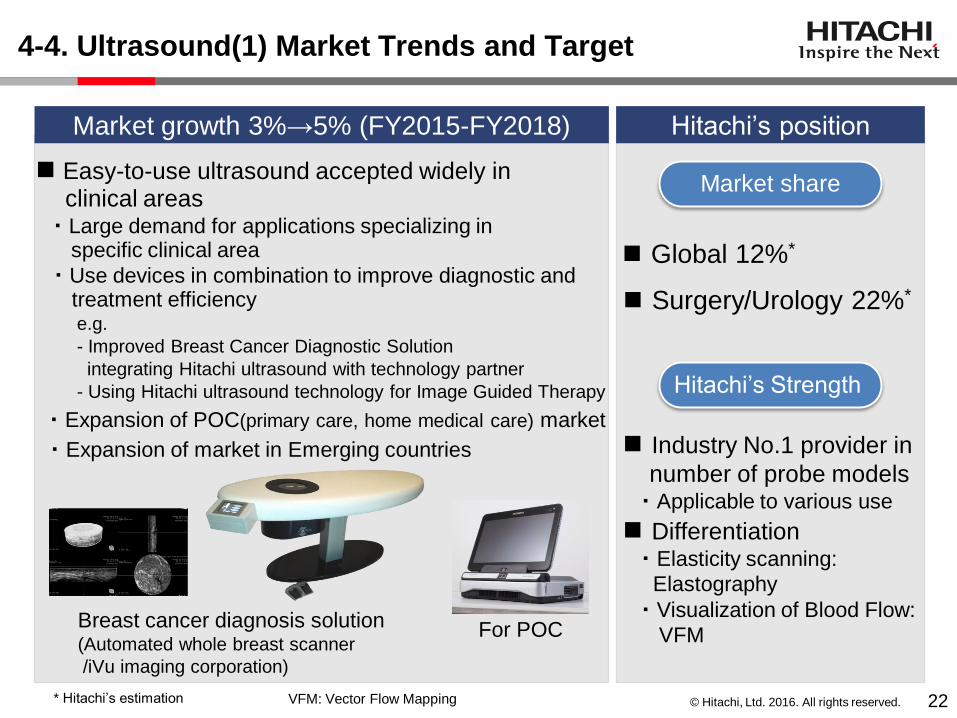
4-4. Ultrasound(1) Market Trends and Target
・Large demand for applications specializing in specific clinical area
Hitachi’s position Market growth 3%→5% (FY2015-FY2018)
・Use devices in combination to improve diagnostic and treatment efficiency
Breast cancer diagnosis solution (Automated whole breast scanner
/iVu imaging corporation)
Market share
Surgery/Urology 22%*
Hitachi’s Strength
Industry No.1 provider in
number of probe models ・Applicable to various use
Differentiation ・Elasticity scanning:
Elastography
・Visualization of Blood Flow:
VFM
・Expansion of market in Emerging countries
* Hitachi’s estimation
For POC
Global 12%*
Easy-to-use ultrasound accepted widely in clinical areas
・Expansion of POC(primary care, home medical care) market
VFM: Vector Flow Mapping 22
e.g.
- Improved Breast Cancer Diagnostic Solution
integrating Hitachi ultrasound with technology partner
- Using Hitachi ultrasound technology for Image Guided Therapy
© Hitachi, Ltd. 2016. All rights reserved.
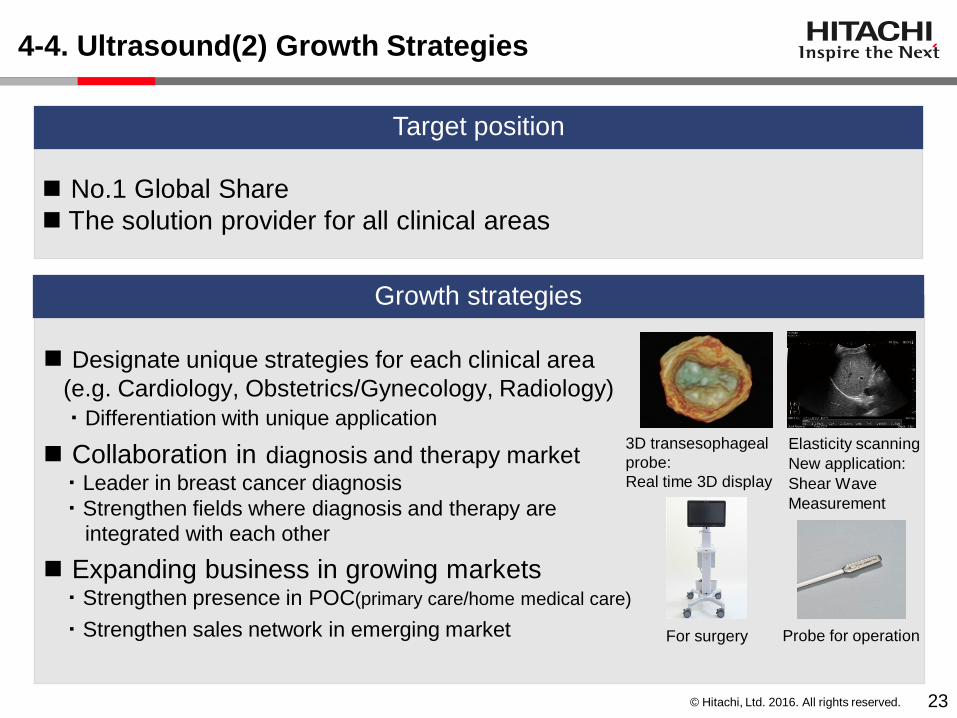
4-4. Ultrasound(2) Growth Strategies
Growth strategies
3D transesophageal
probe:
Real time 3D display
For surgery
Elasticity scanning
New application:
Shear Wave
Measurement
Designate unique strategies for each clinical area
(e.g. Cardiology, Obstetrics/Gynecology, Radiology)
・Differentiation with unique application
Collaboration in diagnosis and therapy market ・Leader in breast cancer diagnosis
・Strengthen fields where diagnosis and therapy are
integrated with each other
Expanding business in growing markets ・Strengthen presence in POC(primary care/home medical care)
・Strengthen sales network in emerging market Probe for operation
No.1 Global Share
The solution provider for all clinical areas
Target position
23
© Hitachi, Ltd. 2016. All rights reserved.
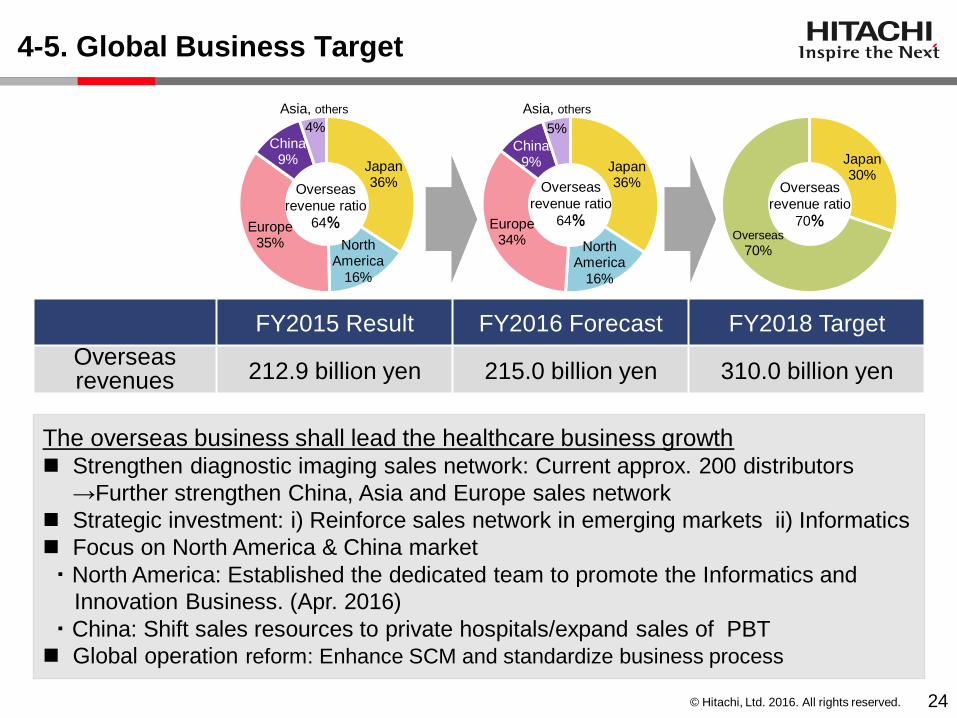
The overseas business shall lead the healthcare business growth Strengthen diagnostic imaging sales network: Current approx. 200 distributors
→Further strengthen China, Asia and Europe sales network
Strategic investment: i) Reinforce sales network in emerging markets ii) Informatics
Focus on North America & China market
・North America: Established the dedicated team to promote the Informatics and
Innovation Business. (Apr. 2016)
・China: Shift sales resources to private hospitals/expand sales of PBT
Global operation reform: Enhance SCM and standardize business process
4-5. Global Business Target
Japan 36%
North America
16%
Europe 35%
China 9%
4%
Japan 36%
North America
16%
Europe 34%
China 9%
5%
Japan 30%
Overseas 70%
Overseas
revenue ratio
70%
Overseas
revenue ratio
64%
Overseas
revenue ratio
64%
FY2015 Result FY2016 Forecast FY2018 Target
Overseas revenues 212.9 billion yen 215.0 billion yen 310.0 billion yen
24
Asia, others Asia, others
© Hitachi, Ltd. 2016. All rights reserved.
ヘルスケア事業戦略
[Contents]
1. Review of FY2015
2. Business Overview and Overall Strategies
3. Innovation and Collaborative Creation for New Growth
4. Change of Portfolio and Main Business
5. Reinforcement of Business Structure and Investment
6. Conclusion
Healthcare Business Strategy
© Hitachi, Ltd. 2016. All rights reserved.
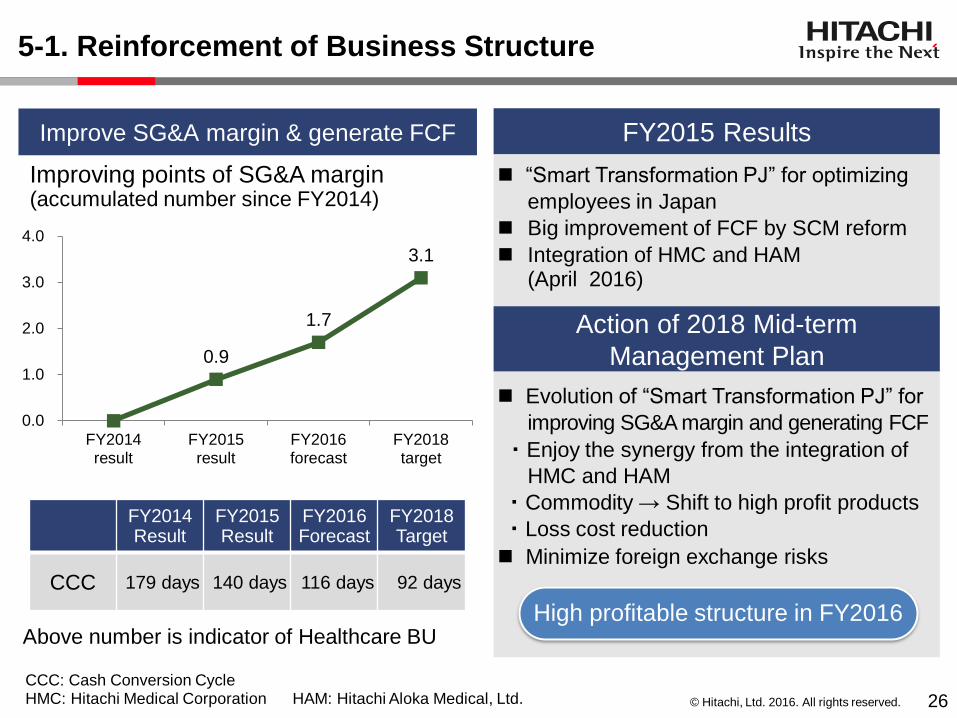
5-1. Reinforcement of Business Structure
Improve SG&A margin & generate FCF
FY2014 Result
FY2015 Result
FY2016 Forecast
FY2018 Target
CCC 179 days 140 days 116 days 92 days
FY2015 Results
“Smart Transformation PJ” for optimizing
employees in Japan
Big improvement of FCF by SCM reform
Integration of HMC and HAM (April 2016)
Action of 2018 Mid-term
Management Plan
Evolution of “Smart Transformation PJ” for
improving SG&A margin and generating FCF
・Enjoy the synergy from the integration of
HMC and HAM
・Commodity → Shift to high profit products
・Loss cost reduction
Minimize foreign exchange risks
High profitable structure in FY2016 Above number is indicator of Healthcare BU
0.9
1.7
3.1
0.0
1.0
2.0
3.0
4.0
FY2014result
FY2015result
FY2016forecast
FY2018target
Improving points of SG&A margin (accumulated number since FY2014)
CCC: Cash Conversion Cycle
HMC: Hitachi Medical Corporation HAM: Hitachi Aloka Medical, Ltd. 26
© Hitachi, Ltd. 2016. All rights reserved.
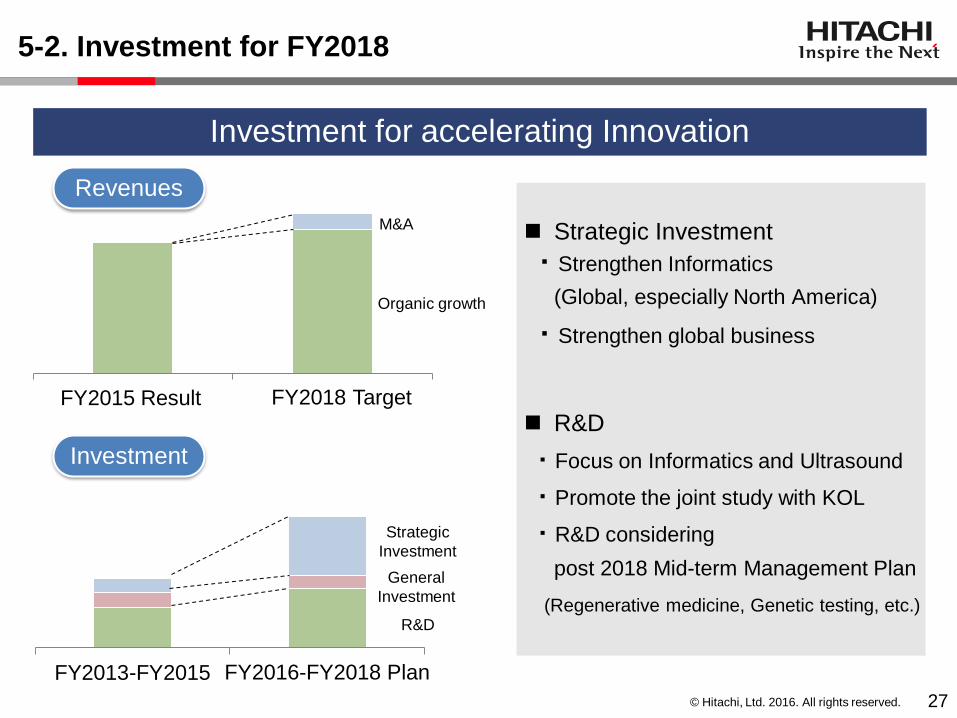
FY2015 FY2018
Organic growth
M&A
FY2013-FY2015 FY2016~FY2018
General
Investment
Strategic
Investment
R&D
FY2018 Target
FY2016-FY2018 Plan
Investment for accelerating Innovation
Revenues
Investment
5-2. Investment for FY2018
27
FY2015 Result
Strategic Investment
・Strengthen Informatics
(Global, especially North America)
・Strengthen global business
R&D
・Focus on Informatics and Ultrasound
・Promote the joint study with KOL
・R&D considering
post 2018 Mid-term Management Plan
(Regenerative medicine, Genetic testing, etc.)
© Hitachi, Ltd. 2016. All rights reserved.
ヘルスケア事業戦略
[Contents]
1. Review of FY2015
2. Business Overview and Overall Strategies
3. Innovation and Collaborative Creation for New Growth
4. Change of Portfolio and Main Business
5. Reinforcement of Business Structure and Investment
6. Conclusion
Healthcare Business Strategy
© Hitachi, Ltd. 2016. All rights reserved.
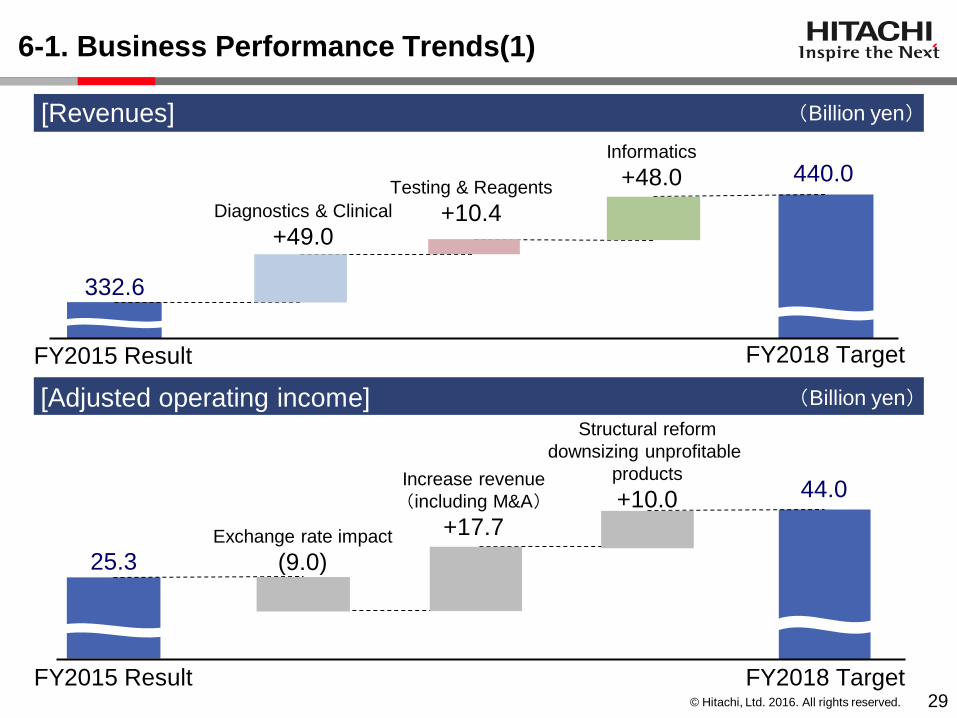
6-1. Business Performance Trends(1)
FY2015 Result
332.6
440.0
[Revenues] (Billion yen)
[Adjusted operating income] (Billion yen)
FY2018 Target
FY2015 Result
25.3
44.0
FY2018 Target
Diagnostics & Clinical
+49.0
Testing & Reagents
+10.4
Informatics
+48.0
Exchange rate impact
(9.0)
Structural reform
downsizing unprofitable
products
+10.0 Increase revenue
(including M&A)
+17.7
29
© Hitachi, Ltd. 2016. All rights reserved.
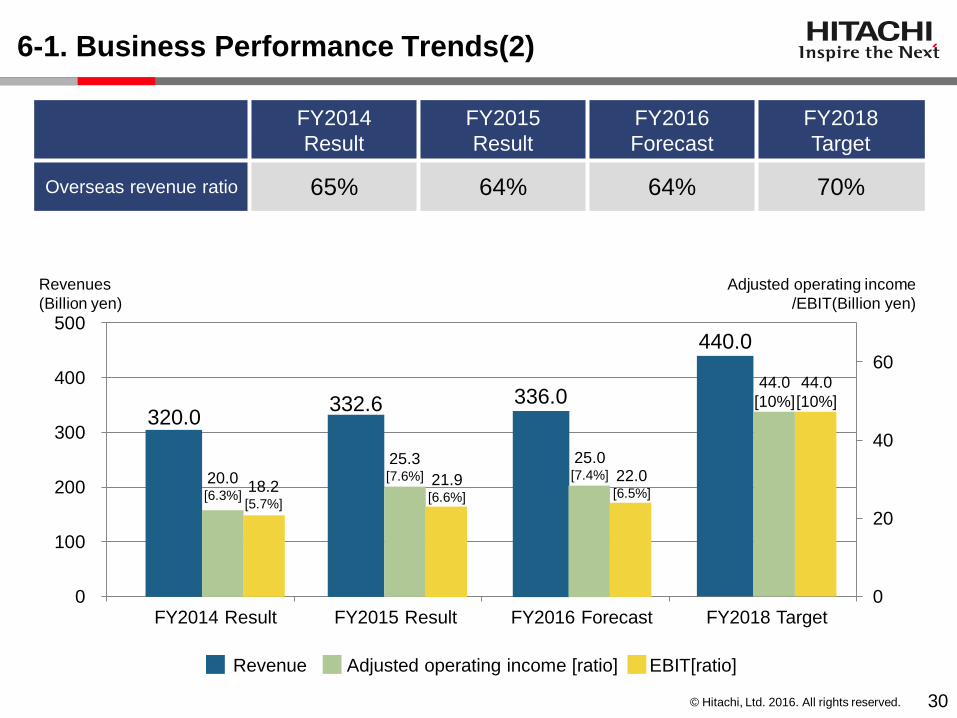
FY2014
Result
FY2015
Result
FY2016
Forecast
FY2018
Target
Overseas revenue ratio 65% 64% 64% 70%
6-1. Business Performance Trends(2)
0
20
40
60
0
100
200
300
400
500
FY2014 Result
FY2015 Result
FY2016 Forecast
FY2018 Target
Revenues
(Billion yen)
Adjusted operating income
/EBIT(Billion yen)
332.6
440.0
25.3 [7.6%] 21.9
[6.6%]
44.0
[10%]
44.0
[10%] 320.0
20.0 [6.3%]
18.2 [5.7%]
336.0
25.0 [7.4%] 22.0
[6.5%]
Revenue Adjusted operating income [ratio] EBIT[ratio]
30
FY2014 Result FY2015 Result FY2016 Forecast FY2018 Target
© Hitachi, Ltd. 2016. All rights reserved.
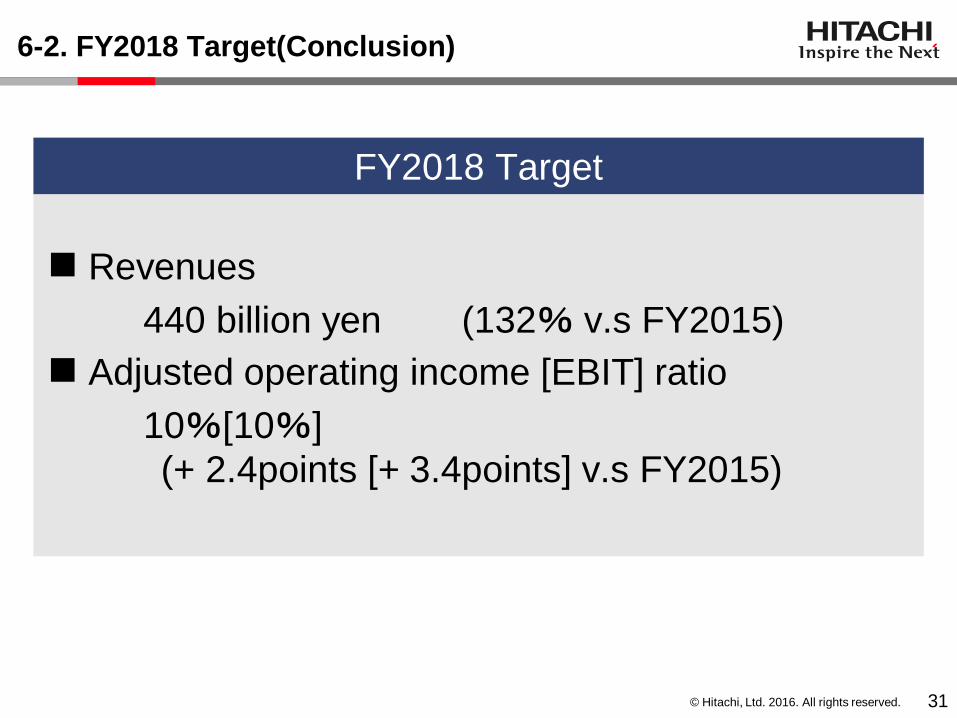
6-2. FY2018 Target(Conclusion)
Revenues
440 billion yen (132% v.s FY2015)
Adjusted operating income [EBIT] ratio
10%[10%]
(+ 2.4points [+ 3.4points] v.s FY2015)
FY2018 Target
31
© Hitachi, Ltd. 2016. All rights reserved.
Cautionary Statement
32
Certain statements found in this document may constitute “forward-looking statements” as defined in the U.S. Private Securities Litigation Reform Act of 1995. Such “forward-looking
statements” reflect management’s current views with respect to certain future events and financial performance and include any statement that does not directly relate to any historical or
current fact. Words such as “anticipate,” “believe,” “expect,” “estimate,” “forecast,” “intend,” “plan,” “project” and similar expressions which indicate future events and trends may identify
“forward-looking statements.” Such statements are based on currently available information and are subject to various risks and uncertainties that could cause actual results to differ materially
from those projected or implied in the “forward-looking statements” and from historical trends. Certain “forward-looking statements” are based upon current assumptions of future events which
may not prove to be accurate. Undue reliance should not be placed on “forward-looking statements,” as such statements speak only as of the date of this document.
Factors that could cause actual results to differ materially from those projected or implied in any “forward-looking statement” and from historical trends include, but are not limited to:
economic conditions, including consumer spending and plant and equipment investment in Hitachi’s major markets, particularly Japan, Asia, the United States and Europe, as well as levels
of demand in the major industrial sectors Hitachi serves, including, without limitation, the information, electronics, automotive, construction and financial sectors;
exchange rate fluctuations of the yen against other currencies in which Hitachi makes significant sales or in which Hitachi’s assets and liabilities are denominated, particularly against the
U.S. dollar and the euro;
uncertainty as to Hitachi’s ability to access, or access on favorable terms, liquidity or long-term financing;
uncertainty as to general market price levels for equity securities, declines in which may require Hitachi to write down equity securities that it holds;
uncertainty as to Hitachi’s ability to continue to develop and market products that incorporate new technologies on a timely and cost-effective basis and to achieve market acceptance for
such products;
the possibility of cost fluctuations during the lifetime of, or cancellation of, long-term contracts for which Hitachi uses the percentage-of-completion method to recognize revenue from sales;
credit conditions of Hitachi’s customers and suppliers;
fluctuations in the price of raw materials including, without limitation, petroleum and other materials, such as copper, steel, aluminum, synthetic resins, rare metals and rare-earth minerals, or
shortages of materials, parts and components;
fluctuations in product demand and industry capacity;
uncertainty as to Hitachi’s ability to implement measures to reduce the potential negative impact of fluctuations in product demand, exchange rates and/or price of raw materials or shortages
of materials, parts and components;
increased commoditization of and intensifying price competition for products;
uncertainty as to Hitachi’s ability to achieve the anticipated benefits of its strategy to strengthen its Social Innovation Business;
uncertainty as to the success of acquisitions of other companies, joint ventures and strategic alliances and the possibility of incurring related expenses;
uncertainty as to the success of restructuring efforts to improve management efficiency by divesting or otherwise exiting underperforming businesses and to strengthen competitiveness;
uncertainty as to the success of cost reduction measures;
general socioeconomic and political conditions and the regulatory and trade environment of countries where Hitachi conducts business, particularly Japan, Asia, the United States and
Europe, including, without limitation, direct or indirect restrictions by other nations on imports and differences in commercial and business customs including, without limitation, contract terms
and conditions and labor relations;
uncertainty as to the success of alliances upon which Hitachi depends, some of which Hitachi may not control, with other corporations in the design and development of certain key products;
uncertainty as to Hitachi’s access to, or ability to protect, certain intellectual property rights, particularly those related to electronics and data processing technologies;
uncertainty as to the outcome of litigation, regulatory investigations and other legal proceedings of which the Company, its subsidiaries or its equity-method associates and joint ventures
have become or may become parties;
the possibility of incurring expenses resulting from any defects in products or services of Hitachi;
the potential for significant losses on Hitachi’s investments in equity-method associates and joint ventures;
the possibility of disruption of Hitachi’s operations by natural disasters such as earthquakes and tsunamis, the spread of infectious diseases, and geopolitical and social instability such as
terrorism and conflict;
uncertainty as to Hitachi’s ability to maintain the integrity of its information systems, as well as Hitachi’s ability to protect its confidential information or that of its customers;
uncertainty as to the accuracy of key assumptions Hitachi uses to evaluate its significant employee benefit-related costs; and
uncertainty as to Hitachi’s ability to attract and retain skilled personnel.
The factors listed above are not all-inclusive and are in addition to other factors contained in other materials published by Hitachi.
© Hitachi, Ltd. 2016. All rights reserved.