Health at-glance-2015-berlin-event-how-germany-compares
26
HEALTH AT A GLANCE 2015 Berlin, 2. November 2015 Wo steht Deutschland?
-
Upload
oecd-directorate-for-employment-labour-and-social-affairs -
Category
Health & Medicine
-
view
441 -
download
0
Transcript of Health at-glance-2015-berlin-event-how-germany-compares

HEALTH AT A GLANCE 2015
Berlin, 2. November 2015
Wo steht Deutschland?
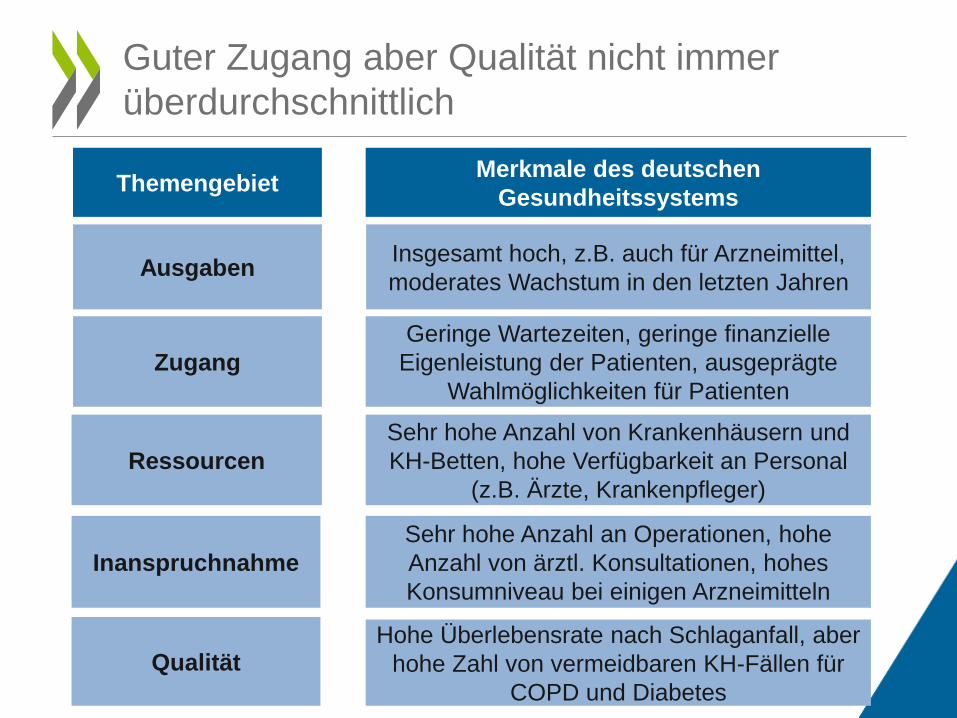
Guter Zugang aber Qualität nicht immer
überdurchschnittlich
Themengebiet Merkmale des deutschen
Gesundheitssystems
Zugang
Ressourcen
Inanspruchnahme
Qualität
Geringe Wartezeiten, geringe finanzielle
Eigenleistung der Patienten, ausgeprägte
Wahlmöglichkeiten für Patienten
Sehr hohe Anzahl von Krankenhäusern und
KH-Betten, hohe Verfügbarkeit an Personal
(z.B. Ärzte, Krankenpfleger)
Sehr hohe Anzahl an Operationen, hohe
Anzahl von ärztl. Konsultationen, hohes
Konsumniveau bei einigen Arzneimitteln
Hohe Überlebensrate nach Schlaganfall, aber
hohe Zahl von vermeidbaren KH-Fällen für
COPD und Diabetes
Ausgaben Insgesamt hoch, z.B. auch für Arzneimittel,
moderates Wachstum in den letzten Jahren

INSGESAMT GUTE HEALTH OUTCOMES ABER
ERFOLGE IN GEFAHR
4
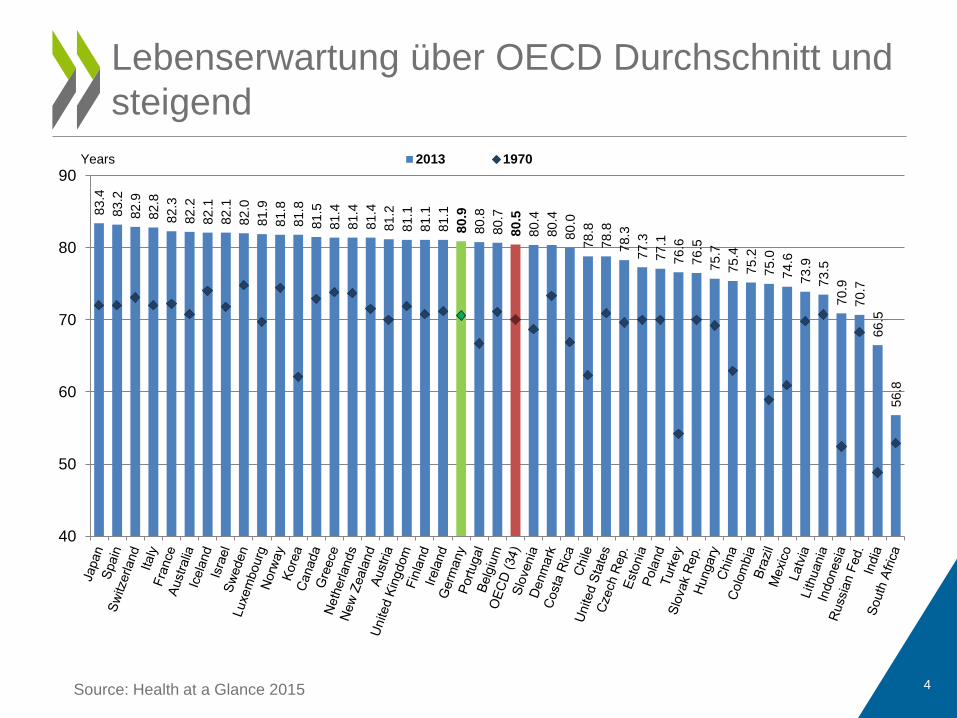
Lebenserwartung über OECD Durchschnitt und
steigend 83.4
83.2
82.9
82.8
82.3
82.2
82.1
82.1
82.0
81.9
81.8
81.8
81.5
81.4
81.4
81.4
81.2
81.1
81.1
81.1
80.9
80.8
80.7
80.5
80.4
80.4
80.0
78.8
78.8
78.3
77.3
77.1
76.6
76.5
75.7
75.4
75.2
75.0
74.6
73.9
73.5
70.9
70.7
66.5
56.8
40
50
60
70
80
90Years 2013 1970
Source: Health at a Glance 2015
5
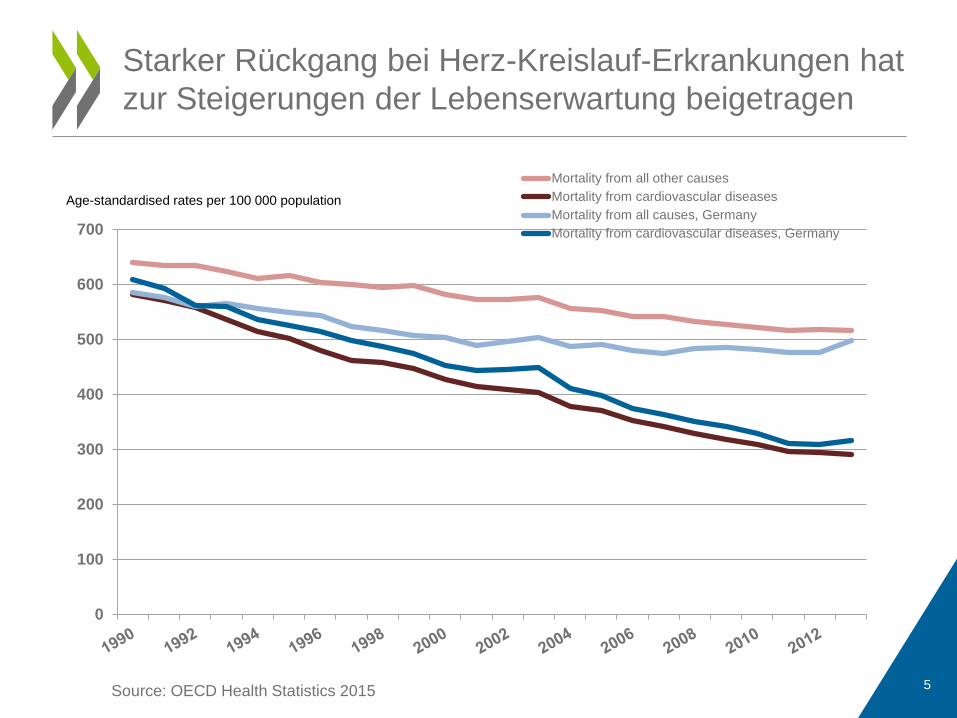
Starker Rückgang bei Herz-Kreislauf-Erkrankungen hat
zur Steigerungen der Lebenserwartung beigetragen
Source: OECD Health Statistics 2015
0
100
200
300
400
500
600
700
Mortality from all other causes
Mortality from cardiovascular diseases
Mortality from all causes, Germany
Mortality from cardiovascular diseases, Germany
Age-standardised rates per 100 000 population

6
Aber Anstieg bei Adipositas gefährdet erreichte
Erfolge
Source: Health at a Glance 2015
3 3
8 9
8
9
9
9
12
10
9
13
13
11
13
15
14
14
12
16
20
23
21
25
22
20
25
24
31
4 5
10
10
10
11
12
12
14
14
15
15
16
16
17
18
19
21
22
23
24
25
25
25
26
28
31
32
35
0
10
20
30
40
2000 2013% of population aged 15 years and over

7
Alterung der Bevölkerung und Zunahme von Demenz stellt Gesundheits- und Pflegesystem vor Herausforderungen
Source: Health at a Glance 2015
0
5
10
15
20
25
30
35
40
Per 1 000 population 2015 2035
Estimated prevalence of dementia per 1 000 population, 2015 and 2035

PRIMÄRER GESUNDHEITSSEKTOR
SOLLTE GESTÄRKT WERDEN
9
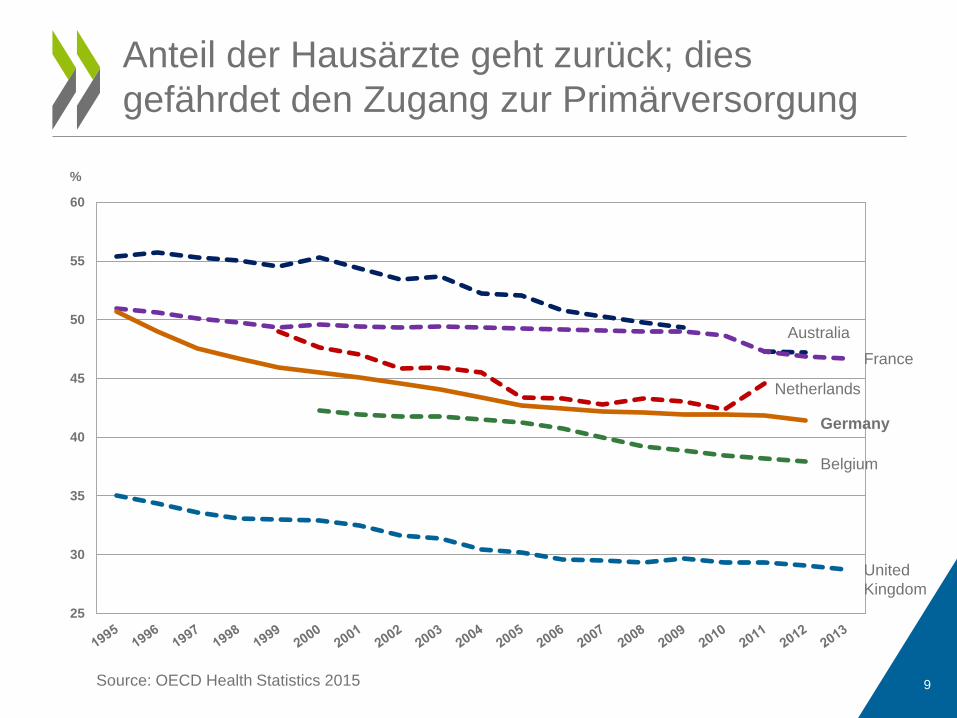
Anteil der Hausärzte geht zurück; dies
gefährdet den Zugang zur Primärversorgung
25
30
35
40
45
50
55
60
%
Source: OECD Health Statistics 2015
France
United
Kingdom
Belgium
Germany
Netherlands
Australia
10
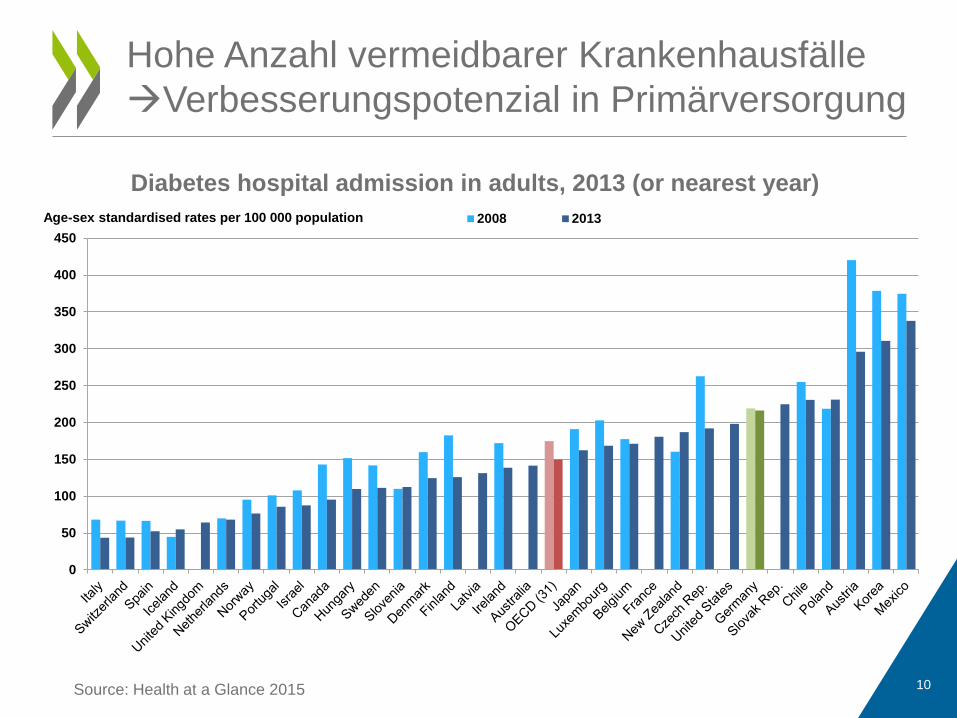
Hohe Anzahl vermeidbarer Krankenhausfälle
Verbesserungspotenzial in Primärversorgung
Diabetes hospital admission in adults, 2013 (or nearest year)
0
50
100
150
200
250
300
350
400
450
2008 2013Age-sex standardised rates per 100 000 population
Source: Health at a Glance 2015

11
Verfügbarkeit von KH-Betten geht zurück aber
noch immer auf hohem Niveau 13.3
11.0
9.1
8.3
7.7
7.3
7.0
6.6
6.5
6.3
6.3
5.8
5.8
5.1
5.0
4.9
4.8
4.8
4.7
4.6
3.9
3.8
3.4
3.4
3.3
3.2
3.1
3.1
3.0
2.9
2.8
2.8
2.8
2.7
2.7
2.6
2.3
2.3
2.2
1.6
1.5
1.0
0.5
0
3
6
9
12
15
2000 2013Per 1 000 population
Hospital beds per 1 000 population
Source: Health at a Glance 2015

12
Sehr hohe Krankenhausaktivität… 266
252
235
213
204
202
199
196
182
175
173
173
172
172
171
170
167
166
166
163
162
161
159
155
146
141
140
139
135
129
125
124
119
113
111
99
95
83
56
53
48
34
0
50
100
150
200
250
300
Per 1 000 population
Hospital discharges
Source: Health at a Glance 2015

13
…vor allem bei elektiven Eingriffen…
…aber erstmaliger
Rückgang in 2013
292 283
276 246 243 242 238 236
227 216 216
204 185 183
171 170 166 161 161
152 150
137 136
127 112 107 105
88 85
63 44
33 20
8
0 100 200 300 400
SwitzerlandGermany
AustriaBelgiumNorwayFinland
SwedenFrance
DenmarkNetherlandsLuxembourg
United StatesIceland
United KingdomAustralia
Czech Rep.Italy
OECD33Slovenia
GreeceNew Zealand
HungaryCanadaIreland
EstoniaSpain
Slovak Rep.Portugal
PolandIsrael
TurkeyChile
KoreaMexico
Per 100 000 population
100
150
200
250
300
350
2000 2002 2004 2006 2008 2010 2012
France Germany Italy
United States OECD33
Per 100 000 population
Hip replacement surgery, 2013
Source: Health at a Glance 2015

HERAUSFORDERUNGEN BEIM
GESUNDHEITSPERSONAL

Deutsche Ärzte sind relativ alt…
Share of doctors aged 55 years and over, 2000 and 2013 (or nearest year)
13 15
21
25 25 26 26 26 26 27 27 28
33 33 33 33 34 34 34 36
37 38 40
41 42
43 44 45
49 49
0
10
20
30
40
502013 2000
%
Source: Health at a Glance 2015

Ausländische Ärzte spielen eine zunehmende
Rolle um Personalbedarf zu decken
0
2 000
4 000
6 000
8 000
10 000
12 000
2000 2001 2002 2003 2004 2005 2006 2007 2008 2009 2010 2011 2012 2013
DOCTORS Domestic graduates Foreign doctors
Annual inflow of new doctors
Source: Health at a Glance 2015
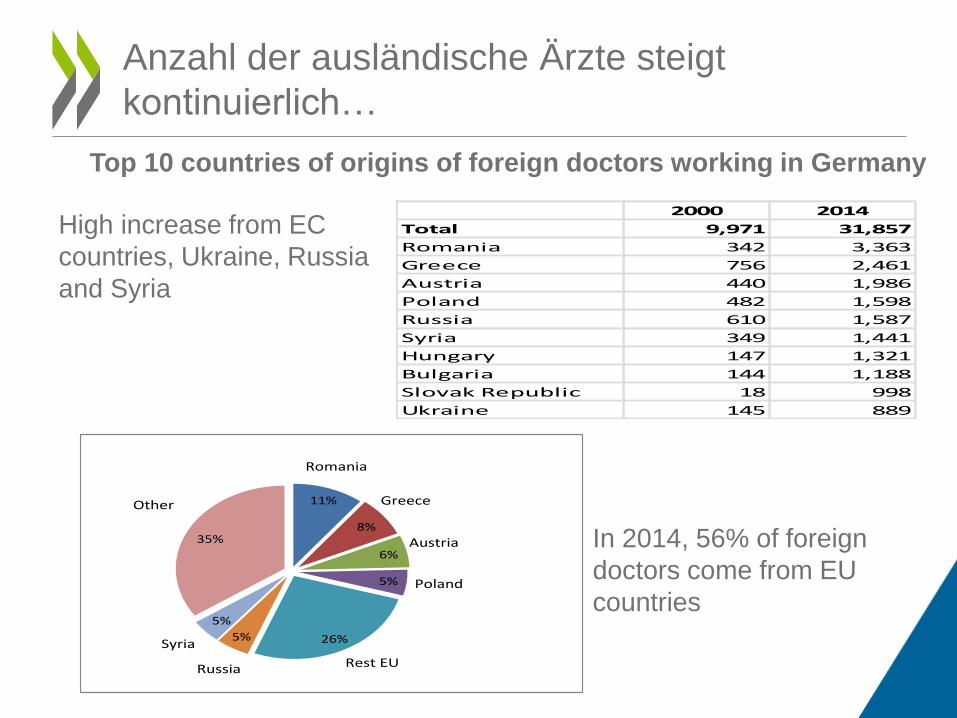
Anzahl der ausländische Ärzte steigt
kontinuierlich…
In 2014, 56% of foreign
doctors come from EU
countries
High increase from EC
countries, Ukraine, Russia
and Syria
11%
8%
6%
5%
26%5%
5%
35%
Romania
Greece
Austria
Rest EU
Poland
Other
Russia
Syria
2000 2014
Total 9,971 31,857
Romania 342 3,363
Greece 756 2,461
Austria 440 1,986
Poland 482 1,598
Russia 610 1,587
Syria 349 1,441
Hungary 147 1,321
Bulgaria 144 1,188
Slovak Republic 18 998
Ukraine 145 889
Top 10 countries of origins of foreign doctors working in Germany

…aber ihr Anteil ist immer noch geringer als in
anderen OECD Staaten 5
8.5
43.5
35.8
34.2
30.5
28.7
27.0
25.0
24.3
23.5
19.9
17.3
15.2
14.4
10.7
9.4
9.2
8.8
7.6
5.6
4.4
3.0
2.7
2.6
2.4
1.8
0.2
0
10
20
30
40
50
60
%
Share of foreign-trained doctors in OECD countries, 2013
In 2014, share for Germany increased to 9.5%
1. In Germany and Spain the data is based on nationality, not the place of training Source: Health at a Glance 2015

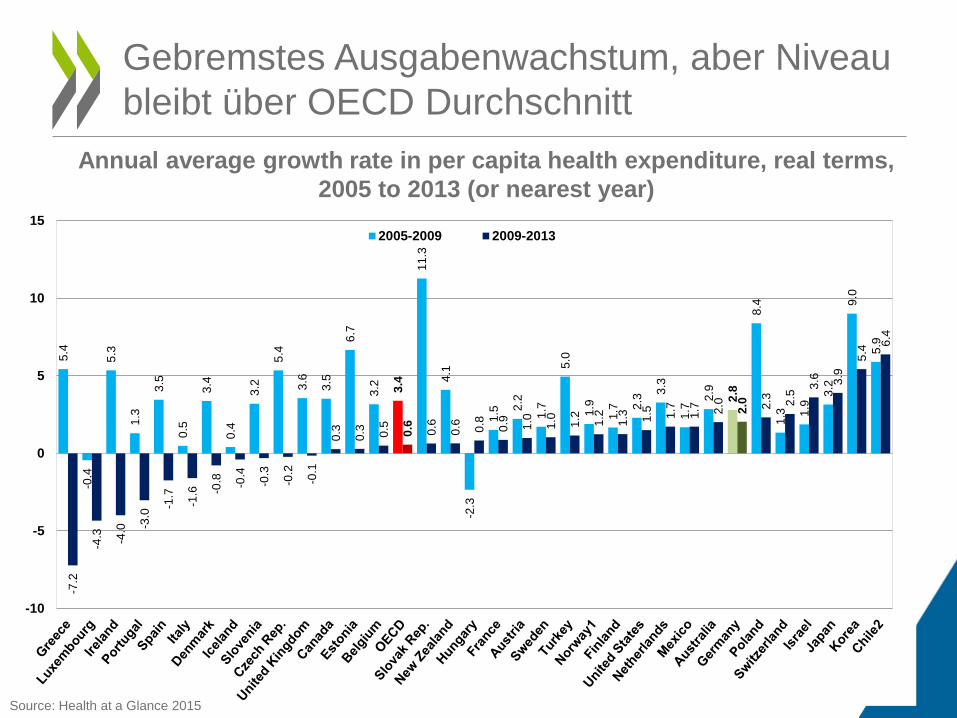
TROTZ GEBREMSTEM WACHSTUM HOHES
AUSGABENNIVEAU, VOR ALLEM BEI ARZNEIMITTELN
20
Gebremstes Ausgabenwachstum, aber Niveau
bleibt über OECD Durchschnitt
Annual average growth rate in per capita health expenditure, real terms,
2005 to 2013 (or nearest year)
5.4
-0.4
5.3
1.3
3.5
0.5
3.4
0.4
3.2
5.4
3.6
3.5
6.7
3.2
3.4
11
.3
4.1
-2.3
1.5
2.2
1.7
5.0
1.9
1.7
2.3
3.3
1.7
2.9
2.8
8.4
1.3
1.9
3.2
9.0
5.9
-7.2
-4.3
-4.0
-3.0
-1.7
-1.6
-0.8
-0.4
-0.3
-0.2
-0.1
0.3
0.3
0.5
0.6
0.6
0.6
0.8
0.9
1.0
1.0
1.2
1.2
1.3
1.5
1.7
1.7
2.0
2.0
2.3
2.5
3.6
3.9
5.4
6.4
-10
-5
0
5
10
152005-2009 2009-2013
Source: Health at a Glance 2015
21
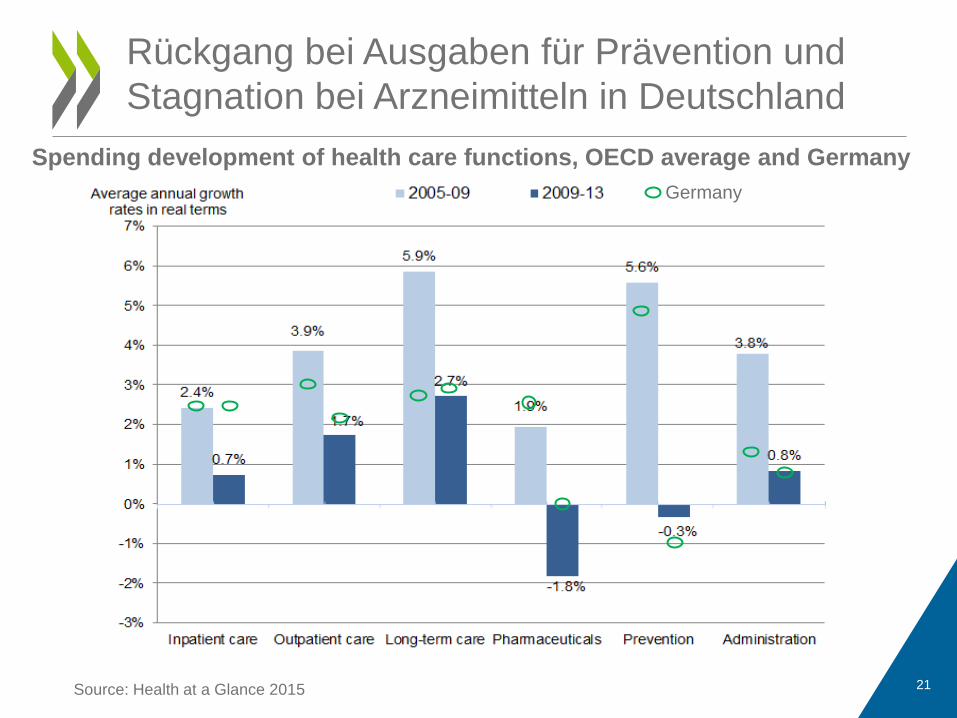
Spending development of health care functions, OECD average and Germany
Rückgang bei Ausgaben für Prävention und
Stagnation bei Arzneimitteln in Deutschland
Germany
Source: Health at a Glance 2015

Verstärkter Gebrauch von Generika hat
Arzneimittelkosten gebremst…
Share of generics in the total pharmaceutical market, 2013
28
33
59
37 34
41
29
16
37
14
46
24 21
24
17 17 19
23
17 14
16 16
11 15
11
16
4
84 83 80 80
77
72 70 70
55 54 50
48 47 46 45
40 40 39 35
32 30 29 28
20 19 17
8
0
30
60
90Value Volume%
1. Reimbursed pharmaceutical market
Source: Health at a Glance 2015

..aber Ausgaben für Arzneimittel bleiben auf
hohem Niveau… 1
02
6
75
2
72
1
71
3
67
8
66
6
65
2
60
3
59
6
59
0
57
2
53
6
53
3
52
6
51
5
50
3
48
1
45
9
45
9
43
6
39
7
39
6
39
2
38
1
36
7
36
4
32
6
28
7
27
3
24
0
0
200
400
600
800
1000
1200
USD PPP Prescribed medicines Over-the-counter medicines Total (no breakdown)
Expenditure on pharmaceuticals per capita
Source: Health at a Glance 2015
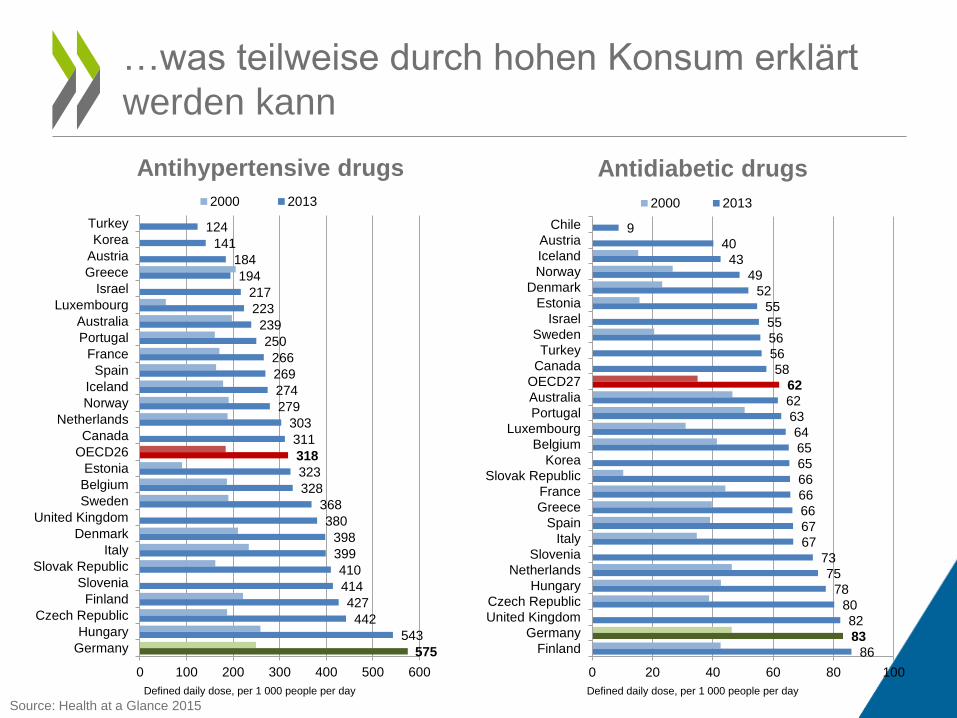
…was teilweise durch hohen Konsum erklärt
werden kann
9
40
43
49
52
55
55
56
56
58
62
62
63
64
65
65
66
66
66
67
67
73
75
78
80
82
83
86
0 20 40 60 80 100
Chile
Austria
Iceland
Norway
Denmark
Estonia
Israel
Sweden
Turkey
Canada
OECD27
Australia
Portugal
Luxembourg
Belgium
Korea
Slovak Republic
France
Greece
Spain
Italy
Slovenia
Netherlands
Hungary
Czech Republic
United Kingdom
Germany
Finland
Defined daily dose, per 1 000 people per day
2000 2013
124
141
184
194
217
223
239
250
266
269
274
279
303
311
318
323
328
368
380
398
399
410
414
427
442
543
575
0 100 200 300 400 500 600
Turkey
Korea
Austria
Greece
Israel
Luxembourg
Australia
Portugal
France
Spain
Iceland
Norway
Netherlands
Canada
OECD26
Estonia
Belgium
Sweden
United Kingdom
Denmark
Italy
Slovak Republic
Slovenia
Finland
Czech Republic
Hungary
Germany
Defined daily dose, per 1 000 people per day
2000 2013
Antihypertensive drugs Antidiabetic drugs
Source: Health at a Glance 2015

Moderater Konsum von Antidepressiva
aber starker Anstieg in letzten Jahren
Antidepressants
13 20 21
28 35 35
42 43 43 44
49 50
53 53 54 56 58 59
65 69 72 73
80 82 84 85 88
96
0 20 40 60 80 100
ChileKorea
EstoniaHungary
TurkeySlovak Republic
IsraelItaly
NetherlandsGreece
Czech RepublicFrance
GermanySlovenia
LuxembourgNorway
OECD28Austria
SpainFinland
BelgiumNew Zealand
DenmarkUnited Kingdom
SwedenCanadaPortugalAustralia
Iceland
Defined daily dose, per 1 000 people per day
2000 2013
118 0
10
20
30
40
50
60
70
80
90
2000 2005 2010 2013
DDD
Germany Belgium
France Netherlands
United Kingdom
Source: Health at a Glance 2015

Read more about our work Follow us on Twitter: @OECD_Social
Website: www.oecd.org/health
Newsletter: http://www.oecd.org/health/update
Thank you
http://www.oecd.org/health/health-at-a-glance.htm