GIS Role and Use in the Hurricane Katrina -...
24
GIS Role and Use in the Hurricane Katrina (Final Draft) By Majid Al Jabr ID # 975680 For CRP 514 Introduction to GIS Term 061 Course Instructor: Dr. Baqer Al-Ramadan Date: Jan.24, 2007
Transcript of GIS Role and Use in the Hurricane Katrina -...
GIS Role and Use in the Hurricane Katrina
(Final Draft)
By
Majid Al Jabr ID # 975680
For
CRP 514 Introduction to GIS
Term 061
Course Instructor: Dr. Baqer Al-Ramadan
Date: Jan.24, 2007
1
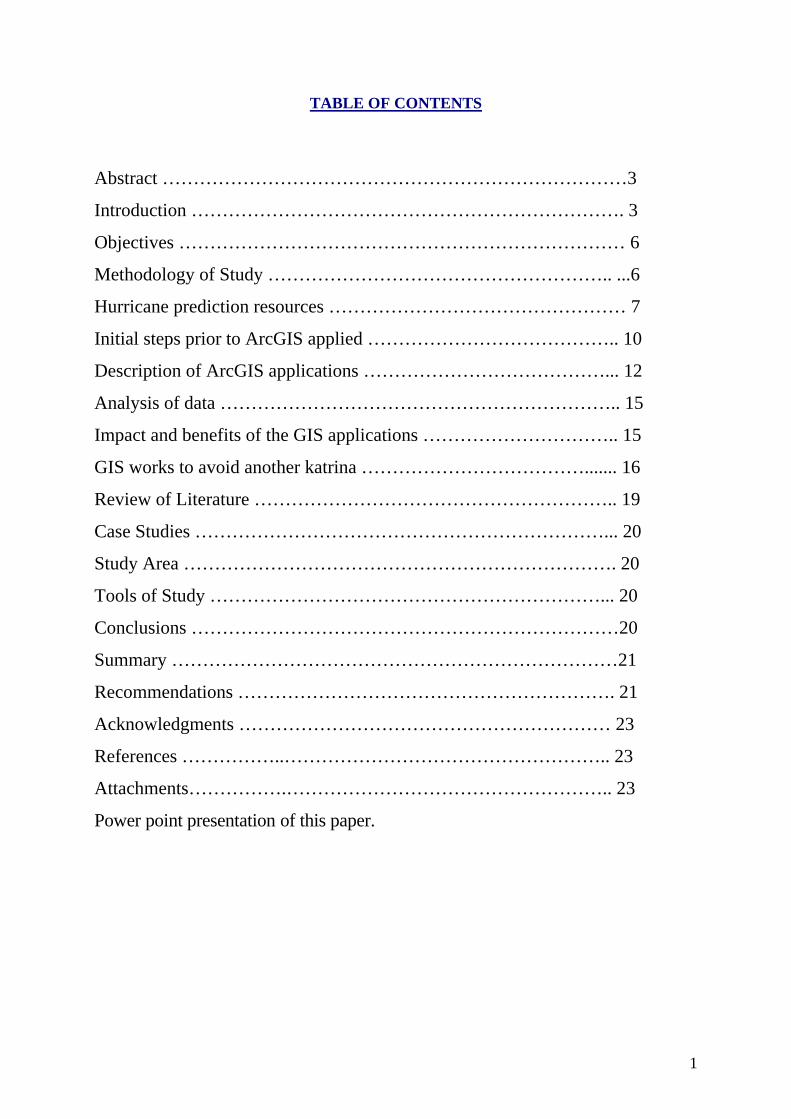
TABLE OF CONTENTS
Abstract …………………………………………………………………3
Introduction ……………………………………………………………. 3
Objectives ……………………………………………………………… 6
Methodology of Study ……………………………………………….. ...6
Hurricane prediction resources ………………………………………… 7
Initial steps prior to ArcGIS applied ………………………………….. 10
Description of ArcGIS applications …………………………………... 12
Analysis of data ……………………………………………………….. 15
Impact and benefits of the GIS applications ………………………….. 15
GIS works to avoid another katrina ………………………………....... 16
Review of Literature ………………………………………………….. 19
Case Studies …………………………………………………………... 20
Study Area ……………………………………………………………. 20
Tools of Study ………………………………………………………... 20
Conclusions ……………………………………………………………20
Summary ………………………………………………………………21
Recommendations ……………………………………………………. 21
Acknowledgments …………………………………………………… 23
References ……………..…………………………………………….. 23
Attachments…………….…………………………………………….. 23
Power point presentation of this paper.
2
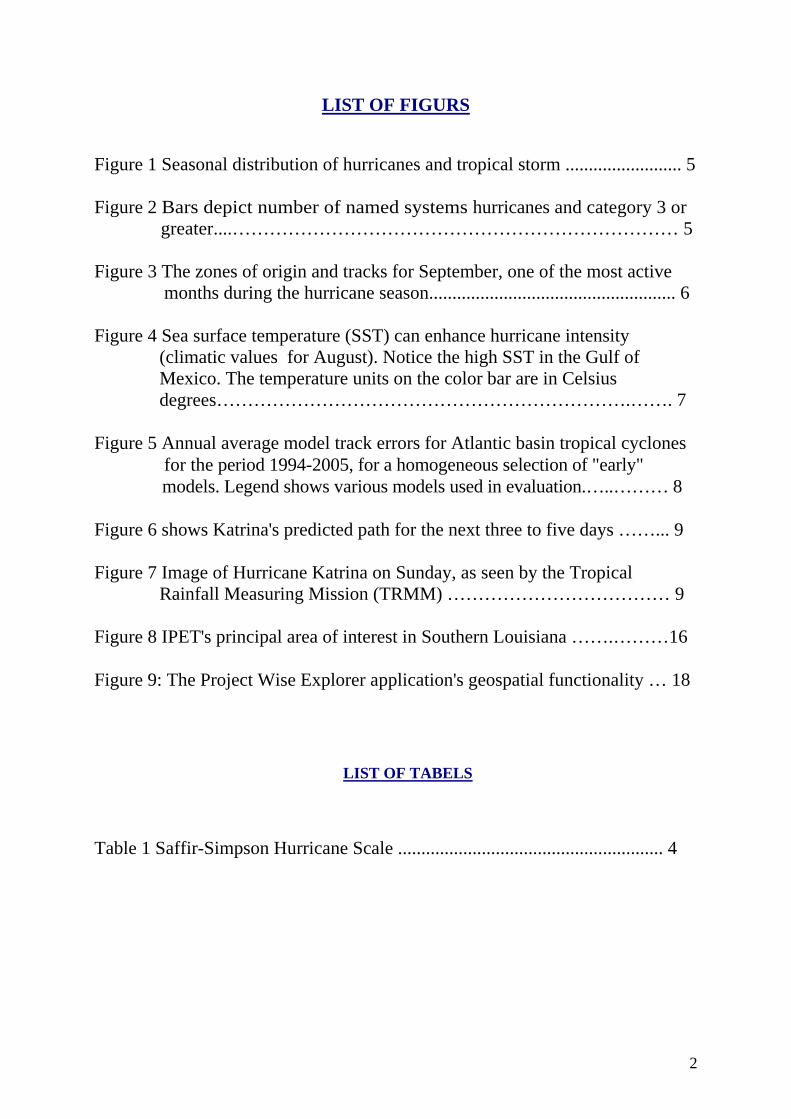
LIST OF FIGURS
Figure 1 Seasonal distribution of hurricanes and tropical storm ......................... 5 Figure 2 Bars depict number of named systems hurricanes and category 3 or greater....……………………………………………………………… 5 Figure 3 The zones of origin and tracks for September, one of the most active months during the hurricane season..................................................... 6 Figure 4 Sea surface temperature (SST) can enhance hurricane intensity (climatic values for August). Notice the high SST in the Gulf of Mexico. The temperature units on the color bar are in Celsius degrees………………………………………………………….……. 7
Figure 5 Annual average model track errors for Atlantic basin tropical cyclones for the period 1994-2005, for a homogeneous selection of "early" models. Legend shows various models used in evaluation.…..……… 8 Figure 6 shows Katrina's predicted path for the next three to five days ……... 9 Figure 7 Image of Hurricane Katrina on Sunday, as seen by the Tropical Rainfall Measuring Mission (TRMM) ……………………………… 9 Figure 8 IPET's principal area of interest in Southern Louisiana …….………16 Figure 9: The Project Wise Explorer application's geospatial functionality … 18
LIST OF TABELS
Table 1 Saffir-Simpson Hurricane Scale ......................................................... 4
3
AAbbssttrraacctt
ArcGIS has many applications in different fields. One of its used is to document evolution
of the devastating hurricane Katrina in New Orleans area in 2005. This term paper will
illustrate how GIS combined with other information analysis tools can process complex data
sets. Also impact and benefits of the GIS applications. How GIS works to avoid another
katrina
IInnttrroodduuccttiioonn
Geographic Information System (GIS) is defined as an information system that is used to
input, store, retrieve, manipulate, analyze and output geographically referenced data or
geospatial data, in order to support decision making for planning and management of land
use, natural resources, environment, transportation, urban facilities, and other administrative
records also it can be used in natural disaster for rescue purposes.
GIS can also be defined as a system of hardware, software, data, people, organization and
institutional arrangements for collecting, storing, analyzing, and disseminating information
about areas of the earth.
Hurricanes are the costliest natural disasters in the United States. Understanding both
hurricane frequencies and intensities is a topic of great interest to meteorologists, decision
makers and the general public alike.
A hurricane is a type of tropical cyclone. Tropical cyclones are classified as follows:
Tropical Depression (maximum sustained winds of 38 mph); Tropical Storm (maximum
sustained winds of 39-73 mph), and Hurricane (maximum sustained winds of 74 mph or
higher). Often the Saffir-Simpson Hurricane Scale shown in Table 1 is used to describe
hurricane category. For instance, a hurricane of Category 5 has winds 156 mph and up and, it
is expected to produce complete roof failure on many residences and industrial buildings.
Some complete buildings and small utility facilities can be destroyed. Flooding causes major
damage to lower floors of all structures near the shoreline. Massive evacuation of residential
areas is required.

4
Table 1: Saffir-Simpson Hurricane Scale
Hurricane Katrina was one of the deadliest hurricanes in American history. It was the
eleventh named storm, fifth hurricane, third major hurricane, and second Category 5 hurricane
of the 2005 Atlantic hurricane season, and was the sixth-strongest Atlantic hurricane ever
recorded. This paper presents a background in hurricane climatology, advances in hurricane
forecast, Katrina’s evolution and the impact in New Orleans area.
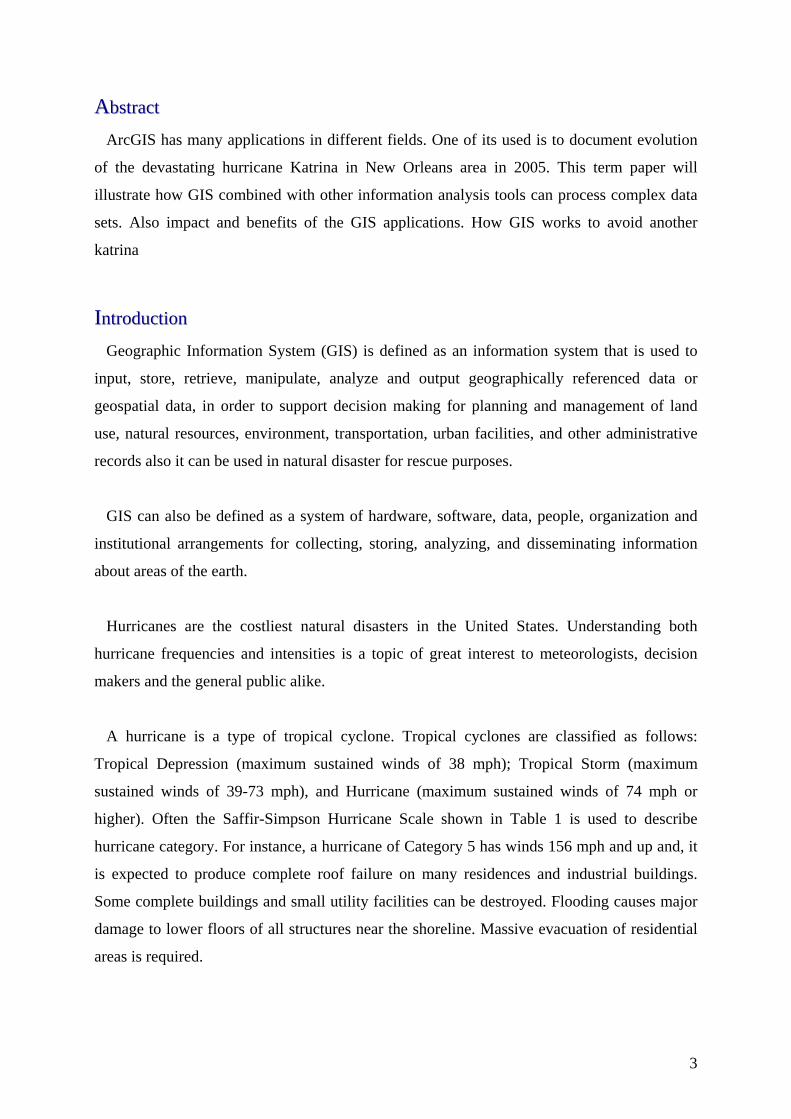
The hurricane season for the Atlantic Basin (the Atlantic Ocean, the Caribbean Sea, and the
Gulf of Mexico) lasts from 1 June to 30 November. The peak of the season is from mid-
August to late October, which correlates with the period of maximum sea surface temperature
(SST) over Atlantic Area where hurricanes are formed. However, deadly hurricanes can occur
anytime during the hurricane season (Figure 1). Hurricanes formation and their tracks depend
on the time of year and different areas of the country have high risk during different months.
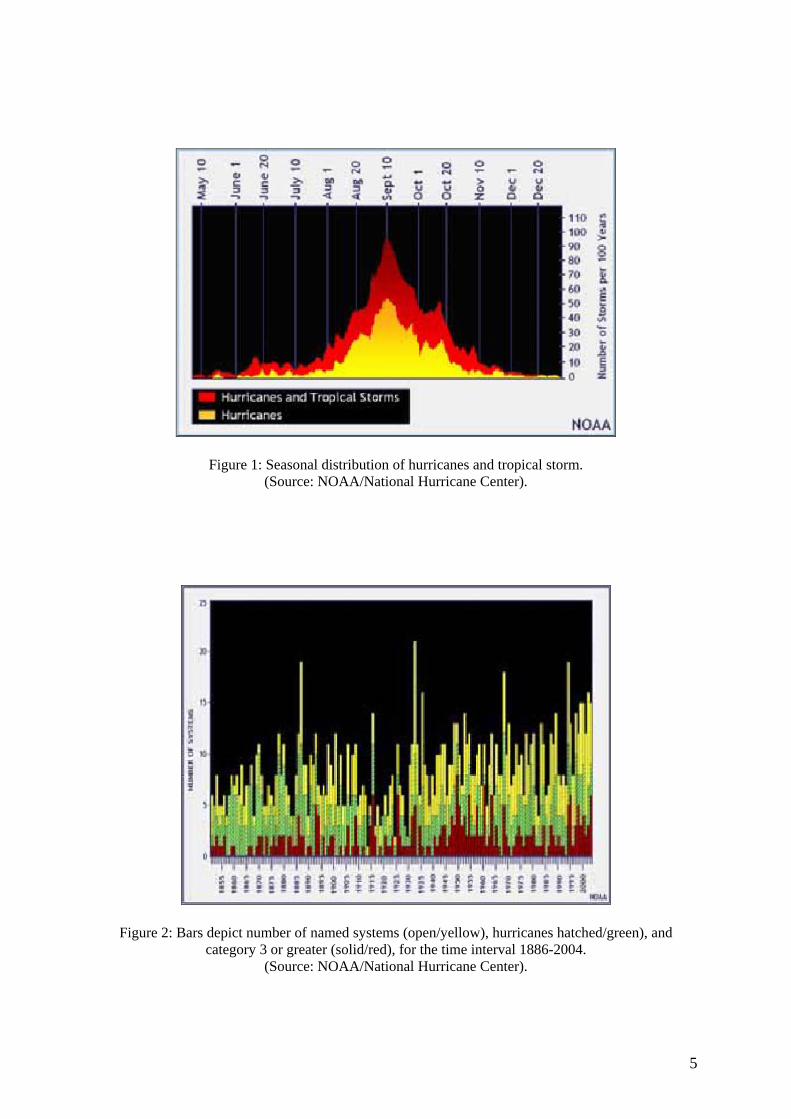
Track patterns can vary considerably from year to year, and this aspect remains difficult to
predict (Figures 2).
5
Figure 1: Seasonal distribution of hurricanes and tropical storm. (Source: NOAA/National Hurricane Center).
Figure 2: Bars depict number of named systems (open/yellow), hurricanes hatched/green), and category 3 or greater (solid/red), for the time interval 1886-2004.
(Source: NOAA/National Hurricane Center).

6
OObbjjeeccttiivveess
The objective of this term paper is to presents a background in hurricane climatology,
advances in hurricane forecast, Katrina’s evolution and the impact in New Orleans area.
Illustrate ArcGIS applications to analyze the demographic data in New Orleans and
determine factors that could contribute to difficulty in rapid and total evacuation of population
from the flooded area.
MMeetthhooddoollooggyy ooff SSttuuddyy
Research indicates that there is no strong correlation between storm activity early in the
hurricane season and activity in the rest of the period. Over many years, hurricanes have
cycles of greater and lesser activity and current models are showing progress in the ability to
forecast annual tropical storm and hurricane evolution. However, there are currently no
models to make long-range predictions of the specific locations where hurricanes might strike.
In this sense, for practical purposes, short term forecast (days) remains critical for predicting
the track and intensity, and for disaster management.
Figure 3 shows the zones of origin and tracks of hurricanes for the month of September. The
figure only depicts average conditions, and hurricanes can originate in different locations and
travel much different paths from the average.
Figure 3: The zones of origin and tracks for September, one of the most active months during the hurricane season. (Source: NOAA/National Hurricane Center).

7
Hurricanes form in areas of high sea surface temperature (SST) values, which are illustrated
below in Figure 4 for month August (climatic values, from the National Weather Service -
NWS). The correlation between variations of SST and hurricane formation is not simple, but
studies show that in 2005 there were positive anomalies of SST in Atlantic region coinciding
with very intense tropical storms activity. From Figure 5 we note that the highest SST values
are located in east tropical Pacific, and in fact, only 11% of the world’s tropical cyclones
develop in Atlantic.
Figure 4: Sea surface temperature (SST) can enhance hurricane intensity (climatic values for August).
Notice the high SST in the Gulf of Mexico. The temperature units on the color bar are in Celsius degrees. (Source: NWS Climate Prediction Center).
HHuurrrriiccaannee PPrreeddiiccttiioonn RReessoouurrcceess
The hurricane forecast is conducted by the National Ocean and Atmosphere
Administration (NOAA) National Hurricane Center -Tropical Prediction Center. In the same
time, significant research effort by NASA, NOAA, NCAR, universities, and other agencies is
focused on understanding the mechanism of hurricane formation and evolution. Satellite,
radar, aircraft, soundings, and surface data are used to monitor the development and
evolution of tropical cyclones and hurricanes. Such data is also used in numerical models to
forecast detailed evolution of the cyclone. Results from models and observations are used
operationally to inform the decision makers and the public. It have seen significant progress in
hurricane forecast in the last two decades, and the accuracy of hurricane parameters
(especially track and intensity) continues to improve with the advance in computer power
and observational systems (Figure5).

8
Due to natural volatility in tropical cyclone track characteristics, annual errors can vary
significantly from year to year. In some of the past 20 years the average forecast errors
have departed from the long-term trend line by as much as 50%. The number of storms each
year can also vary greatly, and climate numerical models are used to link this variability to
fundamental physical causes of the atmosphere – ocean global system. A series of
specialized tools have been produced to address the forecast, data analysis, and results
dissemination. The complexity of hurricane data combined with their impact on economical
and social factors provides an example where GIS is used in various aspects of data analysis
and disaster management.
Figure 5: Annual average model track errors for Atlantic basin tropical cyclones
for the period 1994-2005, for a homogeneous selection of "early" models. Legend shows various models used in evaluation. (Source: NOAA/National Hurricane Center).
Latest National Hurricane Center Update on Katrina for August 29, 2005: At 10 a.m. CDT
the center of Hurricane Katrina moved ashore near the Louisiana-Mississippi border. The
center of Hurricane Katrina was located near the mouth of the Pearl River about 35 miles
east-northeast of New Orleans, Louisiana and about 45 miles west-southwest of Biloxi,
Mississippi. Katrina is moving toward the north near 16 mph, and maximum sustained winds
are near 125 mph, with higher gusts. Katrina is now a Category Three hurricane. Coastal
storm surge flooding of 15 to 20 feet above normal tide levels along with large and dangerous
battering waves can be expected near and to the east of the center. Rainfall totals of 5 to 10
inches with isolated maximum amounts of 15 inches are possible along the path of Katrina
across the gulf coast and the Tennessee valley. A few tornadoes are possible over portions of
southern and eastern Mississippi, southern and central Alabama, and the western Florida
panhandle today. This information was derived from the National Hurricane Center website.
9
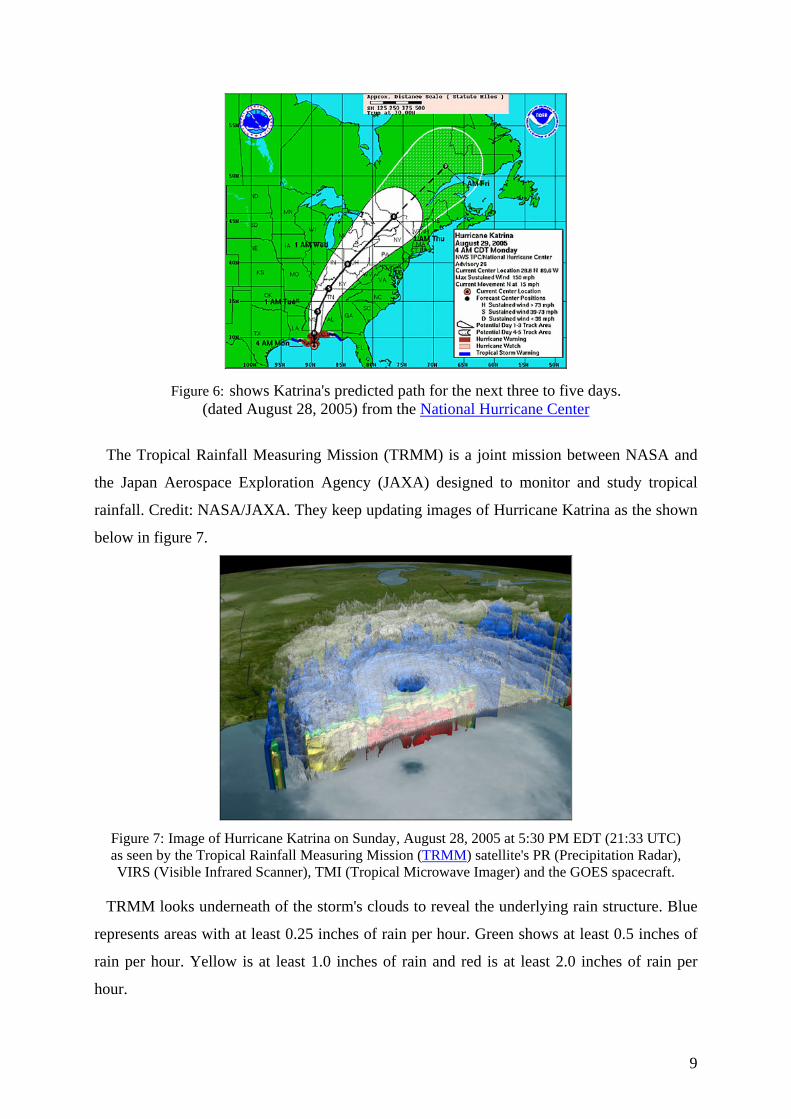
Figure 6: shows Katrina's predicted path for the next three to five days.
(dated August 28, 2005) from the National Hurricane Center
The Tropical Rainfall Measuring Mission (TRMM) is a joint mission between NASA and
the Japan Aerospace Exploration Agency (JAXA) designed to monitor and study tropical
rainfall. Credit: NASA/JAXA. They keep updating images of Hurricane Katrina as the shown
below in figure 7.
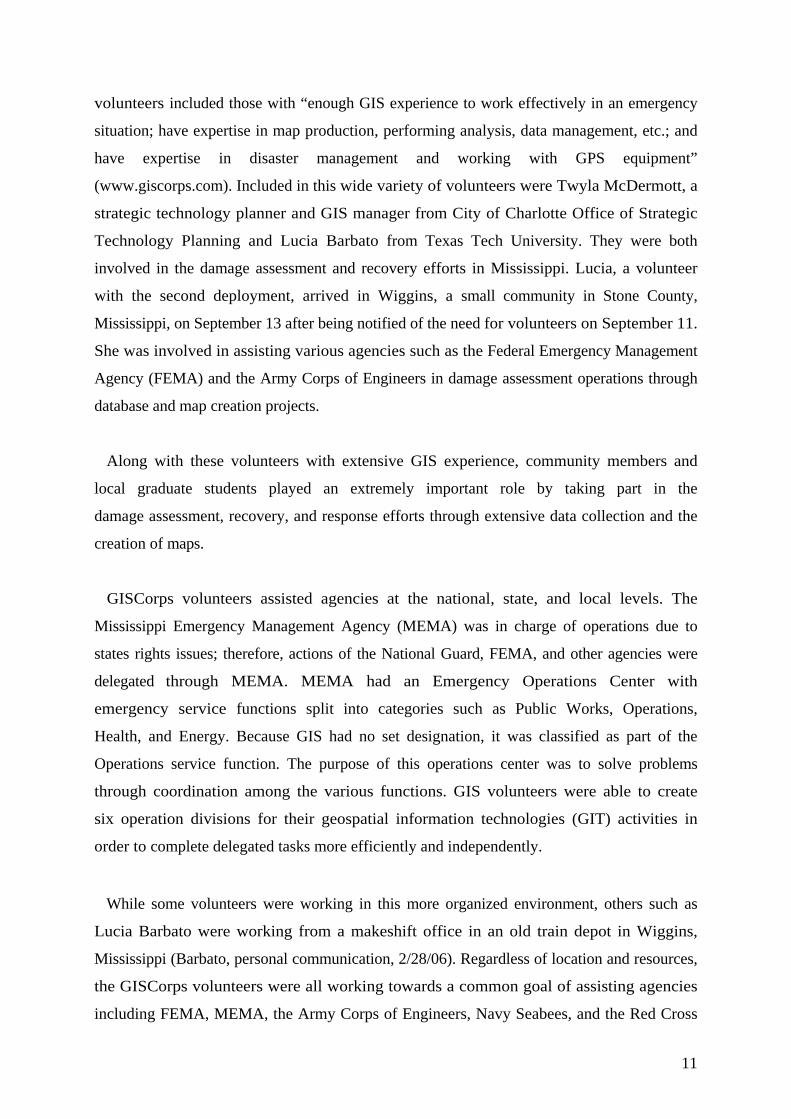
Figure 7: Image of Hurricane Katrina on Sunday, August 28, 2005 at 5:30 PM EDT (21:33 UTC) as seen by the Tropical Rainfall Measuring Mission (TRMM) satellite's PR (Precipitation Radar), VIRS (Visible Infrared Scanner), TMI (Tropical Microwave Imager) and the GOES spacecraft.
TRMM looks underneath of the storm's clouds to reveal the underlying rain structure. Blue
represents areas with at least 0.25 inches of rain per hour. Green shows at least 0.5 inches of
rain per hour. Yellow is at least 1.0 inches of rain and red is at least 2.0 inches of rain per
hour.

10
IInniittiiaall SStteeppss PPrriioorr ttoo AArrccGGIISS AApppplliieedd
On August 29, 2005, Hurricane Katrina ripped through the central Gulf Coast of the
United States leaving in its path a wave of despair and destruction. As the need for outside help
was apparent, groups such as GISCorps were solicited to provide various services to
the operations of recovery and damage assessment in Mississippi. GISCorps volunteers from
around the country rushed to the area in four waves to provide predominately their map-
making skills to the various agencies involved in the response and recovery effort. These maps
provided support to these efforts by allowing them to be carried out in a faster and more
efficient manner. Many lessons were learned from this experience, but most importantly, that
GIS is a valuable tool and the data needed to utilize GIS to its full potential should be
available and incorporated into disaster plans before a crisis occurs.
Founded in 2003, GISCorps, a subsidiary of the Urban and Regional Information
Systems Association (URISA), is a volunteer-based organization that provides short-term GIS
services to underprivileged communities around the world. The intention of GISCorps
volunteers is to implement “the URISA vision of advancing the use of geospatial
technologies with missions that provide GIS expertise for humanitarian relief, economic
development, sustainable development, indigenous capacity building, aboriginal rights, health
and education” .
After the hurricane hit, Talbot Brooks, a volunteer from the Center for Interdisciplinary
Geospatial Information Technologies program at Delta State University, called upon
GISCorps as a service provider. He contacted Shoreh Elhami, chair and co-founder of
GISCorps, to organize the immediate deployment of volunteers to assist with recovery
efforts. The GIS community was eager to assist with the operation and more than 500
volunteers filled out application forms to assist in the effort (www.giscorps.com).
Because they were called upon suddenly, the GISCorps volunteers were unaware of
what exact services were needed and consequently, each had very different experiences
based upon: the immediate needs in the various coastal counties of Mississippi; their role
in the response; duration of deployment; services provided; and location.
Many volunteers from around the country were deployed in four installments from
August 31, 2005, about a week after the storm hit, through September 26. Ideal
11
volunteers included those with “enough GIS experience to work effectively in an emergency
situation; have expertise in map production, performing analysis, data management, etc.; and
have expertise in disaster management and working with GPS equipment”
(www.giscorps.com). Included in this wide variety of volunteers were Twyla McDermott, a
strategic technology planner and GIS manager from City of Charlotte Office of Strategic
Technology Planning and Lucia Barbato from Texas Tech University. They were both
involved in the damage assessment and recovery efforts in Mississippi. Lucia, a volunteer
with the second deployment, arrived in Wiggins, a small community in Stone County,
Mississippi, on September 13 after being notified of the need for volunteers on September 11.
She was involved in assisting various agencies such as the Federal Emergency Management
Agency (FEMA) and the Army Corps of Engineers in damage assessment operations through
database and map creation projects.
Along with these volunteers with extensive GIS experience, community members and
local graduate students played an extremely important role by taking part in the
damage assessment, recovery, and response efforts through extensive data collection and the
creation of maps.
GISCorps volunteers assisted agencies at the national, state, and local levels. The
Mississippi Emergency Management Agency (MEMA) was in charge of operations due to
states rights issues; therefore, actions of the National Guard, FEMA, and other agencies were
delegated through MEMA. MEMA had an Emergency Operations Center with
emergency service functions split into categories such as Public Works, Operations,
Health, and Energy. Because GIS had no set designation, it was classified as part of the
Operations service function. The purpose of this operations center was to solve problems
through coordination among the various functions. GIS volunteers were able to create
six operation divisions for their geospatial information technologies (GIT) activities in
order to complete delegated tasks more efficiently and independently.
While some volunteers were working in this more organized environment, others such as
Lucia Barbato were working from a makeshift office in an old train depot in Wiggins,
Mississippi (Barbato, personal communication, 2/28/06). Regardless of location and resources,
the GISCorps volunteers were all working towards a common goal of assisting agencies
including FEMA, MEMA, the Army Corps of Engineers, Navy Seabees, and the Red Cross

12
to undertake their damage assessment and recovery operations more quickly and efficiently.
This was done by applying the tool of GIS through data development, map creation, and
technical support.
DDeessccrriippttiioonn ooff AArrccGGIISS AApppplliiccaattiioonn
Prior to landfall, several GIS applications were completed such as a HAZUS, a modeling
tool used to assess damages from natural hazards, as well as predicting storm surges and tree
fall. However, this was not done by GISCorps’ volunteers since they did not arrive until one
week after landfall. Rather, it was done by Talbot Brooks and some of his colleagues.
Because GISCorps arrived one week after Hurricane Katrina hit, they were not working on
GIS applications in the true sense of the term. That is to say, they did not create a specific
tool to meet a desired function. As mentioned earlier, they applied GIS tools, or geospatial
technologies, to do some relatively straightforward analysis and significant map
generation. Nevertheless, their contributions were extremely valuable.
When the volunteers first arrived, they were unsure of what to expect and ultimately, they
responded to what was needed in the moment. The Emergency Operations Center’s purpose
was to solve problems, to make operations happen, and to coordinate. When they became
aware of an issue, the representatives from each function would get together to solve that
problem. Because of the nature of this work, the purpose and role of the GIS applications
was very fluid and dynamic. Therefore, the GISCorps focused on both immediate post-
disaster work as well as recovery applications.
In many of these applications, they used Core ArcGIS, specifically spatial analyst and
they also did extensive geocoding. The breadth of the applications was extensive. For
example, they assisted with the translation of street addresses to latitude/longitude and the
mapping of these grids for search and rescue operations. They also looked at population
density and prioritized search grids. They created a missing-persons database and provided
the subsequent mapping (See Appendix). They also focused on mapping services for public
safety. They would update maps every four to six hours which provided locations for
shelter, food, and water distribution points. They would distribute these maps to the
Emergency Operations Center, the National Guard, FEMA, and MEMA. Other mapping
13
services focused on damage assessments, public works, hazardous materials, energy,
transportation routing, and communication improvements. They also coordinated data
sharing among agencies. And still, this list is not exhaustive. It was apparent how many map
products they actually provided: within a two week period, they used four plotters practically
around-the-clock, and used nearly 5,000 feet of plotter paper.
Three particular applications: “blue-roofs” community relations, damage assessments, and
cell phone coverage maps are described in more detail below.
“Blue-Roofs” Community Relations
A FEMA chapter from Chesapeake, VA was located in Stone County, Mississippi on a
community relations mission. Their mission was to notify community members of resources
available including “blue roofs”, which were to be installed by the Army Corps of
Engineers. “Blue-roofs” are blue plastic tarps that are tacked onto damaged roofs to
provide temporary protection until a permanent roof can be rebuilt. FEMA planned to go door-
to-door on a Sunday morning to inform the community about the availability and to
assess the need for these resources. Someone mentioned it would be difficult to find
people at home on a Sunday morning and suggested FEMA visit churches in the
community. GISCorps used information from local phone books to map the locations of the
churches in the community. FEMA was able to visit 19 churches and give a positive first
impression by meeting the community on their territory.
GISCorps further assisted the “blue-roofs” program by helping to organize the Army
Corps of Engineers’ efforts at collecting applications for blue roofs. Community members
were required to sign up to receive the assistance and in order to be eligible, all trees
needed to be removed from the roof. GISCorps provided grid maps with address
information to allow the ACE to organize their efforts at doing inspections and collecting
applications.

14
Damage Assessment Using Geocoded Addresses
In this application, GISCorps volunteers used the address database from the local 911
office to create a map to help with recovery efforts. The addresses were geocoded and spatially
joined with a grid to create a mapbook. Volunteers were able to use this map to navigate the
area by using the grid to go door-to-door and to assess damage. The grid was organized
according to volunteer fire department zones (eight zones). The grid showed address and
street ranges in order to facilitate the damage assessment in a county of 4,000 people.
Each point on the grid represented an address and as volunteers visited the points, they
collected attribute information which was then inserted into an Access database. FEMA used
these grids to collect information and used the road maps made by GISCorps to reach people
in an area that otherwise would have been very difficult to navigate.
Using the grid style maps to navigate the area and to collect attribute information allowed the
process to go much more smoothly. FEMA was able to organize the houses that had been
visited and to assess damage to each of these houses. For example, lists could be made of
houses with trees still on the roofs, and a team could then be sent to remove the tree. The
database could be constantly updated to show the progress being made and what work still
needed to be done. There was a “planning wall” at the office that showed what sectors
were finished and where volunteers were to go next.
Of interest is where the data for these maps came from. County postal workers in the area
were given checklist cards with name, address, and attribute information. The postal
workers went door-to-door collecting the information which was put into the Access database.
Cell Phone Coverage Maps
In this particular application, GISCorps volunteers provided information about
improvements in communication during response and recovery by making cellphone coverage
maps. They worked with a representative from Nextel and the executive director from CellSoft
to have cell phone technicians collect the latitude/longitude when they put up a cell tower.
The Nextel representative and CellSoft director would then contact GIS volunteers. With
this information, the GIS specialists would map crude buffers around the tower to determine
where the coverage would extend.
15
AAnnaallyyssiiss ooff DDaattaa
As with many crisis situations, challenges with data decreased the efficiency of the GIS
applications. “Access to the most accurate, current, reliable and trusted data was the binding
agent to provide geospatial analysis and mapping as well as the key element in demonstrating
the power of GIS technology to emergency response agencies that had little familiarity
with all things geospatial”.
The lack of data in some locations was a problem and decreased efficiency. Some
counties, such as Jackson County, had ample data including parcel and boundary
information, while other counties like Stone County had gaps in their data. This made some
GIS applications more challenging than others. For example, GIS applications were easier
when they were “conveying conditions at a large scale, such as road closures and locations
of emergency shelters”. But as the applications were used for more localized operations such
as search and rescue and damage assessment, this lack of data became increasingly
challenging. Other issues with the data included the standards, organization, and documentation
of the data.
IImmppaacctt aanndd BBeenneeffiittss ooff tthhee GGIISS AApppplliiccaattiioonnss
As Talbot Brook so aptly put it, “A picture is worth 1000 words. A map is a picture”.
Although the geospatial techniques that were used could be perceived as simple, they were
very instrumental in helping local, state, and national agencies to be more efficient, effective,
and organized in their response, recovery, and damage assessment efforts. In this way, the
legacy of the GISCorps volunteers remains with the communities in the rural counties of
Mississippi. The work also demonstrates that GIS applications will continue to make a
difference in emergency situations.
Even though some counties were more data-rich than others, because the GIS
applications were being used for lifesaving activities, they were helpful to everyone; they did
not favor one individual over another. The storm itself was a big equalizer, given its
geographic and spatial extent. For example, both those with and without means needed to
be rescued. And while poorer individuals’ homes along the coast may have been destroyed,
their property values have since tripled or even quadrupled.
16
GGIISS WWoorrkkss ttoo AAvvooiidd AAnnootthheerr KKaattrriinnaa
U.S. Army Corps of Engineers uses Bentley Systems Project Wise to evaluate hurricane
protection and flood damage reduction systems in New Orleans.
One year ago today, Hurricane Katrina struck the coasts of Louisiana, Mississippi and
Alabama. Destruction continued long after the hurricane passed, as breaches in the floodwalls
and levees of New Orleans flooded the city, leaving behind the area's greatest loss of life and
property damage in recorded history. The failure of the city's flood-protection system left
serious questions about why it failed and how to protect New Orleans and other cities in the
future.
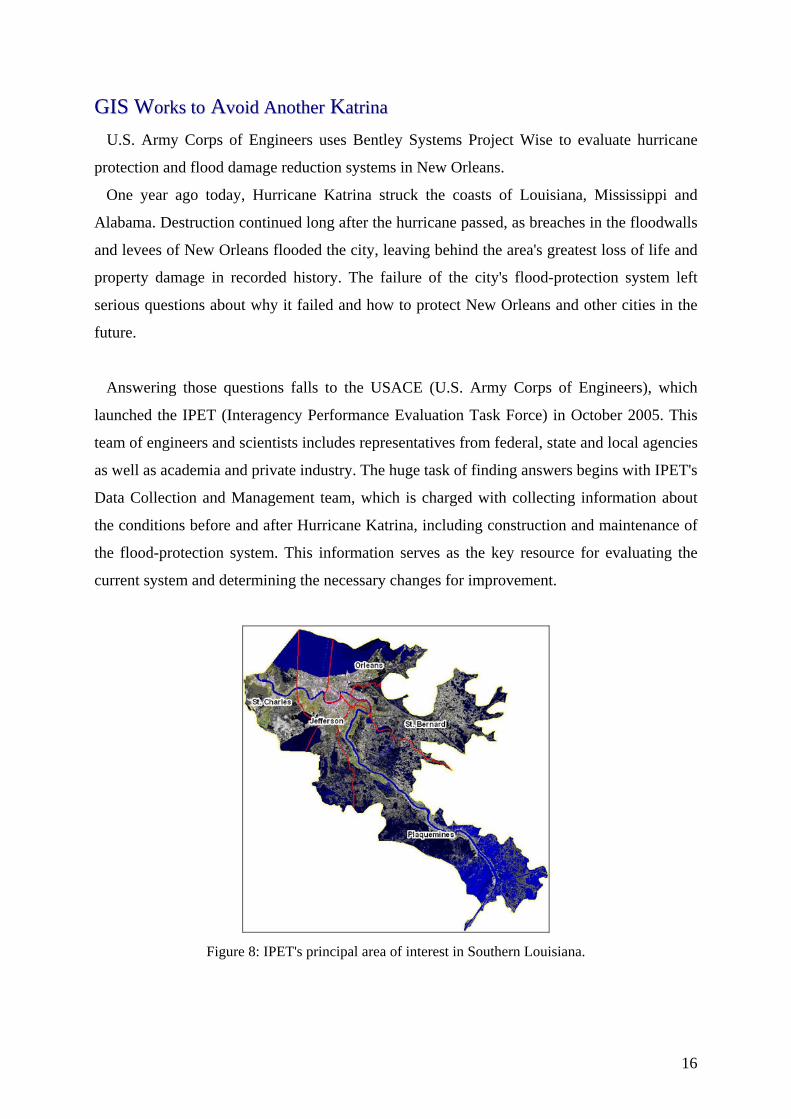
Answering those questions falls to the USACE (U.S. Army Corps of Engineers), which
launched the IPET (Interagency Performance Evaluation Task Force) in October 2005. This
team of engineers and scientists includes representatives from federal, state and local agencies
as well as academia and private industry. The huge task of finding answers begins with IPET's
Data Collection and Management team, which is charged with collecting information about
the conditions before and after Hurricane Katrina, including construction and maintenance of
the flood-protection system. This information serves as the key resource for evaluating the
current system and determining the necessary changes for improvement.
Figure 8: IPET's principal area of interest in Southern Louisiana.
17
Managing the Data
To manage the heterogeneous data required for the evaluation, IPET created a data
repository, based on existing corporate frameworks and standard. Data were stored within
frameworks that best fit the type of data for example, GIS, large datasets and unstructured
data. Bentley Systems Project Wise software provided the integrating mechanism to manage
the overall data environment.
Unstructured data, such as PDF, DOC, JPG, TXT and PPT files, as well as engineering
design files (DGN) is stored in a Microsoft SQLServer database managed by ProjectWise.
GIS data including the hurricane protection system (levees, pumping stations and floodwalls),
breach locations, roads, water bodies, parish boundaries, levee districts, digital elevations and
high water marks is stored in an Oracle SDO database registered through ArcSDE. Large
datasets including LIDAR and elevation models, DEM (digital elevation model) datasets
derived from the LIDAR data, and imagery are stored in the large datasets component on a
terabyte server, with metadata and geospatial extents of each dataset stored in an Oracle SDO
database to provide search capability.
Because time was of the essence, IPET took advantage of a prior enterprise license
agreement between the USACE and Bentley, wherein Bentley provides software training and
consulting services. IPET estimates that this ability to move quickly saved the USACE
thousands of dollars and months of time because the software could be installed and used
quickly without a lot of customization.
"ProjectWise provided an out-of-the-box capability to store and manage multiple types of
documents/datasets and the metadata associated with that data," explains Denise Martin, IPET
Data Management coleader. "It also provided a delivery and access control mechanism such
that users could access the data in a variety of ways."
The team used ProjectWise software for overall data management by integrating the data
stored in the three components such that users may access all datasets from one central
application without having to know which data is stored in which component. More than
12,000 documents/datasets are now in the repository.
18
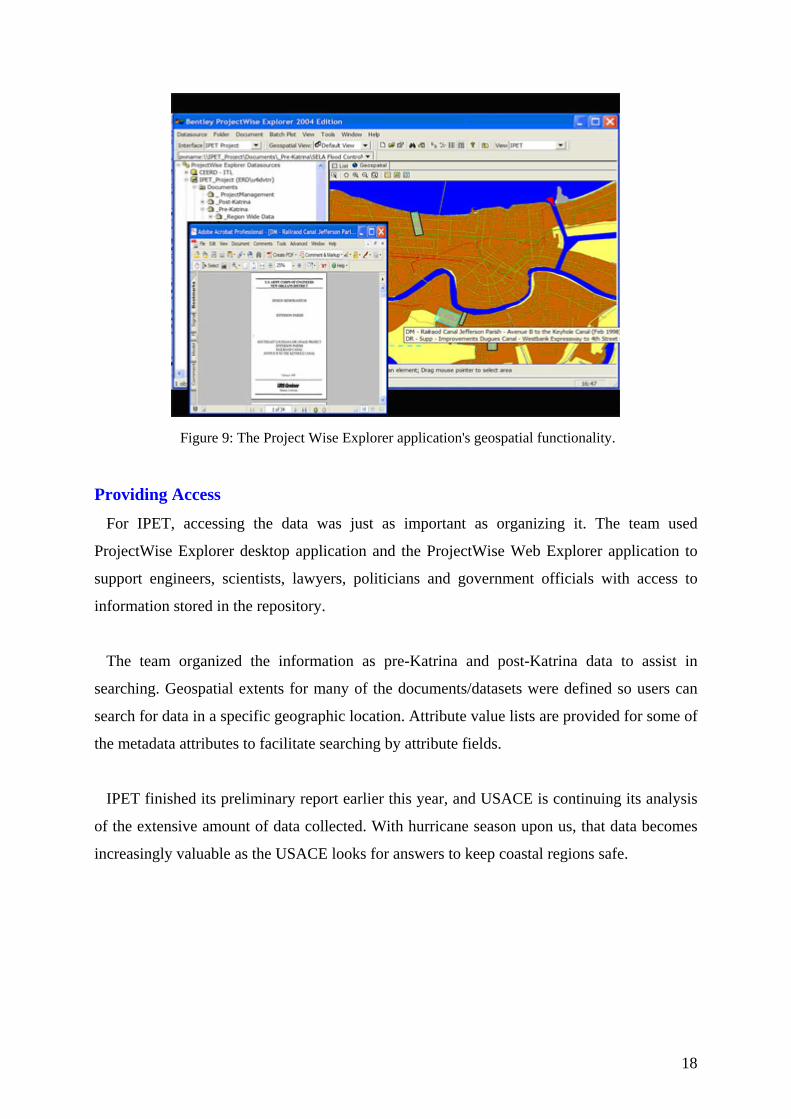
Figure 9: The Project Wise Explorer application's geospatial functionality.
Providing Access
For IPET, accessing the data was just as important as organizing it. The team used
ProjectWise Explorer desktop application and the ProjectWise Web Explorer application to
support engineers, scientists, lawyers, politicians and government officials with access to
information stored in the repository.
The team organized the information as pre-Katrina and post-Katrina data to assist in
searching. Geospatial extents for many of the documents/datasets were defined so users can
search for data in a specific geographic location. Attribute value lists are provided for some of
the metadata attributes to facilitate searching by attribute fields.
IPET finished its preliminary report earlier this year, and USACE is continuing its analysis
of the extensive amount of data collected. With hurricane season upon us, that data becomes
increasingly valuable as the USACE looks for answers to keep coastal regions safe.

19
RReevviieeww ooff LLiitteerraattuurree
GIS is powerful for analyzing spatial data, used widely throughout universities, research
centers, governmental agencies, and private industry. The ability of GIS technology to
integrate and relate different spatial data types (biophysical, geophysical, socioeconomic, etc.)
from different sources, to analyze these data, and to present results has led to GIS being a
common tool across many organizations. The meteorological data type has been missing,
including but not limited to atmospheric measurements, weather forecasts and analyses. In
2001, the National Center for Atmospheric Research (NCAR) developed a GIS Initiative as an
interdisciplinary effort to foster collaboration, and spatial data interoperability. The GIS
Initiative aims to promote the use of GIS as analysis and an infrastructural tool in atmospheric
research and to distribute atmospheric and climate data to GIS users. Spatial data
interoperability is a key to interdisciplinary research and decision-making within the
atmospheric and GIS communities. In this context, the development of an Atmospheric
Data Model is one of the first steps in achieving interoperable data sets. Atmospheric
data cover a very large array of data objects, in a variety of data formats. The ultimate goal
of an ArcGIS Atmospheric Data Model is to represent each of these data objects in a uniform
manner, allowing their superposition and combined analysis in the ArcGIS desktop
environment.
The Atmospheric Special Interest Group (SIG) was formed in 2003 and established a
dialog between ESRI and the atmospheric sciences community about data representation
issues. The Atmospheric SIG focused on two areas: temporal data management and
improved raster data support. This involves the development of Network Common Data
Format (NetCDF) converters for ingesting data into ArcGIS, and developing combined
support for NetCDF, HDF, and GRIB formats through a single API. Significant progress is
seen in various areas of GIS use with weather and climate data. Examples include the use of
GIS with radar data, climate data, weather warnings, watershed modeling, weather-related
business problems, hydro meteorological applications. The list of applications is longer
and software tools were developed to address various aspects of GIS use with weather data
for practical applications
In addition to applications that use weather and climate data, other GIS
applications were developed to be used with population evacuation and hurricane disaster
20
management. US Corps of Engineers working with Federal Emergency Management
Agency (FEMA) after hurricane Katrina, employed GIS in various projects: assessment of
post-disaster damage; rescuing and recovering; building temporary homes; removing debris,
pumping floodwater; identify impacted communities. USGS National Wetlands Research
Center use remote sensing and GIS to analyze land-water change caused by Katrina and
Rita hurricanes, and future work includes hurricane recovery, and restoration of land.
Another significant area of GIS application is in connection with population evacuation
models. The hurricane and evaluation (HURREVAC) program uses GIS in formation to
correlate demographic data with shelter locations and their proximity to evacuation routes
to improve evacuation decisions. Significant GIS effort is also ongoing for rebuilding after
Katrina related projects, in which multiple disciplines and agencies are involved.
CCaassee SSttuuddiieess
Case study is Hurricane Katrina, US.
SSttuuddyy AArreeaa
New Orleans, US.
TToooollss ooff SSttuuddyy
ArcGIS software and Microsoft SQLServer database managed by ProjectWise.
CCoonncclluussiioonn
Even though, the GISCorps did not know what to expect in terms of the extent and
severity of hurricane damage, they were able help recovery teams to coordinate their work
plans and efforts. Community needs should drive solutions. GIS services work better in a
participatory and sharing environment. Lucia stated that “they would have been fine without
us,” but that their assistance allowed the tasks of damage assessment by FEMA, repair work
by Navy Seabees, and work by the Army Corps of Engineers to be completed with more
speed and efficiency. GISCorps volunteers, with their unique and different experiences, left
a legacy of simple maps, portable reports and meaningful data for the communities and
agencies in the rural counties of Mississippi.
21
SSuummmmaarryy
This paper presents the GIS role and use in hurricane Katrina. It started with an in
introduction of GIS and hurricane.
After that it presents the Methodology of Study, Hurricane prediction resources, Initial steps
prior to ArcGIS applied. Next, it presents Description of ArcGIS applications, Analysis of
data, Impact and benefits of the GIS applications, GIS works to avoid another Katrina
Also it present Review of Literature, location of Study Area, Tools of Study, finally I wrote
Conclusion and Recommendations.
RReeccoommmmeennddaattiioonnss
Future Direction, Needs and Changes to GIS Activities
Many recollections from real-time experiences from GISCorps volunteers revealed
recommendations for changes in emergency operations that reflect the future direction and
needs of the GISCorps and the communities they serve in crisis situations. Attention to
human capital; changes in data management and information sharing; and enhanced GIS
applications are the focus for improving GIS activities in the future.
Human Capital
With Hurricane Katrina recovery efforts in Mississippi, GIS efforts “needed an
organizational structure to leverage the wealth of available skills to make the
technology delivery”. In response, a lead team of Talbot Brooks, Dick Kotapish, Lake
County, Ohio GIS Department, and Craigen Knox, Mississippi Department of Environmental
Quality planned a command structure with the following functional areas: operational
management, logistics, data development, mapping and county EOC resource deployments.
This organization chart was successful and in the future, organizational structure should
continue to receive attention.
In the future as in the present, volunteers need to be diverse, have a professional
appearance, be mentally and physically tough, and have the technical skills, knowledge,
aptitude and perseverance to apply geospatial tools in an emergency situation. Future
22
deployment needs strong leaders to establish control, leverage people, balance workloads and
assignments, and manage group dynamics. Layers of management also need to be minimized
to facilitate rapid information sharing.
Data Management
As mentioned earlier, McDermott believes that “access, availability, documentation and
organization, intergovernmental coordination, and content standards” for data gathered and
used is necessary (2006). More metadata needs to be created in the future and given a higher
priority to make work more efficient. Standards need to be established for both data
management and availability, as well as current and complete infrastructure, emergency
service, and utility data. As far as other lessons that were learned, Lucia mentioned that
cooperation with the government agency responsible for providing post-storm imagery would
have been appreciated. GISCorps did not receive new imagery data and needed updated data
for better damage assessment to pay attention to coastal areas. They desperately needed
imagery to know, for example, where tree damage had occurred and to identify open spaces.
Information Sharing
Working with the community made the GISCorps successful in their mission. GISCorps
was absorbed into the community because they made an effort to attend all community
meetings and empower the local communities through maps and data. Understanding the
community’s expectations and target audience of the maps was a valuable lesson to learn.
GISCorps needed to be able to work with anyone that came into the project and to be flexible
with what they had to do and to the needs of the various groups they were assisting.
Successful information sharing within the community such as this should be continued into
the future. However, more attention needs to be given to intergovernmental coordination in
order to increase the efficient flow of data and other business processes.
Enhanced GIS Applications
While the opportunities for GIS applications seem infinite, there are two that GIS
specialists feel would have improved recovery capabilities tremendously. First, a good future
project would be to identify where the elderly live to allow for easier evacuation or rescue
efforts in future emergencies. In addition, fully implementing a United States National Grid
System (USNG) would be a standardized tool that would be extremely useful for locating
persons, places, and points of interest. Currently, the lack of awareness about the USNG is
preventing its use on a widespread basis.

23
To further enhance GIS applications, alternative and reliable power-supplies are needed for
work continuity and to prevent work shortages, time losses, and losses of computer files.
Additionally, a source for cell phones, laptops, batteries, plotters, and data are needed in a
crisis.
AAcckknnoowwlleeddggmmeennttss
I would like to express my feeling to thank KFUPM and appreciate Dr.Baqer Al Ramadan
for giving me this opportunity to prepare this term paper.
RReeffeerreenncceess
Constantin Andronache, Rudolph Hon, Barbara Mento, and Rani Dalgin Boston College, Chestnut Hill, Massachusetts, USA Mapping Hurricane Katrina with GIS.
Tanya Meyer, Erika Rence, Wintford Thornton. URPL 969 - Applied GIS Workshop:
Rethinking New Orleans After Hurricane Katrina David Hart March 10, 2006. The Role of GISCorps in Hurricane Katrina Response and Recovery Operations.
Paul Hampton and Benjamin Webb, March 10, 2005 University of Wisconsin Madison. GIS
Application and Disaster Response and Recovery. Drew Pennington Gourgen Melikian, March 10, 2006. GIS Use in the Hurricane Katrina
Response and Recovery Efforts. Agency: New Orleans Regional Planning Commission.
Teresa Gillotti, Joe Rude March 8, 2006. Profile of FEMA’s Mapping and Analysis Center.
http://www.nasa.gov/vision/earth/lookingatearth/h2005_katrina.html
http://management.cadalyst.com/cadman/article/articleDetail.jsp?id=368022
http://coastal.lic.wisc.edu/urpl969-katrina/
AAttttaacchhmmeennttss
Last Known Positions of Missing Persons (as reported through MEMA, 4 Sept 05).
Power outages September 1 to 8, 2005. Data from EPA's, Entergy, MSPCO, TVA.
Planning Wall at the GISCorps Office.
NASA earth science spacecraft observe the birth and intensification of deadly category 5
Hurricane Katrina.
Power point presentation of this paper.