
GetView Vol.1 No.2 November 2011
54
-
Upload
pixie-studio -
Category
Documents
-
view
233 -
download
6
description
GetView Vol.1 No.2 November 2011
Transcript of GetView Vol.1 No.2 November 2011


Committee of the Global Engineers & Technologists Review Chief Editor
Ahmad Mujahid Ahmad Zaidi, MALAYSIA Managing Editor Mohd Zulkifli Ibrahim, MALAYSIA
Editorial Board
Dr. Arsen Adamyan Yerevan State University ARMENIA
Assoc. Prof. Dr. Gasham Zeynalov Khazar University AZERBAIJAN
Assistant Prof. Dr. Tatjana Konjić University of Tuzla Bosnia and Herzegovina BOSNIA and HERZEGOVINA
Assistant Prof. Dr. Muriel de Oliveira Gavira State University of Campinas (UNICAMP) BRAZIL
Assoc. Prof. Dr. Plamen Mateev Sofia University of St. Kliment Ohridsky BULGARIA
Dr. Zainab Fatimah Syed The University of Calgary CANADA
Assistant Prof. Dr. Jennifer Percival University of Ontario Institute of Technology CANADA
Prof. Dr. Sc. Igor Kuzle University of Zagreb CROATIA
Assoc. Prof. Dr. Milan Hutyra VŠB - Technical University of Ostrava CZECH
Prof. Dr. Mohamed Abas Kotb Arab Academy for Science, Technology and Maritime Transport EGYPT
Prof. Dr. Laurent Vercouter INSA de Rouen FRANCE
Prof. Dr. Ravindra S. Goonetilleke The Hong Kong University of Science and Technology HONG KONG
Prof. Dr. Qeethara Kadhim Abdulrahman Al-Shayea Al-Zaytoonah University of Jordan JORDAN
Prof. Yousef S.H. Najjar Jordan University of Science and Technology JORDAN
Assoc. Prof. Dr. Al-Tahat D. Mohammad University of Jordan JORDAN
Assoc. Prof. Dr. John Ndichu Nder Jomo Kenyatta University of Agriculture and Technology- (JKUAT) KENYA
Prof. Dr. Megat Mohamad Hamdan Megat Ahmad The National Defence University of Malaysia MALAYSIA
Prof. Dr. Rachid Touzani Université Mohammed 1er MOROCCO
Prof. Dr. José Luis López-Bonilla Instituto Politécnico Nacional MEXICO
Assoc. Prof. Dr. Ramsés Rodríguez-Rocha IPN Avenida Juan de Dios Batiz MEXICO
Dr. Bharat Raj Pahari Tribhuvan University
NEPAL Prof. Dr. Abdullah Saand Quaid-e-Awam University College of Eng. Sc. & Tech.
PAKISTAN

Prof. Dr. Naji Qatanani An-Najah National University
PALESTINE
Prof. Dr. Anita Grozdanov University Ss Cyril and Methodius REPUBLIC OF MACEDONIA
Prof. Dr. Vladimir A. Katić University of Novi Sad SERBIA
Prof. Dr. Aleksandar M. Jovović Belgrade University SERBIA
Prof. Dr. A.K.W. Jayawardane University of Moratuwa SRI LANKA
Prof. Dr. Gunnar Bolmsjö University West SWEDEN
Prof. Dr. Peng S. Wei National Sun Yat-sen University at Kaohsiung.
TAIWAN
Prof. Dr. Hüseyin Çimenoğlu Instanbul Technical University (İTÜ) TURKEY
Assistant Prof. Dr. Zeynep Eren Ataturk University TURKEY
Dr. Mahmoud Chizari The University of Manchester UNITED KINGDOM Prof. Dr. David Hui University of New Orleans
USA
Prof. Dr. Pham Hung Viet Hanoi University of Science VIETNAM
Prof. Dr. Raphael Muzondiwa Jingura Chinhoyi University of Technology ZIMBABWE

Dear the Seeker of Truth and Knowledge. Welcome to the Global Engineers and Technologists Review, Volume 1, Number 2. The Global Engineers and Technologists Review is a peer-reviewed journal, open access journal, published by GETview. It is a forum for the publication and dissemination of original work which contributes to the understanding of multi-disciplinary underpinning in the fields of engineering, technology, chemistry, environmental sciences, management and economics, physics, mathematics and statistics, computer and information sciences, geology and biology. Original contributions giving insight into case study, practices and fundamental in multi-disciplinary form the core of the journal contents. We look forward to receive scholarly written article from our respected audiences. Assoc. Prof. Ahmad Mujahid Ahmad Zaidi, PhD Chief Editor The Global Engineers and Technologists Review

©PUBLISHED 2011 Global Engineers and Technologists Review GETview ISSN: XXX-XXX-XX (PRINT) ISSN: 2231-9700 (ONLINE) Volume 1 Number 2 November 2011 All rights reserved. No part of this publication may be reproduced, stored in a retrieval system, or transmitted, electronic, mechanical photocopying, recording or otherwise, without the prior permission of the Publisher. Printed and Published in Malaysia

Vol.1, No.2, 2011 1. TOWARDS REALIZATION OF HIGH PERFORMANCE ELECTROCHEMICAL
DEVICE USING VERTICAL-ALIGNED SINGLE-WALLED CARBON NANOTUBES GROWN FROM ETHANOL MOHD ASYADI AZAM, KAZUKI ISOMURA, AKIHIKO FUJIWARA and TATSUYA SHIMODA
9. DESIGN AND FABRICATION OF LIGHTWEIGHT AND FOLDABLE MOTORIZED SCOOTER A.J., KHALID, N., WAN NOOR FATIMAH, I., AREA PUTRA, F., NIK MOHD AZRUL and A., SHOHAIMI
13. DESIGN AND ANALYSIS OF NEURAL FUZZY BASED BUCK CONVERTER CONTROLLER OPTIMIZED WITH SWARM INTELLIGENCE M.M., KANAI, J.N., NDERU and P.K., HINGA
22. CENTRAL SWITCH BOX TESTER: A NEW METHODOLOGY IN FAULT DETECTION FOR THE COMMUNICATION BOX BETWEEN THE ARMY’S TYPE
A-VEHICLE M., SURESH, A. SHOHAIMI, N., FARIQ, N.Z., NIK ZAMIRI, M.S., RISBY, A., ANIZAH, S., HITLER and K., ASYIKIN 26. INVESTIGATION ON IMPACT FRACTURE OF EPOXIDIZED NATURAL
RUBBER-ALUMINA NANOPARTICLE COMPOSITES (ENRAN) NORAIHAM MOHAMAD, ANDANASTUTI MUCHATAR, MARIYAM JAMEELAH GHAZALI, DAHLAN MOHD and CHE HUSNA AZHARI 35. UTILIZATION OF PRE-EDFA IN IMPROVING CATV SIGNALS IN P2P FTTH: A
MALAYSIAN SCENARIO M.K., ASYIKIN and S., SAHBUDIN 39. DETERMINING FOOT-ANKLE MECHANISM DESIGN BY MAPPING THE
RELATIONSHIPS AMONG BONES, JOINTS AND GROUND REACTION FORCE A.Y., BANI HASHIM, N.A., ABU OSMAN and W.A.B., WAN ABAS © 2011 GETview Limited. All right reserved
CONTENTS
ISSN 2231-9700 (online)

GLOBAL ENGINEERS & TECHNOLOGISTS REVIEW www.getview.org
G.L.O.B.A.L E.N.G.I.N.E.E.R.S. .& .-.T.E.C.H.N.O.L.O.G.I.S.T.S R.E.V.I.E.W 1
MOHD ASYADI AZAM1, KAZUKI ISOMURA2, AKIHIKO FUJIWARA3, and TATSUYA SHIMODA4
1 Faculty of Manufacturing Engineering Universiti Teknikal Malaysia Melaka
Hang Tuah Jaya, 76100 Durian Tunggal, Melaka, MALAYSIA [email protected]
1, 2, 4 School of Materials Science
Japan Advanced Institute of Science and Technology 1-1 Asahidai, Nomi, Ishikawa, 923-1292, JAPAN
3 Research and Utilization Division
Japan Synchrotron Radiation Research Institute 1-1-1 Kouto, Sayo-cho, Sayo, Hyogo, 679-5198, JAPAN
1.0 INTRODUCTION Carbon nanotubes (CNTs) which are hollow cylinders of graphitic carbon molecules have unique properties that make them potentially useful in many technology applications. Due to their seamless structure, small diameter, and to the resilience of individual carbon-carbon bonds, CNT have stiffness, strength, and thermal conductivity which exceed all other known natural and synthetic materials. Conceptually, CNTs can be thought of as all sp2 carbons arranged in graphene sheets, which have been rolled up to form a seamless hollow tube. The tubes can be capped at the ends by a fullerene type hemisphere and can have lengths ranging from tens of nanometers to several microns. CNTs are used in electronic consumer products such as plasma television, rechargeable batteries, cellular phones, and hydrogen storage in fuel cell cars to enhance the conductivity of semiconductor elements in electronic products. Flashing back to the basic materials science studies, carbon can take on many forms, the most well-known being graphite commonly found in the cores of pencils and diamond commonly found on engagement rings. Graphite has a layered, planar structure. In-diamond, however, each atom shares a bond with every neighbouring atom, forming a tetrahedral structure. In addition to these two forms, a new allotrope of carbon, called a fullerene, was discovered in 1985 by Kroto et al. (1985) a breakthrough for which they were awarded the Nobel Prize in chemistry in 1996. The most well-known of these fullerenes is the “Buckyball”, or C60. Due to its spherical symmetry and small size (consists of 60 atoms), it is essentially a zero-dimensional (0-D) material, also known as a quantum dot. With the discovery of fullerenes, a member of the carbon familyincluded the 3-D forms of diamond and graphite, 2-D graphene, and 0-D fullerenes. One can imagine forming a 1-D carbon allotrope by either elongating
ABSTRACT
There has been a growing interest in densely-packed or vertically-aligned (VA-)SWCNTs because of their suitability in energy storage devices such as electrochemical capacitors (ECs) and secondary batteries. Among various methods, the alcohol catalytic chemical vapor deposition (ACCVD) method is a promising one mainly due to its economical merit, wide selectivity of substrates and easy to set-up. Mainly, this research work has significant concerns on VA-SWCNT growth from Co/Al-O based substrates. In ECs, directly growing VA-SWCNTs onto conducting substrate can simplify the fabrication steps (processes), and also might avoid the incorporation of binder material. This, in principle could increase the capacitance behavior and at the same time providing a desired structure of electrode material for better electrolyte ion accessibilities (diffusion, adsorption). Keywords: Single-walled CNTs, Vertically-aligned SWCNTs, Alcohol Catalytic CVD, Electrochemical Device.
TOWARDS REALIZATION OF HIGH PERFORMANCE ELECTROCHEMICAL DEVICE USING VERTICAL-ALIGNED SINGLE-WALLED CARBON NANOTUBES GROWN FROM
ETHANOL

Global Engineers & Technologist Review, Vol. 1 No.2 (2011)
© 2011 GETview Limited. All rights reserved 2
a Buckyball, or by rolling up a 2-D graphene sheet into a narrow, tubular structure. This is exactly the structure discovered in 1993(Iijima and Ichihashi, 1993) & (Bethune et al., 1993) and is known as a single-walled (SW) CNT. In fact, both single- and multi-walled forms (Iijima, 1991) & (Oberlin et al., 1993) of this material exist, but the physical properties of SWCNTs have proved to be much more interesting, and will be addressed in the following section. The properties of these new materials were intriguing enough to spawn entire nanotechnology field, attracting researchers from almost all scientific disciplines. Physical properties and potential applications of graphene have been explored at a tremendous speed since several years ago (Geim and Novoselov, 2007). CNTs are the most likely candidate for miniaturizing electronics beyond the micro electromechanical scale that is currently the basis of modern technology. Other than the batteries or electrochemical capacitors(ECs), one useful application of CNT is in the development of the field effect transistor (FET). The usage of CNTs to flow the current between the source and drain in a device has been very attractive for many years. The production of the intramolecular logic gate using carbon nanotubes FET (CNTFET) has become possible as well. Normally, semiconductors are used for metal-semiconductor diodes, p-n junction diodes and field-effect transistors whereas metals are used for wiring interconnections. In the case of SWCNTs, the dominant type of the SWCNTs will normally determine the property of the device which will show metallic or semiconducting characteristics (Mohamed, 2010). Researchers and scientists are observing an increase in renewable energy production from natural sources, as well as the development of electric vehicles or hybrid electric (Simon and Gogotsi, 2008). At the forefront of these are electrical energy storage systems, such as batteries and ECs. Lithium-ion batteries were introduced in 1990 by Sony, following pioneering work by Whittingham, Scrosati, and Armand (Tarascon and Armand, 2001). These batteries, although costly, are the best in terms of performance, with energy densities that can reach 180 watt hours per kilogram (Wh kg–1). Because Li-ion batteries suffer from a somewhat slow power delivery or uptake, faster and higher power energy storage systems are needed in a number of applications, and this role has been given to the ECs (Miller and Simon, 2008). ECs are power devices that can be fully charged or discharged in seconds; as a consequence, their energy density (about 5 Wh kg–1) is lower than in batteries, but a much higher power delivery or uptake (10 kW kg–1) can be achieved for shorter times (Conway, 1999). They have had an important role in complementing or replacing batteries in the energy storage field, such as for uninterruptible power supplies (used to protect against power disruption) and load-levelling. In addition, Lee et al. (2010) reported a massive performance of lithium batteries that used functionalized MWCNT for the electrodes. In the introduction section, they discussed the performance gap between batteries and ECs from the viewpoint of power capability. Batteries exhibit high energy as a result of Faradaic reactions in the bulk of active particles, but are rate-limited. ECs can deliver high power at the cost of low energy storage by making use of surface ion adsorption and surface redox reactions (referred to as pseudo-capacitance). Lithium rechargeable batteries (~150Wh kg-1 and ~1 kWkg-1) therefore have higher gravimetric energy but lower power capability than electrochemical capacitors (Simon and Gogotsi, 2008). Although conventional batteries have been used in light vehicles, hybrid platforms for heavy vehicles and machineries demand delivery of much higher currents, so higher energy and comparable power capability relative to ECs are needed to meet this demand. 2.0 EXPERIMENTAL
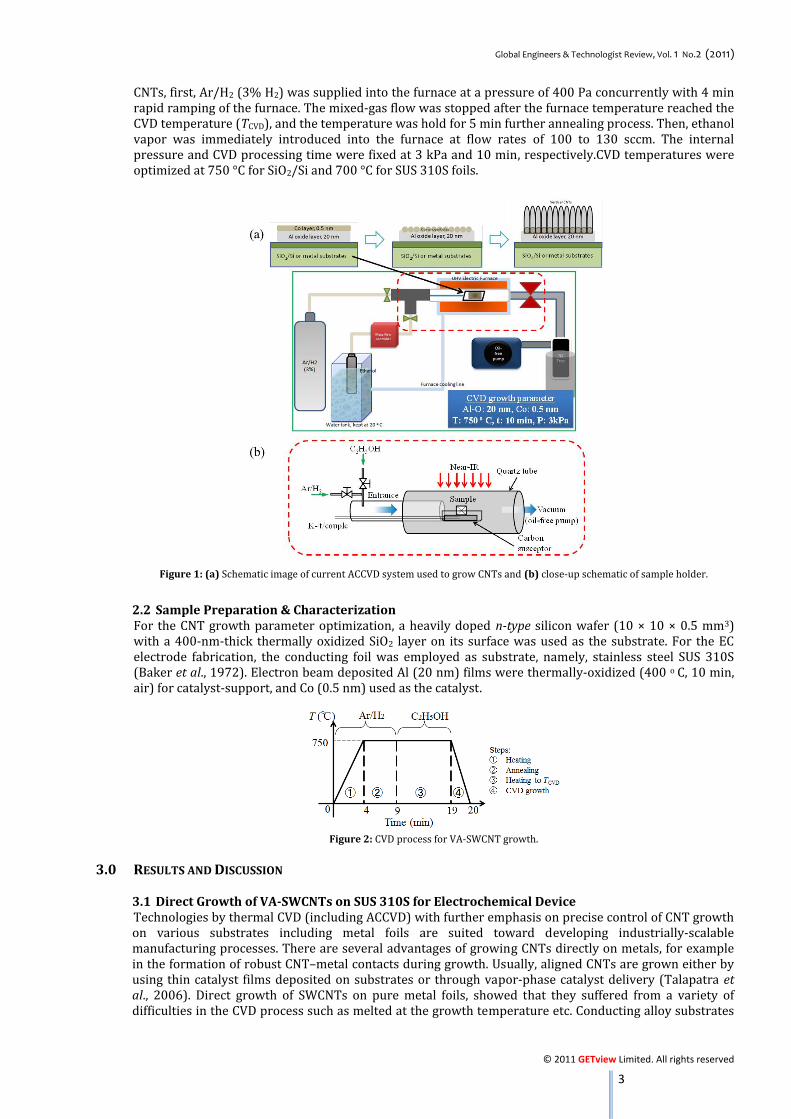
2.1 Alcohol Catalytic Chemical Vapor Deposition There are many SWCNT production methods, each with its advantages and disadvantages. However, one problem common to all of them is the presence of impurities, usually in the form of catalyst particles or amorphous carbon formed during SWCNT synthesis. The ACCVD method (Azam et al., 2011a), (Araujo et al., 2007), (Maruyama et al., 2002), (Murakami et al., 2003), (Azam et al., 2010) & (Azam et al., 2011b) is one of such technique and can produce high-quality SWCNTs that are almost free from the aforementioned impurities even in the as-grown state. This ACCVD method has since become one of the most popular methods used for low-cost, high-purity SWCNT synthesis. This lack of amorphous carbon was attributed to the OH- radical present in alcohols, which preferentially reacts with carbon molecules that have dangling bonds. This effectively etches away those carbon atoms that are most likely to produce amorphous carbon (Maruyama et al., 2002). The details of the growth mechanism, however, are not yet well understood. It is known, however, that SWCNT growth is a catalytic process, by which a carbon-containing molecule reacts with a metal catalyst particle and precipitates a nanotube. Ultra-high-vacuum electrical furnace (MILA-3000) was employed as the CVD reactor as shown in Figure 1. This system is believed to have the ability to fairly distribute and spread the feed gas all over the substrate’s surface and, from its flexible setting of fast heating and cooling rates, the dynamics of CNT growth might establish more rapid and localized control of the catalytic reactions. Carbon susceptor was used in order to have accurate temperature distribution to the substrate. Almost similar procedures with conventional furnace used in the CVD process. For the current CVD growth parameter to grow vertical
Global Engineers & Technologist Review, Vol. 1 No.2 (2011)
© 2011 GETview Limited. All rights reserved 3
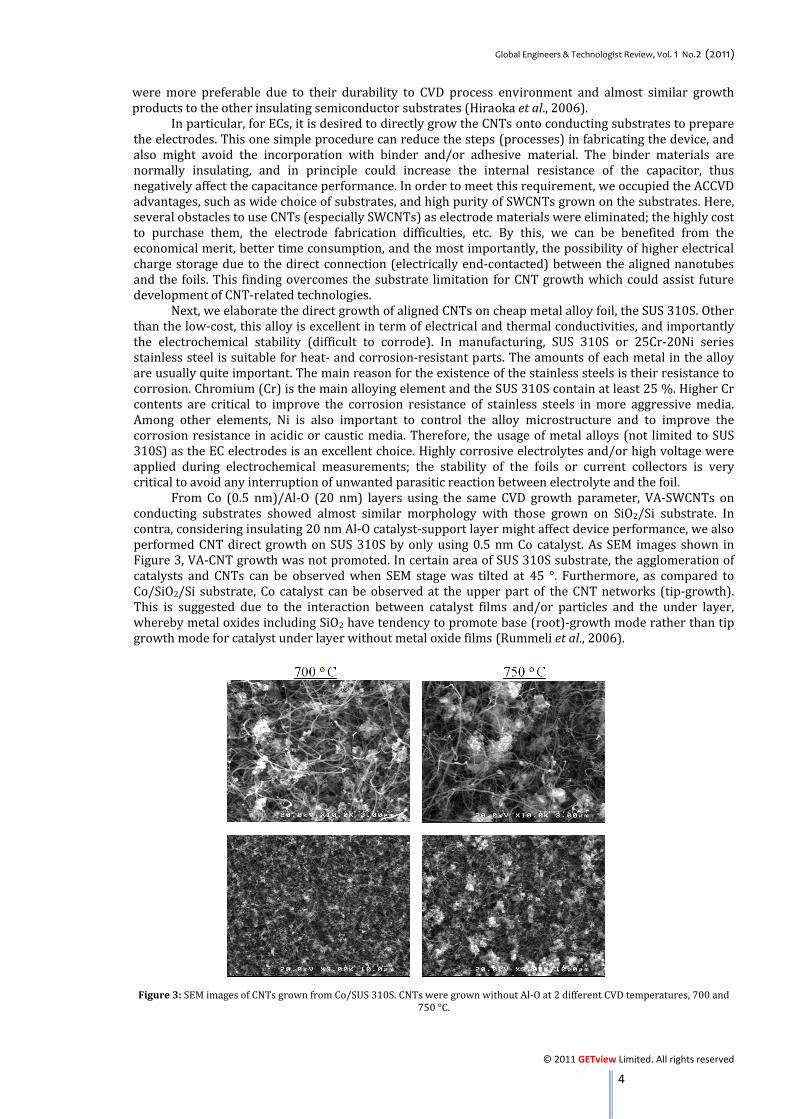
CNTs, first, Ar/H2 (3% H2) was supplied into the furnace at a pressure of 400 Pa concurrently with 4 min rapid ramping of the furnace. The mixed-gas flow was stopped after the furnace temperature reached the CVD temperature (TCVD), and the temperature was hold for 5 min further annealing process. Then, ethanol vapor was immediately introduced into the furnace at flow rates of 100 to 130 sccm. The internal pressure and CVD processing time were fixed at 3 kPa and 10 min, respectively.CVD temperatures were optimized at 750 °C for SiO2/Si and 700 °C for SUS 310S foils.
Figure 1: (a) Schematic image of current ACCVD system used to grow CNTs and (b) close-up schematic of sample holder.
2.2 Sample Preparation & Characterization For the CNT growth parameter optimization, a heavily doped n-type silicon wafer (10 × 10 × 0.5 mm3) with a 400-nm-thick thermally oxidized SiO2 layer on its surface was used as the substrate. For the EC electrode fabrication, the conducting foil was employed as substrate, namely, stainless steel SUS 310S (Baker et al., 1972). Electron beam deposited Al (20 nm) films were thermally-oxidized (400 o C, 10 min, air) for catalyst-support, and Co (0.5 nm) used as the catalyst. Figure 2: CVD process for VA-SWCNT growth.
3.0 RESULTS AND DISCUSSION
3.1 Direct Growth of VA-SWCNTs on SUS 310S for Electrochemical Device Technologies by thermal CVD (including ACCVD) with further emphasis on precise control of CNT growth on various substrates including metal foils are suited toward developing industrially-scalable manufacturing processes. There are several advantages of growing CNTs directly on metals, for example in the formation of robust CNT–metal contacts during growth. Usually, aligned CNTs are grown either by using thin catalyst films deposited on substrates or through vapor-phase catalyst delivery (Talapatra et al., 2006). Direct growth of SWCNTs on pure metal foils, showed that they suffered from a variety of difficulties in the CVD process such as melted at the growth temperature etc. Conducting alloy substrates
Global Engineers & Technologist Review, Vol. 1 No.2 (2011)
© 2011 GETview Limited. All rights reserved 4
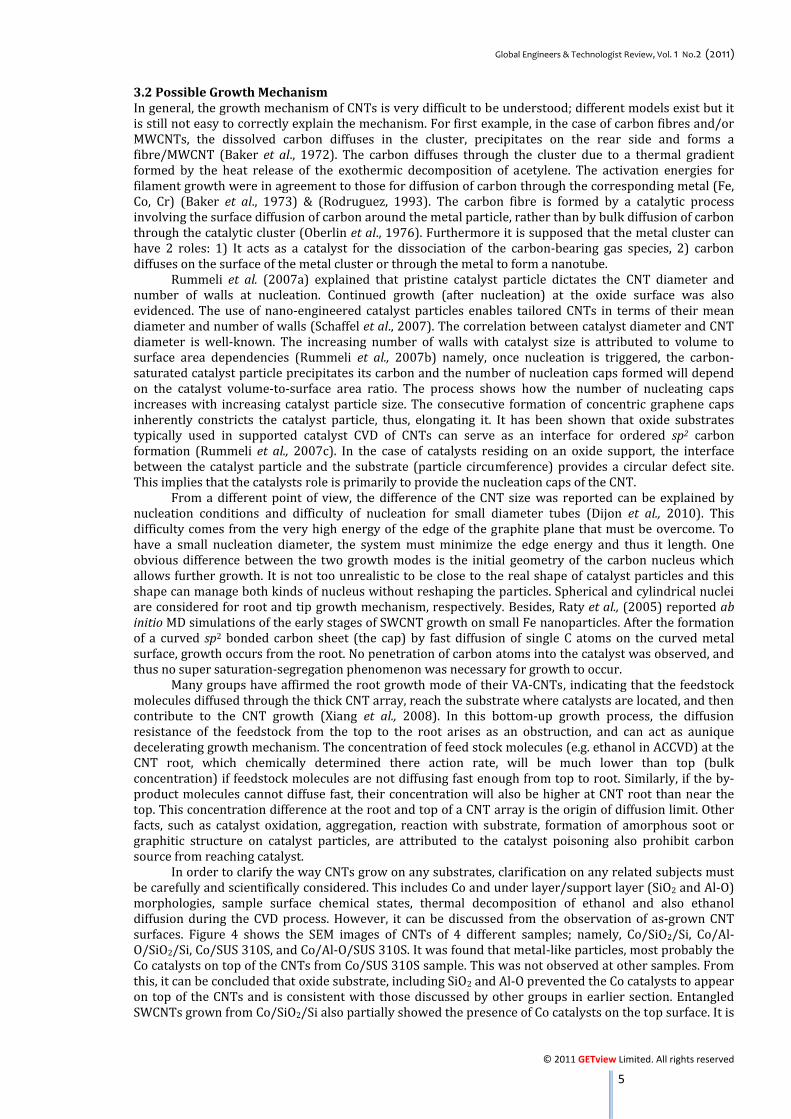
were more preferable due to their durability to CVD process environment and almost similar growth products to the other insulating semiconductor substrates (Hiraoka et al., 2006). In particular, for ECs, it is desired to directly grow the CNTs onto conducting substrates to prepare the electrodes. This one simple procedure can reduce the steps (processes) in fabricating the device, and also might avoid the incorporation with binder and/or adhesive material. The binder materials are normally insulating, and in principle could increase the internal resistance of the capacitor, thus negatively affect the capacitance performance. In order to meet this requirement, we occupied the ACCVD advantages, such as wide choice of substrates, and high purity of SWCNTs grown on the substrates. Here, several obstacles to use CNTs (especially SWCNTs) as electrode materials were eliminated; the highly cost to purchase them, the electrode fabrication difficulties, etc. By this, we can be benefited from the economical merit, better time consumption, and the most importantly, the possibility of higher electrical charge storage due to the direct connection (electrically end-contacted) between the aligned nanotubes and the foils. This finding overcomes the substrate limitation for CNT growth which could assist future development of CNT-related technologies. Next, we elaborate the direct growth of aligned CNTs on cheap metal alloy foil, the SUS 310S. Other than the low-cost, this alloy is excellent in term of electrical and thermal conductivities, and importantly the electrochemical stability (difficult to corrode). In manufacturing, SUS 310S or 25Cr-20Ni series stainless steel is suitable for heat- and corrosion-resistant parts. The amounts of each metal in the alloy are usually quite important. The main reason for the existence of the stainless steels is their resistance to corrosion. Chromium (Cr) is the main alloying element and the SUS 310S contain at least 25 %. Higher Cr contents are critical to improve the corrosion resistance of stainless steels in more aggressive media. Among other elements, Ni is also important to control the alloy microstructure and to improve the corrosion resistance in acidic or caustic media. Therefore, the usage of metal alloys (not limited to SUS 310S) as the EC electrodes is an excellent choice. Highly corrosive electrolytes and/or high voltage were applied during electrochemical measurements; the stability of the foils or current collectors is very critical to avoid any interruption of unwanted parasitic reaction between electrolyte and the foil. From Co (0.5 nm)/Al-O (20 nm) layers using the same CVD growth parameter, VA-SWCNTs on conducting substrates showed almost similar morphology with those grown on SiO2/Si substrate. In contra, considering insulating 20 nm Al-O catalyst-support layer might affect device performance, we also performed CNT direct growth on SUS 310S by only using 0.5 nm Co catalyst. As SEM images shown in Figure 3, VA-CNT growth was not promoted. In certain area of SUS 310S substrate, the agglomeration of catalysts and CNTs can be observed when SEM stage was tilted at 45 °. Furthermore, as compared to Co/SiO2/Si substrate, Co catalyst can be observed at the upper part of the CNT networks (tip-growth). This is suggested due to the interaction between catalyst films and/or particles and the under layer, whereby metal oxides including SiO2 have tendency to promote base (root)-growth mode rather than tip growth mode for catalyst under layer without metal oxide films (Rummeli et al., 2006).
Figure 3: SEM images of CNTs grown from Co/SUS 310S. CNTs were grown without Al-O at 2 different CVD temperatures, 700 and 750 °C.
Global Engineers & Technologist Review, Vol. 1 No.2 (2011)
© 2011 GETview Limited. All rights reserved 5
3.2 Possible Growth Mechanism In general, the growth mechanism of CNTs is very difficult to be understood; different models exist but it is still not easy to correctly explain the mechanism. For first example, in the case of carbon fibres and/or MWCNTs, the dissolved carbon diffuses in the cluster, precipitates on the rear side and forms a fibre/MWCNT (Baker et al., 1972). The carbon diffuses through the cluster due to a thermal gradient formed by the heat release of the exothermic decomposition of acetylene. The activation energies for filament growth were in agreement to those for diffusion of carbon through the corresponding metal (Fe, Co, Cr) (Baker et al., 1973) & (Rodruguez, 1993). The carbon fibre is formed by a catalytic process involving the surface diffusion of carbon around the metal particle, rather than by bulk diffusion of carbon through the catalytic cluster (Oberlin et al., 1976). Furthermore it is supposed that the metal cluster can have 2 roles: 1) It acts as a catalyst for the dissociation of the carbon-bearing gas species, 2) carbon diffuses on the surface of the metal cluster or through the metal to form a nanotube. Rummeli et al. (2007a) explained that pristine catalyst particle dictates the CNT diameter and number of walls at nucleation. Continued growth (after nucleation) at the oxide surface was also evidenced. The use of nano-engineered catalyst particles enables tailored CNTs in terms of their mean diameter and number of walls (Schaffel et al., 2007). The correlation between catalyst diameter and CNT diameter is well-known. The increasing number of walls with catalyst size is attributed to volume to surface area dependencies (Rummeli et al., 2007b) namely, once nucleation is triggered, the carbon-saturated catalyst particle precipitates its carbon and the number of nucleation caps formed will depend on the catalyst volume-to-surface area ratio. The process shows how the number of nucleating caps increases with increasing catalyst particle size. The consecutive formation of concentric graphene caps inherently constricts the catalyst particle, thus, elongating it. It has been shown that oxide substrates typically used in supported catalyst CVD of CNTs can serve as an interface for ordered sp2 carbon formation (Rummeli et al., 2007c). In the case of catalysts residing on an oxide support, the interface between the catalyst particle and the substrate (particle circumference) provides a circular defect site. This implies that the catalysts role is primarily to provide the nucleation caps of the CNT. From a different point of view, the difference of the CNT size was reported can be explained by nucleation conditions and difficulty of nucleation for small diameter tubes (Dijon et al., 2010). This difficulty comes from the very high energy of the edge of the graphite plane that must be overcome. To have a small nucleation diameter, the system must minimize the edge energy and thus it length. One obvious difference between the two growth modes is the initial geometry of the carbon nucleus which allows further growth. It is not too unrealistic to be close to the real shape of catalyst particles and this shape can manage both kinds of nucleus without reshaping the particles. Spherical and cylindrical nuclei are considered for root and tip growth mechanism, respectively. Besides, Raty et al., (2005) reported ab initio MD simulations of the early stages of SWCNT growth on small Fe nanoparticles. After the formation of a curved sp2 bonded carbon sheet (the cap) by fast diffusion of single C atoms on the curved metal surface, growth occurs from the root. No penetration of carbon atoms into the catalyst was observed, and thus no super saturation-segregation phenomenon was necessary for growth to occur. Many groups have affirmed the root growth mode of their VA-CNTs, indicating that the feedstock molecules diffused through the thick CNT array, reach the substrate where catalysts are located, and then contribute to the CNT growth (Xiang et al., 2008). In this bottom-up growth process, the diffusion resistance of the feedstock from the top to the root arises as an obstruction, and can act as aunique decelerating growth mechanism. The concentration of feed stock molecules (e.g. ethanol in ACCVD) at the CNT root, which chemically determined there action rate, will be much lower than top (bulk concentration) if feedstock molecules are not diffusing fast enough from top to root. Similarly, if the by-product molecules cannot diffuse fast, their concentration will also be higher at CNT root than near the top. This concentration difference at the root and top of a CNT array is the origin of diffusion limit. Other facts, such as catalyst oxidation, aggregation, reaction with substrate, formation of amorphous soot or graphitic structure on catalyst particles, are attributed to the catalyst poisoning also prohibit carbon source from reaching catalyst. In order to clarify the way CNTs grow on any substrates, clarification on any related subjects must be carefully and scientifically considered. This includes Co and under layer/support layer (SiO2 and Al-O) morphologies, sample surface chemical states, thermal decomposition of ethanol and also ethanol diffusion during the CVD process. However, it can be discussed from the observation of as-grown CNT surfaces. Figure 4 shows the SEM images of CNTs of 4 different samples; namely, Co/SiO2/Si, Co/Al-O/SiO2/Si, Co/SUS 310S, and Co/Al-O/SUS 310S. It was found that metal-like particles, most probably the Co catalysts on top of the CNTs from Co/SUS 310S sample. This was not observed at other samples. From this, it can be concluded that oxide substrate, including SiO2 and Al-O prevented the Co catalysts to appear on top of the CNTs and is consistent with those discussed by other groups in earlier section. Entangled SWCNTs grown from Co/SiO2/Si also partially showed the presence of Co catalysts on the top surface. It is
Global Engineers & Technologist Review, Vol. 1 No.2 (2011)
© 2011 GETview Limited. All rights reserved 6
suggested that the reason could be the thickness (too thin) of the grown CNTs, in which for vertically-grown CNTs, the catalyst particles were not be observed.
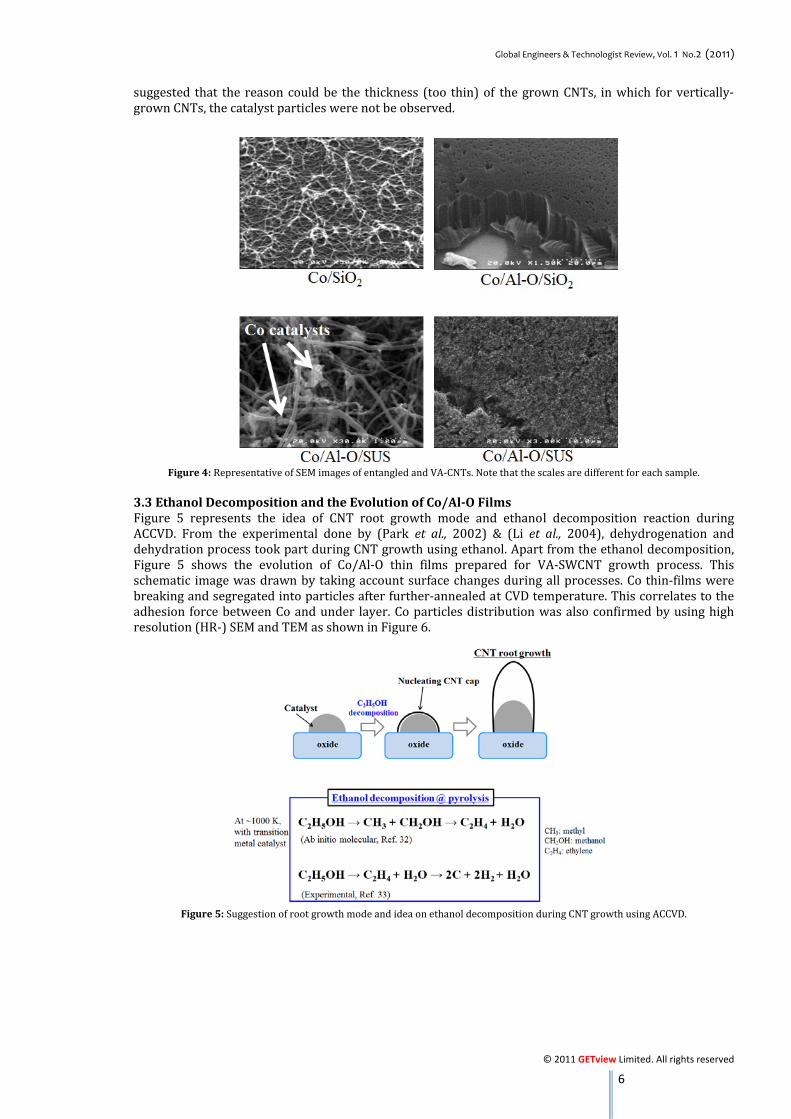
Figure 4: Representative of SEM images of entangled and VA-CNTs. Note that the scales are different for each sample. 3.3 Ethanol Decomposition and the Evolution of Co/Al-O Films Figure 5 represents the idea of CNT root growth mode and ethanol decomposition reaction during ACCVD. From the experimental done by (Park et al., 2002) & (Li et al., 2004), dehydrogenation and dehydration process took part during CNT growth using ethanol. Apart from the ethanol decomposition, Figure 5 shows the evolution of Co/Al-O thin films prepared for VA-SWCNT growth process. This schematic image was drawn by taking account surface changes during all processes. Co thin-films were breaking and segregated into particles after further-annealed at CVD temperature. This correlates to the adhesion force between Co and under layer. Co particles distribution was also confirmed by using high resolution (HR-) SEM and TEM as shown in Figure 6.
Figure 5: Suggestion of root growth mode and idea on ethanol decomposition during CNT growth using ACCVD.

Global Engineers & Technologist Review, Vol. 1 No.2 (2011)
© 2011 GETview Limited. All rights reserved 7
Figure 6: Evolution of Co/Al-O films before VA-SWCNT growth process. 4.0 CONCLUSION Growth of VA-SWCNTs on aluminium oxide (Al-O)-supported Co catalyst by using ethanol was performed using a low-cost ACCVD method. The Alfilms of 20 nm thickness was thermally-oxidized for the production of Al-O, and 0.5 nm cobalt (Co) thin films was used as catalyst for the CVD process. The CNT growth was optimized using SiO2/Si substrates, and the similar experimental condition was applied to conducting substrates (SUS 310S). It was found that either entangled or VA-SWCNTs were grown based on root-growth mode. However, several other considerations such as films surface chemical states before and during CVD process will be investigated in a scientific way. Easy & low cost of well-organized SWCNT growth process promises great impact to a wide variety of technologists that use CNTs for their gadget/device, thus may provides the new art-of-science for the future development of energy storage devices. ACKNOWLEDGMENTS This work was supported by a Grant-in-Aid from Japan Society for the Promotion of Science (JSPS) for Research Fellows. Part of this work was conducted in Kyoto Advanced Nanotechnology Network, supported by Ministry of Education, Culture, Sports, Science and Technology, Japan (MEXT). REFERENCES [1] Kroto, H.W., Heath, J.R., Obrien, S.C., Curl, R.F. and Smalley, R.E. Nature318 (1985) 162. [2] Iijima, S. and Ichihashi, T. Nature363 (1993) 603. [3] Bethune, D.S., Kiang, C.H., Devries, M.S., Gorman, G., Savoy, R., Vazquez, J. and Beyers, R. Nature363 (1993) 605. [4] Iijima, S. Nature354 (1991) 56. [5] Oberlin, A., Endo, M. and Koyama, T. J. Cryst. Growth32 (1976) 335. [6] Geim, A.K. and Novoselov, K.S. Nature Mater. 6 (2007) 183. [7] Mohamed, M.A. PhD Thesis, School of Materials Science, Japan Advanced Institute of Science and Technology,
Ishikawa, Japan (2010). [8] Simon, P. and Gogotsi, Y. Nature Mater.7 (2008) 845. [9] Tarascon, J.M. and Armand, M. Nature414 (2001) 359. [10] Miller, J.R. and Simon, P. Science321 (2008) 651. [11] Conway, B.E. Electrochemical Supercapacitors: Scientific Fundamentals and TechnologicalApplications, Kluwer (1999). [12] Lee, S.W., Yabuuchi, N., Gallant, B.M., Chen, S., Kim, B.S., Hammond, P.T. and Horn, Y.S. Nature Nanotech.5 (2010) 531. [13] Azam, M.A., Fujiwara, A. and Shimoda, T. Appl. Surf. Sci.258(2011a) 873. [14] Araujo, P.T., Doorn, S.K., Kilina, S., Tretiak, S., Einarsson, E., Maruyama, S., Chacham, H., Pimenta, M.A. and Jorio, A. Phys. Rev. Lett.98 (2007). [15] Maruyama, S., Kojima, R., Miyauchi, Y., Chiashi, S. and Kohno, M. Chem. Phys. Lett.360 (2002) 229. [16] Murakami, Y., Miyauchi, Y., Chiashi, S. and Maruyama, S. Chem. Phys. Lett.374 (2003) 53. [17] Azam, M.A., Mohamed, M.A., Shikoh, E., Fujiwara, A. Jpn. J. App. Phys.49 (2010) 02BA04. [18] Azam, M.A., Fujiwara, A. and Shimoda, T. J. New Mat. Electrochem. Systems14 (2011b) 173. [19] Talapatra, S., Kari, S., Pal, S.K., Vajtai, R., Ci, L., Victor, P.M., Shaijumon, M., Kaur, S., Nalamasu, O. and Ajayan, P.M. Nature Nanotech.1 (2006) 112. [20] Hiraoka, T., Yamada, T., Hata, K., Futaba, D.N., Kurachi, H., Uemura, S., Yumura, M. and Iijima, S. J. Am. Chem. Soc. 128 (2006) 13338.

Global Engineers & Technologist Review, Vol. 1 No.2 (2011)
© 2011 GETview Limited. All rights reserved 8
[21] Rummeli, M.H., Schaffel, F., Kramberger, C., Gemming, T., Bachmatiuk, A., Kalenczuk, R.J., Rellinghaus, B., Buchner, B. and Pichler, T. J. Am. Chem. Soc. 129 (2007a) 15772. [22] Baker, R.T.K., Barber, M.A., Harris, P.S., Feates, F.S. and Waite, R.J. J. Catal.26 (1972) 51. [23] Baker, R.T.K., Harris, P.S., Thomas, R.B. and Waite, R.J. J. Catal.30 (1973) 86. [24] Rodruguez, N.M. J. Mat. Res.8 (1993) 3233. [25] Oberlin, A., Endo, M. and Koyama, T. J. Crystal Growth32 (1976) 335. [26] Schaffel, F., Kramberger, C., Rummeli, M.H., Grimm, D., Mohn, E., Gemming, T., Pichler, T., Rellinghaus, B., Buchner, B. and Schultz, L. Chem. Mater. 19 (2007) 5006. [27] Rummeli, M.H., Kramberger, C., Loffler, M., Jost, O., Bystrzejewski, M., Gruneis, A., Gemming, T., Pompe, Buchner, W.B. and Pichler, T. J. Phys. Chem. B111 (2007b) 8234. [28] Rummeli, M.H., Kramberger, C., Gruneis, A., Ayala, P., Gemming, T., Buchner, B. and Pichler, T. Chem. Mater.19 (2007c) 4105. [29] Dijon, J., Szkutnik, P.D., Fournier, A., Goislard de Monsabert, T., Okuno, H., Quesnel, E., Muffato, V., De Vito, E., Bendiab, N., Bogner, A. and Bernier, N. Carbon48 (2010) 3953. [30] Raty, Y., Gygi, F. and Galli, G. Phys. Rev. Lett. 95 (2005) 096103. [31] Xiang, R., Zhang, Z., Ogura, K., Okawa, J., Einarsson, E., Miyauchi, Y., Shiomi, J. and Maruyama, S. Jpn. J. Appl. Phys. 47 (2008) 1971. [32] Park, J. et al., J. Chem. Phys. 117 (2002) 3224. [33] Li, J. et al., J. Phys. Chem. A108 (2004) 7671.

GLOBAL ENGINEERS & TECHNOLOGISTS REVIEW www.getview.org
G.L.O.B.A.L E.N.G.I.N.E.E.R.S. .& .-.T.E.C.H.N.O.L.O.G.I.S.T.S R.E.V.I.E.W 9
A.J., KHALID1, N., WAN NOOR FATIMAH2, I., AREA PUTRA3, F., NIK MOHD AZRUL4 and A., SHOHAIMI5
1, 2, 3, 4, 5 Faculty of Engineering National Defence University of Malaysia
Kem Sungai Besi, 57000 Kuala Lumpur, MALAYSIA [email protected]
1.0 INTRODUCTION A motorized scooter is a miniature of scooter with an attached either electric motor or small internal combustion engine and used to assist the scooter to move fast in closer area as shown in Figure 1. The primary function of the scooter is to aid individuals to move around from one place to another place (Fauzi, 2008). The basic components of scooters nowadays are completely with two wheels, a flat deck which to put the feet, power train and handlebars to steer the front wheel. The scooter designs have made a positive impact on the ability of those who are participate in social events and physical challenges to perform their daily activities (Crouse and Anglin 1993). It is also intended to be utilized as a physical assistance device that is not designed essentially for speed but can move just a little bit quicker. 2.0 DESIGN AND FABRICATION The fabrication process of the prototype is based on the detail drawing where the selection of the design was take consideration of the safety requirements (Shigley et al., 2004). The prototype structure was build using the standard machines and tools and combines with the power train and braking system which was obtained from existing resources available in market. The structure of this scooter was made by using T 6061 Aluminum hollow tube and plate with high tensile strength. The Tungsten Inner Gas Welding (TIG Welding) was used for the joining process of main structure which is suitable for non-metallic material.
Figure 1: Complete prototype of motorized scooter. The structures assembly was divided into 3 parts; front, rear and handle structure. The front structure is completely with 2 flapping aluminum deck and foldable aluminum footrests left and right side. The rear structure is a combination of swing arm and rear tire. The rear structure has connected to front structure by bolts and nuts as a swing points and support by rear suspension. The handle structure has fixed to hollow tube at front structure by tighten screw and ball bearing to clamps the handle structure. The handle structure has attached by foldable handle, adjustable tube and suspension fork to steer the front tire.
ABSTRACT Motorized scooter is define as a moped which is a class of low-powered motorized vehicle which have low speed and small capacity of engine, lighter weight and can be foldable. The primary function is to aid an individual to moving for one place to another place. In military situation, the scooter will help the troops or runner to moving quickly and save their energy. This paper is discussed about the development of motorized scooter from the basic design elements to the final prototype fabrication. The design of the structure will take the consideration of the maximum stress and displacement of the main structure based on the maximum load of 100 kg. The total weight of the final prototype is 17.63 kg which below the design requirements. Keywords: Motorized Scooter, Low Power, Low Speed, Lightweight, Foldable.
DESIGN AND FABRICATION OF LIGHTWEIGHT AND FOLDABLE MOTORIZED SCOOTER

Global Engineers & Technologist Review, Vol. 1 No.2 (2011)
© 2011 GETview Limited. All rights reserved 10
The exhaust system has modified following the body structure and effective for the exhaust blow down. The exhaust system is normally using on two stroke engine like exhaust manifold and silencer. The chamber on intermediate of the manifold is acts as a plenum chamber which to bring the back pressure into the combustion chamber. The exhaust has clamping on the structure. The handle is designed with foldable handle bar where the handle bar has clamping on 22 mm diameter stainless steel U tube and tightens by screws. The attachment are including accelerator throttle and front brake lever on right hand side whereas kill switch and rear brake lever on left hand side. All the attachments are clamping by screws and connected the system by wire and brake cables. Electrical systems for an engine have modified the Capacitive Discharge Ignition (CDI) circuit where the sources output has connect to kill switch system from touching the ground (Earth). Then, the switch system has evaluated and test the functional using multimeter for checking an electrical connectivity and the reliability on kill switch system. The kill switch has clamped on the left hand side of handle bar. The selection of the engine use for this project is considered based from analysis and design requirement in design methodology. The selection should be over the design requirement which the design of this scooter needs minimum horsepower is 2.9 hp. The determinant of minimum horsepower can obtain from calculation based on maximum weight 130 kg and maximum slope of gradient 30°. However the available engine in market with 50 cc engine can produce more than minimum horsepower. 3.0 BRAKING SYSTEM ANALYSIS The braking system is applied to stop or parking, slow down and control the stability of scooter when ride. The braking system is using the mechanical system which the actuating forces transmit by cable brake to the caliper. Disk brakes consist of a wheel hub that rotates with the wheel. Calipers are attached to the frame or fork along with pads that squeeze together on the disk.
Figure 2: Brake lever system. The cable have analyze that strength and designing hand grasp on the brake lever which ergonomic with the human strength and energy capability without overloading the body. Based on ergonomic factor, the forces of digits, grip and grasp forces which power grasp for standard human grip strength, Fs mean is 318 N. The force, 318 N and the disc brake size, 0.118 m is suitable for stop the wheel with 80% braking efficiency as shown in Figure 2. 4.0 SCOOTER STRUCTURE ANALYSIS Structure which will be designed must be analyzed using finite element method. It can define whether the structure or not based on maximum load and require of design. The software that will be used is MSC Nastran. After performing the analysis on the crane, the result of the analysis is shown in the Figure 3 (a) and (b). In this section, the result on the stress distribution and the displacement will be considered. The allowable load is 1000 N with factor of safety 2.5. (a) (b)
Figure 3: (a) Maximum displacement at 0.667 mm, and (b) Maximum stress at 162 MPa.

Global Engineers & Technologist Review, Vol. 1 No.2 (2011)
© 2011 GETview Limited. All rights reserved 11
5.0 PROTOTYPE TESTING The systems function and drivability of the prototype motorized scooter will be tested with actual conditions. The testing have been divided into two phases, the first phase is functional test including engine start test, kill switch test, fuel line and cable brake test and accelerator functional test. The second phase includes actual test as the estimation of fuel consumption, endurance on off road condition, gradient condition and braking test. The test will determine the classification and performance to achieve and fulfill the standard safety requirement for consumer. Figure 4: Foldable test. The result shown the prototype can be folded easily as shown in Figure 4 and the total weight or prototype is 17.63 kg which below the design requirement. So, the prototype is suitable for human carriage and easily to keep for portable. The test have been done successfully and the result is thoroughly achieved the design objective and fulfill the design requirement. Nevertheless, certain technical problems have occurred but it has been solved fluently without disturbing and obstructs the testing process. The overall result can be compiling based on testing type as shown in Table 1. The result can be a design specification of this prototype.
Table 1: Overall test result. No. Types of test ResultA) Foldable and Weighing Test1. Reliability to Fold Yes2. Total Weight 17.63 kg3. Packing and Carrying YesB) Functional Test1. Cable Brake Pass with 80% brake efficiency C) Fuel Consumption Test1. Fuel Consumption 3.088 L / 100 kmD) Speed Test 1. Average speed 8.64 ms-12. Acceleration 0.53 ms-1E) Gradient Test 1. Ramp 30° Pass 2. Velocity 1.78 ms-1F) Endurance Test1. Laterite Route Yes (4.11 ms-1)2. Gravel Route Yes (5.36 ms-1)G) Braking Test 1. Displacement 16.05 m2. Deceleration 1.69 ms-2
6.0 CONCLUSION The prototype of motorized scooter expansion of automotive sector where it becomes a new alternative personnel vehicle for quick moving to some places in short distances. The design of motorized scooter is for single person ride and useful to use in daily routine. The existence of small vehicle has given an advantage for human life which the scooter can help the human life become easier. Based on the test result, the scooter is suitable to be used for recreational and military purpose. This scooter can move in rough terrain and can be used to perform various kinds of duty. The scooter can be fold into compact dimension and is easy to pack for portable used. The total weight of the scooter is below the design requirement with 17.63 kg of net weight. This statement shows the prototype is suitable to be used by human and easier for storage especially for traveller.

Global Engineers & Technologist Review, Vol. 1 No.2 (2011)
© 2011 GETview Limited. All rights reserved 12
The speed of the scooter can approach 8.64 ms-1 which shows the speed of the scooter is quite high and better than the average speed of a human while running. Therefore, the scooter is suitable to be used for quick moving and saves the human energy. For the reliability on gradient condition, the scooter can afford to climb the hill with optimum speeds at 1.73 ms-1. It shows that the scooter is able to move in standard road. The scooter is also able to move at off-road condition and the speed can approach around 4 to 5 ms-1. This shows the scooter is also suitable for military purpose where the scooter can move at laterite and gravel surface easily with a soldier bearing Full Set Military Order (FSMO). The efficiency of the scooter braking is quite good and can stop with short distance but the braking systems are not fully functioning because when it brakes, the tire is not totally locked. This concept design may become a successful product here manufacturers will commercialize it worldwide because of its positive upbringing. REFERENCES [1] Fauzi, N.M.A. (2008): Design Of Motorised Scooter (Structure). Kuala Lumpur, Universiti Pertahanan Nasional Malaysia, Skudai, Johor D.T. Universiti Teknologi Malaysia. [2] Crouse, W.H. and Anglin, D.L. (1993): Automotive Mechanics. 10th Edition. New York (USA). McGraw Hill Book Co. 1993.Pg 387-401. [3] Shigley, J.E., Mischke, C.R. and Budynas, R.G. (2004): Mechanical Engineering Design. 7th Edition. New York (USA). McGraw-Hill Education. pp. 394-867.
GLOBAL ENGINEERS & TECHNOLOGISTS REVIEW www.getview.org
L.O.B.A.L E.N.G.I.N.E.E.R.S. .& . .T.E.C.H.N.O.L.O.G.I.S.T.S R.E.V.I.E.W
13
1.0 INTRODUCTION Every electronic circuit is assumed to operate off some supply voltage which is usually assumed to be constant. DC-DC converter is a voltage regulator (a power electronic circuit that maintains a constant output voltage irrespective of changes in load current or line voltage). Many different types of voltage regulators with a variety of control schemes are used. With the increase in circuit complexity and improved technology a more severe requirement for accurate and fast regulation is desired. This has led to need for newer and more reliable design of dc-dc converters. With the advent of digital signal processors, advanced control methodologies through Artificial Intelligence has been applied in most of the industrial applications. Power supplies have emerged as an independent industry which is inevitable in all electrical and electronic components. The practical challenge in most of the SMPS is to design the advanced control strategies to tackle the nonlinearity, stability and uncertainty of parameters. DC-DC converter controllers can be implemented in numerous conventions these includes: Voltage mode control, Current mode control, V2 mode control in analog controllers (Kasat, 2004), Fuzzy Logic Controller (Feng et al., 2003), Neural Network controllers (Kadwane, 2006), Fuzzy-Neural Networks (Rubaai, 2005) & (Rubaai et al., 2005). The Adaptive Neuro-Fuzzy Inference System (ANFIS), developed in the early 90s by Jang (1993), combines the concepts of fuzzy logic and neural networks to form a hybrid intelligent system that enhances the ability to automatically learn and adapt. Hybrid systems have been used by researchers for modelling and predictions in various engineering systems. The basic idea behind these neural-adaptive learning techniques is to provide a method for the fuzzy modelling procedure to learn information about a data set, in order to automatically compute the membership function parameters that best allow the associated FIS to track the given input/output data. The membership function parameters are tuned using a combination of least squares estimation and Back-Propagation algorithm for membership function parameter estimation. These parameters associated with the membership functions will change through the learning process similar to that of a neural network. Their adjustment is facilitated by a gradient vector, which provides a measure of how well the FIS is modelling the input/output data for a given set of parameters. Once the gradient vector is obtained, any of several optimization routines could be applied in order to adjust the parameters so as to reduce error between the actual and desired outputs. This allows the fuzzy system to learn from the data it is modelling. The approach has the advantage over the pure fuzzy
M.M., KANAI1, J.N., NDERU2 and P.K., HINGA3
1, 2, 3 Department of Electrical and Electronic Engineering Jomo Kenyatta University of Agriculture and Technology
P.O Box 62000, Nairobi, KENYA [email protected], [email protected], [email protected]
DESIGN AND ANALYSIS OF NEURAL FUZZY BASED BUCK CONVERTER CONTROLLER OPTIMIZED WITH SWARM
INTELLIGENCE
ABSTRACT
This paper presents an application of Adaptive Neural Fuzzy Inference System (ANFIS) controller for DC-DC (Buck) converter optimized with swarm collective intelligence. First, an adaptive Neuro-Fuzzy controller of the Buck converter is designed and simulated using MATLAB (SIMULINK) package; the ANFIS has the advantage of expert knowledge of the Fuzzy inference system and the learning capability of neural networks. Secondly, the ANFIS is optimized by Particle Swarm optimization methodology. Simulation results demonstrates that the designed ANFIS-Swarm controller realize a good dynamic behavior of the Buck converter, a perfect voltage tracking with smaller overshoot, steady state error and short settling time as well as high robustness than those obtained by traditional ANFIS controller.
Keywords: DC-DC converter, Neural Fuzzy controller, Particle Swarm Optimization (PSO), Adaptive Fuzzy Neural Network.

Global Engineers & Technologist Review, Vol. 1 No.2 (2011)
© 2011 GETview Limited. All rights reserved 14
paradigm that the need for the human operator to tune the system by adjusting the bounds of the membership functions is removed. The PSO (particle swarm optimization) algorithm used to get the optimal values and parameters of our ANFIS is based on a metaphor of social interaction. It searches a space by adjusting the trajectories of individual vectors, called ‘particles’, as they are conceptualized as moving as points in multidimensional space. The individual particles are drawn stochastically towards the positions of their own previous best performances and the best previous performance of their neighbours. Since its inception, two notable improvements have been introduced on the initial PSO which attempt to strike a balance between two conditions. The first one introduced by Shi and Eberhart (1998), uses an extra ‘inertia weight’ term which is used to scale down the velocity of each particle and this term is typically decreased linearly throughout a run. The second version introduced by Clerc and Kennedy (2002), involves a ‘constriction factor’ in which the entire right side of the formula is weighted by a coefficient. Their generalized particle swarm model allows an infinite number of ways in which the balance between exploration and convergence can be controlled. The simplest of these is called Particle Swarm Optimization. This proposes an application of ANFIS-Swarm. PSO algorithms are applied to search the globally optimal parameters of ANFIS controller. The best range and shapes of memberships functions obtained with ANFIS are adjusted again using PSO. Simulation results are given to show the effectiveness of ANFIS-Swarm controller. 2.0 ARTIFICIAL NEURAL NETWORKS
2.1 Buck Converter Circuit Model The Buck converter circuit model is depicted in Figure 1.
Figure 1: Buck converter In this model, Vo is the system output voltage and Vref, is the converter voltage. To obtain the converter state equations in low-frequency state, it is required that the system state be studied in two states of on and off.
2.1.1 Switch ON: , X = A1X + B1Vdc (1)
2.1.2 Switch OFF: where; X = A2X + B2Vdc (2) Now it is required to show the effect of on and off durations of switch in (1) and (2) to obtain the mean values of state equations. X = AX + BVdc where; A = mA1 + (1 - m)A2, B = mB1 + (1 – m)B2 and m = (ton / Ts) (3) 2.2 Adaptive Neuro-Fuzzy Principle A typical architecture of an ANFIS is shown in Figure 2, in which a circle indicates a fixed node, whereas a square indicates an adaptive node. For simplicity, we consider two inputs x, y and one output z. Among many Fuzzy Inference System (FIS) models, the Sugeno fuzzy model is the most widely applied one for its high interpretability and computational efficiency, and built-in optimal and adaptive techniques. For a first order Sugeno fuzzy model, a common rule set with two fuzzy if–then rules can be expressed as: Rule1:if x is A1 and y is B1, then
z1 = pix + q1y + r1 (4)

Global Engineers & Technologist Review, Vol. 1 No.2 (2011)
© 2011 GETview Limited. All rights reserved 15
Rule 2: if x is A2 and y is B2, then z2 = p2x + q2y + r2 (5) Where Ai and Bi are the fuzzy sets in the antecedent, and pi, q1 and r1 are the design parameters that are determined during the training process. As in Figure 2, the ANFIS consists of five layers as stated by Jang (1993): Layer 1: Every node i in the first layer employ a node function given by: , (6) Where μAi and μBi can adopt any fuzzy membership function (MF).
Figure 2: The equivalent ANFIS (type-3 ANFIS) Layer 2: Every node in this layer calculates the firing strength of a rule via multiplication: (7)
Layer 3: The i-th node in this layer calculates the ratio of the i-th rule’s firing strength to the sum of ail rules firing strengths: (8) Where w i is referred to as the normalized firing strengths.
Layer 4: In this layer, every node i has the following function: (9) Where is the output of layer 3, and {pi, qi, ri} is the parameter set. The parameters in this layer are referred to as the consequent parameters.
Layer 5: The single node in this layer computes the overall output as the summation of all incoming signals, which is expressed as: (10) The output z in Figure 1 can be rewritten as: (11)
2.3 Adaptive Neuro-Fuzzy controller Design The ANFIS controller generates change in the reference voltage Vref, based on speed error e and derivate in the speed error de defined as: e = Vref – V (12)

Global Engineers & Technologist Review, Vol. 1 No.2 (2011)
© 2011 GETview Limited. All rights reserved 16
(13) Where Vref, and V are the reference and the actual speeds, respectively. In this study first order Sugeno type fuzzy inference was used for ANFIS and the typical fuzzy rule is: If e is Ai and de is Bi then z = f(e, de) (14) Where Ai and Bi are fuzzy sets in the antecedent and z = f(e, de) is a crisp function in the consequent. 2.4 Particle Swarm Optimization (PSO) PSO is a population-based optimization method first proposed by Kennedy and Eberhart (1995). Some of the attractive features of PSO include the ease of implementation and the fact that no gradient information is required. It can be used to solve a wide array of different optimization problems. Like evolutionary algorithms, PSO technique conducts search using a population of particles, corresponding to individuals. Each particle represents a candidate solution to the problem at hand. In a PSO system, particles change their positions by flying around in a multidimensional search space until computational limitations are exceeded. The PSO technique is an evolutionary computation technique, but it differs from other well-known evolutionary computation algorithms such as the genetic algorithms. Although a population is used for searching the search space, there are no operators inspired by the human DNA procedures applied on the population. Instead, in PSO, the population dynamics simulates a ‘bird flock’s’ behavior, where social sharing of information takes place and individuals can profit from the discoveries and previous experience of all the other companions during the search for food. Thus, each companion, called particle, in the population, which is called swarm, is assumed to ‘fly’ over the search space in order to find promising regions of the landscape. For example, in the minimization case, such regions possess lower function values than other, visited previously. In this context, each particle is treated as a point in a d-dimensional space, which adjusts its own ‘flying’ according to its flying experience as well as the flying experience of other particles (companions). In PSO, a particle is defined as a moving point in hyperspace. For each particle, at the current time step, a record is kept of the position, velocity, and the best position found in the search space so far. The assumption is a basic concept of PSO as stated by Yoshida et al., (2000). In the PSO algorithm, instead of using evolutionary operators such as mutation and crossover, to manipulate algorithms, for a variable optimization problem, a flock of particles are put into the d-dimensional search space with randomly chosen velocities and positions knowing their best values so far (Pbest) and the position in the d-dimensional space. The velocity of each particle, adjusted according to its own flying experience and the other particle’s flying experience. For example, the i-th particle is represented as xi = (xi, 1, xi, 2, ...., xi, d) in the d-dimensional space. The best previous position of the i-th particle is recorded and represented as:
Pbesti = (,Pbesti,1 , Pbesti,2,..., Pbest i, d) (15) The index of best particle among all of the particles in the group is gbestd. The velocity for particle i is represented as vi = (vi, 1, vi, 2, ...., vi, d). The modified velocity and position of each particle can be calculated using the current velocity and the distance from Pbesti,d to gbestd as shown in the following formulas by Gaing (2004): (16) i=1,2 ……n; m=1,2……d (17) Where: n = Number of particles in the group, d = dimension, t = Pointer of iterations (generations), = Velocity of particle I at iteration t, , w = Inertia weight factor, c1 c2 , = Acceleration constant, rand() = Random number between 0 and 1, = Current position of particle i at iterations, Pbesti = Best previous position of the i-th particle, gbest = Best particle among all the particles in the population. Producing initial populations is the first step of PSO. The population is composed of the chromosomes that are real codes. The corresponding evaluation of a population is called the “fitness function”. It is the performance index of a population. The fitness value is bigger, and the performance is better. The fitness function is defined as formulated by Michael (2011):
Global Engineers & Technologist Review, Vol. 1 No.2 (2011)
© 2011 GETview Limited. All rights reserved 17
(18)
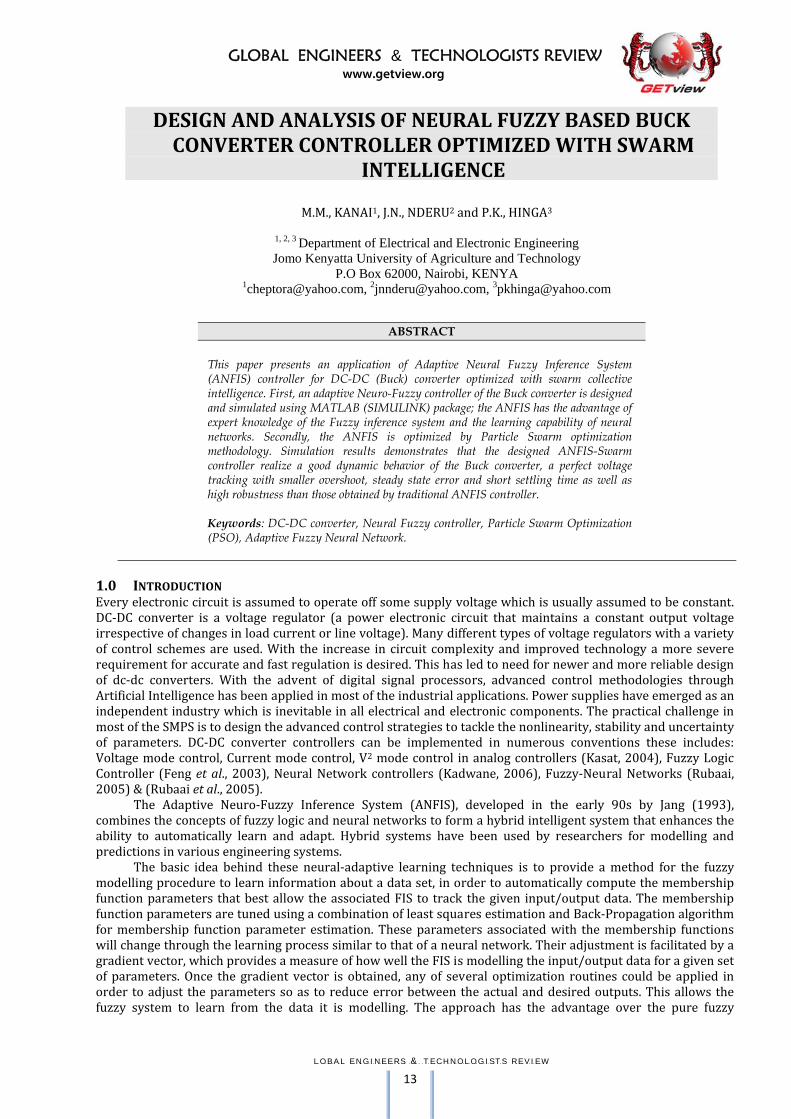
Where, PI is performance index (objective), Ȳi is the desired output and Yi is the actual output and K is training data pairs. After the fitness function is calculated, the fitness value and the number of the generation determine whether the evolution procedure is stopped or not (Maximum iteration number reached?). In the following, calculate the Pbest of each particle and gbest of population (the best movement of all particles). The update the velocity, position, gbest and pbest of particles give a new best position (best chromosome in our proposition). 2.5 Optimal ANFIS Controller Design with PSO In order to obtain good prediction results and reduce the time required to train the proposed ANFIS system, it is important to have optimal design structure. This involves determining the number and type of membership functions for the input that will give the best input/output mapping of the data to be modelled. After numerous tests with a number of membership functions, it was found that five membership functions for both voltage error and change in voltage error gave the best input space to output space mapping with the smallest root mean square error (RMSE). Figure 3 (a) and Figure 4 (a) show initial membership functions, while Figure 3 (b) and Figure 4 (b) show optimized membership function (MF) of error (e) and change in error (de) after training.
(a) (b) Figure 3: Error MFs (a) before training (b) after training.
(a) (b) Figure 4: Change in error MFs (a) before training (b) after training.
3.0 EXPERIMENTAL RESULTS 3.1 Soft Start The presented controller configuration has an additional advantage that it provides a soft start. During start-up transient, the error signal is limited to its maximum value and the duty ratio slowly increases from zero toward the steady-state value.Three different controllers are designed for the computer simulation. First, the ANFIS Controller with parameters adjusted with Back Propagation (ANFIS-BP) is designed. Second, the ANFIS-HB is designed based on the Hybrid optimization method to find the optimal range of the membership functions. After that, the optimal fuzzy controller (ANFIS) is designed based on the PSO to search the optimal range of the membership functions (ANFIS-PSO). The reference output voltage is 5V. The simulation results are obtained for 1 millisecond range. The voltage response of Open Loop (without any controller), ANFIS-BP Controller, ANFIS-HB and the optimal ANFIS controller using PSO (ANFIS-PSO) are shown in Figure 5. From the results, steady state error equal zero in the three controllers, the overshoot value is 0% in the ANFIS-PSO Controller, 5.301 % in ANFIS-HB and 5.534% in ANFIS-BP controllers. It can also be observed the ANFIS-PSO controller

Global Engineers & Technologist Review, Vol. 1 No.2 (2011)
© 2011 GETview Limited. All rights reserved 18
ensures that the output voltage settles at minimal time of 0.2 milliseconds. In this work, the intelligent controller based on ANFIS-PSO optimization gives a better agreement with the step reference voltage (start-up). The computer MATLAB simulation demonstrates that the ANFIS controller associated to the Swarm intelligence possesses good robustness.
Figure 5: Simulation result for startup output voltage performance. 3.2 Load Transient In second test, load transient experimental results for the output load changes from 2.5Ω to 5Ω (100 % load change) at 7 ms and back to 2.5 Ω at 8 ms are shown in Figures 6 and 7. Figure 7 shows response in open loop condition, as demonstrated the output voltage ripples are beyond design specification of 50mV and output current ripple design specification of 0.5A. From the graph, the output voltage goes beyond 5.1 V and 4.8V which is way far bigger than +/-50mV from 5V design requirement.
Figure 6: Output voltage, current and duty cycle for load perturbations in Open loop. From Figures 7 to 9 it can be observed that the output voltage variations during transients have no oscillations with ANFIS-PSO controller while the other two controllers display oscillations before it settles.
Figure 7: Output voltage, output current and duty cycle response for load perturbations with ANFIS-PSO controller.

Global Engineers & Technologist Review, Vol. 1 No.2 (2011)
© 2011 GETview Limited. All rights reserved 19
The output voltage and current settles inside the +/-50 mV range in less than 1ms for ANFIS-PSO, 1.3ms for ANFIS-HB and 1.5ms for ANFIS-BP controllers. It is noted that better tracking performance is achieved at all times with ANFIS-PSO controller.
Figure 8: Output voltage, output current and duty cycle response for load perturbation with ANFIS-HB controller.
Figure 9: Output voltage, output current and duty cycle response for load perturbations with ANFIS-BP controller.
3.3 Line Transients. In third test, the input voltage is varied from 12 V (nominal voltage) to 14 V and back to 12 V between 1 ms and 1.1 ms. In the time period between 1.4 ms and 1.5 ms the input voltage is varied from 12 V to 10 V. Again at the time period 1.8 ms and 1.9 ms the input voltage is varied from 12 V to 15.5 V (maximum allowed by design). All this variations are shown in Figures 10 to 14. Figure 10 shows the response of the system when there is no controller; the system overshoots and takes quite a long time to settle at desired reference voltage (5V). It is observed from Figure 11 that the ANFIS-PSO controller maintains the output voltage at its reference value 5V with slight overshoot and reduced ripples.
Figure 10: Input voltage, output voltage behavior, output current and duty cycle input voltage perturbations with open loop.
Global Engineers & Technologist Review, Vol. 1 No.2 (2011)
© 2011 GETview Limited. All rights reserved 20
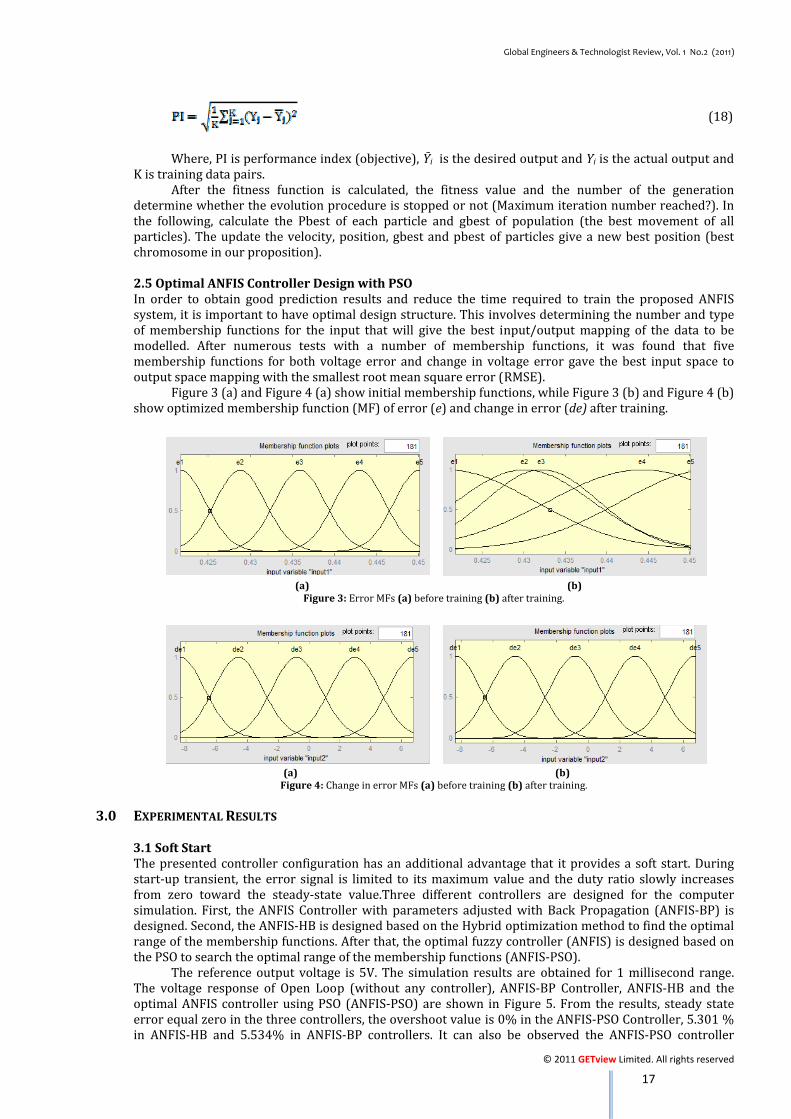
Figure 11: Input voltage, output voltage behavior, output current and duty cycle for input voltage perturbations with ANFIS-PSO.
Figure 12: Input voltage, output voltage behavior, output current and duty cycle for input voltage perturbations with ANFIS-HB. Figure 13: Input voltage, output voltage behavior, output current and duty cycle for input voltage perturbations with ANFIS-BP.
Figure 14: Comparison of the three controller performances.

Global Engineers & Technologist Review, Vol. 1 No.2 (2011)
© 2011 GETview Limited. All rights reserved 21
Figure 13 shows the output of the ANFIS-BP controller that has an error that is way above the designed maximum ripple voltage of 50Mv. Clearly, the proposed adaptive-fuzzy inference control system reduces both overshoot and extent of oscillations. As displayed in Figure 14 comparison of the three controllers in terms of output voltage, output current and duty cycle; ANFIS-PSO controller displays the best performance. 4.0 CONCLUSION In this paper, the optimal ANFIS controller is designed using Particle Swarm Optimization Algorithm. The voltage of buck converter is controlled by means of three different controllers. According to the results , the ANFIS-PSO is the best controller which presents satisfactory performances and possesses good robustness (minimal overshoot, minimal settling time and zero steady state error).The traditional ANFIS has problems to do with derivative-based learning algorithms which can convergence prematurely (local minimum/maximum) and are relatively slower. The proposed controller (ANFIS-PSO Controller) gives better results in form of rise time, overshoot, settling time and steady state error i.e. the controller is adaptive and possesses good robustness.
REFERENCES [1] Rubaai, A. (2005): Hardware Implementation of an Adaptive Network-Based Fuzzy Controller for DC–DC Converters. IEEE Transaction Industry Applications, Vol.41 No.6, pp 1557-1565. [2] Rubaai, A., Ofoli, A.R., Burge, L.III. and Garuba, M. (2005): Hardware Implementation of an Adaptive Network-based Fuzzy Controller For DC-DC Converters. IEEE Transactions on Industry Applications, Vol.41 No.6, pp. 1557-1565. [3] Clerc M. and Kennedy J. (2002): The Particle Swarm-Explosion, Stability, and Convergence in a Multidimensional Complex Space. IEEE Trans. Evolutionary Computation, Vol. 6 No.1, pp. 58-73. [4] Gaing, Z. (2004): A Particle Swarm Optimization Approach for Optimum Design of PID Controller in AVR System. IEEE Trans. Energy Conversion, Vol. 19 No.2, pp. 384-391. [5] Feng, G., Zhang, W. and Liu, Y.F. (2003): An Adaptive Current Mode Fuzzy Logic Controller for DC-to-DC Converters. Applied Power Electronics Conference and Exposition, 2003. APEC '03. Eighteenth Annual IEEE, Vol.2, pp.983-989 (9-13 February 2003). [6] Jang, J.-S.R. (1993): Adaptive-Network-based Fuzzy Inference System. IEEE Transactions on Systems, Man
and Cybernetics, Vol. 23, No. 3, pp. 665 –685. [7] Kadwane, S.G. (2006): Online Trained Simulation and DSP Implementation of Dynamic Back Propagation Neural Network for Buck Converter. ACSE Journal, Vol.6 No.1, pp.27-34 [8] Michael, K.M. (2011): Design and Analysis of Neural Fuzzy Based DC-DC Converter Controller Optimized with Swarm Intelligence. Master’s Thesis. Department of Electrical and Electronic Engineering, JKUAT, Kenya. [9] Kennedy, J. and Eberhart, R. (1995): Particle Swarm Optimization. Proc. IEEE Int. Conf. on Neural Network, Perth, Vol. 6, pp. 1942-1948 (27 November – 1 December 1995). [10] Kasat, S. (2004): Analysis, Design and Modeling of DC-DC Converter using Simulink. Master’s Thesis, Institute of Engineering and Technology Indore, Madhya Pradesh State India. [11] Shi, Y. and Eberhart, R. (1998): A Modified Particle Swarm Optimizer. Proc. Int. Conf. on Evolutionary Computation–The IEEE World Congress on Computational Intelligence, Anchorage, pp. 69-73. (4-9 May 1998) [12] Yoshida, H., Kawata, K., Fukuyama, Y., Takayama, S. and Nakanishi, Y. (2000): A Particle Swarm Optimization for Reactive Power and Voltage Control Considering Voltage Security Assessment .IEEE Transactions on Power Systems, Vol.15 No.4, pp. 1232-1239.

GLOBAL ENGINEERS & TECHNOLOGISTS REVIEW www.getview.org
G.L.O.B.A.L E.N.G.I.N.E.E.R.S. .& .-.T.E.C.H.N.O.L.O.G.I.S.T.S R.E.V.I.E.W 22
M., SURESH1, A. SHOHAIMI2, N., FARIQ3, N.Z., NIK ZAMIRI4, M.S., RISBY5, A., ANIZAH, S., HITLER7 and K., ASYIKIN8
1, 2, 3, 5, 8 Faculty of Engineering National Defence University of Malaysia
Kem Sungai Besi, 57000 Kuala Lumpur, MALAYSIA [email protected]
4, 6, 7 Team Flash One
KOR 95, Rejimen Semboyang Diraja Kem Sungai Besi, 57000 Kuala Lumpur, MALAYSIA
1.0 INTRODUCTION The military armored vehicle type A uses “Signaals On Board Two Wire Audio System” (SOTAS) for the communication between the tanks and the SOTAS is controlled by the Central Switch Box (CS Box). Figure 1 (a) shows the CS Box and Figure 1 (b) shows the schematic diagram of a SOTAS system. (a) (b)
Figure 1: (a) CS box (b) Schematic diagram of SOTAS system.
ABSTRACT
“SIGNAALS” On Board Two Wire Audio System (SOTAS) is a system that allows internal communication between crew members carried out in the Vehicle Type-A (A VECH) through the intercom and radio set. SOTAS is controlled by the main equipment, known as the Central Switch Box (CS Box). In the event of damage to the CS box in the vehicle, it should be removed and further diagnosis should be made in the workshop. The usual diagnosis process requires the use of a multimeter which raises the following issues such as time consuming in fault diagnosis process, short-circuit occurrence, and inability to execute quality test. This paper proposes the new methodology for the fault detections that have been prototyped and given name as Central Switch Box Tester (CSBT). Keywords: A-Vehicle, Communication Switch Box, Fault Detection, Tester.
CENTRAL SWITCH BOX TESTER: A NEW METHODOLOGY IN FAULT DETECTION FOR THE COMMUNICATION BOX BETWEEN
THE ARMY’S TYPE A-VEHICLEA

Global Engineers & Technologist Review, Vol. 1 No.2 (2011)
© 2011 GETview Limited. All rights reserved 23
Built in Test (BIT) is embedded in the SOTAS system in order to check the functionality of the system. However, the embedded BIT is not sufficient enough as it cannot provide the information on the system fault. Hence the technician has to dismantle the whole SOTAS system including the CS Box, Crew box (C Box) as shown in Figure 1 (a) in order to identify the fault occurrences. In SOTAS system, the CS Box is the main motherboard for the communication set and its malfunction will affect the functionality of the armored vehicle type A. The CS box needs to be repaired as soon as possible in order to keep the armored vehicle always in standby mode for any kind of peace keeping operations. In the mid of 2009, the 95 RSD department received 82 faulty CS Box for repairing. All the faulty CS Box were dismantled and brought to the workshop for further fault diagnosis and repairs. In military, this situation is considered very bad as it have impact on the artillery logistics which can jeopardize the national security and military operations. The fault detection of one CS Box requires nearly an hour as there are 266 pins on the motherboard to be tested using a multimeter. Figure 2 (a) shows the fault diagnosis using the multimeter. (a) (b)
Figure 2: (a) Fault diagnosis using a multimeter (b) The prototype of CS box tester. Furthermore, all the pins on the CS Box as shown in Figure 2 (a) are close by to each other add up to the diagnosis time and process due to the higher chances of having short-circuit faults. Even a single short-circuit occurrences due to the technician’s fault can cost a fortune as the whole motherboard will not be able to be used again. Another drawback due to the usage of multimeter in fault diagnosis will be the inability to execute quality test after the CS Box being repaired. This is due to the voltage drop test that cannot be executed using a multimeter. The CS Box Tester was introduced in order to overcome the drawbacks of the multimeter in fault diagnosis and the tester also saves time in diagnosis as well as able to execute quality test. Figure 2 (b) shows the CS box tester. 2.0 METHODOLOGY Technician’s experience handling the diagnosis and faults contributed lot in the process of designing the CSBT. Figure 3 (a) shows the electrical schematic diagram for the CS Box. (a) (b)
Figure 3: (a) Electrical schematic for CS box (b) Schematic diagram for the invited CSBT
Global Engineers & Technologist Review, Vol. 1 No.2 (2011)
© 2011 GETview Limited. All rights reserved 24
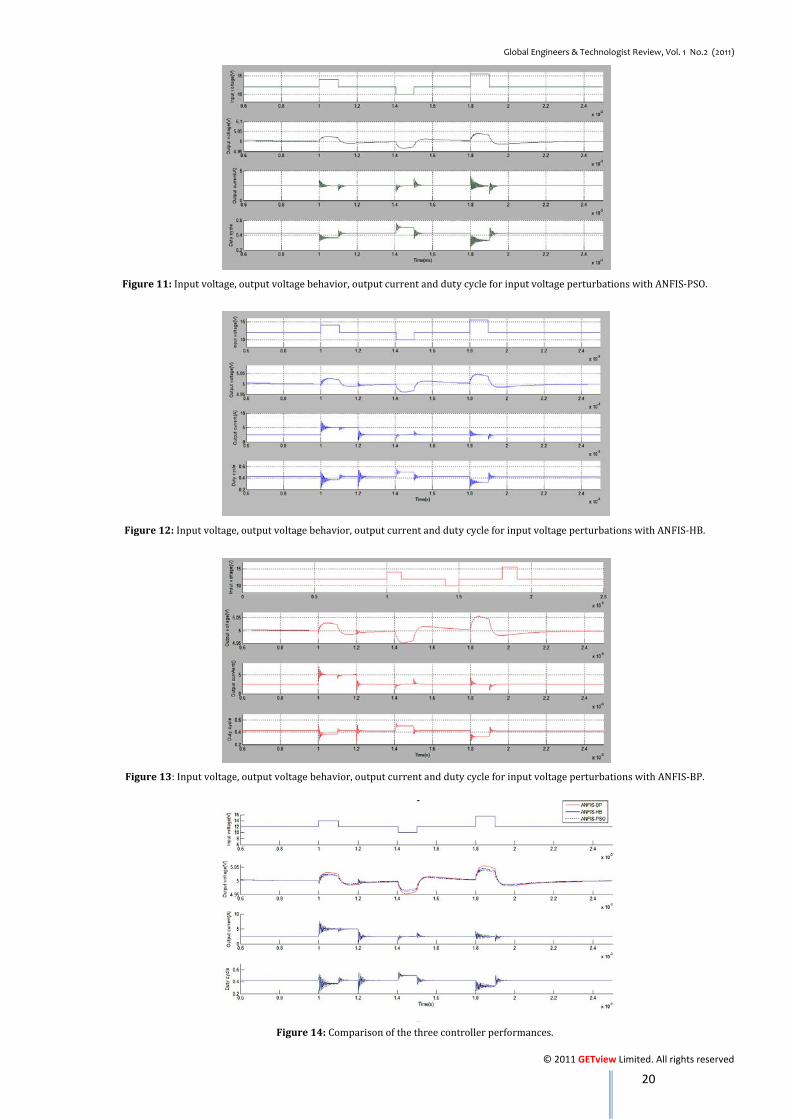
Table 1: Corresponding voltages with the respective colours. Voltage Output Colour+60 V Blue+24 V Yellow+5 V Green-5 V Red The CS Box consist of three major parts with the first stage as an input supply of 24Vdc from the battery and this stage also consist of reverse polarity protection circuit to protect the motherboard. The second stage of the CS motherboard known as the primary stage consists of switch mode power supply (SMPS) and controller. While the third stage of the motherboard known as secondary stage and provide the necessary voltage output for the power supply unit (PSU). There are four different voltage outputs from this unit that later part will be used for the fault diagnosis in the CSBT. The first two output used for the logic circuits of +5V and -5V, while +24V output for the control boxes and +60V for the ringing field telephone & extercom interface. As this third stage provides the different voltages, the prototyped CSBT will be able to detect these voltage outputs and identify the fault occurrences. These can be achieved as any of the LED is not light up when tested indicates the faulty line voltages as shown in Figure 3 (b). By reverse track using Figure 3 (a), the technician will be able to locate the faulty components. Figure 3 (a) shows that, when the LED for +24V as in Figure 2 (b) and Figure 3 (b) indicates fault, the faulty components lies on the rectification circuit which coloured in yellow lines. It saves the time for fault diagnosis that normally done by the technician using multimeter. Table 1 explains the coloured lines and their respective voltages.
(a) (b)
Figure 4: (a) CSBT connected to the CS box (b) Current flows in the CSBT. The CSBT is connected to the CS Box through a cable at the power supply unit (PSU) outlet of the CS Box as shown in Figure 4 (a). For the fault diagnosis, each voltage level will be diagnosed through the respective LED’s, and Table 2 summarizes the results of the diagnosis. The quality control test also can be conducted using the CSBT whereby the Crew Box (C Box) and Commander Control Box (CC Box) impedances were modelled into CSBT for the quality test purposes. This is to make CSBT as all in one tester for CS Box as well as a portable one that can be brought to the site easily. Figure 4 (b) shows how the current flows for each test and clearly indicate the working principle of the CSBT. Table 2: Summary of the fault diagnosis result.
Voltage Output LED Status (Refer Figure 3 (a) for Fault Diagnosis)LED ON LED OFF+60 V 1 Ok Components on blue lines faulty+24 V 2 Ok Components on yellow lines faulty+5 V 3 Ok Components on green lines faulty-5 V 4 Ok Components on red lines faultyCC 5 Ok Components on CC faultyC 6 Ok Components on C faultyRC 7 Ok Components on RC faulty
)test( T ALL CSBT Ok Faulty CSBT CSBT works with a very simple principle, when there’s no fault on the CS Box for any tested voltage all the stated LED will be functional as normal stated in the Table 2. For an example if there’s a faulty component on the Yellow Line, the CS Box would not be able to supply +24V, hence the LED on the tester for that particular voltage would not be able to function. From this simple indication, the technician would be able to identify that there’s a

Global Engineers & Technologist Review, Vol. 1 No.2 (2011)
© 2011 GETview Limited. All rights reserved 25
faulty component on that respective line. These simple test procedures were done using CSBT for the rest voltage lines and for the quality test too. Test (T) in the CSBT as in Figure 10, function as a test for CSBT functionality prior to connection to the CS Box. The display in Figure 10 displays the voltage measurement (+60V, +24V, +5V or -5V). 3.0 RESULTS AND DISCUSSION CSBT is prototyped using 98 % of available resources (recycle items) whereby only display meter and labelling had to be additionally acquired. Table 3 distinguishes the saving in terms of cost using CSBT instead of conventional multimeter. From the Table 3, costing can be saved up to 82 % from the cost of a new multimeter. Prior to the development of CSBT, the fault diagnosis process for CS Box carried out using multimeter. The test technique has high risk of short-circuit for CS Motherboard which would cost RM 11,000.00 for a module. By using CSBT, the safety features in the design allows to lower this risk. This in return reduces the operation expenditure faced by the Malaysian Army.
Table 3: Comparison for cost, times and productivity before and after invention. Type Cost, RM Time, Minutes Productivity, Minutes
*for 73 units of CS box. Before Innovation
(Multimeter) 500.00 60 4380 After Innovation
(CSBT) 90.00 15 1095 Saving & Advantages 410.00 45 3285 CSBT is also an easy handling tester as it is light weight and portable. These features enable the tester to be used either in the workshop or even in the armored vehicle Type A. While using the multimeter as a test apparatus the technician need to use both hands for diagnosis and at the same time refer to the test procedure manual, read the multimeter’s readings and the accuracy of the probe need to be monitored to prevent from short circuit. In contrary, using CSBT the technician just need to choose the switches for the fault diagnosis and need not to worry about short circuit problems. Handling CSBT is very simple and does not need specific training modules. Besides that, using CSBT saves time in fault diagnosis of the CS Box. Table 3 shows the comparison of time taken for fault diagnosis using both apparatus. The usage of CSBT shows clear advantage as 75 % of diagnosis time saved compared to the usage of a multimeter. In other word, CSBT able to increase the productivity rate as it indirectly fasten the repairing time. Table 3 shows a sample of case study done using CSBT in the KOR 95 workshop. It clearly proves the increase in the work efficiency and indirectly prepares the communication set for the armored vehicle type A in standby mode for any upcoming peace keeping operations. CSBT not only saves time, increase productivity and cost saving, but it also have a huge commercialized value. This is due to the CS Box have already been deployed in the Malaysian Arm Forces as many as 300 units and also available in more than 30 countries with 20, 000 existing units. Hence CSBT being the pioneer and one of a kind have a bright future in the defence industry as a one stop tester for the CS Box in the armored vehicle type A.
4.0 CONCLUSION Overall the developed prototyped CSBT have been tested in the workshop to ensure its functionality and it also has been used by the 4th Squadron RSD (Mek) for the testing of the CS Box in the armored vehicle type A. In addition the CSBT also have functioned as one of the test apparatus for the Final Acceptance Test on the armored vehicle type A for the 19th Rejimen Askar Melayu Diraja (RAMD) and 1st Kor Armor Diraja (KAD). Yet there are still room for improvement in context to CSBT in terms of fault diagnosis up to the component level and also integrated CSBT which can also diagnosis fault occurrences on the C Box and CC Box too. CSBT can be concluded as the next generation tester for the fault detection in the communication box between the army’s type A-vehicle replacing the conventional multimeter. REFERENCES [1] Central Switch Box & SIGNAAL Handbook of Operation. [2] Robbins, A.H. and Miller, W.C. (2006): Circuit Analysis: Theory and Practical. Delmar Cengage Learning, 4 edition. [3] Steyaert, M., Van Roermund, A.H.M. and Johan, H.H. (2006). Analog Circuit Design. Springer, Dordrecht, The Netherlans.
GLOBAL ENGINEERS & TECHNOLOGISTS REVIEW www.getview.org
G.L.O.B.A.L E.N.G.I.N.E.E.R.S. .& .-.T.E.C.H.N.O.L.O.G.I.S.T.S R.E.V.I.E.W 26
NORAIHAM MOHAMAD1, ANDANASTUTI MUCHATAR2, MARIYAM JAMEELAH GHAZALI3, DAHLAN MOHD4 and CHE HUSNA AZHARI5
1 Faculty of Manufacturing Engineering Universiti Teknikal Malaysia Melaka
Hang Tuah Jaya, 76100 Durian Tunggal, Melaka, MALAYSIA [email protected]
2, 3, 5 Faculty of Engineering
Universiti Kebangsaan Malaysia 43600 Bangi, Selangor, MALAYSIA
4 Malaysia Nuclear Agency
43600 Bangi, Selangor, MALAYSIA
1.0 INTRODUCTION Much research has been carried out in the development of nano-filled composites through the incorporation of nano-scale materials such as ceramics and carbon in polymer matrix. For instance organoclays (Teh et al., 2004), carbon nanotubes (Shanmugharaj et al., 2007), alumina nanoparticles (Siegel et al., 2001) and silica nanoparticles (Park et al., 2005) have been added to polymers. Polymer nanocomposites exhibit unique properties even by the addition of a low weight percent nanofillers (<5 wt. %), that cannot be obtained from conventional or micro-scale fillers (López-Manchado et al., 2007). The incorporation of nanofillers enhances mechanical, electrical, optical and other properties of polymer composites without sacrificing too much of the needed properties such as toughness being traded for stiffness as that found in rubber filled carbon fibres (Ajayan et al., 2003). Several polymers have been used for preparing polymer nanocomposites such as elastomers (natural rubber (NR) (Peng et al., 2007) & (Vu et al., 2001), epoxidized natural rubber (ENR) (Teh et al., 2004) & (Varghese et al., 2003), styrene-butadiene rubber (SBR) (Ahankari et al., 2008) & (Falco et al., 2007), chloroprene rubber (CR) (Das et al., 2008), ethylene propylene diene monomer rubber (EPDM) (Chang et al., 2007) etc.), thermoplastics (nylon 6 (Ajayan et al., 2003), polypropylene (PP) (Kalaitzidou et al., 2007) & (Hasan et al., 2007), polyethylene terephthalate (PET) (Bhimaraj et al., 2005), polymetylmetacrylate (PMMA) (Costache et al., 2006), polycarbonate (Chandra et al., 2008) & (Eitan et al., 2006) etc.), and polymer blends (Kontopoulou et al., 2007) & (Arroyo et al., 2006). The development of polymer-ceramic nanocomposites has created a number of technologies and opportunities that can be applied to ENR. In a previous research by Teh et al. (2004), ENR was used as a compatibilizer in producing natural rubber-organoclay nanocomposites. Organoclay can be easily dispersed in
ABSTRACT
This paper examined the effect of alumina nanoparticles to the impact strength of ENR and emphasis on morphological characteristics of the materials. Epoxidized natural rubber-alumina nanoparticle composites (ENRAN) was successfully prepared through direct melt compounding process using an internal mixer. It was cured by sulphur semi efficient curing system using a hot press. Loading of alumina nanoparticles in the epoxidized natural rubber (ENR) matrix were varied from 10, 20, 30, 40, 50 to 60 phr. Izod impact test was performed on samples and fracture surfaces were directly examined under Scanning Electron Microscope (SEM). The impact strength decreased with increased filler loading. The composites were observed to fail in moderately brittle fracture due to frozen state by liquid nitrogen and embrittlement effect of hard alumina as the ratio of filler to matrix increased. Energy absorption by filler pull-out suppressed the mechanism of matrix yielding and matrix cracking. The decrease in matrix to filler ratio and the increase in agglomeration and crosslink density had contributed to the diminishing impact strength of the composites. Keywords: Rubber, Alumina, Impact Fracture, Energy Absorption Mechanism, Morphology.
INVESTIGATION ON IMPACT FRACTURE OF EPOXIDIZED NATURAL RUBBER-ALUMINA NANOPARTICLE COMPOSITES
(ENRAN)

Global Engineers & Technologist Review, Vol. 1 No.2 (2011)
© 2011 GETview Limited. All rights reserved 27
polar polymers when compared to non-polar polymers such as NR (Teh et al., 2004). ENR is miscible with more polar polymers (Ismail et al., 1998) therefore offering unique properties such as good oil resistance, low gas permeability, a higher wet grip, rolling resistance, and a higher tensile strength. The oil resistance of ENR 50 vulcanizate is reported to almost meet the characteristics of medium-acrylonitrile-content nitrile rubber and also surpasses that of CR (Ismail et al., 1998). The resistance to air permeability of ENR 50 is also claimed to be comparable to butyl rubber and medium-acrylonitrile-content nitrile rubber (Ismail et al., 1998). Alumina has been recognized as a structural material with an extremely high melting point (2050 °C), a high degree of hardness, and is capable in taking on diverse shapes and functions (Noboru, 1987). The potential of polymer filled alumina nanoparticle composites in wear and tribology, optical and electrical have been studied by some researchers (Bhimaraj et al., 2005), (Chandra et al., 2008) & (Gatos et al., 2007). The incorporation of nano-scaled alumina in PP has improved the mechanical properties of the polymer composites (Jung et al., 2006) and increased the wear resistance of PET filled alumina nanoparticles by nearly two times over the unfilled polymer (Bhimaraj et al., 2005). There have also been several reports of improved ductility and toughness in brittle thermoset polymers due to the addition of alumina nanoparticles (Ash et al., 2002) & (Ash et al., 2004). In our previous study (Mohamad et al., 2008), the addition of alumina nanoparticles in ENR has proven to accelerate the curing process to 40m% and has also increased the tensile modulus at 100 % and 300 % elongation up to 100 % compared to unfilled ENR. The ability of nanofillers to improve the tensile properties especially in modulus and strength when added at relatively low levels (~ 5 wt. %) to thermosets and thermoplastics has been well documented and reviewed (Ajayan et al., 2003), (Arroyo et al., 2006) & (Chen and Evans, 2008). However, the effect of fillers on toughness, particularly toughness as measured by pendulum impact tester is rather uncertain. Chen & Evans (2008) has listed down several studies which have shown reduction in unnotched impact strength of nanocomposites with increasing filler content. Moreover, they addressed the issue of why most researchers were trying to avoid the use of impact tests in determining the toughness of their nanocomposites except by referring the value of tensile elongation at break of the materials (Mohd Yuhazri et al., 2011). Besides avoiding impact tests due to their ambiguities such as unstable crack growth, wide range of energy sinks and ill-defined notch radius (Chen and Evans, 2008), researchers pay less attention to use the impact tester due to the physical characteristic of the materials to be tested. The nature of rubber based nanocomposites at room temperature which are soft and flexible, make utilization of conventional pendulum impact tester to determine toughness appear somewhat impossible. This is evidence by less documented studies on this particular area. However, in this work we studied the impact strength and morphology focusing on the effect of fillers content to the hardened rubber composites; epoxidized natural rubber-alumina nanocomposites. In this study brittle fracture is induced on the samples, so then, the ability of the materials to absorb energy under severe condition is observed. The mechanism involved in energy absorption of the impact failures will reveal the factors contributing to the failure as well as being a good indicator of matrix-filler interaction of the materials. 2.0 METHODOLOGY
2.1 Materials Table 1 shows the formulation used in this study. In these recipes, the content of alumina nanoparticles was varied from 10, 20, 30, 40, 50 to 60 phr whereas the rubber and other ingredients were kept constant. Epoxidized natural rubber was supplied by the Malaysian Rubber Board under the trade name ENR 50 with 53 % epoxidization. The Mooney viscosities measured at ML (1 + 4) 100 °C was 85.5. Alumina nanoparticles were obtained from Nanostructured & Amorphous Materials Inc., USA with size ranging from 30 to 80 nm. Sulphur, zinc oxide, and stearic acid were purchased from Systerm/Classic Chemicals Sdn Bhd, Tetramethylthiuram disulfide (TMTD) from Aldrich Chemistry and other chemicals such as N-cyclohexylbenthiazyl sulphenamide (CBS) and N-(1,3-Dimethylbutyl)-N'-phenyl-p-phenylenediamine (6PPD) were supplied by Flexsys America, USA. 2.2 Mixing & Cure Characteristics The compounding process was performed according to ASTM D-3192 and carried out using an internal mixer (Haake) working at 90°C and a rotor speed of 60rpm for 6 min (Mohamad et al., 2009). Firstly, ENR was masticated for 1 min before all ingredients except sulphur were added and mixed for another 4 min. Finally, sulphur was added and mixed for about 1 min before the mixture was dumped and cooled down to room temperature. From this stock, unvulcanised samples were cured using a semi efficient vulcanisation (EV) system in a hot press at 150 °C at the respective cure times, t90 which was derived from rheometer tests in previous study (Mohamad et al., 2008).

Global Engineers & Technologist Review, Vol. 1 No.2 (2011)
© 2011 GETview Limited. All rights reserved 28
Table 1: Coding of samples and their formulation INGREDIENTS LOADINGS (phr)a ENR0 ENRAN10 ENRAN20 ENRAN30 ENRAN40 ENRAN50 ENRAN60 ENR 50 100 100 100 100 100 100 100 Sulphur 1.6 1.6 1.6 1.6 1.6 1.6 1.6 Zinc oxide 2.0 2.0 2.0 2.0 2.0 2.0 2.0 Stearic acid 1.5 1.5 1.5 1.5 1.5 1.5 1.5 CBSb 1.9 1.9 1.9 1.9 1.9 1.9 1.9 TMTDc 0.9 0.9 0.9 0.9 0.9 0.9 0.9 6PPDd 2.0 2.0 2.0 2.0 2.0 2.0 2.0 Alumina 0 10 20 30 40 50 60 NOTE: a Parts per hundred rubber, b N-cyclohexylbenthiazyl sulphenamide, c Tetramethylthiuram disulfide d N-(1,3-Dimethylbutyl)-N'-phenyl-p-phenylenediamine
2.3 Impact Testing Samples prepared according to ASTM D 256 as shown in Figure 1 were tested for impact strength for un-notched Izod pendulum impact resistance using a CEAST impact tester. They were dipped into liquid nitrogen for 1 min before the samples were clamped to the machine and stroked by a pendulum at an energy level of 4 J. All tests were conducted at room temperature (27 °C). The temperature of each samples ware approximately -5 °C due to the thermal equilibrium with liquid nitrogen.
Figure 1: Sample for un-notched Izod impact test. 2.4 Scanning Electron Microscope (SEM) The examination of the impact fracture surfaces were carried out using a scanning electron microscope (ZEISS EVO 50) at magnifications of 500x and 10 000x. For every sample, a minimum of three micrographs at each magnification were taken to ensure a high confidence level in the analysis. The fractograph was observed and the morphologhy was analysed qualitatively. The micrographs were captured under variable pressure. 2.5 Field Emission Scanning Electron Microscope (FESEM) The ENRAN for 10 and 60 phr were examined under FESEM (ZEISS SUPRA 55VP). Samples were cut using a scissor and the fracture surfaces were gold coated using a gold sputter. The step is to reduce charging effect of non-metallic samples. The samples were observed under secondary electron at 15 kV (Zakaria, 2002). Point analysis was conducted on the samples using an energy-dispersive X-ray spectrometer (EDX) to identify different phases of ENRAN.
3.0 RESULTS AND DISCUSSION
3.1 Impact Strength Figure 2 shows the effect of filler loading in ENRAN to the impact strength relative to matrix percentage. The impact strength decreases with increasing alumina loading in the ENR matrix. A sharp decrease in impact strength was observed when the filler was added to ENR matrix until 20 phr. This was followed by less significant changes in impact strength as filler loading were added in ENRAN up to 60 phr. Reduction of impact strength by 10 percent and 29 percent was observed when the ENR matrix filled with 10 phr and 60 phr filler if compared to matrix without fillers, ENR0. However, the error bar in Figure 2 shows the reduction in impact strength between 20 to 60 phr loading was less significant. The applied load in impact testing was more localized and took place at a very specific area rather than load by tension which would be experienced by whole parts of the sample. In this study, the reduction observed in impact strength was consistent with the decline in the elongation at break, EB values obtained in previous study (Mohamad et
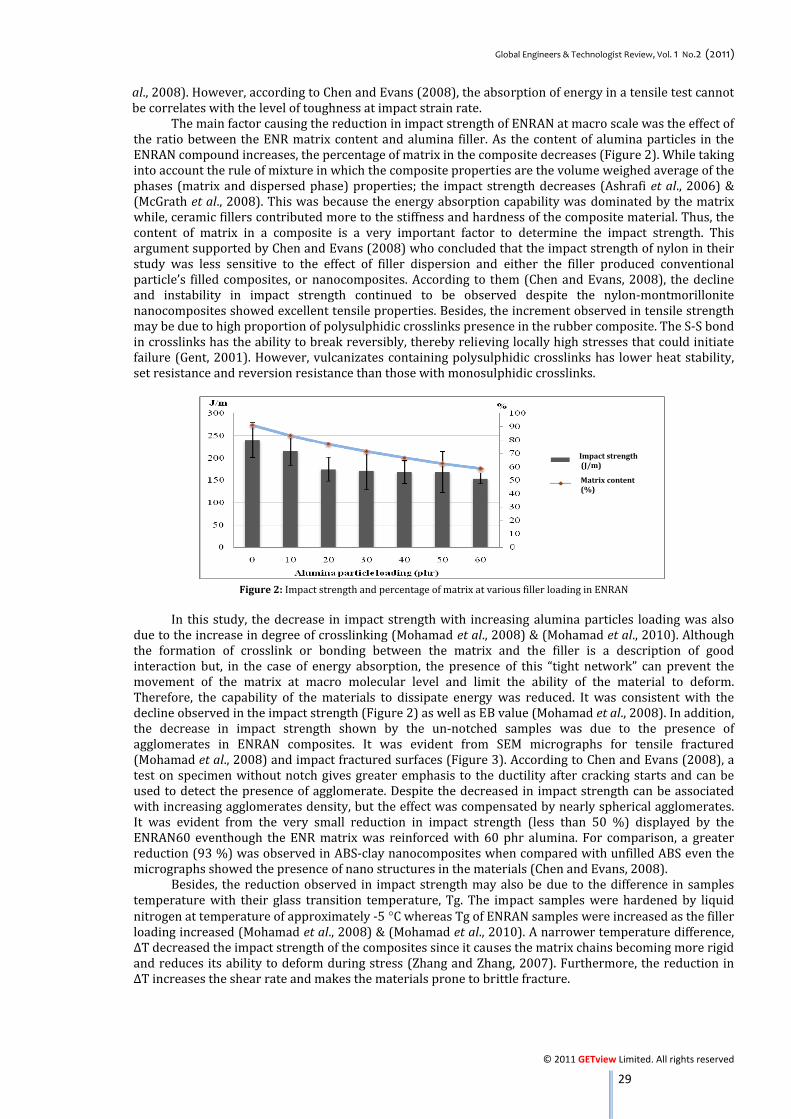
Global Engineers & Technologist Review, Vol. 1 No.2 (2011)
© 2011 GETview Limited. All rights reserved 29
al., 2008). However, according to Chen and Evans (2008), the absorption of energy in a tensile test cannot be correlates with the level of toughness at impact strain rate. The main factor causing the reduction in impact strength of ENRAN at macro scale was the effect of the ratio between the ENR matrix content and alumina filler. As the content of alumina particles in the ENRAN compound increases, the percentage of matrix in the composite decreases (Figure 2). While taking into account the rule of mixture in which the composite properties are the volume weighed average of the phases (matrix and dispersed phase) properties; the impact strength decreases (Ashrafi et al., 2006) & (McGrath et al., 2008). This was because the energy absorption capability was dominated by the matrix while, ceramic fillers contributed more to the stiffness and hardness of the composite material. Thus, the content of matrix in a composite is a very important factor to determine the impact strength. This argument supported by Chen and Evans (2008) who concluded that the impact strength of nylon in their study was less sensitive to the effect of filler dispersion and either the filler produced conventional particle’s filled composites, or nanocomposites. According to them (Chen and Evans, 2008), the decline and instability in impact strength continued to be observed despite the nylon-montmorillonite nanocomposites showed excellent tensile properties. Besides, the increment observed in tensile strength may be due to high proportion of polysulphidic crosslinks presence in the rubber composite. The S-S bond in crosslinks has the ability to break reversibly, thereby relieving locally high stresses that could initiate failure (Gent, 2001). However, vulcanizates containing polysulphidic crosslinks has lower heat stability, set resistance and reversion resistance than those with monosulphidic crosslinks.
Figure 2: Impact strength and percentage of matrix at various filler loading in ENRAN In this study, the decrease in impact strength with increasing alumina particles loading was also due to the increase in degree of crosslinking (Mohamad et al., 2008) & (Mohamad et al., 2010). Although the formation of crosslink or bonding between the matrix and the filler is a description of good interaction but, in the case of energy absorption, the presence of this “tight network” can prevent the movement of the matrix at macro molecular level and limit the ability of the material to deform. Therefore, the capability of the materials to dissipate energy was reduced. It was consistent with the decline observed in the impact strength (Figure 2) as well as EB value (Mohamad et al., 2008). In addition, the decrease in impact strength shown by the un-notched samples was due to the presence of agglomerates in ENRAN composites. It was evident from SEM micrographs for tensile fractured (Mohamad et al., 2008) and impact fractured surfaces (Figure 3). According to Chen and Evans (2008), a test on specimen without notch gives greater emphasis to the ductility after cracking starts and can be used to detect the presence of agglomerate. Despite the decreased in impact strength can be associated with increasing agglomerates density, but the effect was compensated by nearly spherical agglomerates. It was evident from the very small reduction in impact strength (less than 50 %) displayed by the ENRAN60 eventhough the ENR matrix was reinforced with 60 phr alumina. For comparison, a greater reduction (93 %) was observed in ABS-clay nanocomposites when compared with unfilled ABS even the micrographs showed the presence of nano structures in the materials (Chen and Evans, 2008). Besides, the reduction observed in impact strength may also be due to the difference in samples temperature with their glass transition temperature, Tg. The impact samples were hardened by liquid nitrogen at temperature of approximately -5 °C whereas Tg of ENRAN samples were increased as the filler loading increased (Mohamad et al., 2008) & (Mohamad et al., 2010). A narrower temperature difference, ∆T decreased the impact strength of the composites since it causes the matrix chains becoming more rigid and reduces its ability to deform during stress (Zhang and Zhang, 2007). Furthermore, the reduction in ∆T increases the shear rate and makes the materials prone to brittle fracture.
Impact strength (J/m)
Matrix content (%)
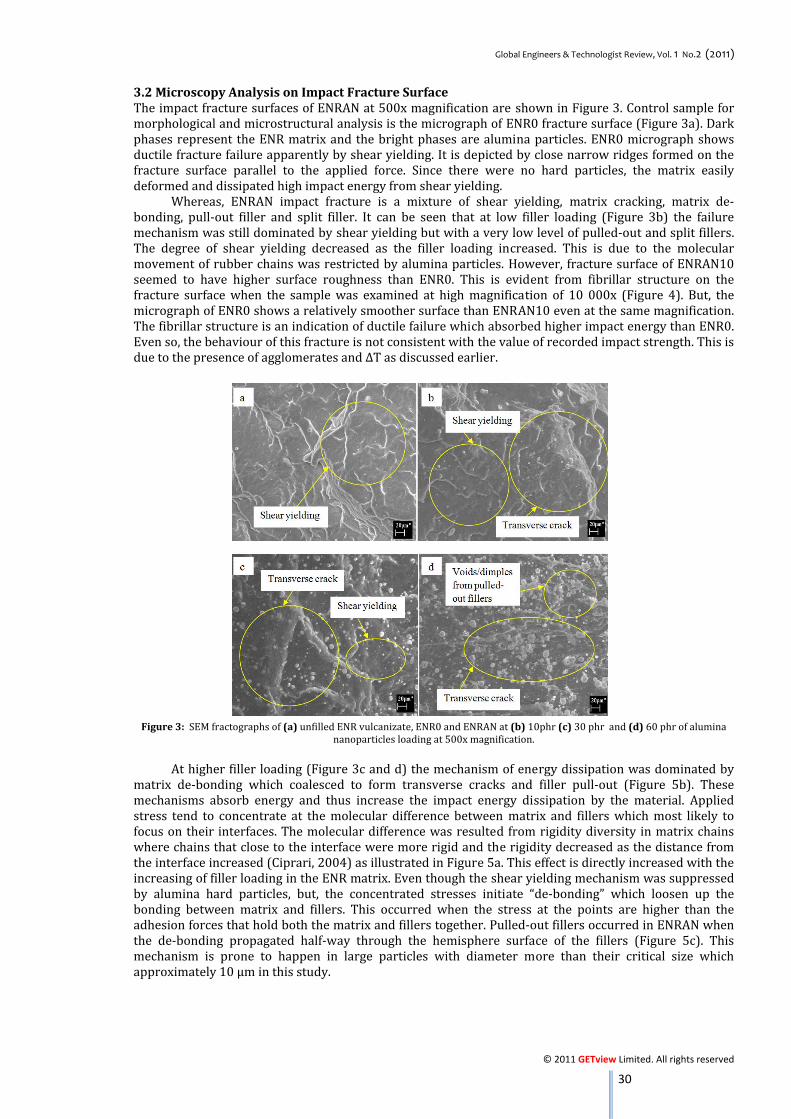
Global Engineers & Technologist Review, Vol. 1 No.2 (2011)
© 2011 GETview Limited. All rights reserved 30
3.2 Microscopy Analysis on Impact Fracture Surface The impact fracture surfaces of ENRAN at 500x magnification are shown in Figure 3. Control sample for morphological and microstructural analysis is the micrograph of ENR0 fracture surface (Figure 3a). Dark phases represent the ENR matrix and the bright phases are alumina particles. ENR0 micrograph shows ductile fracture failure apparently by shear yielding. It is depicted by close narrow ridges formed on the fracture surface parallel to the applied force. Since there were no hard particles, the matrix easily deformed and dissipated high impact energy from shear yielding. Whereas, ENRAN impact fracture is a mixture of shear yielding, matrix cracking, matrix de-bonding, pull-out filler and split filler. It can be seen that at low filler loading (Figure 3b) the failure mechanism was still dominated by shear yielding but with a very low level of pulled-out and split fillers. The degree of shear yielding decreased as the filler loading increased. This is due to the molecular movement of rubber chains was restricted by alumina particles. However, fracture surface of ENRAN10 seemed to have higher surface roughness than ENR0. This is evident from fibrillar structure on the fracture surface when the sample was examined at high magnification of 10 000x (Figure 4). But, the micrograph of ENR0 shows a relatively smoother surface than ENRAN10 even at the same magnification. The fibrillar structure is an indication of ductile failure which absorbed higher impact energy than ENR0. Even so, the behaviour of this fracture is not consistent with the value of recorded impact strength. This is due to the presence of agglomerates and ∆T as discussed earlier. Figure 3: SEM fractographs of (a) unfilled ENR vulcanizate, ENR0 and ENRAN at (b) 10phr (c) 30 phr and (d) 60 phr of alumina nanoparticles loading at 500x magnification. At higher filler loading (Figure 3c and d) the mechanism of energy dissipation was dominated by matrix de-bonding which coalesced to form transverse cracks and filler pull-out (Figure 5b). These mechanisms absorb energy and thus increase the impact energy dissipation by the material. Applied stress tend to concentrate at the molecular difference between matrix and fillers which most likely to focus on their interfaces. The molecular difference was resulted from rigidity diversity in matrix chains where chains that close to the interface were more rigid and the rigidity decreased as the distance from the interface increased (Ciprari, 2004) as illustrated in Figure 5a. This effect is directly increased with the increasing of filler loading in the ENR matrix. Even though the shear yielding mechanism was suppressed by alumina hard particles, but, the concentrated stresses initiate “de-bonding” which loosen up the bonding between matrix and fillers. This occurred when the stress at the points are higher than the adhesion forces that hold both the matrix and fillers together. Pulled-out fillers occurred in ENRAN when the de-bonding propagated half-way through the hemisphere surface of the fillers (Figure 5c). This mechanism is prone to happen in large particles with diameter more than their critical size which approximately 10 µm in this study.
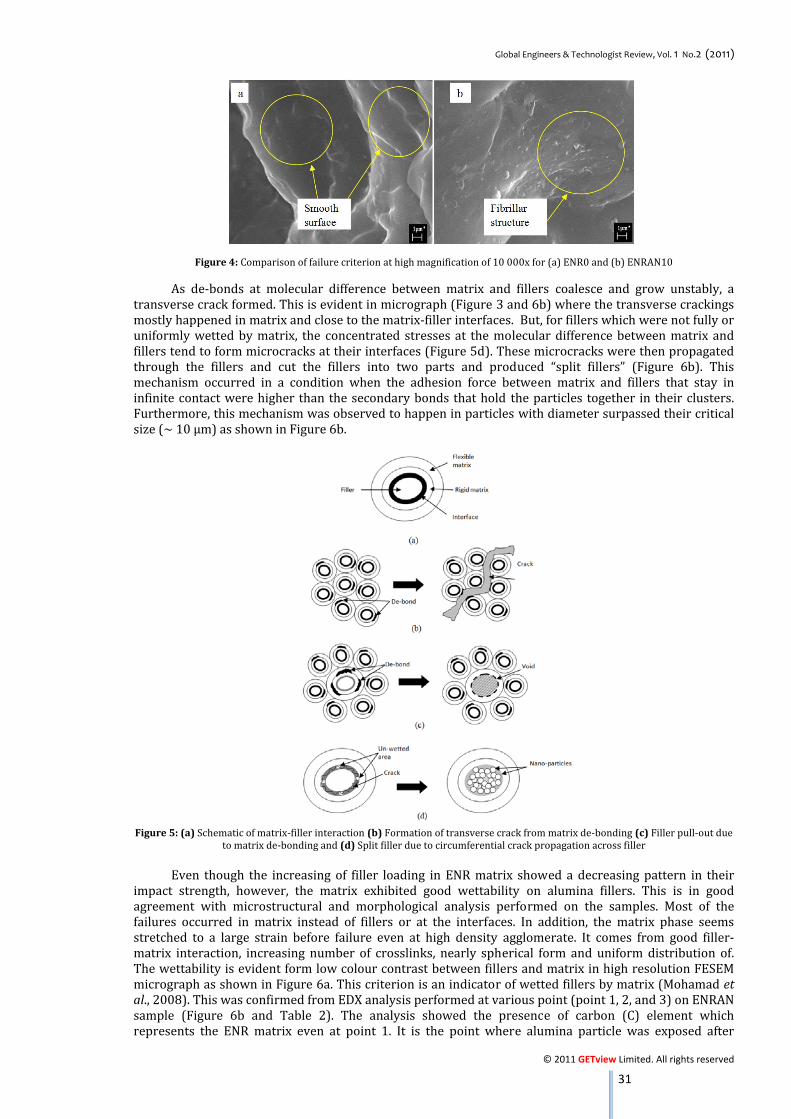
Global Engineers & Technologist Review, Vol. 1 No.2 (2011)
© 2011 GETview Limited. All rights reserved 31
Figure 4: Comparison of failure criterion at high magnification of 10 000x for (a) ENR0 and (b) ENRAN10 As de-bonds at molecular difference between matrix and fillers coalesce and grow unstably, a transverse crack formed. This is evident in micrograph (Figure 3 and 6b) where the transverse crackings mostly happened in matrix and close to the matrix-filler interfaces. But, for fillers which were not fully or uniformly wetted by matrix, the concentrated stresses at the molecular difference between matrix and fillers tend to form microcracks at their interfaces (Figure 5d). These microcracks were then propagated through the fillers and cut the fillers into two parts and produced “split fillers” (Figure 6b). This mechanism occurred in a condition when the adhesion force between matrix and fillers that stay in infinite contact were higher than the secondary bonds that hold the particles together in their clusters. Furthermore, this mechanism was observed to happen in particles with diameter surpassed their critical size (~ 10 µm) as shown in Figure 6b.
Figure 5: (a) Schematic of matrix-filler interaction (b) Formation of transverse crack from matrix de-bonding (c) Filler pull-out due to matrix de-bonding and (d) Split filler due to circumferential crack propagation across filler Even though the increasing of filler loading in ENR matrix showed a decreasing pattern in their impact strength, however, the matrix exhibited good wettability on alumina fillers. This is in good agreement with microstructural and morphological analysis performed on the samples. Most of the failures occurred in matrix instead of fillers or at the interfaces. In addition, the matrix phase seems stretched to a large strain before failure even at high density agglomerate. It comes from good filler-matrix interaction, increasing number of crosslinks, nearly spherical form and uniform distribution of. The wettability is evident form low colour contrast between fillers and matrix in high resolution FESEM micrograph as shown in Figure 6a. This criterion is an indicator of wetted fillers by matrix (Mohamad et al., 2008). This was confirmed from EDX analysis performed at various point (point 1, 2, and 3) on ENRAN sample (Figure 6b and Table 2). The analysis showed the presence of carbon (C) element which represents the ENR matrix even at point 1. It is the point where alumina particle was exposed after
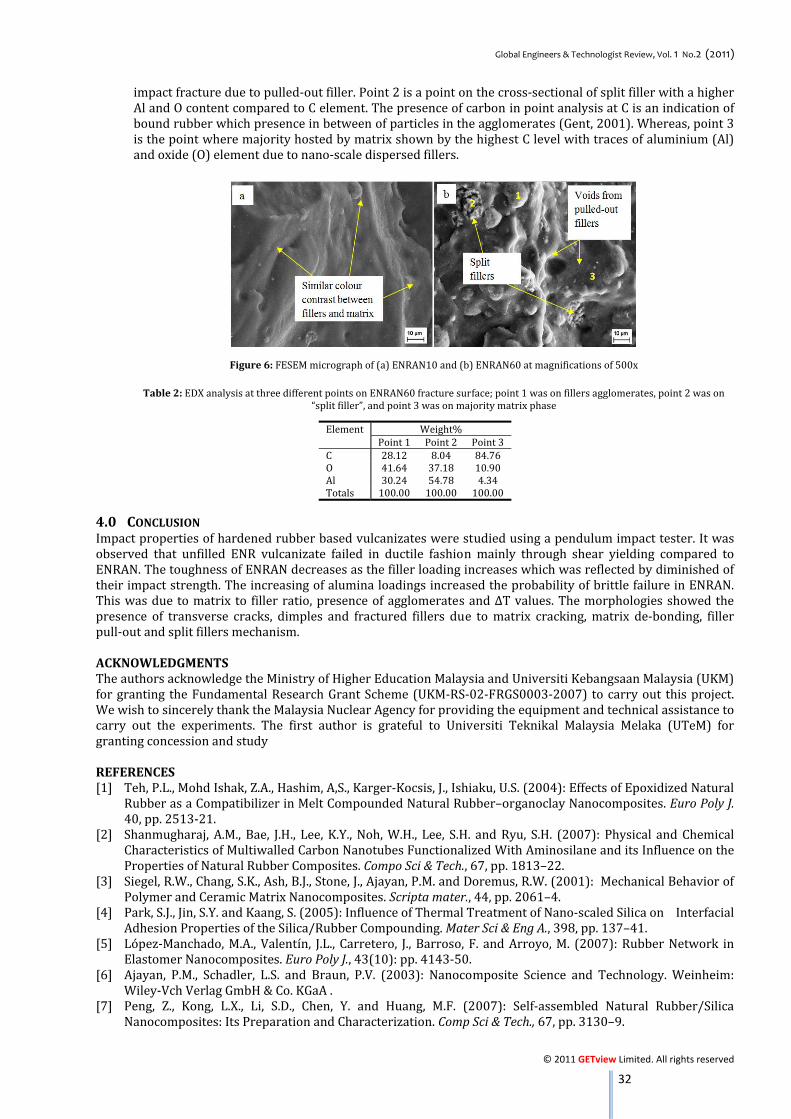
Global Engineers & Technologist Review, Vol. 1 No.2 (2011)
© 2011 GETview Limited. All rights reserved 32
impact fracture due to pulled-out filler. Point 2 is a point on the cross-sectional of split filler with a higher Al and O content compared to C element. The presence of carbon in point analysis at C is an indication of bound rubber which presence in between of particles in the agglomerates (Gent, 2001). Whereas, point 3 is the point where majority hosted by matrix shown by the highest C level with traces of aluminium (Al) and oxide (O) element due to nano-scale dispersed fillers.
Figure 6: FESEM micrograph of (a) ENRAN10 and (b) ENRAN60 at magnifications of 500x Table 2: EDX analysis at three different points on ENRAN60 fracture surface; point 1 was on fillers agglomerates, point 2 was on “split filler”, and point 3 was on majority matrix phase
4.0 CONCLUSION Impact properties of hardened rubber based vulcanizates were studied using a pendulum impact tester. It was observed that unfilled ENR vulcanizate failed in ductile fashion mainly through shear yielding compared to ENRAN. The toughness of ENRAN decreases as the filler loading increases which was reflected by diminished of their impact strength. The increasing of alumina loadings increased the probability of brittle failure in ENRAN. This was due to matrix to filler ratio, presence of agglomerates and ∆T values. The morphologies showed the presence of transverse cracks, dimples and fractured fillers due to matrix cracking, matrix de-bonding, filler pull-out and split fillers mechanism. ACKNOWLEDGMENTS The authors acknowledge the Ministry of Higher Education Malaysia and Universiti Kebangsaan Malaysia (UKM) for granting the Fundamental Research Grant Scheme (UKM-RS-02-FRGS0003-2007) to carry out this project. We wish to sincerely thank the Malaysia Nuclear Agency for providing the equipment and technical assistance to carry out the experiments. The first author is grateful to Universiti Teknikal Malaysia Melaka (UTeM) for granting concession and study REFERENCES [1] Teh, P.L., Mohd Ishak, Z.A., Hashim, A,S., Karger-Kocsis, J., Ishiaku, U.S. (2004): Effects of Epoxidized Natural Rubber as a Compatibilizer in Melt Compounded Natural Rubber–organoclay Nanocomposites. Euro Poly J. 40, pp. 2513-21. [2] Shanmugharaj, A.M., Bae, J.H., Lee, K.Y., Noh, W.H., Lee, S.H. and Ryu, S.H. (2007): Physical and Chemical Characteristics of Multiwalled Carbon Nanotubes Functionalized With Aminosilane and its Influence on the Properties of Natural Rubber Composites. Compo Sci & Tech., 67, pp. 1813–22. [3] Siegel, R.W., Chang, S.K., Ash, B.J., Stone, J., Ajayan, P.M. and Doremus, R.W. (2001): Mechanical Behavior of Polymer and Ceramic Matrix Nanocomposites. Scripta mater., 44, pp. 2061–4. [4] Park, S.J., Jin, S.Y. and Kaang, S. (2005): Influence of Thermal Treatment of Nano-scaled Silica on Interfacial Adhesion Properties of the Silica/Rubber Compounding. Mater Sci & Eng A., 398, pp. 137–41. [5] López-Manchado, M.A., Valentín, J.L., Carretero, J., Barroso, F. and Arroyo, M. (2007): Rubber Network in Elastomer Nanocomposites. Euro Poly J., 43(10): pp. 4143-50. [6] Ajayan, P.M., Schadler, L.S. and Braun, P.V. (2003): Nanocomposite Science and Technology. Weinheim: Wiley-Vch Verlag GmbH & Co. KGaA . [7] Peng, Z., Kong, L.X., Li, S.D., Chen, Y. and Huang, M.F. (2007): Self-assembled Natural Rubber/Silica Nanocomposites: Its Preparation and Characterization. Comp Sci & Tech., 67, pp. 3130–9.
Element Weight% Point 1 Point 2 Point 3C 28.12 8.04 84.76O 41.64 37.18 10.90Al 30.24 54.78 4.34Totals 100.00 100.00 100.00

Global Engineers & Technologist Review, Vol. 1 No.2 (2011)
© 2011 GETview Limited. All rights reserved 33
[8] Vu, Y.T., Mark, J.E., Pham, L.Y.H. and Engelhardt, M. (2001): Clay Nanolayer Reinforcement of cis-1,4-Polyisoprene and Epoxidized Natural Rubber. J Ap Poly Sci., 82, pp. 1391–403. [9] Varghese, S., Karger-Kocsis, J. and Gatos, K.G. (2003): Melt Compounded Epoxidized Natural Rubber/Layered Silicate Nanocomposites: Structure-Properties Relationships. Poly., 44, pp. 3977–83. [10] Ahankari, S.S. and Kar, K.K. (2008): Processing of Styrene Butadiene Rubber-carbon Black Nanocomposites With Gradation of Crosslink Density: Static and Dynamic Mechanical Characterization. Mat Sci & Eng A., 491(1-2): pp. 454-60. [11] Falco, A.D., Goyanes, S., Rubiolo, G.H., Mondragon, I. and Marzocca, A. (2007): Carbon Nanotubes as Reinforcement of Styrene Butadiene Rubber. Appl Surf Sci., 254, pp. 262-5. [12] Das, A., Costa, F.R., Wagenknecht, U. and Heinrich, G. (2008): Nanocomposites Based on Chloroprene Rubber: Effect of Chemical Nature and Organic Modification of Nanoclay on the Vulcanizate Properties. Euro Poly J., 44, pp. 3456–65. [13] Chang, Z.H., Guo, F., Chen, J.F., Yu, J.H. and Wang, G.Q. (2007): Synergistic Flame Retardant Effects of Nano-Kaolin and Nano-HAO on LDPE/EPDM Composites. Poly Degrad & Stabil., 92, pp. 1204-12. [14] Jose, M.V., Steinert, B.W., Thomas, V., Dean, D.R., Abdalla, M.A. and Price G. (2007): Morphology and Mechanical Properties of Nylon 6/MWNT Nanofibers. Poly., 48, pp. 1096-104. [15] Kalaitzidou, K., Fukushima, H. and Drzal, L.T. (2007): A New Compounding Method for Exfoliated Graphite–Polypropylene Nanocomposites with Enhanced Flexural Properties and Lower Percolation Threshold. Comp Sci & Tech.,87(10): pp. 2045-51. [16] Hasan, M.M., Zhou, Y. and Jeelani, S. (2007): Thermal and Tensile Properties of Aligned Carbon Nanofiber Reinforced Polypropylene. Mat Let., 61, pp. 1134–6. [17] Bhimaraj, P., Burris, D.L., Action, J., Sawyer, W.G., Toney, C.G. and Siegel R.W. (2005): Effect of Matrix Morphology on the Wear and Friction Behavior of Alumina Nanoparticle/Poly(ethylene) Terephthalate Composites. Wear., 258, pp. 1437–43. [18] Costache, M.C., Wang, D., Heidecker, M.J., Manias, E. and Wilkie, C.A. (2006): The Thermal Degradation of Poly(methyl methacrylate) Nanocomposites with Montmorillonite, Layered Double Hydroxides and Carbon Nanotubes. Poly Adv Tech., 17, pp. 272–80. [19] Chandra, A., Turng, L.S., Gopalan, P., Rowell, R.M. and Gong, S. (2008): Study of Utilizing Thin Polymer Surface Coating on the Nanoparticles for Melt Compounding of Polycarbonate/Alumina Nanocomposites and Their Optical Properties. Comp Sci & Tech., 68, pp. 768–76. [20] Eitan, A., Fisher, F.T., Andrews, R., Brinson, L.C. and Schadler, L.S. (2006): Reinforcement Mechanisms in MWCNT-Filled Polycarbonate. Comp Sci &Tech., 66, pp. 1162–73. [21] Kontopoulou, M., Liu, Y., Austin, J.R., and Parent J.S. (2007): The Dynamics of Montmorillonite Clay Dispersion and Morphology Development in Immiscible Ethyleneepropylene Rubber/Polypropylene Blends. Poly.,48, pp. 4520-8. [22] Arroyo, M., Lo´pez-Manchado, M.A., Valentı´n, J.L. and Carretero J. (2006):Morphology/Behaviour Relationship of Nanocomposites Based on Natural Rubber/Epoxidized Natural Rubber Blends. Compo Sci & Tech., 67(7-8): pp. 1330-9. [23] Ismail, H. and Chia, H.H. (1998):The Effects of Multifunctional Additive and Vulcanization Systems on Silica Filled Epoxidized Natural Rubber Compounds. Euro Poly J., 34, 12: pp.1857-63. [24] Noboru, I. (1987): Introduction to Fine Ceramics (Application in Engineering). New York: John Wiley & Sons Ltd.; 1987. [25] Gatos, K.G., Martı´nez Alca´zar, J.G., Psarras, G.C., Thomann, R. and Karger-Kocsis, J. (2007): Polyurethane Latex/Water Dispersible Boehmite Alumina Nanocomposites: Thermal, Mechanical and Dielectrical Properties. Comp Sci and Tech., 67, pp. 157–67. [26] Jung, C.H., Choi, J.H., Lim, Y.M., Jeun, J.P., Kang, P.H. and Nho, Y.C. (2006):Preparation and Characterization of Polypropylene Nanocomposites Containing Polystyrene-Grafted Alumina Nanoparticles. J. Ind. Eng. Chem. , 12(6): pp.900-4. [27] Ash, B.J., Schadler, L.S. and Siegel, R.W. (2002): Glass Transition Behaviour of Alumina Polymethylmethacrylate Nanocomposites. Mat. Let., 55, pp. 83-7. [28] Ash, B.J., Siegel, R.W. and Schadler, L.S. (2004): Mechanical Behavior of Alumina/ Poly(methyl Methacrylate) Nanocomposites. Macromolecules., 37, pp.1358–69. [29] Mohamad, N., Muchtar, A., Ghazali, M.J., Dahlan, H.M. and Azhari, C.H. (2008): The Effect of Filler on Epoxidized Natural Rubber-Alumina Nanoparticles Composites. Euro J of Sci Res.,24(4): pp.538-47. [30] Chen, B. and Evans J.R.G. (2008):Impact and Tensile Energies of Fracture in Polymer–Clay Nanocomposites. Polymer., 49, pp. 5113–5118. [31] Annual Book of ASTM Standards. Vol 09.01. West Conshohocken, PA United States: American Society for Testing of Materials; 2000. [32] Mohamad, N., Muchtar, A., Ghazali, M.J., Dahlan, H.M. and Azhari C.H. (2009):Epoxidized Natural Rubber-Alumina Nanoparticle Composites: Optimisation of Mixer Parameters via Response Surface Methodology (RSM). J of App Poly Sci., 115(1): pp. 183-9.

Global Engineers & Technologist Review, Vol. 1 No.2 (2011)
© 2011 GETview Limited. All rights reserved 34
[33] Annual Book of ASTM Standards. West Conshohocken, PA United States: American Society for Testing of Materials; 2001. [34] Zakaria, F.A. (2002): The Effect of Pore Size and Pore Geometry on the Strength of Porous Hydroxyapatite. Solid State Science and Technology, 10 (1-2): pp. 209-215. [35] Ashrafi, B., Hubert, P. and Vengallatore, S. (2006): Carbon Nanotube-Reinforced Composites as Structural Materials for Microactuators in Microelectromechanical Systems. Nanotechnology., 17, pp. 4895 – 4903. [36] McGrath, L.M., Parnas, R.S., King, S.H., Schroeder, J.L, Fischer, D.A. and Lenhart, J.L. (2008): Investigation of the Thermal, Mechanical, and Fracture Properties of Alumina Epoxy Composites. Polymer., 49, pp.999-1014. [37] Mohd Yuhazri, Y., Phongsakorn, P.T., Hearyip Sihombing, Jeefferie, A.R., Puvanasvaran Perumal, Kamarul, A.M. and Kannan Rassiah. (2011): Mechanical Properties of Kenaf/Polyester Composites. International Journal of Engineering & Technology. Vol. 11. No.1. pp. 127-131. [38] Gent, A.N. Engineering with Rubber-How to Design Rubber Components. 2nd Ed. Carl Hanser Verlag. Munich. 2001. [39] Mohamad, N., Muchtar, A., Ghazali, M.J., Dahlan, H.M. and Azhari, C.H. (2010): Correlation of Filler Loading and Silane Coupling Agent on the Physical Characteristics of Epoxidized Natural Rubber-Alumina Nanoparticles Composites. J of Elas & Plas., 42, pp. 331-346. [40] Zhang, H. and Zhang, Z. (2007): Impact Behaviour of Polypropylene Filled With Multi-Walled Carbon Nanotubes. European Polymer Journal., 43, pp.3197–3207. [41] Ciprari, D.L. (2004): Mechanical Characterization of Polymer Nanocomposites and the Role of Interphase. Georgia: Georgia Institute of Technology.
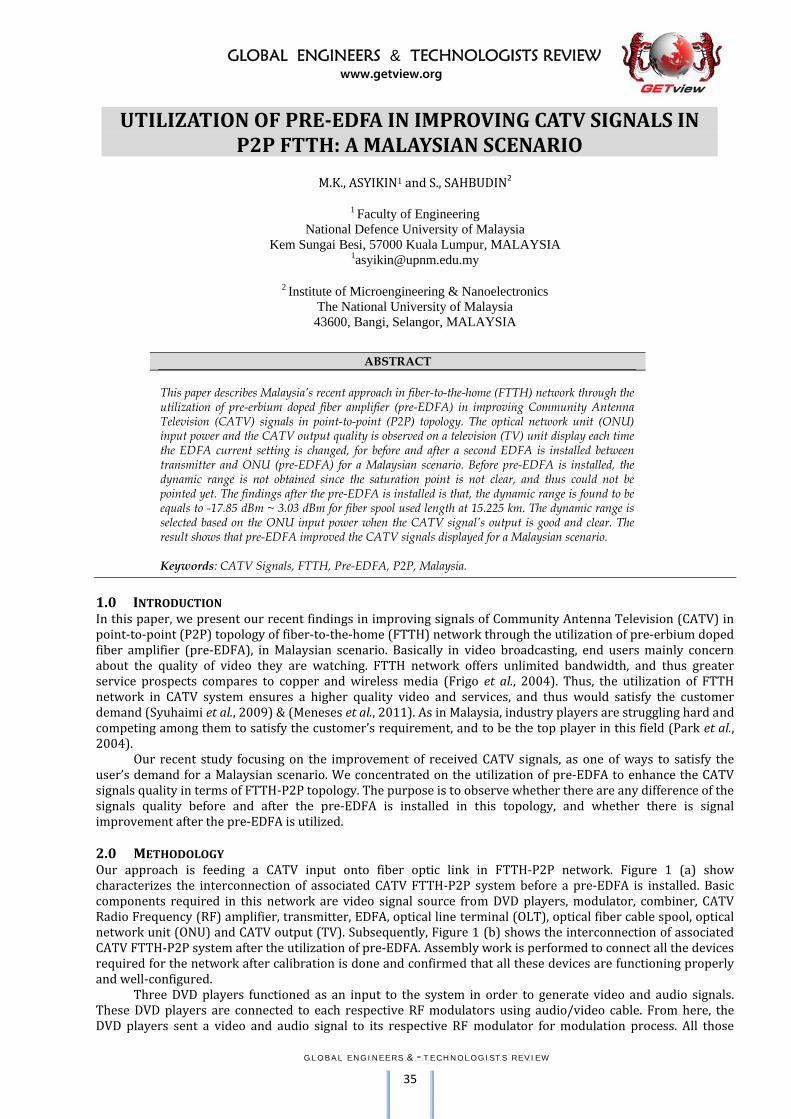
GLOBAL ENGINEERS & TECHNOLOGISTS REVIEW www.getview.org
G.L.O.B.A.L E.N.G.I.N.E.E.R.S. .& .-.T.E.C.H.N.O.L.O.G.I.S.T.S R.E.V.I.E.W 35
M.K., ASYIKIN1 and S., SAHBUDIN2
1 Faculty of Engineering National Defence University of Malaysia
Kem Sungai Besi, 57000 Kuala Lumpur, MALAYSIA [email protected]
2 Institute of Microengineering & Nanoelectronics
The National University of Malaysia 43600, Bangi, Selangor, MALAYSIA
1.0 INTRODUCTION In this paper, we present our recent findings in improving signals of Community Antenna Television (CATV) in point-to-point (P2P) topology of fiber-to-the-home (FTTH) network through the utilization of pre-erbium doped fiber amplifier (pre-EDFA), in Malaysian scenario. Basically in video broadcasting, end users mainly concern about the quality of video they are watching. FTTH network offers unlimited bandwidth, and thus greater service prospects compares to copper and wireless media (Frigo et al., 2004). Thus, the utilization of FTTH network in CATV system ensures a higher quality video and services, and thus would satisfy the customer demand (Syuhaimi et al., 2009) & (Meneses et al., 2011). As in Malaysia, industry players are struggling hard and competing among them to satisfy the customer’s requirement, and to be the top player in this field (Park et al., 2004). Our recent study focusing on the improvement of received CATV signals, as one of ways to satisfy the user’s demand for a Malaysian scenario. We concentrated on the utilization of pre-EDFA to enhance the CATV signals quality in terms of FTTH-P2P topology. The purpose is to observe whether there are any difference of the signals quality before and after the pre-EDFA is installed in this topology, and whether there is signal improvement after the pre-EDFA is utilized. 2.0 METHODOLOGY Our approach is feeding a CATV input onto fiber optic link in FTTH-P2P network. Figure 1 (a) show characterizes the interconnection of associated CATV FTTH-P2P system before a pre-EDFA is installed. Basic components required in this network are video signal source from DVD players, modulator, combiner, CATV Radio Frequency (RF) amplifier, transmitter, EDFA, optical line terminal (OLT), optical fiber cable spool, optical network unit (ONU) and CATV output (TV). Subsequently, Figure 1 (b) shows the interconnection of associated CATV FTTH-P2P system after the utilization of pre-EDFA. Assembly work is performed to connect all the devices required for the network after calibration is done and confirmed that all these devices are functioning properly and well-configured. Three DVD players functioned as an input to the system in order to generate video and audio signals. These DVD players are connected to each respective RF modulators using audio/video cable. From here, the DVD players sent a video and audio signal to its respective RF modulator for modulation process. All those
ABSTRACT This paper describes Malaysia’s recent approach in fiber-to-the-home (FTTH) network through the utilization of pre-erbium doped fiber amplifier (pre-EDFA) in improving Community Antenna Television (CATV) signals in point-to-point (P2P) topology. The optical network unit (ONU) input power and the CATV output quality is observed on a television (TV) unit display each time the EDFA current setting is changed, for before and after a second EDFA is installed between transmitter and ONU (pre-EDFA) for a Malaysian scenario. Before pre-EDFA is installed, the dynamic range is not obtained since the saturation point is not clear, and thus could not be pointed yet. The findings after the pre-EDFA is installed is that, the dynamic range is found to be equals to -17.85 dBm ~ 3.03 dBm for fiber spool used length at 15.225 km. The dynamic range is selected based on the ONU input power when the CATV signal’s output is good and clear. The result shows that pre-EDFA improved the CATV signals displayed for a Malaysian scenario. Keywords: CATV Signals, FTTH, Pre-EDFA, P2P, Malaysia.
UTILIZATION OF PRE-EDFA IN IMPROVING CATV SIGNALS IN P2P FTTH: A MALAYSIAN SCENARIO
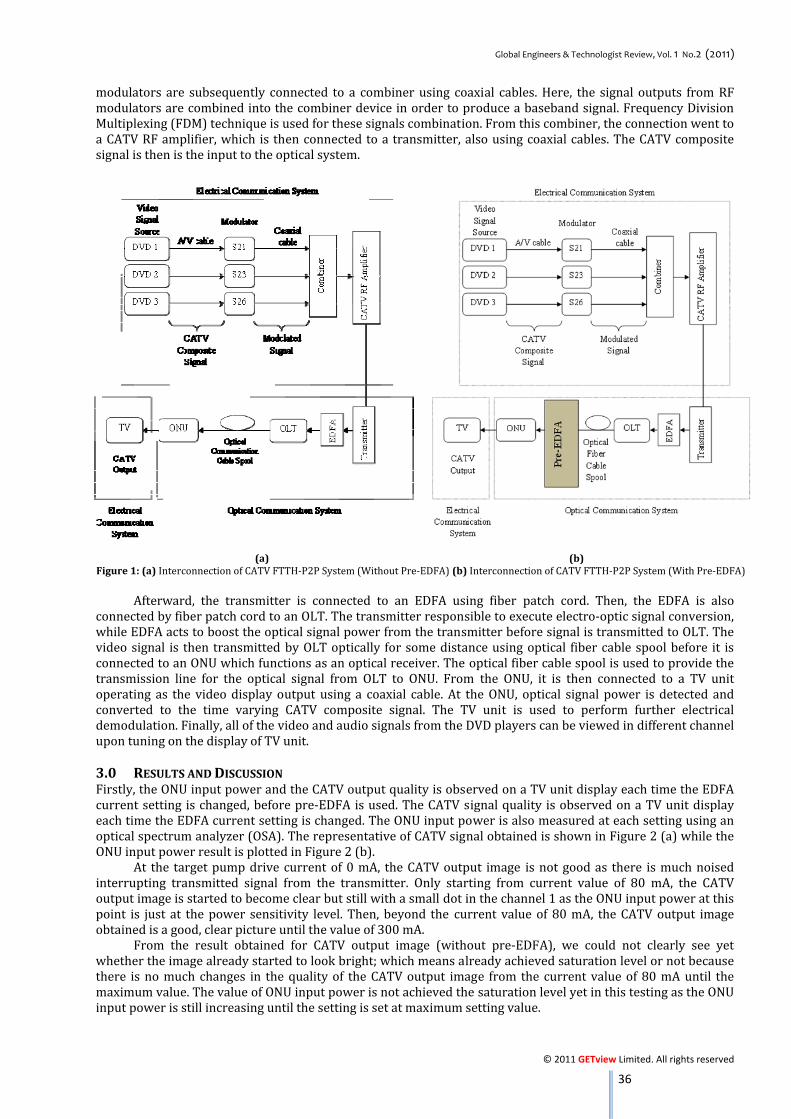
Global Engineers & Technologist Review, Vol. 1 No.2 (2011)
© 2011 GETview Limited. All rights reserved 36
modulators are subsequently connected to a combiner using coaxial cables. Here, the signal outputs from RF modulators are combined into the combiner device in order to produce a baseband signal. Frequency Division Multiplexing (FDM) technique is used for these signals combination. From this combiner, the connection went to a CATV RF amplifier, which is then connected to a transmitter, also using coaxial cables. The CATV composite signal is then is the input to the optical system. (a) (b) Figure 1: (a) Interconnection of CATV FTTH-P2P System (Without Pre-EDFA) (b) Interconnection of CATV FTTH-P2P System (With Pre-EDFA) Afterward, the transmitter is connected to an EDFA using fiber patch cord. Then, the EDFA is also connected by fiber patch cord to an OLT. The transmitter responsible to execute electro-optic signal conversion, while EDFA acts to boost the optical signal power from the transmitter before signal is transmitted to OLT. The video signal is then transmitted by OLT optically for some distance using optical fiber cable spool before it is connected to an ONU which functions as an optical receiver. The optical fiber cable spool is used to provide the transmission line for the optical signal from OLT to ONU. From the ONU, it is then connected to a TV unit operating as the video display output using a coaxial cable. At the ONU, optical signal power is detected and converted to the time varying CATV composite signal. The TV unit is used to perform further electrical demodulation. Finally, all of the video and audio signals from the DVD players can be viewed in different channel upon tuning on the display of TV unit. 3.0 RESULTS AND DISCUSSION Firstly, the ONU input power and the CATV output quality is observed on a TV unit display each time the EDFA current setting is changed, before pre-EDFA is used. The CATV signal quality is observed on a TV unit display each time the EDFA current setting is changed. The ONU input power is also measured at each setting using an optical spectrum analyzer (OSA). The representative of CATV signal obtained is shown in Figure 2 (a) while the ONU input power result is plotted in Figure 2 (b). At the target pump drive current of 0 mA, the CATV output image is not good as there is much noised interrupting transmitted signal from the transmitter. Only starting from current value of 80 mA, the CATV output image is started to become clear but still with a small dot in the channel 1 as the ONU input power at this point is just at the power sensitivity level. Then, beyond the current value of 80 mA, the CATV output image obtained is a good, clear picture until the value of 300 mA. From the result obtained for CATV output image (without pre-EDFA), we could not clearly see yet whether the image already started to look bright; which means already achieved saturation level or not because there is no much changes in the quality of the CATV output image from the current value of 80 mA until the maximum value. The value of ONU input power is not achieved the saturation level yet in this testing as the ONU input power is still increasing until the setting is set at maximum setting value.
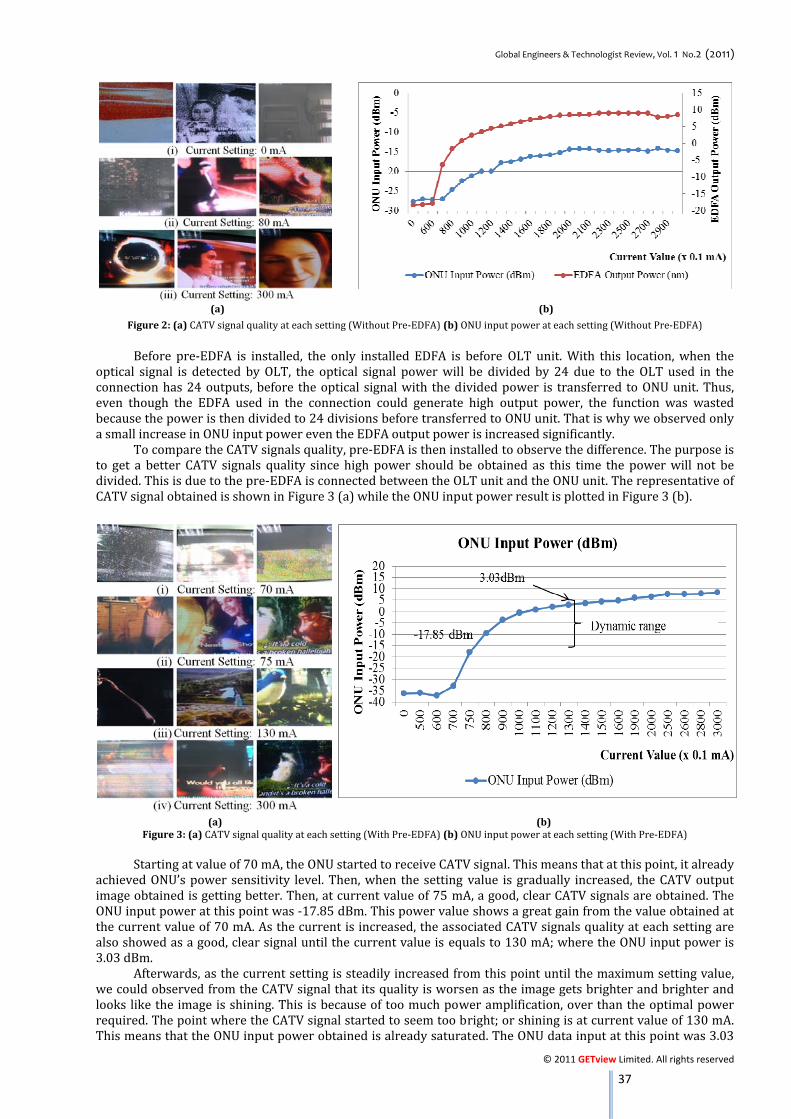
Global Engineers & Technologist Review, Vol. 1 No.2 (2011)
© 2011 GETview Limited. All rights reserved 37
(a) (b)
Figure 2: (a) CATV signal quality at each setting (Without Pre-EDFA) (b) ONU input power at each setting (Without Pre-EDFA) Before pre-EDFA is installed, the only installed EDFA is before OLT unit. With this location, when the optical signal is detected by OLT, the optical signal power will be divided by 24 due to the OLT used in the connection has 24 outputs, before the optical signal with the divided power is transferred to ONU unit. Thus, even though the EDFA used in the connection could generate high output power, the function was wasted because the power is then divided to 24 divisions before transferred to ONU unit. That is why we observed only a small increase in ONU input power even the EDFA output power is increased significantly. To compare the CATV signals quality, pre-EDFA is then installed to observe the difference. The purpose is to get a better CATV signals quality since high power should be obtained as this time the power will not be divided. This is due to the pre-EDFA is connected between the OLT unit and the ONU unit. The representative of CATV signal obtained is shown in Figure 3 (a) while the ONU input power result is plotted in Figure 3 (b). (a) (b)
Figure 3: (a) CATV signal quality at each setting (With Pre-EDFA) (b) ONU input power at each setting (With Pre-EDFA) Starting at value of 70 mA, the ONU started to receive CATV signal. This means that at this point, it already achieved ONU’s power sensitivity level. Then, when the setting value is gradually increased, the CATV output image obtained is getting better. Then, at current value of 75 mA, a good, clear CATV signals are obtained. The ONU input power at this point was -17.85 dBm. This power value shows a great gain from the value obtained at the current value of 70 mA. As the current is increased, the associated CATV signals quality at each setting are also showed as a good, clear signal until the current value is equals to 130 mA; where the ONU input power is 3.03 dBm. Afterwards, as the current setting is steadily increased from this point until the maximum setting value, we could observed from the CATV signal that its quality is worsen as the image gets brighter and brighter and looks like the image is shining. This is because of too much power amplification, over than the optimal power required. The point where the CATV signal started to seem too bright; or shining is at current value of 130 mA. This means that the ONU input power obtained is already saturated. The ONU data input at this point was 3.03

Global Engineers & Technologist Review, Vol. 1 No.2 (2011)
© 2011 GETview Limited. All rights reserved 38
dBm. As the setting gradually approached maximum setting value, the CATV signal quality get worsen, as too much power amplification is imposed which then decreased the CATV output signal quality. From this testing, it is concluded that the dynamic range of this model is -17.85 dBm ~ 3.03 dBm, at fiber spool length of 15.225 km. This dynamic range is taken from where the CATV output signal started to have a good, clear image and until just before the CATV signal started to seem shining due to already achieved power saturation level. 4.0 CONCLUSION The result shows that as studied for a Malaysian scenario, the pre-EDFA installation enhanced the CATV signals quality displayed. ACKNOWLEDGMENT The author gratefully acknowledges the supervision and help provided by all the members of Institute of Microengineering and Nanoelectronics, Universiti Kebangsaan Malaysia in the completion of this study. REFERENCES [1] Frigo, N.J., Iannone, P.P. and Reichmann, K.C. (2004): A View of Fiber to the Home Economics. IEEE Optical
Communication, pp. 516-523. [2] Mohammad Syuhaimi Ab-Rahman, Suria Che Rosli, Faridah Jaafar, Zurita Zakaria and Kasmiran Jumari (2009): CATV Tester Unit for Fiber-to-the-Home. Proceedings of the 2009 International Conference on Space Science and Communication, Negeri Sembilan, pp.119-122. [3] Meneses, R., Linares, R., Montes, L. and Bonilla, J.L. (2011): The RFID Tag Performance Considerations in The Vehicular Identification. Global Engineers and Technologists Review, Vol. 1, No.1, pp. 29-34. [4] Park, S.J., Lee, C.H., Jeong, K.T., Park, H.J., Ahn, J.G. and Song, K.H. (2004): Fiber-to-the-home services based on wavelength-division-multiplexing passive optical network. Journal of Lightwave Technology, Vol. 22, No. 11, pp. 2582-2591.
GLOBAL ENGINEERS & TECHNOLOGISTS REVIEW www.getview.org
G.L.O.B.A.L E.N.G.I.N.E.E.R.S. .& .-.T.E.C.H.N.O.L.O.G.I.S.T.S R.E.V.I.E.W 39
A.Y., BANI HASHIM1, N.A., ABU OSMAN2, and W.A.B., WAN ABAS3
1 Department of Robotics & Automation Faculty of Manufacturing Engineering Universiti Teknikal Malaysia Melaka
Hang Tuah Jaya, 76100 Durian Tunggal, Melaka, MALAYSIA [email protected]
2, 3 Department of Biomedical Engineering
Faculty of Engineering University of Malaya
50603, Kuala Lumpur, MALAYSIA
1.0 INTRODUCTION This work investigates the following questions—why the bones and the joints are arranged in that way, why it is different from other primates, and how could it be imitated to develop a foot-ankle mechanism (FAM). The complete set of a FAM to replace amputated foot is the prosthetic foot (PF). There were studies on foot biomechanics such as in (Wang and Crompton, 2004), and on walking gait analysis in (Elftman, 1969), (Gronley and Perry, 1984), (Krebs et al., 1985), (Laughman et al., 1984), (McGinley et al., 2003), (Peterson et al., 1985), (Su et al., 2007), and (Winter, 1984). Computational intelligence is the current trend in gait analysis (Lai et al., 2009). However, these studies have indirectly answered the questions posed. On the other hand, there are ways to select commercial PF. For example, clinical teams select it by ranking of the biomechanical parameter that is the spring efficiency (Prince et al., 1998). Sometimes the prescribed PF is based on intuition (Twiste and Rithalia, 2003). It is argued that the current analytical technique for calculating spring efficiency has two flaws: prosthetic feet with a bendable flexible keel are analyzed the same way as those with an articulated ankle and a rigid foot; there is no accounting for the energy losses in the viscoelastic cosmetic material surrounding the keel which can be found in a silicon rubber cosmesis (Prince et al., 1998). The objectives of this study are to determine the FAM design based on foot anatomy and its biomechanics through modeling of foot structure in the form of a numerical profile. The main outcome measure is to validate the three walking gait events: heel strike, mid stance, and toe-off of the prototype FAM. The performance test was performed using COMAU robot that simulated human gait. The outcome measures of the prototype FAM and a PF will be compared.
ABSTRACT
This work investigates the following questions—why the bones and the joints are arranged in that way, why it is different from other primates, and how could it be imitated to develop a foot-ankle mechanism. Mathematical models were developed and were based on the relationship among the anatomy of bones and joints, the normalized ground reaction forces that acted on certain nodes on the footprint. Using the model, a custom design prosthetic foot was assembled. It was tested on a robot arm that simulated a walking gait. The stance phase cycle performed on the prototype, and the commercial feet were completed within approximately 1.08 seconds and 1.38 seconds respectively. The techniques used, however, may require further studies because the prototype foot was not tested on patients. At this stage, the techniques are sufficient to justify that the prototype foot design should consist of an ankle-foot mechanism and a flexible keel. Therefore, proper mappings of bones and joints; and modeling of foot biomechanics is found useful in design and development of prosthetic feet activities. Keywords: Ground Reaction Force, Foot Anatomy, Gait Simulator, Foot-Ankle Mechanism.
DETERMINING FOOT-ANKLE MECHANISM DESIGN BY MAPPING THE RELATIONSHIPS AMONG BONES, JOINTS AND GROUND
REACTION FORCE
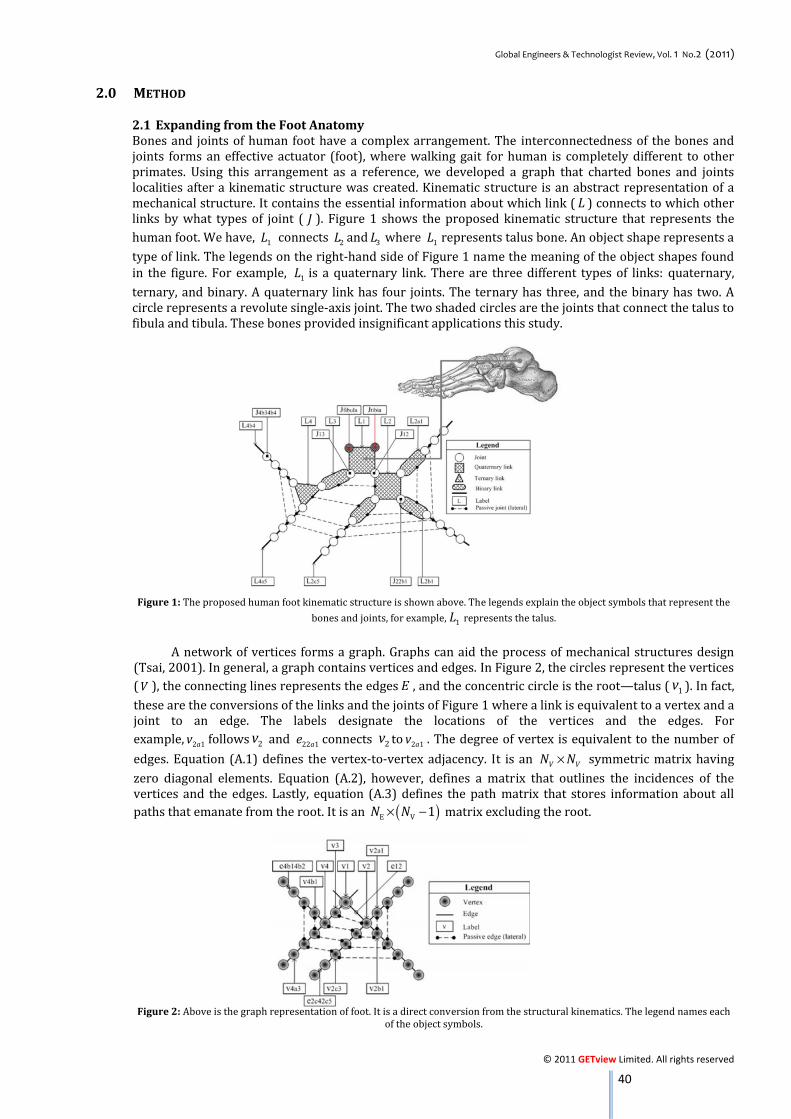
Global Engineers & Technologist Review, Vol. 1 No.2 (2011)
© 2011 GETview Limited. All rights reserved 40
2.0 METHOD 2.1 Expanding from the Foot Anatomy Bones and joints of human foot have a complex arrangement. The interconnectedness of the bones and joints forms an effective actuator (foot), where walking gait for human is completely different to other primates. Using this arrangement as a reference, we developed a graph that charted bones and joints localities after a kinematic structure was created. Kinematic structure is an abstract representation of a mechanical structure. It contains the essential information about which link ( L ) connects to which other links by what types of joint ( J ). Figure 1 shows the proposed kinematic structure that represents the human foot. We have, 1L connects 2L and 3L where 1L represents talus bone. An object shape represents a type of link. The legends on the right-hand side of Figure 1 name the meaning of the object shapes found in the figure. For example, 1L is a quaternary link. There are three different types of links: quaternary, ternary, and binary. A quaternary link has four joints. The ternary has three, and the binary has two. A circle represents a revolute single-axis joint. The two shaded circles are the joints that connect the talus to fibula and tibula. These bones provided insignificant applications this study.
Figure 1: The proposed human foot kinematic structure is shown above. The legends explain the object symbols that represent the bones and joints, for example, 1L represents the talus. A network of vertices forms a graph. Graphs can aid the process of mechanical structures design (Tsai, 2001). In general, a graph contains vertices and edges. In Figure 2, the circles represent the vertices (V ), the connecting lines represents the edges E , and the concentric circle is the root—talus ( 1v ). In fact, these are the conversions of the links and the joints of Figure 1 where a link is equivalent to a vertex and a joint to an edge. The labels designate the locations of the vertices and the edges. For example, 2 1av follows 2v and 22 1ae connects 2v to 2 1av . The degree of vertex is equivalent to the number of edges. Equation (A.1) defines the vertex-to-vertex adjacency. It is an V VN N× symmetric matrix having zero diagonal elements. Equation (A.2), however, defines a matrix that outlines the incidences of the vertices and the edges. Lastly, equation (A.3) defines the path matrix that stores information about all paths that emanate from the root. It is an ( )E V 1N N× − matrix excluding the root.
Figure 2: Above is the graph representation of foot. It is a direct conversion from the structural kinematics. The legend names each of the object symbols.
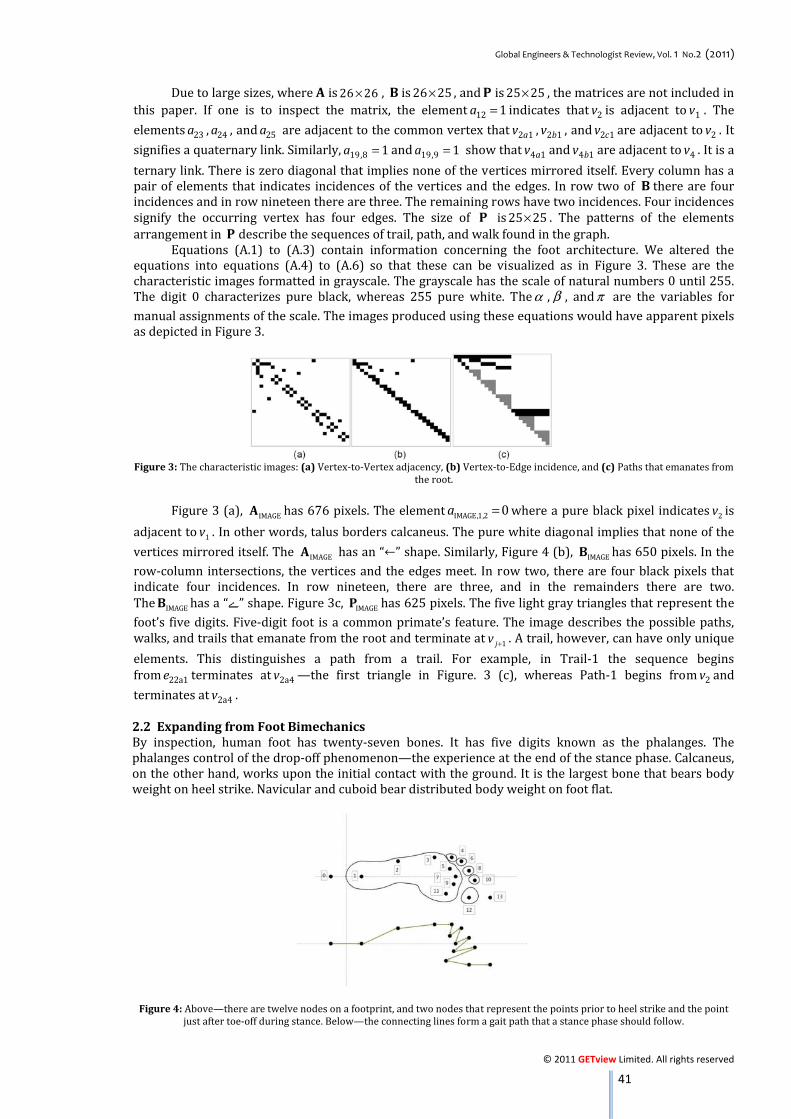
Global Engineers & Technologist Review, Vol. 1 No.2 (2011)
© 2011 GETview Limited. All rights reserved 41
Due to large sizes, where A is 26 26× , B is 26 25× , and P is 25 25× , the matrices are not included in this paper. If one is to inspect the matrix, the element 12 1a = indicates that 2v is adjacent to 1v . The elements 23a , 24a , and 25a are adjacent to the common vertex that 2 1av , 2 1bv , and 2 1cv are adjacent to 2v . It signifies a quaternary link. Similarly, 19,8 1a = and 19,9 1a = show that 4 1av and 4 1bv are adjacent to 4v . It is a ternary link. There is zero diagonal that implies none of the vertices mirrored itself. Every column has a pair of elements that indicates incidences of the vertices and the edges. In row two of B there are four incidences and in row nineteen there are three. The remaining rows have two incidences. Four incidences signify the occurring vertex has four edges. The size of P is 25 25× . The patterns of the elements arrangement in P describe the sequences of trail, path, and walk found in the graph. Equations (A.1) to (A.3) contain information concerning the foot architecture. We altered the equations into equations (A.4) to (A.6) so that these can be visualized as in Figure 3. These are the characteristic images formatted in grayscale. The grayscale has the scale of natural numbers 0 until 255. The digit 0 characterizes pure black, whereas 255 pure white. Theα , β , and π are the variables for manual assignments of the scale. The images produced using these equations would have apparent pixels as depicted in Figure 3. Figure 3: The characteristic images: (a) Vertex-to-Vertex adjacency, (b) Vertex-to-Edge incidence, and (c) Paths that emanates from the root. Figure 3 (a), IMAGEA has 676 pixels. The element IMAGE,1,2 0a = where a pure black pixel indicates 2v is adjacent to 1v . In other words, talus borders calcaneus. The pure white diagonal implies that none of the vertices mirrored itself. The IMAGEA has an “←” shape. Similarly, Figure 4 (b), IMAGEB has 650 pixels. In the row-column intersections, the vertices and the edges meet. In row two, there are four black pixels that indicate four incidences. In row nineteen, there are three, and in the remainders there are two. The IMAGEB has a “ے” shape. Figure 3c, IMAGEP has 625 pixels. The five light gray triangles that represent the foot’s five digits. Five-digit foot is a common primate’s feature. The image describes the possible paths, walks, and trails that emanate from the root and terminate at 1jv + . A trail, however, can have only unique elements. This distinguishes a path from a trail. For example, in Trail-1 the sequence begins from 22a1e terminates at 2a4v —the first triangle in Figure. 3 (c), whereas Path-1 begins from 2v and terminates at 2a4v . 2.2 Expanding from Foot Bimechanics By inspection, human foot has twenty-seven bones. It has five digits known as the phalanges. The phalanges control of the drop-off phenomenon—the experience at the end of the stance phase. Calcaneus, on the other hand, works upon the initial contact with the ground. It is the largest bone that bears body weight on heel strike. Navicular and cuboid bear distributed body weight on foot flat.
Figure 4: Above—there are twelve nodes on a footprint, and two nodes that represent the points prior to heel strike and the point just after toe-off during stance. Below—the connecting lines form a gait path that a stance phase should follow.
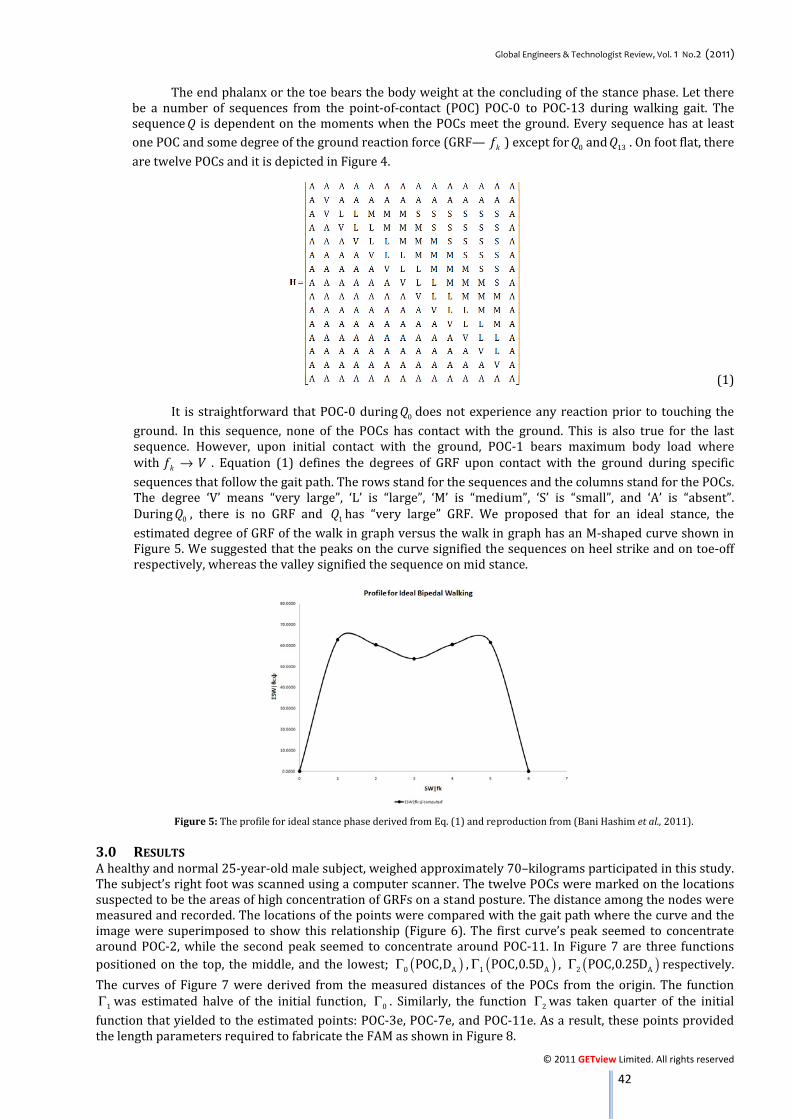
Global Engineers & Technologist Review, Vol. 1 No.2 (2011)
© 2011 GETview Limited. All rights reserved 42
The end phalanx or the toe bears the body weight at the concluding of the stance phase. Let there be a number of sequences from the point-of-contact (POC) POC-0 to POC-13 during walking gait. The sequence Q is dependent on the moments when the POCs meet the ground. Every sequence has at least one POC and some degree of the ground reaction force (GRF— kf ) except for 0Q and 13Q . On foot flat, there are twelve POCs and it is depicted in Figure 4. (1) It is straightforward that POC-0 during 0Q does not experience any reaction prior to touching the ground. In this sequence, none of the POCs has contact with the ground. This is also true for the last sequence. However, upon initial contact with the ground, POC-1 bears maximum body load where with kf V→ . Equation (1) defines the degrees of GRF upon contact with the ground during specific sequences that follow the gait path. The rows stand for the sequences and the columns stand for the POCs. The degree ‘V’ means “very large”, ‘L’ is “large”, ‘M’ is “medium”, ‘S’ is “small”, and ‘A’ is “absent”. During 0Q , there is no GRF and 1Q has “very large” GRF. We proposed that for an ideal stance, the estimated degree of GRF of the walk in graph versus the walk in graph has an M-shaped curve shown in Figure 5. We suggested that the peaks on the curve signified the sequences on heel strike and on toe-off respectively, whereas the valley signified the sequence on mid stance. Figure 5: The profile for ideal stance phase derived from Eq. (1) and reproduction from (Bani Hashim et al., 2011).
3.0 RESULTS A healthy and normal 25-year-old male subject, weighed approximately 70–kilograms participated in this study. The subject’s right foot was scanned using a computer scanner. The twelve POCs were marked on the locations suspected to be the areas of high concentration of GRFs on a stand posture. The distance among the nodes were measured and recorded. The locations of the points were compared with the gait path where the curve and the image were superimposed to show this relationship (Figure 6). The first curve’s peak seemed to concentrate around POC-2, while the second peak seemed to concentrate around POC-11. In Figure 7 are three functions positioned on the top, the middle, and the lowest; ( )Γ0 APOC,D , ( )Γ1 APOC,0.5D , ( )2 APOC,0.25DΓ respectively. The curves of Figure 7 were derived from the measured distances of the POCs from the origin. The function Γ1 was estimated halve of the initial function, Γ0 . Similarly, the function Γ2 was taken quarter of the initial function that yielded to the estimated points: POC-3e, POC-7e, and POC-11e. As a result, these points provided the length parameters required to fabricate the FAM as shown in Figure 8.
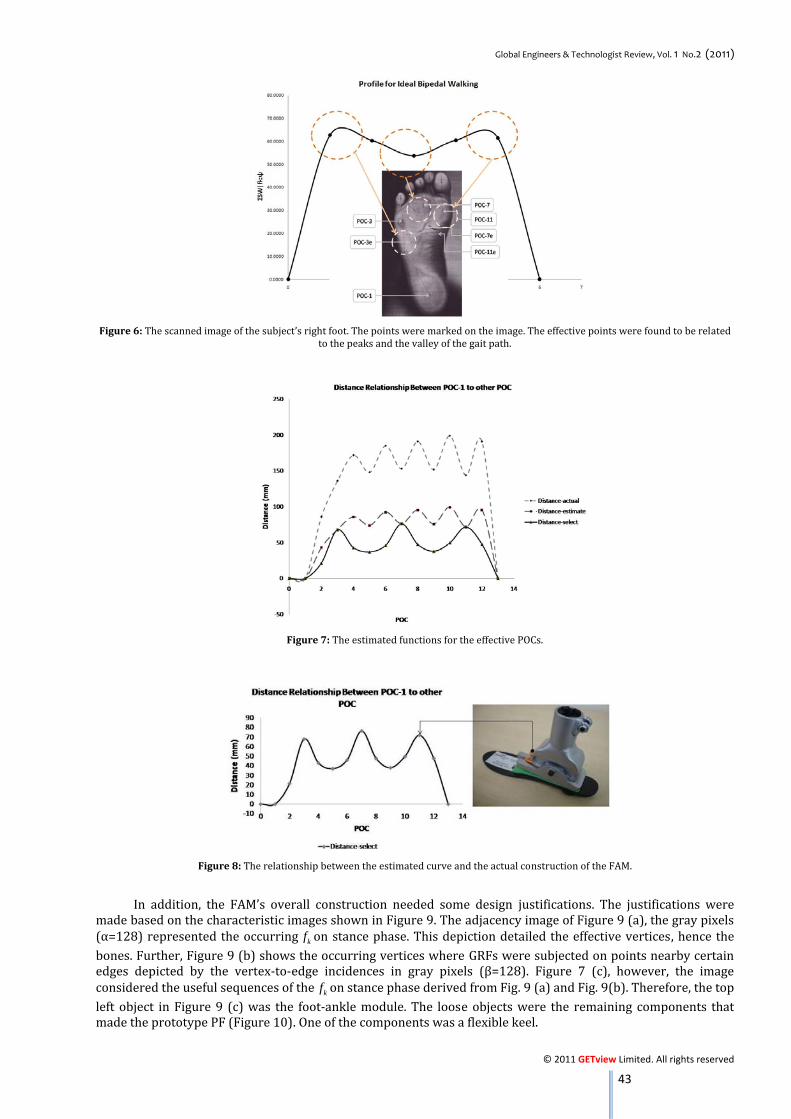
Global Engineers & Technologist Review, Vol. 1 No.2 (2011)
© 2011 GETview Limited. All rights reserved 43
Figure 6: The scanned image of the subject’s right foot. The points were marked on the image. The effective points were found to be related to the peaks and the valley of the gait path.
Figure 7: The estimated functions for the effective POCs.
Figure 8: The relationship between the estimated curve and the actual construction of the FAM. In addition, the FAM’s overall construction needed some design justifications. The justifications were made based on the characteristic images shown in Figure 9. The adjacency image of Figure 9 (a), the gray pixels (α=128) represented the occurring kf on stance phase. This depiction detailed the effective vertices, hence the bones. Further, Figure 9 (b) shows the occurring vertices where GRFs were subjected on points nearby certain edges depicted by the vertex-to-edge incidences in gray pixels (β=128). Figure 7 (c), however, the image considered the useful sequences of the kf on stance phase derived from Fig. 9 (a) and Fig. 9(b). Therefore, the top left object in Figure 9 (c) was the foot-ankle module. The loose objects were the remaining components that made the prototype PF (Figure 10). One of the components was a flexible keel.
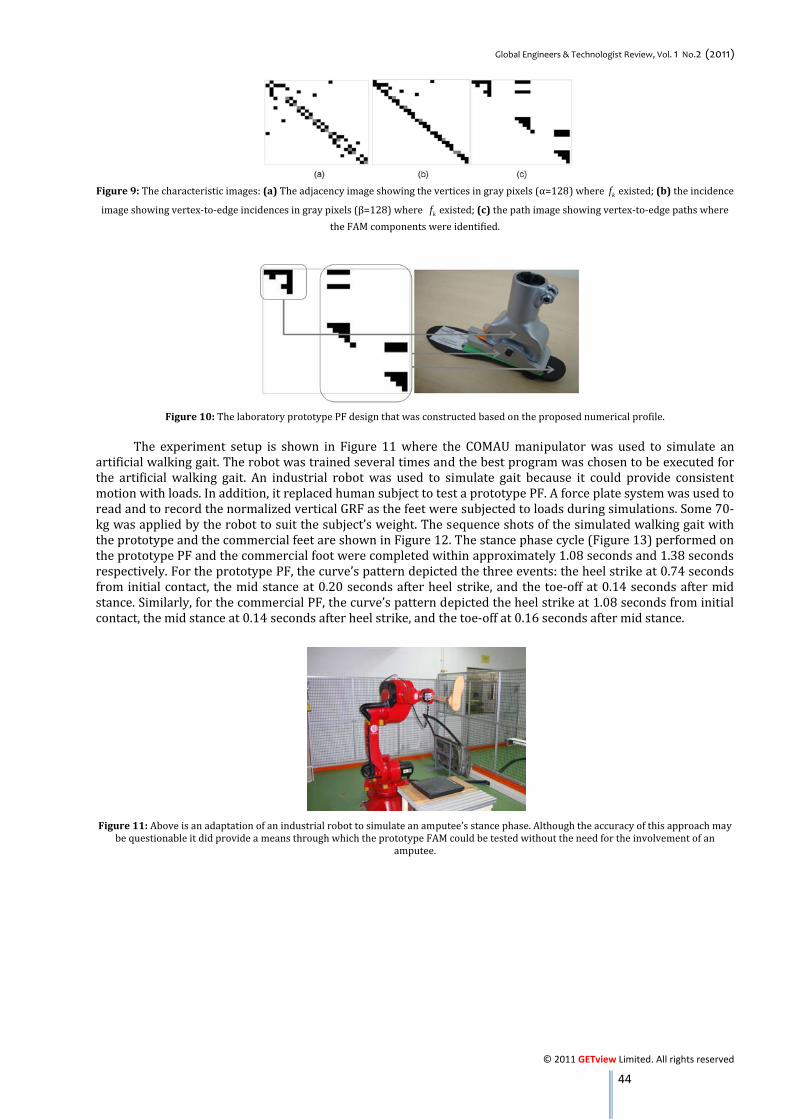
Global Engineers & Technologist Review, Vol. 1 No.2 (2011)
© 2011 GETview Limited. All rights reserved 44
Figure 9: The characteristic images: (a) The adjacency image showing the vertices in gray pixels (α=128) where kf existed; (b) the incidence image showing vertex-to-edge incidences in gray pixels (β=128) where kf existed; (c) the path image showing vertex-to-edge paths where the FAM components were identified.
Figure 10: The laboratory prototype PF design that was constructed based on the proposed numerical profile. The experiment setup is shown in Figure 11 where the COMAU manipulator was used to simulate an artificial walking gait. The robot was trained several times and the best program was chosen to be executed for the artificial walking gait. An industrial robot was used to simulate gait because it could provide consistent motion with loads. In addition, it replaced human subject to test a prototype PF. A force plate system was used to read and to record the normalized vertical GRF as the feet were subjected to loads during simulations. Some 70-kg was applied by the robot to suit the subject’s weight. The sequence shots of the simulated walking gait with the prototype and the commercial feet are shown in Figure 12. The stance phase cycle (Figure 13) performed on the prototype PF and the commercial foot were completed within approximately 1.08 seconds and 1.38 seconds respectively. For the prototype PF, the curve’s pattern depicted the three events: the heel strike at 0.74 seconds from initial contact, the mid stance at 0.20 seconds after heel strike, and the toe-off at 0.14 seconds after mid stance. Similarly, for the commercial PF, the curve’s pattern depicted the heel strike at 1.08 seconds from initial contact, the mid stance at 0.14 seconds after heel strike, and the toe-off at 0.16 seconds after mid stance.
Figure 11: Above is an adaptation of an industrial robot to simulate an amputee’s stance phase. Although the accuracy of this approach may be questionable it did provide a means through which the prototype FAM could be tested without the need for the involvement of an amputee.
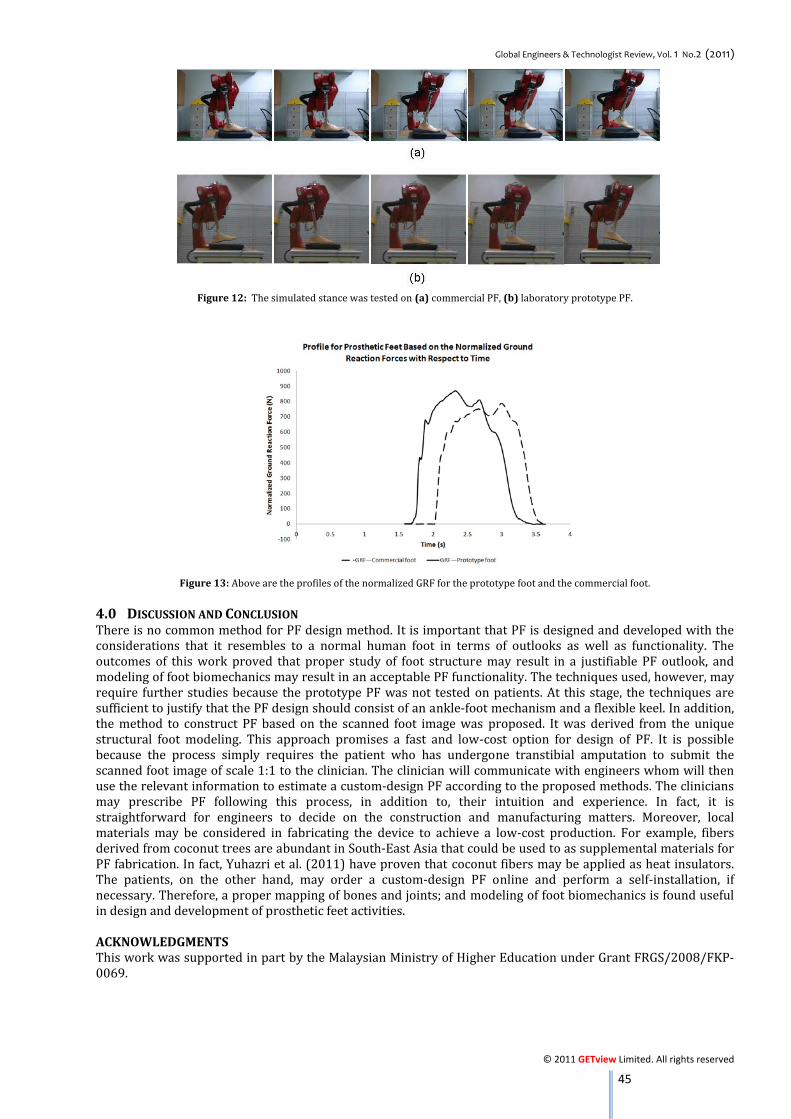
Global Engineers & Technologist Review, Vol. 1 No.2 (2011)
© 2011 GETview Limited. All rights reserved 45
Figure 12: The simulated stance was tested on (a) commercial PF, (b) laboratory prototype PF.
Figure 13: Above are the profiles of the normalized GRF for the prototype foot and the commercial foot. 4.0 DISCUSSION AND CONCLUSION There is no common method for PF design method. It is important that PF is designed and developed with the considerations that it resembles to a normal human foot in terms of outlooks as well as functionality. The outcomes of this work proved that proper study of foot structure may result in a justifiable PF outlook, and modeling of foot biomechanics may result in an acceptable PF functionality. The techniques used, however, may require further studies because the prototype PF was not tested on patients. At this stage, the techniques are sufficient to justify that the PF design should consist of an ankle-foot mechanism and a flexible keel. In addition, the method to construct PF based on the scanned foot image was proposed. It was derived from the unique structural foot modeling. This approach promises a fast and low-cost option for design of PF. It is possible because the process simply requires the patient who has undergone transtibial amputation to submit the scanned foot image of scale 1:1 to the clinician. The clinician will communicate with engineers whom will then use the relevant information to estimate a custom-design PF according to the proposed methods. The clinicians may prescribe PF following this process, in addition to, their intuition and experience. In fact, it is straightforward for engineers to decide on the construction and manufacturing matters. Moreover, local materials may be considered in fabricating the device to achieve a low-cost production. For example, fibers derived from coconut trees are abundant in South-East Asia that could be used to as supplemental materials for PF fabrication. In fact, Yuhazri et al. (2011) have proven that coconut fibers may be applied as heat insulators. The patients, on the other hand, may order a custom-design PF online and perform a self-installation, if necessary. Therefore, a proper mapping of bones and joints; and modeling of foot biomechanics is found useful in design and development of prosthetic feet activities. ACKNOWLEDGMENTS This work was supported in part by the Malaysian Ministry of Higher Education under Grant FRGS/2008/FKP-0069.

Global Engineers & Technologist Review, Vol. 1 No.2 (2011)
© 2011 GETview Limited. All rights reserved 46
REFERENCES [1] Bani Hashim, A.Y., Abu Osman, N.A. and Wan Abas, W.A.B. (2011): Prosthetic Foot Design: The Significance of the Normalized Ground Reaction Force. In Abu Osman, N.A., Wan Abas, W.A.B., Abdul Wahab A.K., and Ting, H.-N. (Eds.), 5th Kuala Lumpur International Conference on Biomedical Engineering (Vol. 35, pp. 765-768). Kuala Lumpur, Malaysia: IFMBE Proceedings. [2] Elftman, H. (1969): Dynamic Structure of the Human Foot. Artificial Limbs, 13, pp. 49-58. [3] Gronley, J.K. and Perry, J. (1984): Gait Analysis Techniques. Physical Therapy, 64, pp. 1837-1838. [4] Krebs, D.E., Edelstein, J.E. and Fishman, S. (1985): Reliability of Observational Kinematic Gait Analysis. Physical Therapy, 65, pp. 1027-1033. [5] Lai, D.T.H., Begg, R.K., and Palaniswami, M. (2009): Computational Intelligence in Gait Research: A Perspective on Current Applications and Future Challenges. IEEE Transactions on Information in Biomedicine, 13, pp. 687-702. [6] Laughman, R.K., Askew, L.J., Bleimeyer, R.R and Chao, E.Y. (1984): Objective Clinical Evaluation of Function Gait Analysis. Physical Therapy, pp. 64. [7] McGinley, J.L., Goldie, P.A., Greenwood, K.M. and Olney, S.J. (2003): Accuracy and Reliability of Observational Gait Analysis Data: Judgments of Push-off in Gait After Stroke. Physical Therapy, 83, pp. 146-160. [8] Peterson, M.J., Perry, J. and Montgomery, J. (1985): Walking Patterns of Healthy Subjects Wearing Rocker Shoes. Physical Therapy, 65, pp. 1483-1489. [9] Prince, F., Winter, D.A., Sjonnensen, G., Powell, C. and Wheeldon, R.K. (1998): Mechanical Efficiency During Gait of Adults with Transtibial Amputation: A Pilot Study Comparing the SACH, Seattle, and Golden-Ankle prosthetic feet. Journal of Rehabilitation Research and Development, 35, pp. 177-185. [10] Su, P.-F., Gard, S.A., Lipschutz, R.D. and Kuiken, T.A. (2007): Gait Chracteristics of Person with Bilateral Transtibial Amputations. Journal of Rehabilitation Research and Development, 44, pp. 491-502. [11] Tsai, L.W. (2001): Mechanism Design: Enumeration of Kinematic Structure Accoring to Function. Boca Raton, Florida: CRC Press. [12] Twiste, M. and Rithalia, S. (2003): Transverse Rotation and Longitudinal Translation During Prosthetic Gait-A literature Review. Journal of Rehabilitation Research and Development, 40, pp. 9-18. [13] Wang, W.J. and Crompton, R.H. (2004): Analysis of the Human and Ape Foot During Bipedal Standing with Implications for the Evolution of the Foot. Journal of Biomechanics, 37, pp. 1831-1836. [14] Winter, D.A. (1984): Kinematics and Kinematics Patterns in Human Gait. Human Movement Science, 3, pp. 51-76. [15] Yuhazri, M.Y., Sihombing, H., Jeefferie, A.R., Ahmad Mujahid, A.Z., Balamurugan, A.G., Norazman, M.N., Shohaimi, A. (2011): Optimazation of Coconut Fibers Toward Heat Insulator Applications. Global Engineers & Technologists Review, Vol. 1 No. 1, pp. 35-40.

Global Engineers & Technologist Review, Vol. 1 No.2 (2011)
© 2011 GETview Limited. All rights reserved 47
APPENDIX , V V ,
if is adjacent 1 to , ;otherwise and 0i
ji j i j
vv
a N N a v V
i j
⎧ ⎫⎛ ⎞⎧⎪ ⎪⎜ ⎟⎪⎪ ⎪⎪⎜ ⎟⎡ ⎤= × = ∈⎨ ⎨ ⎬⎣ ⎦ ⎜ ⎟⎪ ⎪ ⎪⎜ ⎟⎪ ⎪ ⎪⎜ ⎟=⎩⎝ ⎠⎩ ⎭
A (A.1) , V E , 1 if contain , ; , ,0 otherwisei j
i j i j
v eb N N b v e V E
⎧ ⎫⎛ ⎞⎧⎪ ⎪⎡ ⎤= × = ∈⎜ ⎟⎨ ⎨ ⎬⎣ ⎦ ⎜ ⎟⎩⎪ ⎝ ⎠ ⎪
⎩ ⎭
B (A.2) ( )
,, E V , 1
if lies on 1 the path, , 1 ; , ,end at 0 else i j
i j i jj
e
p N N p e v E Vv +
⎧ ⎫⎛ ⎞⎧⎪ ⎪⎜ ⎟⎪⎪ ⎪⎜ ⎟⎪⎡ ⎤= × − = ∈⎨ ⎨ ⎬⎜ ⎟⎣ ⎦⎪ ⎪ ⎪⎜ ⎟⎪ ⎪ ⎪⎜ ⎟⎩⎝ ⎠⎩ ⎭
P (A.3) ,IMAGE IMAGE, , IMAGE, , IMAGE, ,,
0 if 1open ;255 if 0i j
i j i j i j
i j
aa a a
aα
⎧ ⎫⎛ ⎞⎧ =⎪ ⎪⎜ ⎟⎪⎪ ⎪⎡ ⎤= = ∈⎨ ⎨ ⎬⎜ ⎟⎣ ⎦⎪ ⎪ ⎪⎜ ⎟=⎩⎪ ⎪⎝ ⎠⎩ ⎭
A (A4) ,IMAGE IMAGE, , IMAGE, , IMAGE, ,,
0 if 1open ;255 if 0i j
i j i j i j
i j
bb b b
bβ
⎧ ⎫⎛ ⎞⎧ =⎪ ⎪⎜ ⎟⎪⎪ ⎪⎡ ⎤= = ∈⎨ ⎨ ⎬⎜ ⎟⎣ ⎦⎪ ⎪ ⎪⎜ ⎟=⎩⎪ ⎪⎝ ⎠⎩ ⎭
B (A.5) ,
IMAGE IMAGE, , IMAGE, , IMAGE, ,,0 if 1open ;255 if 0else,
i j
i j i j i ji j
p
p p pp
π
τ τ π
⎧ ⎫⎛ ⎞=⎧⎪ ⎪⎜ ⎟⎪⎪ ⎪ ⎪⎜ ⎟⎡ ⎤= = ∈⎨ ⎨ ⎬⎣ ⎦ ⎜ ⎟=⎪ ⎪ ⎪⎜ ⎟⎜ ⎟⎪ ⎪ ⎪≠⎩⎝ ⎠⎩ ⎭
P (A.6)

No 1-1, Jalan KNMP 2A, Kompleks Niaga Melaka Perdana, 75450, Ayer Keroh, Melaka, MALAYSIA.