Genome-Wide Gene Expression Profiling of Randall...
15
CLINICAL RESEARCH www.jasn.org Genome-Wide Gene Expression Profiling of Randall’s Plaques in Calcium Oxalate Stone Formers Kazumi Taguchi,* † Shuzo Hamamoto,* Atsushi Okada,* Rei Unno,* Hideyuki Kamisawa,* † Taku Naiki,* Ryosuke Ando,* Kentaro Mizuno,* Noriyasu Kawai,* Keiichi Tozawa,* Kenjiro Kohri,* and Takahiro Yasui* *Department of Nephro-urology, Nagoya City University Graduate School of Medical Sciences, Nagoya, Japan; and † Department of Urology, Social Medical Corporation Kojunkai Daido Hospital, Daido Clinic, Nagoya, Japan ABSTRACT Randall plaques (RPs) can contribute to the formation of idiopathic calcium oxalate (CaOx) kidney stones; however, genes related to RP formation have not been identified. We previously reported the potential therapeutic role of osteopontin (OPN) and macrophages in CaOx kidney stone formation, discovered using genome-recombined mice and genome-wide analyses. Here, to characterize the genetic patho- genesis of RPs, we used microarrays and immunohistology to compare gene expression among renal papillary RP and non-RP tissues of 23 CaOx stone formers (SFs) (age- and sex-matched) and normal papillary tissue of seven controls. Transmission electron microscopy showed OPN and collagen expression inside and around RPs, respectively. Cluster analysis revealed that the papillary gene expression of CaOx SFs differed significantly from that of controls. Disease and function analysis of gene expression revealed activation of cellular hyperpolarization, reproductive development, and molecular transport in papillary tissue from RPs and non-RP regions of CaOx SFs. Compared with non-RP tissue, RP tissue showed upregulation (˃2-fold) of LCN2, IL11, PTGS1, GPX3, and MMD and downregulation (0.5-fold) of SLC12A1 and NALCN (P,0.01). In network and toxicity analyses, these genes associated with activated mitogen- activated protein kinase, the Akt/phosphatidylinositol 3-kinase pathway, and proinflammatory cytokines that cause renal injury and oxidative stress. Additionally, expression of proinflammatory cytokines, num- bers of immune cells, and cellular apoptosis increased in RP tissue. This study establishes an association between genes related to renal dysfunction, proinflammation, oxidative stress, and ion transport and RP development in CaOx SFs. J Am Soc Nephrol 28: ccc–ccc, 2016. doi: 10.1681/ASN.2015111271 The prevalence of kidney stone disease is nearly 9% in the adult population and continues to increase world- wide. 1,2 This condition has a medical and economic impact 3 and is reported to be associated with compli- cations such as metabolic syndrome (MetS) 4,5 and ESRD. 6 The pathogenesis of kidney stone formation has been investigated, and there are two major theories for predicting lithogenesis. 7 One pathway involves for- mation of intra-tubular crystals in the duct of Bellini, the so-called Randall plugs, as observed with both ex- perimental hyperoxaluria-induced animal models 8 and human primary hyperoxaluria and with calcium phosphate (CaP), struvite, in addition to some idio- pathic calcium oxalate (CaOx) stone formers (SFs). The other pathway involves overgrowth on interstitial apatite plaques, the so-called Randall plaques (RPs), 9 as observed in some idiopathic CaOx SFs. Received November 27, 2015. Accepted May 4, 2016. K. Taguchi and S.H. contributed equally to this work. Published online ahead of print. Publication date available at www.jasn.org. Correspondence: Dr. Atsushi Okada, Department of Nephro-urology, Nagoya City University Graduate School of Medical Sciences, 1 Kawasumi, Mizuho-cho, Mizuho-ku, Nagoya 467-8601, Japan. Email address: [email protected] Copyright © 2016 by the American Society of Nephrology J Am Soc Nephrol 28: ccc–ccc, 2016 ISSN : 1046-6673/2801-ccc 1
Transcript of Genome-Wide Gene Expression Profiling of Randall...

CLINICAL RESEARCH www.jasn.org
Genome-Wide Gene Expression Profiling of Randall’sPlaques in Calcium Oxalate Stone Formers
Kazumi Taguchi,*† Shuzo Hamamoto,* Atsushi Okada,* Rei Unno,* Hideyuki Kamisawa,*†
Taku Naiki,* Ryosuke Ando,* Kentaro Mizuno,* Noriyasu Kawai,* Keiichi Tozawa,*Kenjiro Kohri,* and Takahiro Yasui*
*Department of Nephro-urology, Nagoya City University Graduate School of Medical Sciences, Nagoya, Japan; and†Department of Urology, Social Medical Corporation Kojunkai Daido Hospital, Daido Clinic, Nagoya, Japan
ABSTRACTRandall plaques (RPs) can contribute to the formation of idiopathic calcium oxalate (CaOx) kidney stones;however, genes related to RP formation have not been identified. We previously reported the potentialtherapeutic role of osteopontin (OPN) and macrophages in CaOx kidney stone formation, discoveredusing genome-recombined mice and genome-wide analyses. Here, to characterize the genetic patho-genesis of RPs, we used microarrays and immunohistology to compare gene expression among renalpapillary RP and non-RP tissues of 23 CaOx stone formers (SFs) (age- and sex-matched) and normalpapillary tissue of seven controls. Transmission electronmicroscopy showedOPNand collagen expressioninside and around RPs, respectively. Cluster analysis revealed that the papillary gene expression of CaOxSFs differed significantly from that of controls. Disease and function analysis of gene expression revealedactivation of cellular hyperpolarization, reproductive development, and molecular transport in papillarytissue from RPs and non-RP regions of CaOx SFs. Compared with non-RP tissue, RP tissue showedupregulation (˃2-fold) of LCN2, IL11, PTGS1, GPX3, andMMD and downregulation (0.5-fold) of SLC12A1and NALCN (P,0.01). In network and toxicity analyses, these genes associated with activated mitogen-activated protein kinase, the Akt/phosphatidylinositol 3-kinase pathway, and proinflammatory cytokinesthat cause renal injury and oxidative stress. Additionally, expression of proinflammatory cytokines, num-bers of immune cells, and cellular apoptosis increased in RP tissue. This study establishes an associationbetween genes related to renal dysfunction, proinflammation, oxidative stress, and ion transport and RPdevelopment in CaOx SFs.
J Am Soc Nephrol 28: ccc–ccc, 2016. doi: 10.1681/ASN.2015111271
The prevalence of kidney stone disease is nearly 9% inthe adult population and continues to increase world-wide.1,2 This condition has a medical and economicimpact3 and is reported to be associated with compli-cations such as metabolic syndrome (MetS)4,5 andESRD.6 The pathogenesis of kidney stone formationhas been investigated, and there are twomajor theoriesfor predicting lithogenesis.7One pathway involves for-mation of intra-tubular crystals in the duct of Bellini,the so-called Randall plugs, as observed with both ex-perimental hyperoxaluria-induced animal models8
and human primary hyperoxaluria and with calciumphosphate (CaP), struvite, in addition to some idio-pathic calcium oxalate (CaOx) stone formers (SFs).
The other pathway involves overgrowth on interstitialapatite plaques, the so-called Randall plaques (RPs),9
as observed in some idiopathic CaOx SFs.
Received November 27, 2015. Accepted May 4, 2016.
K. Taguchi and S.H. contributed equally to this work.
Published online ahead of print. Publication date available atwww.jasn.org.
Correspondence: Dr. Atsushi Okada, Department of Nephro-urology,Nagoya City University Graduate School of Medical Sciences, 1Kawasumi, Mizuho-cho, Mizuho-ku, Nagoya 467-8601, Japan.Email address: [email protected]
Copyright © 2016 by the American Society of Nephrology
J Am Soc Nephrol 28: ccc–ccc, 2016 ISSN : 1046-6673/2801-ccc 1
In a recent study using genome-wide analysis and genome-recombined mice, we found OPN expression in renal tubularcells and macrophage (Mw) migration in the interstitial spacearound crystals to be essential for stone formation.10–12We foundthat the anti-inflammatory phenotype Mw played a suppressiverole in kidney stone formation via renal crystal phagocytosis.13
Differentiation and induction of anti-inflammatory Mw areconsidered a potential therapeutic approach for kidney stonedisease; however, this evidence is only applicable toRandall plugs,which have similarities with the hyperoxaluric mouse model.Understanding of RPs is also essential to clarify the potential ofmolecular therapies, such as OPN and Mw-related genes.
Regarding the origin of some idiopathic CaOx kidneystones, Evan et al.mademajor contributions to the study of themicroscopic structure of RPs, which begin in the basementmembranes of thin loops of Henle with calcium deposits.14
Despite numerous studies involving animal hyperoxaluricstone models and human samples,15 the exact role of RP inthe formation of CaOx crystals remains unknown. Since mor-phologic, mineral, and matrix-based investigations provided
the pathologic united theory of RP formation,16 molecular-level analysis of cellular function is necessary for betterunderstanding of the role of RPs. The recently developednephroureteroscopic technique permits more detailed analy-sis of RPs involving both microscopic and genomic analyses.17
Therefore, to establish molecular-targeted therapies forkidney stones, we investigated the gene expression profiles ofRP sections from human papillary tissues and studied thefactors controlling the development of RPs using microarrayand immunohistochemical analyses.
RESULTS
Patient BackgroundPatients who underwent percutaneous nephrolithotomy orretrograde intrarenal surgery for calcium-based stones were
Table 1. Patient backgrounds
CharacteristicsControl(n=7)
CaOx SFs(n=23)
P Value
GeneralAge, y 56618 59613 NSa
Gender, M/F 4:3 14, 9 NSc
Side, Rt/Lt 3:4 13, 10 NSc
BMI, kg/m2 22.162.9 23.364.7 NSa
StoneStone compositionCaOx, % — 91.469.1 —
CaP, % — 5.567.5 —
Stone volume, mm3— 76161528 —
Stone density, HU — 8206375 —
Hydronephrosis, grade 0,I,II 5,1,1 12, 6, 5 NSd
SerumBUN, mg/dl 12.863.7 14.563.8 NSb
Cre, mg/dl 0.960.4 0.960.2 NSb
Ca, mg/dl 9.460.7 9.460.6 NSb
P, mg/dl 3.261.0 3.160.3 NSb
UA, mg/dl 4.961.2 5.861.6 NSb
WBC, cells/ml 651461748 678361853 NSb
CRP, mg/dl 1.961.7 0.360.1 NSb
Urine NSb
pH 6.860.6 6.660.7 NSb
WBC, cells/HPF 9610 19628 NSb
RBC, cells/HPF 16637 19629 NSb
Data are presented as the mean6SD. Grade of hydronephrosis was cate-gorized by Society for Fetal Urology. NS, not significant; M, male; F, female;Rt, right; Lt, left; BMI, bodymass index;—, inapplicable data; HU, Hounsfieldunit; BUN, blood urea nitrogen; Cre, creatinine; Ca, calcium; P, phosphorus;UA, uric acid; WBC, white blood cell; CRP, c-reactive protein; HPF, highpower field; RBC, red blood cell.aStatistical analyses performed by t test.bStatistical analyses performed by Mann–Whitney U test.cStatistical analyses performed by Fisher exact test.dStatistical analyses were performed by Kruskal–Wallis test.
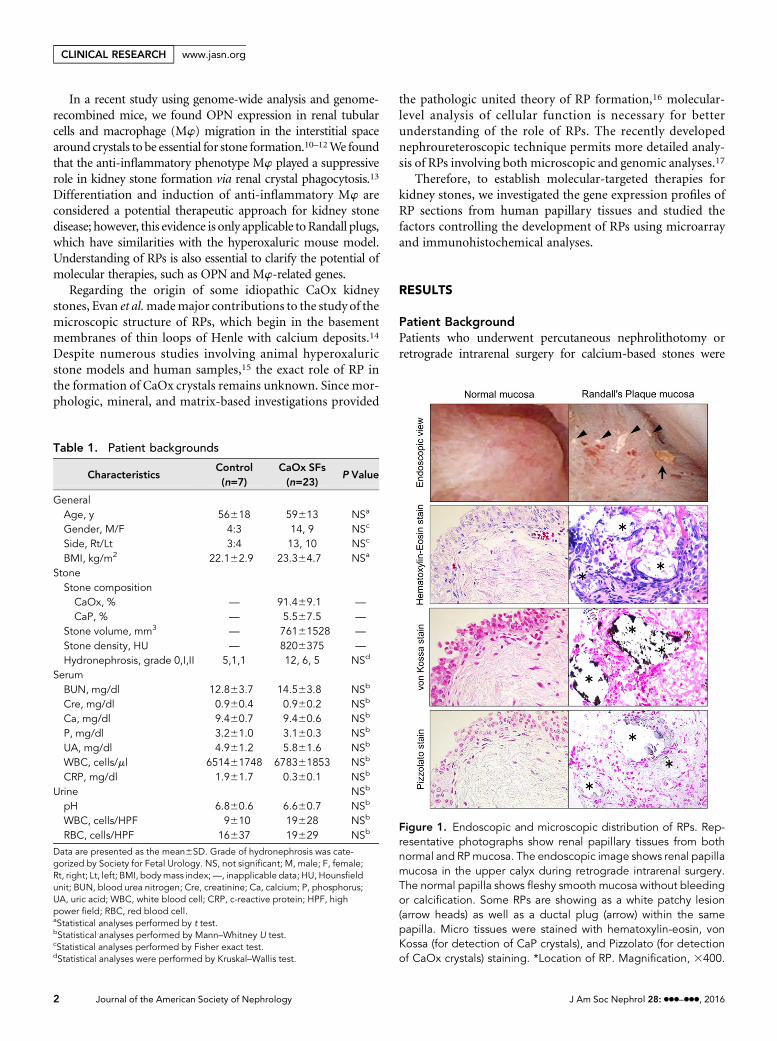
Figure 1. Endoscopic and microscopic distribution of RPs. Rep-resentative photographs show renal papillary tissues from bothnormal and RPmucosa. The endoscopic image shows renal papillamucosa in the upper calyx during retrograde intrarenal surgery.The normal papilla shows fleshy smooth mucosa without bleedingor calcification. Some RPs are showing as a white patchy lesion(arrow heads) as well as a ductal plug (arrow) within the samepapilla. Micro tissues were stained with hematoxylin-eosin, vonKossa (for detection of CaP crystals), and Pizzolato (for detectionof CaOx crystals) staining. *Location of RP. Magnification, 3400.
2 Journal of the American Society of Nephrology J Am Soc Nephrol 28: ccc–ccc, 2016
CLINICAL RESEARCH www.jasn.org
enrolled in this study. There were no statistical differences in thegeneral background among the seven controls and 23 CaOx SFssuchasage,gender, sideof treatment,andbodymass index.Basedon the composition of the stone fragments obtained duringlithotripsy, CaOx SF was defined as a patient with kidney and/orureter stones that had .80% content of CaOx crystals. Therewere no significant differences in serum and urine parametersamong the three groups (Table 1).
Observation of RPs and the Surrounding TissueDuring the endoscopic intrarenal operation, RPs were ob-served as plain white calcification regions that were coveredwith the papillary epithelium when viewed through a neph-roureteroscope. Some RPs coexisted with ductal plugs in thesame renal calyx papilla. Hematoxylin-eosin staining showeddestruction of the papillary epithelium layer and interstitialcellular disorder surrounding RPs. The RPs were positive forvon Kossa staining but negative for Pizzolato staining,
indicating that RPs contained CaP but did not have a CaOxcomponent (Figure 1).
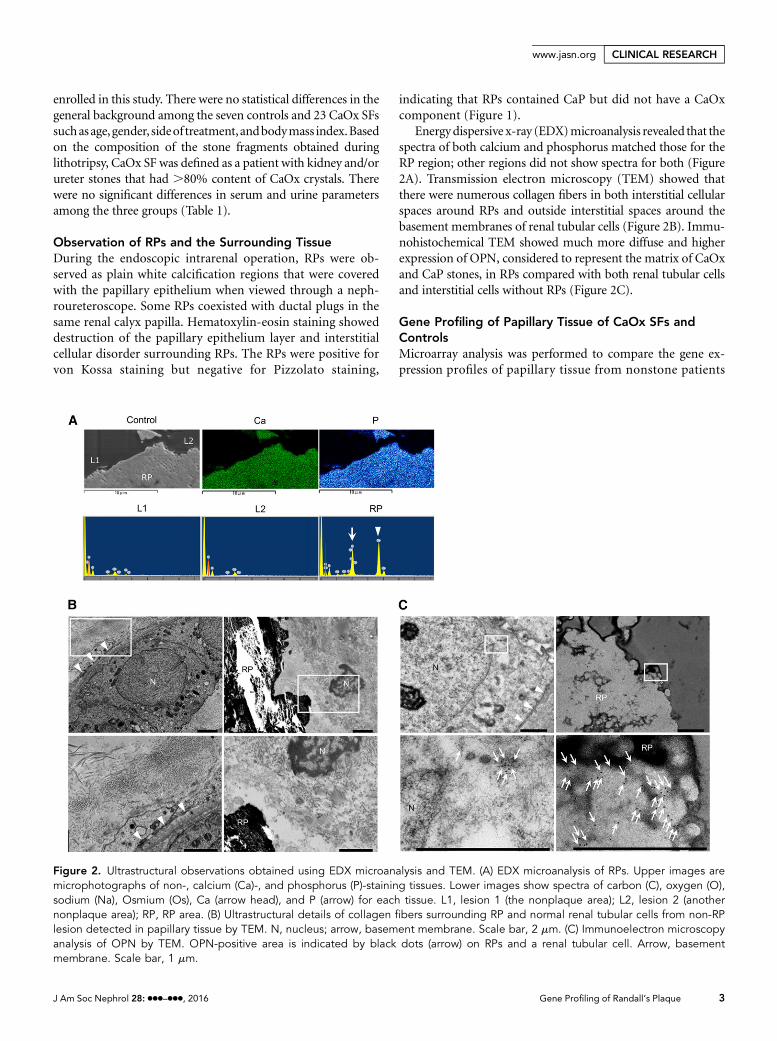
Energydispersive x-ray (EDX)microanalysis revealed that thespectra of both calcium and phosphorus matched those for theRP region; other regions did not show spectra for both (Figure2A). Transmission electron microscopy (TEM) showed thatthere were numerous collagen fibers in both interstitial cellularspaces around RPs and outside interstitial spaces around thebasement membranes of renal tubular cells (Figure 2B). Immu-nohistochemical TEM showed much more diffuse and higherexpression of OPN, considered to represent the matrix of CaOxand CaP stones, in RPs compared with both renal tubular cellsand interstitial cells without RPs (Figure 2C).
Gene Profiling of Papillary Tissue of CaOx SFs andControlsMicroarray analysis was performed to compare the gene ex-pression profiles of papillary tissue from nonstone patients
Figure 2. Ultrastructural observations obtained using EDX microanalysis and TEM. (A) EDX microanalysis of RPs. Upper images aremicrophotographs of non-, calcium (Ca)-, and phosphorus (P)-staining tissues. Lower images show spectra of carbon (C), oxygen (O),sodium (Na), Osmium (Os), Ca (arrow head), and P (arrow) for each tissue. L1, lesion 1 (the nonplaque area); L2, lesion 2 (anothernonplaque area); RP, RP area. (B) Ultrastructural details of collagen fibers surrounding RP and normal renal tubular cells from non-RPlesion detected in papillary tissue by TEM. N, nucleus; arrow, basement membrane. Scale bar, 2 mm. (C) Immunoelectron microscopyanalysis of OPN by TEM. OPN-positive area is indicated by black dots (arrow) on RPs and a renal tubular cell. Arrow, basementmembrane. Scale bar, 1 mm.
J Am Soc Nephrol 28: ccc–ccc, 2016 Gene Profiling of Randall’s Plaque 3
www.jasn.org CLINICAL RESEARCH
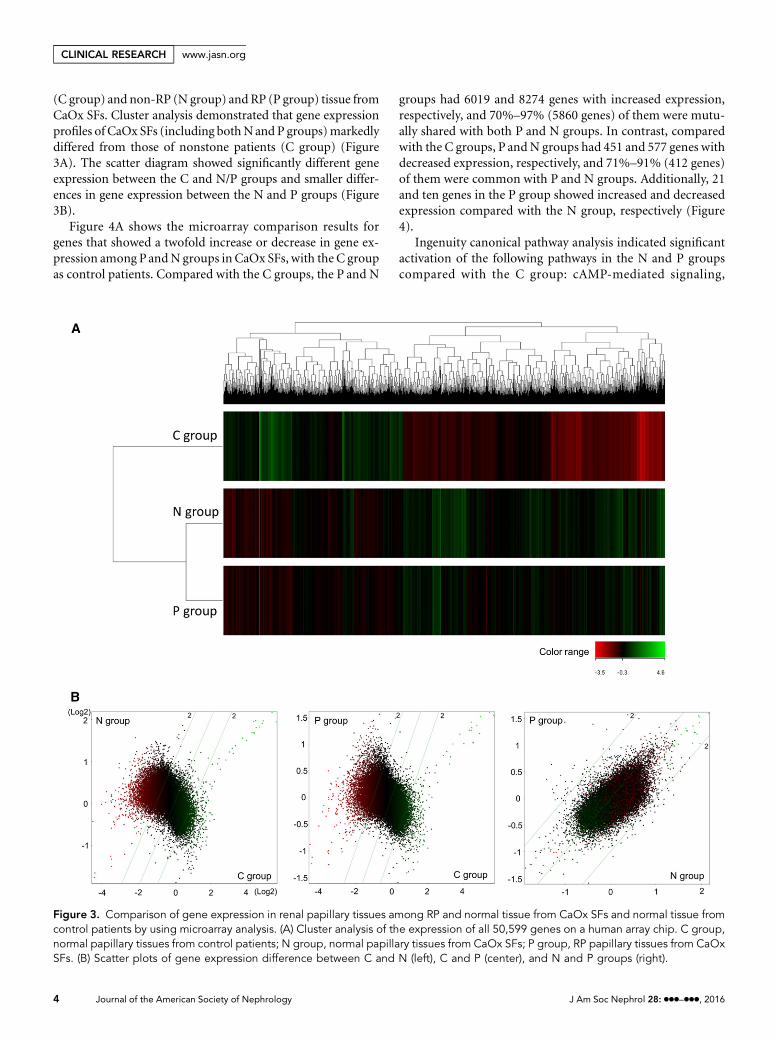
(C group) and non-RP (N group) and RP (P group) tissue fromCaOx SFs. Cluster analysis demonstrated that gene expressionprofiles of CaOx SFs (including bothNand P groups)markedlydiffered from those of nonstone patients (C group) (Figure3A). The scatter diagram showed significantly different geneexpression between the C and N/P groups and smaller differ-ences in gene expression between the N and P groups (Figure3B).
Figure 4A shows the microarray comparison results forgenes that showed a twofold increase or decrease in gene ex-pression among PandN groups in CaOx SFs, with the C groupas control patients. Compared with the C groups, the P and N
groups had 6019 and 8274 genes with increased expression,respectively, and 70%–97% (5860 genes) of them were mutu-ally shared with both P and N groups. In contrast, comparedwith the C groups, P andN groups had 451 and 577 genes withdecreased expression, respectively, and 71%–91% (412 genes)of them were common with P and N groups. Additionally, 21and ten genes in the P group showed increased and decreasedexpression compared with the N group, respectively (Figure4).
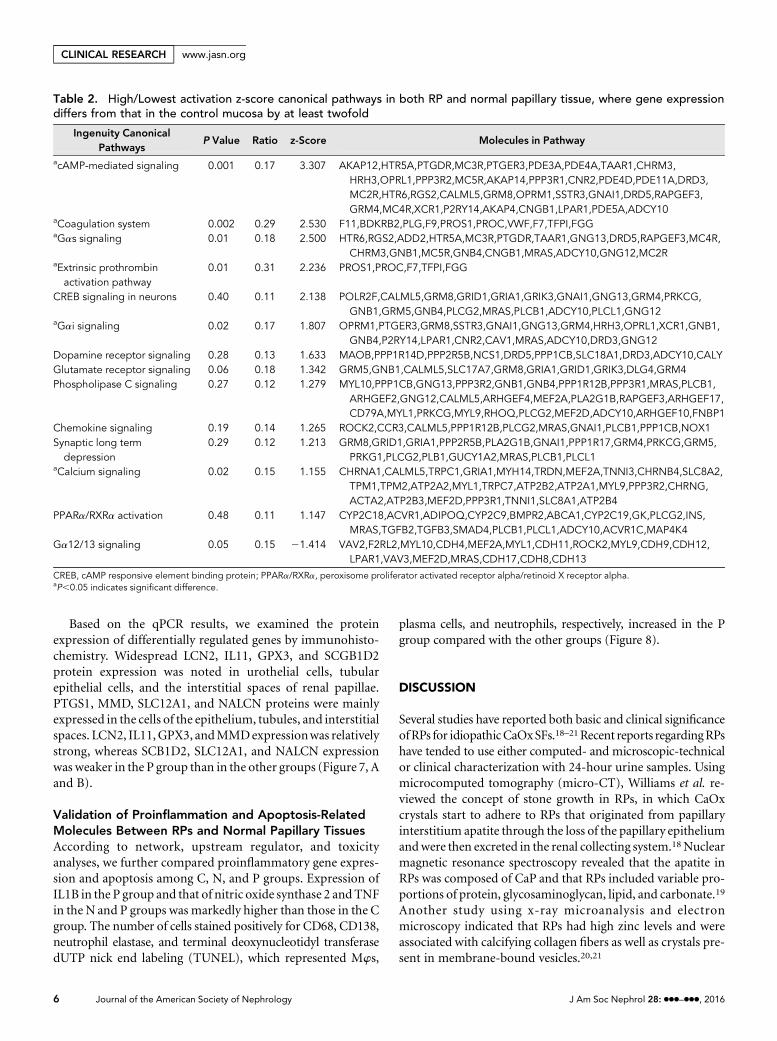
Ingenuity canonical pathway analysis indicated significantactivation of the following pathways in the N and P groupscompared with the C group: cAMP-mediated signaling,
Figure 3. Comparison of gene expression in renal papillary tissues among RP and normal tissue from CaOx SFs and normal tissue fromcontrol patients by using microarray analysis. (A) Cluster analysis of the expression of all 50,599 genes on a human array chip. C group,normal papillary tissues from control patients; N group, normal papillary tissues from CaOx SFs; P group, RP papillary tissues from CaOxSFs. (B) Scatter plots of gene expression difference between C and N (left), C and P (center), and N and P groups (right).
4 Journal of the American Society of Nephrology J Am Soc Nephrol 28: ccc–ccc, 2016
CLINICAL RESEARCH www.jasn.org

coagulation system, ga signaling, extrinsic prothrombin activa-tion pathway, and calcium signaling (Table 2).
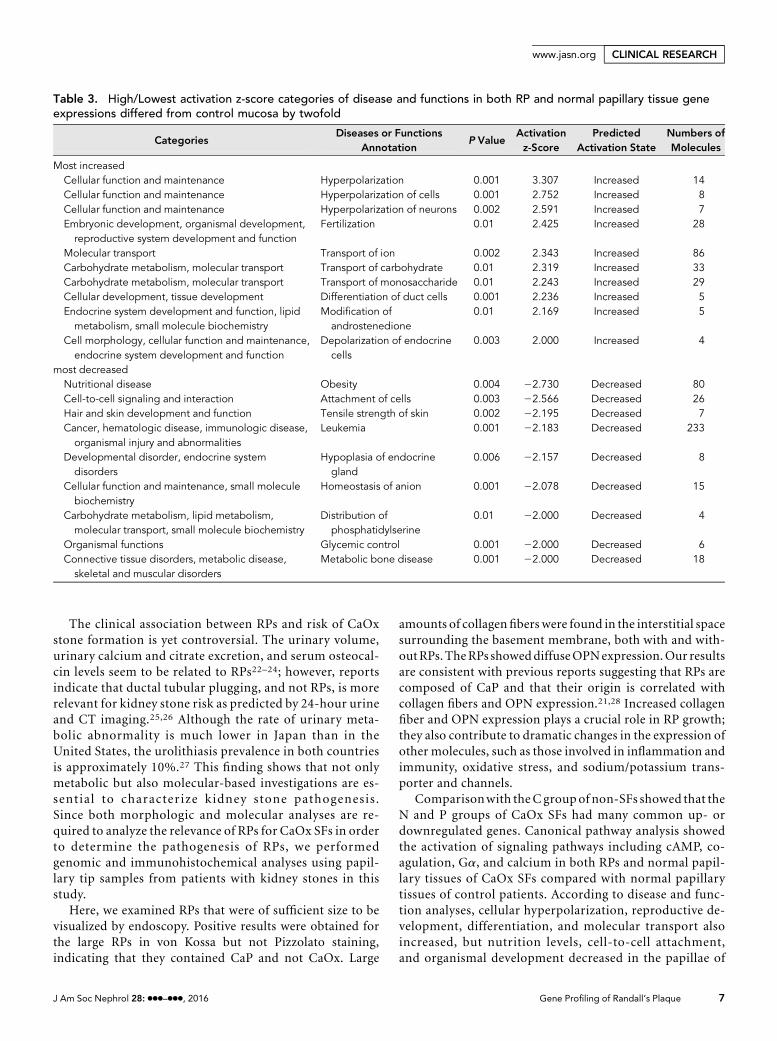
Per disease and function analyses, upregulated genescommon to both P and N groups were categorized based oncell/neuronhyperpolarization, fertilization, ion/carbohydrate/monosaccharide transport, duct cell differentiation, andros-tenedione modification, and endocrine cell depolarization.Downregulated genes common between P and N groups werecategorized to obesity, cell attachment, tensile strength of theskin, leukemia, endocrine gland hypoplasia, anion homeosta-sis, phosphatidylserine distribution, glycemic control, andmetabolic bone disease (Table 3).
The top 100 up- or downregulated genes and top networksin the N and P groups compared with those in the C group areshown in Supplemental Tables 1–3.
Gene Profiling of RP Tissue in CaOx SFsThe top eight genes that were upregulated by .2-fold ordownregulated by ,0.5-fold in the P group compared withthe N group of CaOx SFs are listed in Table 4.
Network analyses of genes whose expression differed by.2-fold or ,0.5-fold in the P group compared with the Ngroup are shown in Supplemental Table 4. The top-scorednetwork demonstrated upregulation of lipocalin (LCN) 2, IL11, secretory leukocyte peptidase inhibitor (SLPI), mucin 4,
PG-endoperoxide synthase (PTGS) 1, monocyte to macro-phage differentiation (MMD), and chromosome 8 openreading frame 4, and downregulation of potassium channelinwardly rectifying subfamily J member 1, solute carrierfamily 12 member 1 (SLC12A1), and sodium leak channelnonselective (NALCN) were related to extracellular proin-flammatory cytokine and intracellular signal pathways (Fig-ure 5).
IL1b and TNF were determined to be upstream cytokinesupregulated among genes in the P group compared with the Ngroup (Supplemental Table 5).
Toxicity analysis showed that LCN2, IL11, glutathioneperoxidase (GPX) 3, and aquaporin (AQP) 1 were responsiblefor ARF, renal ischemia-reperfusion injury, cardiac hypertro-phy, and oxidative stress (Table 5).
Validation of Up/Downregulated Molecules in RPPapillary Tissues of CaOx SFsTo validate the mRNA and protein expression results, we usedquantitative RT-PCR (qPCR) and immunohistochemicalstaining. The mRNA expression of LCN2, IL11, SLPI,PTGS1, GPX3, and MMD in the P group was significantlyhigher and that of secretoglobin family 1D member 2(SCGB1D2), SLC12A1, and NALCN was significantly lowerthan that in the N group (Figure 6, A and B).
Figure 4. Scheme of the microarray analysis demonstrated diversity of gene expression difference among each group. (A) Comparison ofeach group and gene expression changes. Each extracted value represents the number of statistically different genes with.2.0- or,0.5-folddifference in expression between groups. P, RP papillary tissue group from CaOx SFs; N, normal papillary tissue group from CaOx SFs; C,normal papillary tissue group from control patients. (B) Venn diagram of a select number of genes that showed .2.0-fold difference inexpression in both normal and RP papillary tissue of CaOx SFs compared with normal papillary tissue of control patients (left red figure), andthe number of genes that showed ,0.5-fold difference in expression in both normal and RP papillary tissue of CaOx SFs compared withnormal papillary tissue of control patients (right blue figure).
J Am Soc Nephrol 28: ccc–ccc, 2016 Gene Profiling of Randall’s Plaque 5
www.jasn.org CLINICAL RESEARCH
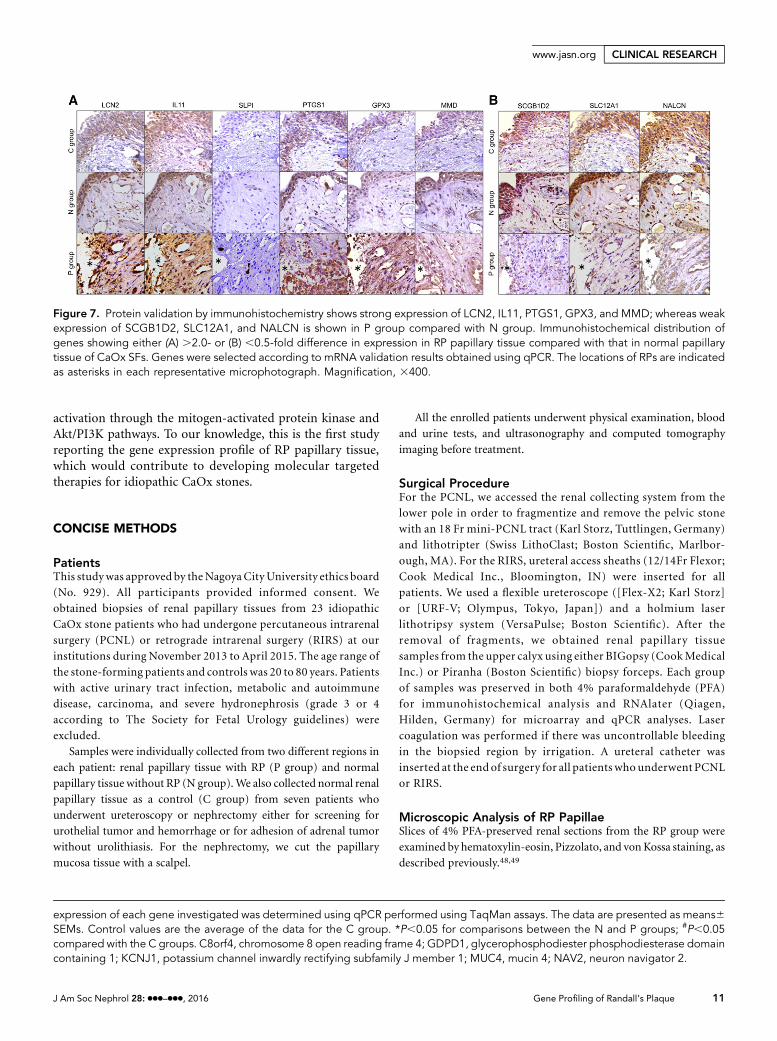
Based on the qPCR results, we examined the proteinexpression of differentially regulated genes by immunohisto-chemistry. Widespread LCN2, IL11, GPX3, and SCGB1D2protein expression was noted in urothelial cells, tubularepithelial cells, and the interstitial spaces of renal papillae.PTGS1, MMD, SLC12A1, and NALCN proteins were mainlyexpressed in the cells of the epithelium, tubules, and interstitialspaces. LCN2, IL11,GPX3, andMMDexpressionwas relativelystrong, whereas SCB1D2, SLC12A1, and NALCN expressionwas weaker in the P group than in the other groups (Figure 7, Aand B).
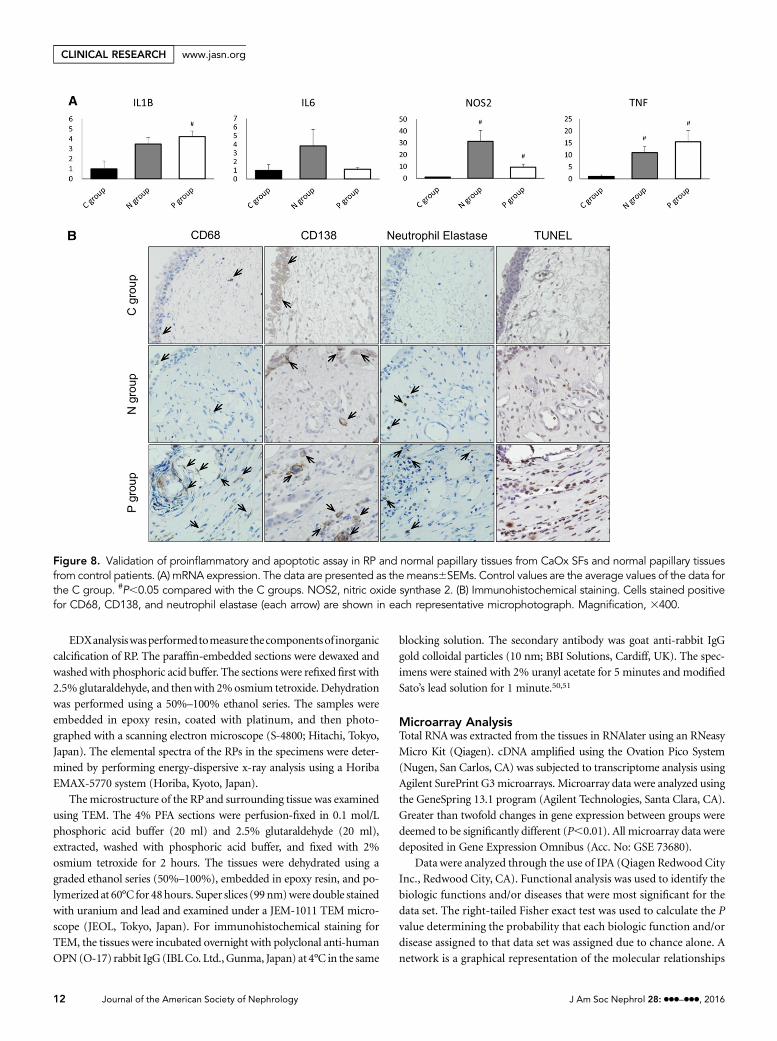
Validation of Proinflammation and Apoptosis-RelatedMolecules Between RPs and Normal Papillary TissuesAccording to network, upstream regulator, and toxicityanalyses, we further compared proinflammatory gene expres-sion and apoptosis among C, N, and P groups. Expression ofIL1B in the P group and that of nitric oxide synthase 2 and TNFin the N and P groups was markedly higher than those in the Cgroup. The number of cells stained positively for CD68, CD138,neutrophil elastase, and terminal deoxynucleotidyl transferasedUTP nick end labeling (TUNEL), which represented Mws,
plasma cells, and neutrophils, respectively, increased in the Pgroup compared with the other groups (Figure 8).
DISCUSSION
Several studies have reported both basic and clinical significanceofRPs for idiopathicCaOxSFs.18–21Recent reports regardingRPshave tended to use either computed- and microscopic-technicalor clinical characterization with 24-hour urine samples. Usingmicrocomputed tomography (micro-CT), Williams et al. re-viewed the concept of stone growth in RPs, in which CaOxcrystals start to adhere to RPs that originated from papillaryinterstitium apatite through the loss of the papillary epitheliumandwere then excreted in the renal collecting system.18Nuclearmagnetic resonance spectroscopy revealed that the apatite inRPs was composed of CaP and that RPs included variable pro-portions of protein, glycosaminoglycan, lipid, and carbonate.19
Another study using x-ray microanalysis and electronmicroscopy indicated that RPs had high zinc levels and wereassociated with calcifying collagen fibers as well as crystals pre-sent in membrane-bound vesicles.20,21
Table 2. High/Lowest activation z-score canonical pathways in both RP and normal papillary tissue, where gene expressiondiffers from that in the control mucosa by at least twofold
Ingenuity CanonicalPathways
P Value Ratio z-Score Molecules in Pathway
acAMP-mediated signaling 0.001 0.17 3.307 AKAP12,HTR5A,PTGDR,MC3R,PTGER3,PDE3A,PDE4A,TAAR1,CHRM3,HRH3,OPRL1,PPP3R2,MC5R,AKAP14,PPP3R1,CNR2,PDE4D,PDE11A,DRD3,MC2R,HTR6,RGS2,CALML5,GRM8,OPRM1,SSTR3,GNAI1,DRD5,RAPGEF3,GRM4,MC4R,XCR1,P2RY14,AKAP4,CNGB1,LPAR1,PDE5A,ADCY10
aCoagulation system 0.002 0.29 2.530 F11,BDKRB2,PLG,F9,PROS1,PROC,VWF,F7,TFPI,FGGaGas signaling 0.01 0.18 2.500 HTR6,RGS2,ADD2,HTR5A,MC3R,PTGDR,TAAR1,GNG13,DRD5,RAPGEF3,MC4R,
CHRM3,GNB1,MC5R,GNB4,CNGB1,MRAS,ADCY10,GNG12,MC2RaExtrinsic prothrombinactivation pathway
0.01 0.31 2.236 PROS1,PROC,F7,TFPI,FGG
CREB signaling in neurons 0.40 0.11 2.138 POLR2F,CALML5,GRM8,GRID1,GRIA1,GRIK3,GNAI1,GNG13,GRM4,PRKCG,GNB1,GRM5,GNB4,PLCG2,MRAS,PLCB1,ADCY10,PLCL1,GNG12
aGai signaling 0.02 0.17 1.807 OPRM1,PTGER3,GRM8,SSTR3,GNAI1,GNG13,GRM4,HRH3,OPRL1,XCR1,GNB1,GNB4,P2RY14,LPAR1,CNR2,CAV1,MRAS,ADCY10,DRD3,GNG12
Dopamine receptor signaling 0.28 0.13 1.633 MAOB,PPP1R14D,PPP2R5B,NCS1,DRD5,PPP1CB,SLC18A1,DRD3,ADCY10,CALYGlutamate receptor signaling 0.06 0.18 1.342 GRM5,GNB1,CALML5,SLC17A7,GRM8,GRIA1,GRID1,GRIK3,DLG4,GRM4Phospholipase C signaling 0.27 0.12 1.279 MYL10,PPP1CB,GNG13,PPP3R2,GNB1,GNB4,PPP1R12B,PPP3R1,MRAS,PLCB1,
ARHGEF2,GNG12,CALML5,ARHGEF4,MEF2A,PLA2G1B,RAPGEF3,ARHGEF17,CD79A,MYL1,PRKCG,MYL9,RHOQ,PLCG2,MEF2D,ADCY10,ARHGEF10,FNBP1
Chemokine signaling 0.19 0.14 1.265 ROCK2,CCR3,CALML5,PPP1R12B,PLCG2,MRAS,GNAI1,PLCB1,PPP1CB,NOX1Synaptic long termdepression
0.29 0.12 1.213 GRM8,GRID1,GRIA1,PPP2R5B,PLA2G1B,GNAI1,PPP1R17,GRM4,PRKCG,GRM5,PRKG1,PLCG2,PLB1,GUCY1A2,MRAS,PLCB1,PLCL1
aCalcium signaling 0.02 0.15 1.155 CHRNA1,CALML5,TRPC1,GRIA1,MYH14,TRDN,MEF2A,TNNI3,CHRNB4,SLC8A2,TPM1,TPM2,ATP2A2,MYL1,TRPC7,ATP2B2,ATP2A1,MYL9,PPP3R2,CHRNG,ACTA2,ATP2B3,MEF2D,PPP3R1,TNNI1,SLC8A1,ATP2B4
PPARa/RXRa activation 0.48 0.11 1.147 CYP2C18,ACVR1,ADIPOQ,CYP2C9,BMPR2,ABCA1,CYP2C19,GK,PLCG2,INS,MRAS,TGFB2,TGFB3,SMAD4,PLCB1,PLCL1,ADCY10,ACVR1C,MAP4K4
Ga12/13 signaling 0.05 0.15 21.414 VAV2,F2RL2,MYL10,CDH4,MEF2A,MYL1,CDH11,ROCK2,MYL9,CDH9,CDH12,LPAR1,VAV3,MEF2D,MRAS,CDH17,CDH8,CDH13
CREB, cAMP responsive element binding protein; PPARa/RXRa, peroxisome proliferator activated receptor alpha/retinoid X receptor alpha.aP,0.05 indicates significant difference.
6 Journal of the American Society of Nephrology J Am Soc Nephrol 28: ccc–ccc, 2016
CLINICAL RESEARCH www.jasn.org
The clinical association between RPs and risk of CaOxstone formation is yet controversial. The urinary volume,urinary calcium and citrate excretion, and serum osteocal-cin levels seem to be related to RPs22–24; however, reportsindicate that ductal tubular plugging, and not RPs, is morerelevant for kidney stone risk as predicted by 24-hour urineand CT imaging.25,26 Although the rate of urinary meta-bolic abnormality is much lower in Japan than in theUnited States, the urolithiasis prevalence in both countriesis approximately 10%.27 This finding shows that not onlymetabolic but also molecular-based investigations are es-sential to character ize kidney stone pathogenesis .Since both morphologic and molecular analyses are re-quired to analyze the relevance of RPs for CaOx SFs in orderto determine the pathogenesis of RPs, we performedgenomic and immunohistochemical analyses using papil-lary tip samples from patients with kidney stones in thisstudy.
Here, we examined RPs that were of sufficient size to bevisualized by endoscopy. Positive results were obtained forthe large RPs in von Kossa but not Pizzolato staining,indicating that they contained CaP and not CaOx. Large
amounts of collagenfibers were found in the interstitial spacesurrounding the basement membrane, both with and with-outRPs. TheRPs showeddiffuseOPNexpression.Our resultsare consistent with previous reports suggesting that RPs arecomposed of CaP and that their origin is correlated withcollagen fibers and OPN expression.21,28 Increased collagenfiber and OPN expression plays a crucial role in RP growth;they also contribute to dramatic changes in the expression ofother molecules, such as those involved in inflammation andimmunity, oxidative stress, and sodium/potassium trans-porter and channels.
Comparisonwith theC groupof non-SFs showed that theN and P groups of CaOx SFs had many common up- ordownregulated genes. Canonical pathway analysis showedthe activation of signaling pathways including cAMP, co-agulation, Ga, and calcium in both RPs and normal papil-lary tissues of CaOx SFs compared with normal papillarytissues of control patients. According to disease and func-tion analyses, cellular hyperpolarization, reproductive de-velopment, differentiation, and molecular transport alsoincreased, but nutrition levels, cell-to-cell attachment,and organismal development decreased in the papillae of
Table 3. High/Lowest activation z-score categories of disease and functions in both RP and normal papillary tissue geneexpressions differed from control mucosa by twofold
CategoriesDiseases or Functions
AnnotationP Value
Activationz-Score
PredictedActivation State
Numbers ofMolecules
Most increasedCellular function and maintenance Hyperpolarization 0.001 3.307 Increased 14Cellular function and maintenance Hyperpolarization of cells 0.001 2.752 Increased 8Cellular function and maintenance Hyperpolarization of neurons 0.002 2.591 Increased 7Embryonic development, organismal development,reproductive system development and function
Fertilization 0.01 2.425 Increased 28
Molecular transport Transport of ion 0.002 2.343 Increased 86Carbohydrate metabolism, molecular transport Transport of carbohydrate 0.01 2.319 Increased 33Carbohydrate metabolism, molecular transport Transport of monosaccharide 0.01 2.243 Increased 29Cellular development, tissue development Differentiation of duct cells 0.001 2.236 Increased 5Endocrine system development and function, lipidmetabolism, small molecule biochemistry
Modification ofandrostenedione
0.01 2.169 Increased 5
Cell morphology, cellular function and maintenance,endocrine system development and function
Depolarization of endocrinecells
0.003 2.000 Increased 4
most decreasedNutritional disease Obesity 0.004 22.730 Decreased 80Cell-to-cell signaling and interaction Attachment of cells 0.003 22.566 Decreased 26Hair and skin development and function Tensile strength of skin 0.002 22.195 Decreased 7Cancer, hematologic disease, immunologic disease,organismal injury and abnormalities
Leukemia 0.001 22.183 Decreased 233
Developmental disorder, endocrine systemdisorders
Hypoplasia of endocrinegland
0.006 22.157 Decreased 8
Cellular function and maintenance, small moleculebiochemistry
Homeostasis of anion 0.001 22.078 Decreased 15
Carbohydrate metabolism, lipid metabolism,molecular transport, small molecule biochemistry
Distribution ofphosphatidylserine
0.01 22.000 Decreased 4
Organismal functions Glycemic control 0.001 22.000 Decreased 6Connective tissue disorders, metabolic disease,skeletal and muscular disorders
Metabolic bone disease 0.001 22.000 Decreased 18
J Am Soc Nephrol 28: ccc–ccc, 2016 Gene Profiling of Randall’s Plaque 7
www.jasn.org CLINICAL RESEARCH
CaOx SFs compared with those of controls. Additionally,other networks related to the cardiovascular system, im-mune response, and inflammatory disease were raised asthe top associated networks in differences between papillaeof CaOx SFs and controls. The diversity of the results wasderived from the heterogeneity of sample tissues, whichconsisted of a large amount of renal tubular and interstitialcells and a small amount of urothelial and immune cells asshown in Figure 8B and Supplemental Figure 1. However,the predicted association between CaOx SFs and non-SFs asdescribed above supports the united RP formation the-ory16,29–31 involving disorders of cellular structure, signal-ing, differentiation, mineral density, tissue inflammation,and vascular formation.
Microarray, network, and validation analyses showed thatthe RP papillary tissue of CaOx SFs had higher LCN2, IL11,PTGS1, GPX3, and MMD expression and lower SLC12A1 andNALCNexpression. Network analysis demonstrated that thesegenes were directly related to each other via extracellularsignal-regulated kinase 1/2,32,33 Akt/phosphatidylinositol3-kinase, protein kinase a (Pka), and proinflammatory cyto-kines. LCN2, which is also known as neutrophil gelatinase-associated LCN, is expressed in tubular cells,Mw, andneutrophilsand is related to cellular apoptosis and inflammation.34,35
IL11, a member of the IL6 family, is associated with oxidativestress and compensatory proliferation.36 Some studies report-ed that both neutrophil gelatinase-associated LCN and IL11are important biomarkers for AKI.37–39
PTGS1, also known as cyclooxygenase-1, acts as a vaso-constrictor in the kidney and contributes to development ofarterial hypertension.40 Stoller et al. have supportively hy-pothesized the theory that kidney stones and RPs could becaused by renal vascular injury.29,30 GPX3 is found in therenal tubular cells in basement membranes, which indicatesthe existence of oxidative stress.41 Toxicity analysis showedthat ARF, ischemia-reperfusion injury, and oxidative stresswere associated with gene expression of LCN2, GPX3, IL11,and AQP1, such that not only renal tubular and urothelialcell damage but also some kinds of vascular injury resultedin RP formation. Although the Akt/PI3K pathway is relatedto suppression of renal cell apoptosis and facilitation ofvascularization, MMD positively regulates Akt/PI3K activa-tion in Mw.42,43 Since MMD expression occurs via stimu-lation of proinflammatory Mw,43 MMD upregulationresulted in activation of proinflammatory cytokines andoxidative stress.
The downregulated genes SLC12A1 and NALCN encode amembrane transporter and channel, respectively. SLC12A1
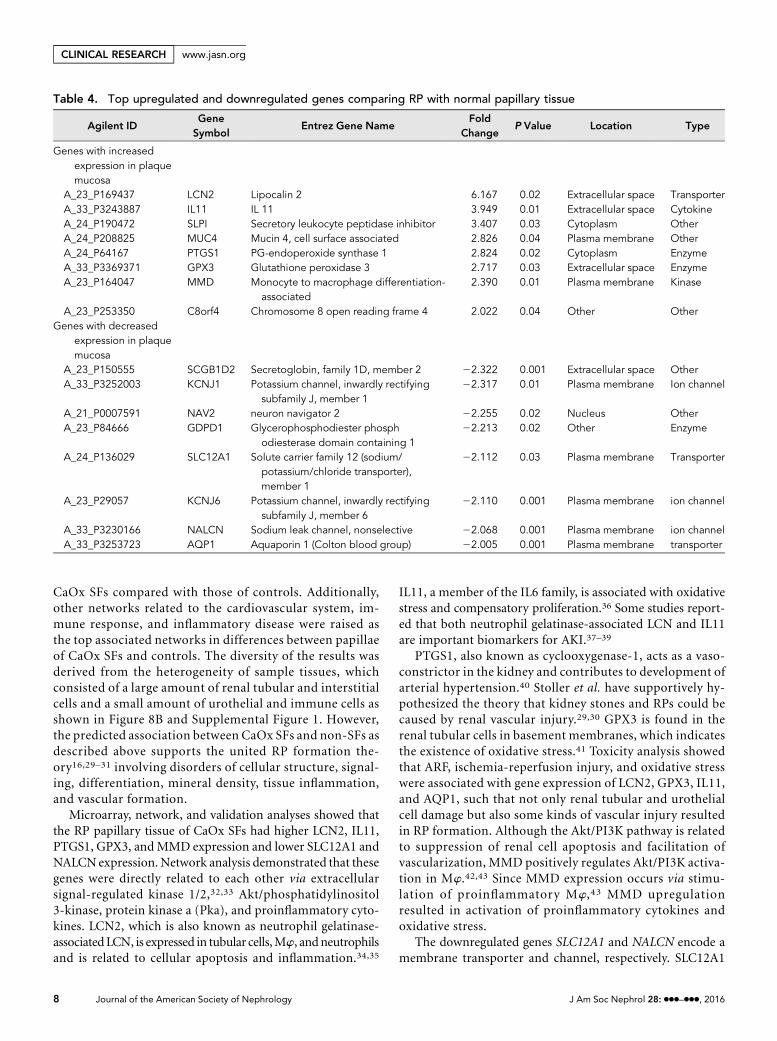
Table 4. Top upregulated and downregulated genes comparing RP with normal papillary tissue
Agilent IDGeneSymbol
Entrez Gene NameFold
ChangeP Value Location Type
Genes with increasedexpression in plaquemucosa
A_23_P169437 LCN2 Lipocalin 2 6.167 0.02 Extracellular space TransporterA_33_P3243887 IL11 IL 11 3.949 0.01 Extracellular space CytokineA_24_P190472 SLPI Secretory leukocyte peptidase inhibitor 3.407 0.03 Cytoplasm OtherA_24_P208825 MUC4 Mucin 4, cell surface associated 2.826 0.04 Plasma membrane OtherA_24_P64167 PTGS1 PG-endoperoxide synthase 1 2.824 0.02 Cytoplasm EnzymeA_33_P3369371 GPX3 Glutathione peroxidase 3 2.717 0.03 Extracellular space EnzymeA_23_P164047 MMD Monocyte to macrophage differentiation-
associated2.390 0.01 Plasma membrane Kinase
A_23_P253350 C8orf4 Chromosome 8 open reading frame 4 2.022 0.04 Other OtherGenes with decreased
expression in plaquemucosa
A_23_P150555 SCGB1D2 Secretoglobin, family 1D, member 2 22.322 0.001 Extracellular space OtherA_33_P3252003 KCNJ1 Potassium channel, inwardly rectifying
subfamily J, member 122.317 0.01 Plasma membrane Ion channel
A_21_P0007591 NAV2 neuron navigator 2 22.255 0.02 Nucleus OtherA_23_P84666 GDPD1 Glycerophosphodiester phosph
odiesterase domain containing 122.213 0.02 Other Enzyme
A_24_P136029 SLC12A1 Solute carrier family 12 (sodium/potassium/chloride transporter),member 1
22.112 0.03 Plasma membrane Transporter
A_23_P29057 KCNJ6 Potassium channel, inwardly rectifyingsubfamily J, member 6
22.110 0.001 Plasma membrane ion channel
A_33_P3230166 NALCN Sodium leak channel, nonselective 22.068 0.001 Plasma membrane ion channelA_33_P3253723 AQP1 Aquaporin 1 (Colton blood group) 22.005 0.001 Plasma membrane transporter
8 Journal of the American Society of Nephrology J Am Soc Nephrol 28: ccc–ccc, 2016
CLINICAL RESEARCH www.jasn.org

is a sodium-potassium-chloride transporter found in the as-cending limb of the loop of Henle and is responsible for Battersyndrome type 1. SLC12A1 deficiency results in renal hypo-kalemia, alkalosis, hypercalciuria, and nephrocalcinosis, andwe previously found that CaOx SFs had single-nucleotidepolymorphisms of SLC12A1.44,45 NALCN is a nonselectivesodium leak channel that is related to osmoregulation mainlyin neuron cells.46 Although the contribution of NALCN torenal papillary tissue has not yet been identified, deficiencyof this gene might cause renal cell damage and alteration inintratubular mineral saturation with SLC12A1.
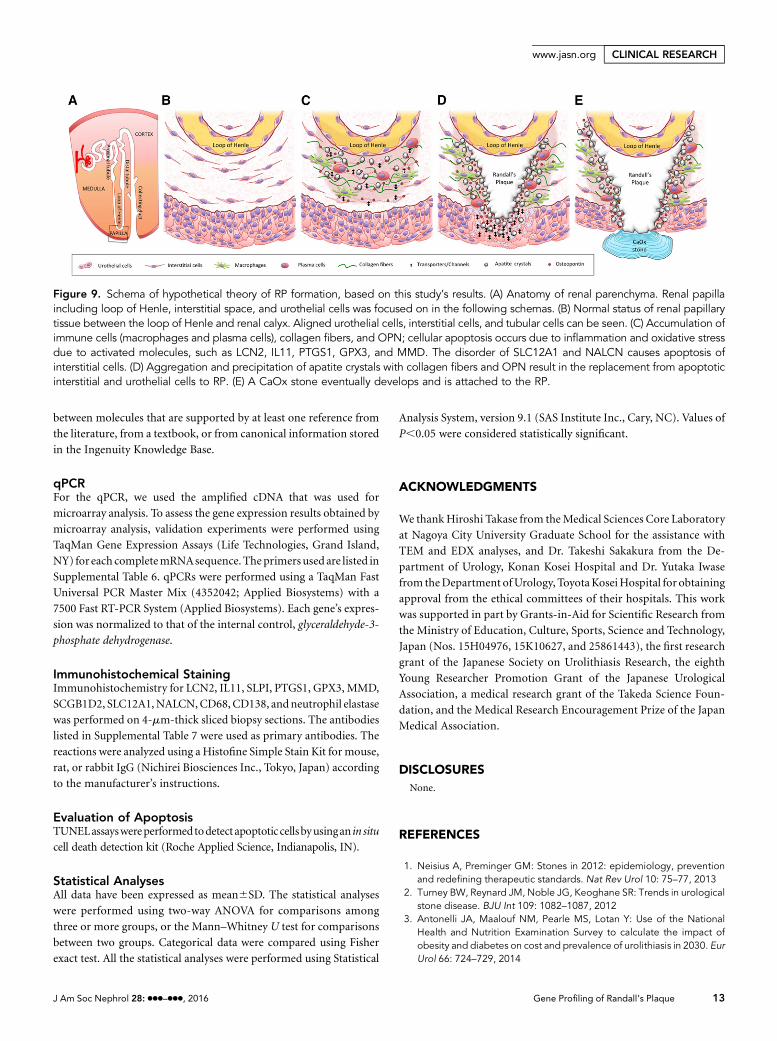
Finally, in addition to the detected inflammatory networkand validation of each candidate gene responsible using the RPsite, the upstream regulator analysis showed activation of IL1Band TNF; therefore, we validated the major proinflammatorycascade and cell expression. As a recent study mentioned,47
these inflammation and cellular disorders might contribute toRP formation (Figure 9).
There are some limitations to this study. First, the lack ofclinical data like those for 24-hour urine samples limits theclinical significanceof the gene expressionprofiling of patients.Second, the heterogeneity and mechanical damage of biopsiedpapillary tissue may have resulted in inconsistency amonganalyses, with indication of an inflammatory response andlimited infiltration of immune cells as shown in immunohis-tochemistry. Third, comparison of papillary tissues with orwithout RPs from the same kidney decreased the detection ofother responsible candidate genes not statistically but clini-cally.
In conclusion, we found compelling evidence that genesrelated to renal injury, vasoconstriction, oxidative stress, Mw,and sodium/potassium transporters and channels contributeto RP development in CaOx SFs via proinflammatory
Figure 5. Network function of inflammatory response, cellular movement, cell-to-cell signaling, and interaction between RP and normalpapillary tissues in CaOx SFs (defined by either .2.0- or ,0.5-fold difference in expression; P,0.01). Red shapes indicate upregulatedmRNAs, while gray shapes indicate downregulated mRNAs. Different shapes and prediction outlines are indicated in the legend box.
Table 5. Toxicity analysis of genes which expressed overtwofold differences between RP and normal papillary tissue
IngenuityToxicity Lists
P Value Ratio Genes in Lists
ARF panel (rat) 0.001 0.03 LCN2, AQP1Persistent renal ischemia-reperfusion injury (mouse)
0.02 0.03 LCN2
Cardiac hypertrophy 0.04 0.01 GPX3, IL11Oxidative stress 0.04 0.01 GPX3
J Am Soc Nephrol 28: ccc–ccc, 2016 Gene Profiling of Randall’s Plaque 9
www.jasn.org CLINICAL RESEARCH

Figure 6. mRNA validation by qPCR shows significant higher expression of LCN2, IL11, SLPI, PTGS1, GPX3, and MMD; whereas lowerexpression of SCGB1D2, SLC12A1, and NALCN is shown in P group compared with N group. mRNA validation of genes showing either(A) .2.0- or (B) ,0.5-fold difference in expression in RP papillary tissue compared with that in normal papillary tissue of CaOx SFs. The
10 Journal of the American Society of Nephrology J Am Soc Nephrol 28: ccc–ccc, 2016
CLINICAL RESEARCH www.jasn.org
activation through the mitogen-activated protein kinase andAkt/PI3K pathways. To our knowledge, this is the first studyreporting the gene expression profile of RP papillary tissue,which would contribute to developing molecular targetedtherapies for idiopathic CaOx stones.
CONCISE METHODS
PatientsThis studywas approved by theNagoya CityUniversity ethics board
(No. 929). All participants provided informed consent. We
obtained biopsies of renal papillary tissues from 23 idiopathic
CaOx stone patients who had undergone percutaneous intrarenal
surgery (PCNL) or retrograde intrarenal surgery (RIRS) at our
institutions during November 2013 to April 2015. The age range of
the stone-forming patients and controls was 20 to 80 years. Patients
with active urinary tract infection, metabolic and autoimmune
disease, carcinoma, and severe hydronephrosis (grade 3 or 4
according to The Society for Fetal Urology guidelines) were
excluded.
Samples were individually collected from two different regions in
each patient: renal papillary tissue with RP (P group) and normal
papillary tissue without RP (N group).We also collected normal renal
papillary tissue as a control (C group) from seven patients who
underwent ureteroscopy or nephrectomy either for screening for
urothelial tumor and hemorrhage or for adhesion of adrenal tumor
without urolithiasis. For the nephrectomy, we cut the papillary
mucosa tissue with a scalpel.
All the enrolled patients underwent physical examination, blood
and urine tests, and ultrasonography and computed tomography
imaging before treatment.
Surgical ProcedureFor the PCNL, we accessed the renal collecting system from the
lower pole in order to fragmentize and remove the pelvic stone
with an 18 Fr mini-PCNL tract (Karl Storz, Tuttlingen, Germany)
and lithotripter (Swiss LithoClast; Boston Scientific, Marlbor-
ough, MA). For the RIRS, ureteral access sheaths (12/14Fr Flexor;
Cook Medical Inc., Bloomington, IN) were inserted for all
patients. We used a flexible ureteroscope ([Flex-X2; Karl Storz]
or [URF-V; Olympus, Tokyo, Japan]) and a holmium laser
lithotripsy system (VersaPulse; Boston Scientific). After the
removal of fragments, we obtained renal papillary tissue
samples from the upper calyx using either BIGopsy (CookMedical
Inc.) or Piranha (Boston Scientific) biopsy forceps. Each group
of samples was preserved in both 4% paraformaldehyde (PFA)
for immunohistochemical analysis and RNAlater (Qiagen,
Hilden, Germany) for microarray and qPCR analyses. Laser
coagulation was performed if there was uncontrollable bleeding
in the biopsied region by irrigation. A ureteral catheter was
inserted at the end of surgery for all patients who underwent PCNL
or RIRS.
Microscopic Analysis of RP PapillaeSlices of 4% PFA-preserved renal sections from the RP group were
examined by hematoxylin-eosin, Pizzolato, and vonKossa staining, as
described previously.48,49
Figure 7. Protein validation by immunohistochemistry shows strong expression of LCN2, IL11, PTGS1, GPX3, and MMD; whereas weakexpression of SCGB1D2, SLC12A1, and NALCN is shown in P group compared with N group. Immunohistochemical distribution ofgenes showing either (A) .2.0- or (B) ,0.5-fold difference in expression in RP papillary tissue compared with that in normal papillarytissue of CaOx SFs. Genes were selected according to mRNA validation results obtained using qPCR. The locations of RPs are indicatedas asterisks in each representative microphotograph. Magnification, 3400.
expression of each gene investigated was determined using qPCR performed using TaqMan assays. The data are presented as means6SEMs. Control values are the average of the data for the C group. *P,0.05 for comparisons between the N and P groups; #P,0.05compared with the C groups. C8orf4, chromosome 8 open reading frame 4; GDPD1, glycerophosphodiester phosphodiesterase domaincontaining 1; KCNJ1, potassium channel inwardly rectifying subfamily J member 1; MUC4, mucin 4; NAV2, neuron navigator 2.
J Am Soc Nephrol 28: ccc–ccc, 2016 Gene Profiling of Randall’s Plaque 11
www.jasn.org CLINICAL RESEARCH
EDXanalysiswasperformedtomeasure thecomponentsof inorganic
calcification of RP. The paraffin-embedded sections were dewaxed and
washedwith phosphoric acid buffer. The sections were refixed first with
2.5%glutaraldehyde, and thenwith 2%osmium tetroxide. Dehydration
was performed using a 50%–100% ethanol series. The samples were
embedded in epoxy resin, coated with platinum, and then photo-
graphed with a scanning electron microscope (S-4800; Hitachi, Tokyo,
Japan). The elemental spectra of the RPs in the specimens were deter-
mined by performing energy-dispersive x-ray analysis using a Horiba
EMAX-5770 system (Horiba, Kyoto, Japan).
Themicrostructure of the RP and surrounding tissue was examined
using TEM. The 4% PFA sections were perfusion-fixed in 0.1 mol/L
phosphoric acid buffer (20 ml) and 2.5% glutaraldehyde (20 ml),
extracted, washed with phosphoric acid buffer, and fixed with 2%
osmium tetroxide for 2 hours. The tissues were dehydrated using a
graded ethanol series (50%–100%), embedded in epoxy resin, and po-
lymerized at 60°C for 48hours. Super slices (99 nm)were double stained
with uranium and lead and examined under a JEM-1011 TEM micro-
scope (JEOL, Tokyo, Japan). For immunohistochemical staining for
TEM, the tissues were incubated overnight with polyclonal anti-human
OPN (O-17) rabbit IgG (IBLCo. Ltd.,Gunma, Japan) at 4°C in the same
blocking solution. The secondary antibody was goat anti-rabbit IgG
gold colloidal particles (10 nm; BBI Solutions, Cardiff, UK). The spec-
imens were stained with 2% uranyl acetate for 5 minutes and modified
Sato’s lead solution for 1 minute.50,51
Microarray AnalysisTotal RNAwas extracted from the tissues in RNAlater using an RNeasy
Micro Kit (Qiagen). cDNA amplified using the Ovation Pico System
(Nugen, San Carlos, CA) was subjected to transcriptome analysis using
Agilent SurePrint G3microarrays. Microarray data were analyzed using
the GeneSpring 13.1 program (Agilent Technologies, Santa Clara, CA).
Greater than twofold changes in gene expression between groups were
deemed to be significantly different (P,0.01). All microarray data were
deposited in Gene Expression Omnibus (Acc. No: GSE 73680).
Data were analyzed through the use of IPA (Qiagen Redwood City
Inc., Redwood City, CA). Functional analysis was used to identify the
biologic functions and/or diseases that were most significant for the
data set. The right-tailed Fisher exact test was used to calculate the P
value determining the probability that each biologic function and/or
disease assigned to that data set was assigned due to chance alone. A
network is a graphical representation of the molecular relationships
Figure 8. Validation of proinflammatory and apoptotic assay in RP and normal papillary tissues from CaOx SFs and normal papillary tissuesfrom control patients. (A) mRNA expression. The data are presented as the means6SEMs. Control values are the average values of the data forthe C group. #P,0.05 compared with the C groups. NOS2, nitric oxide synthase 2. (B) Immunohistochemical staining. Cells stained positivefor CD68, CD138, and neutrophil elastase (each arrow) are shown in each representative microphotograph. Magnification, 3400.
12 Journal of the American Society of Nephrology J Am Soc Nephrol 28: ccc–ccc, 2016
CLINICAL RESEARCH www.jasn.org
between molecules that are supported by at least one reference from
the literature, from a textbook, or from canonical information stored
in the Ingenuity Knowledge Base.
qPCRFor the qPCR, we used the amplified cDNA that was used for
microarray analysis. To assess the gene expression results obtained by
microarray analysis, validation experiments were performed using
TaqMan Gene Expression Assays (Life Technologies, Grand Island,
NY) for each completemRNAsequence. Theprimers used are listed in
Supplemental Table 6. qPCRs were performed using a TaqMan Fast
Universal PCR Master Mix (4352042; Applied Biosystems) with a
7500 Fast RT-PCR System (Applied Biosystems). Each gene’s expres-
sion was normalized to that of the internal control, glyceraldehyde-3-
phosphate dehydrogenase.
Immunohistochemical StainingImmunohistochemistry for LCN2, IL11, SLPI, PTGS1, GPX3, MMD,
SCGB1D2, SLC12A1,NALCN,CD68,CD138, andneutrophil elastase
was performed on 4-mm-thick sliced biopsy sections. The antibodies
listed in Supplemental Table 7 were used as primary antibodies. The
reactions were analyzed using a Histofine Simple Stain Kit for mouse,
rat, or rabbit IgG (Nichirei Biosciences Inc., Tokyo, Japan) according
to the manufacturer’s instructions.
Evaluation of ApoptosisTUNELassayswereperformedtodetect apoptoticcellsbyusingan in situ
cell death detection kit (Roche Applied Science, Indianapolis, IN).
Statistical AnalysesAll data have been expressed as mean6SD. The statistical analyses
were performed using two-way ANOVA for comparisons among
three or more groups, or the Mann–Whitney U test for comparisons
between two groups. Categorical data were compared using Fisher
exact test. All the statistical analyses were performed using Statistical
Analysis System, version 9.1 (SAS Institute Inc., Cary, NC). Values of
P,0.05 were considered statistically significant.
ACKNOWLEDGMENTS
We thankHiroshi Takase from theMedical Sciences Core Laboratory
at Nagoya City University Graduate School for the assistance with
TEM and EDX analyses, and Dr. Takeshi Sakakura from the De-
partment of Urology, Konan Kosei Hospital and Dr. Yutaka Iwase
from theDepartment ofUrology, ToyotaKoseiHospital for obtaining
approval from the ethical committees of their hospitals. This work
was supported in part by Grants-in-Aid for Scientific Research from
the Ministry of Education, Culture, Sports, Science and Technology,
Japan (Nos. 15H04976, 15K10627, and 25861443), the first research
grant of the Japanese Society on Urolithiasis Research, the eighth
Young Researcher Promotion Grant of the Japanese Urological
Association, a medical research grant of the Takeda Science Foun-
dation, and the Medical Research Encouragement Prize of the Japan
Medical Association.
DISCLOSURESNone.
REFERENCES
1. Neisius A, Preminger GM: Stones in 2012: epidemiology, preventionand redefining therapeutic standards. Nat Rev Urol 10: 75–77, 2013
2. Turney BW, Reynard JM, Noble JG, Keoghane SR: Trends in urologicalstone disease. BJU Int 109: 1082–1087, 2012
3. Antonelli JA, Maalouf NM, Pearle MS, Lotan Y: Use of the NationalHealth and Nutrition Examination Survey to calculate the impact ofobesity and diabetes on cost and prevalence of urolithiasis in 2030. EurUrol 66: 724–729, 2014
Figure 9. Schema of hypothetical theory of RP formation, based on this study’s results. (A) Anatomy of renal parenchyma. Renal papillaincluding loop of Henle, interstitial space, and urothelial cells was focused on in the following schemas. (B) Normal status of renal papillarytissue between the loop of Henle and renal calyx. Aligned urothelial cells, interstitial cells, and tubular cells can be seen. (C) Accumulation ofimmune cells (macrophages and plasma cells), collagen fibers, and OPN; cellular apoptosis occurs due to inflammation and oxidative stressdue to activated molecules, such as LCN2, IL11, PTGS1, GPX3, and MMD. The disorder of SLC12A1 and NALCN causes apoptosis ofinterstitial cells. (D) Aggregation and precipitation of apatite crystals with collagen fibers and OPN result in the replacement from apoptoticinterstitial and urothelial cells to RP. (E) A CaOx stone eventually develops and is attached to the RP.
J Am Soc Nephrol 28: ccc–ccc, 2016 Gene Profiling of Randall’s Plaque 13
www.jasn.org CLINICAL RESEARCH

4. Kohjimoto Y, Sasaki Y, Iguchi M, Matsumura N, Inagaki T, Hara I: As-sociation of metabolic syndrome traits and severity of kidney stones:results from a nationwide survey on urolithiasis in Japan. Am J Kidney
Dis 61: 923–929, 20135. El-Zoghby ZM, Lieske JC, Foley RN, Bergstralh EJ, Li X, Melton LJ 3rd,
Krambeck AE, Rule AD: Urolithiasis and the risk of ESRD. Clin J Am Soc
Nephrol 7: 1409–1415, 20126. Jeong IG, Kang T, Bang JK, Park J, KimW, Hwang SS, Kim HK, Park HK:
Association between metabolic syndrome and the presence of kidneystones in a screened population. Am J Kidney Dis 58: 383–388, 2011
7. Coe FL, Evan AP, Worcester EM, Lingeman JE: Three pathways forhuman kidney stone formation. Urol Res 38: 147–160, 2010
8. Khan SR: Experimental calcium oxalate nephrolithiasis and the forma-tion of human urinary stones. Scanning Microsc 9: 89–100, discussion100–101, 1995
9. Randall A: The origin and growth of renal calculi. Ann Surg 105: 1009–1027, 1937
10. Gao B, Yasui T, Itoh Y, Li Z, Okada A, Tozawa K, Hayashi Y, Kohri K:Association of osteopontin gene haplotypes with nephrolithiasis. Kid-ney Int 72: 592–598, 2007
11. Kohri K, Yasui T, Okada A, Hirose M, Hamamoto S, Fujii Y, Niimi K,Taguchi K: Biomolecular mechanism of urinary stone formation in-volving osteopontin. Urol Res 40: 623–637, 2012
12. Okada A, Yasui T, Hamamoto S, Hirose M, Kubota Y, Itoh Y, Tozawa K,Hayashi Y, Kohri K: Genome-wide analysis of genes related to kidneystone formation and elimination in the calcium oxalate nephrolithiasismodel mouse: detection of stone-preventive factors and involvementof macrophage activity. J Bone Miner Res 24: 908–924, 2009
13. Taguchi K,OkadaA, KitamuraH, Yasui T,Naiki T, Hamamoto S, AndoR,Mizuno K, Kawai N, Tozawa K, Asano K, Tanaka M, Miyoshi I, Kohri K:Colony-stimulating factor-1 signaling suppresses renal crystal forma-tion. J Am Soc Nephrol 25: 1680–1697, 2014
14. Evan AP, Lingeman JE, Coe FL, Parks JH, Bledsoe SB, Shao Y, SommerAJ, Paterson RF, Kuo RL, Grynpas M: Randall’s plaque of patients withnephrolithiasis begins in basementmembranes of thin loops of Henle. JClin Invest 111: 607–616, 2003
15. Khan SR, Canales BK: Ultrastructural investigation of crystal deposits inNpt2a knockout mice: are they similar to human Randall’s plaques? J
Urol 186: 1107–1113, 201116. Khan SR, Canales BK: Unified theory on the pathogenesis of Randall’s
plaques and plugs. Urolithiasis 43[Suppl 1]: 109–123, 201517. Ruggera L, Gambaro G, Beltrami P, Martignoni G, Zattoni F: Percutaneous
and transureteralbiopsiesof renalpapillae: safeandappropriateproceduresfor in vivo histologic analysis in stone formers. J Endourol 25: 25–30, 2011
18. Williams JC Jr, McAteer JA: Retention and growth of urinary stones:insights from imaging. J Nephrol 26: 25–31, 2013
19. Reid DG, Jackson GJ, Duer MJ, Rodgers AL: Apatite in kidney stones is amolecular composite with glycosaminoglycans and proteins: evidencefromnuclearmagnetic resonance spectroscopy, and relevance toRandall’splaque, pathogenesis and prophylaxis. J Urol 185: 725–730, 2011
20. Chi T, KimMS, Lang S, Bose N, Kahn A, Flechner L, Blaschko SD, Zee T,Muteliefu G, Bond N, Kolipinski M, Fakra SC, Mandel N, Miller J,Ramanathan A, Killilea DW, Brückner K, Kapahi P, Stoller ML: A Dro-sophila model identifies a critical role for zinc in mineralization forkidney stone disease. PLoS One 10: e0124150, 2015
21. KhanSR, RodriguezDE,Gower LB,MongaM:AssociationofRandall plaquewith collagen fibers and membrane vesicles. J Urol 187: 1094–1100, 2012
22. Kuo RL, Lingeman JE, Evan AP, Paterson RF, Parks JH, Bledsoe SB,Munch LC, Coe FL: Urine calcium and volume predict coverage of renalpapilla by Randall’s plaque. Kidney Int 64: 2150–2154, 2003
23. Wang X, Krambeck AE, Williams JC Jr, Tang X, Rule AD, Zhao F,Bergstralh E, Haskic Z, Edeh S, Holmes DR 3rd, Herrera Hernandez LP,Lieske JC: Distinguishing characteristics of idiopathic calcium oxalatekidney stone formers with low amounts of Randall’s plaque. Clin J Am
Soc Nephrol 9: 1757–1763, 2014
24. Letavernier E, Vandermeersch S, Traxer O, Tligui M, Baud L, Ronco P,Haymann JP, DaudonM:Demographics and characterization of 10,282Randall plaque-related kidney stones: a new epidemic? Medicine
(Baltimore) 94: e566, 201525. Linnes MP, Krambeck AE, Cornell L, Williams JC Jr, Korinek M,
Bergstralh EJ, Li X, Rule AD, McCollough CM, Vrtiska TJ, Lieske JC:Phenotypic characterization of kidney stone formers by endoscopicand histological quantification of intrarenal calcification. Kidney Int 84:818–825, 2013
26. Krambeck AE, Lieske JC, Li X, Bergstralh EJ, Rule AD, Holmes D 3rd,McCollough CM, Vrtiska TJ: Current computed tomography tech-niques can detect duct of Bellini plugging but not Randall’s plaques.Urology 82: 301–306, 2013
27. Yasui T, Iguchi M, Suzuki S, Kohri K: Prevalence and epidemiologicalcharacteristics of urolithiasis in Japan: national trends between 1965and 2005. Urology 71: 209–213, 2008
28. Evan A, Lingeman J, Coe FL, Worcester E: Randall’s plaque: patho-genesis and role in calcium oxalate nephrolithiasis. Kidney Int 69:1313–1318, 2006
29. Stoller ML, Meng MV, Abrahams HM, Kane JP: The primary stoneevent: a new hypothesis involving a vascular etiology. J Urol 171: 1920–1924, 2004
30. Taylor ER, Stoller ML: Vascular theory of the formation of Randall pla-ques. Urolithiasis 43[Suppl 1]: 41–45, 2015
31. Khan SR, Pearle MS, Robertson WG, Gambaro G, Canales BK, Doizi S,Traxer O, Tiselius HG: Kidney stones. Nat Rev Dis Primers 2: 16008,2016
32. Khan SR: Reactive oxygen species as the molecular modulators ofcalcium oxalate kidney stone formation: evidence from clinical andexperimental investigations. J Urol 189: 803–811, 2013
33. Farooq SM, Boppana NB, Devarajan A, Sekaran SD, Shankar EM, LiC, Gopal K, Bakar SA, Karthik HS, Ebrahim AS: C-phycocyaninconfers protection against oxalate-mediated oxidative stress andmitochondrial dysfunctions in MDCK cells. PLoS One 9: e93056,2014
34. Mårtensson J, Bellomo R: The rise and fall of NGAL in acute kidneyinjury. Blood Purif 37: 304–310, 2014
35. Eller K, Schroll A, Banas M, Kirsch AH, Huber JM, Nairz M, Skvortsov S,Weiss G, Rosenkranz AR, Theurl I: Lipocalin-2 expressed in innate im-mune cells is an endogenous inhibitor of inflammation in murinenephrotoxic serum nephritis. PLoS One 8: e67693, 2013
36. Nishina T, Komazawa-Sakon S, Yanaka S, Piao X, Zheng DM, Piao JH,Kojima Y, Yamashina S, Sano E, Putoczki T, Doi T, Ueno T, Ezaki J,Ushio H, Ernst M, Tsumoto K, Okumura K, Nakano H: Interleukin-11links oxidative stress and compensatory proliferation. Sci Signal 5: ra5,2012
37. Reese PP, Hall IE,Weng FL, Schröppel B, DoshiMD, Hasz RD, Thiessen-Philbrook H, Ficek J, Rao V, Murray P, Lin H, Parikh CR: Associationsbetween Deceased-Donor Urine Injury Biomarkers and Kidney Trans-plant Outcomes. J Am Soc Nephrol 27: 1534–1543, 2015
38. Mar D, Gharib SA, Zager RA, Johnson A, Denisenko O, Bomsztyk K:Heterogeneity of epigenetic changes at ischemia/reperfusion- andendotoxin-induced acute kidney injury genes. Kidney Int 88: 734–744,2015
39. Kim JY, KimM, Ham A, Brown KM, Greene RW, D’Agati VD, Lee HT: IL-11 is required for A1 adenosine receptor-mediated protection againstischemic AKI. J Am Soc Nephrol 24: 1558–1570, 2013
40. Liu B, Li Z, Zhang Y, Luo W, Zhang J, Li H, Zhou Y: Vasomotor Reactionto Cyclooxygenase-1-Mediated Prostacyclin Synthesis in Carotid Ar-teries from Two-Kidney-One-Clip Hypertensive Mice. PLoS One 10:e0136738, 2015
41. Olson GE,Whitin JC, Hill KE,Winfrey VP, Motley AK, Austin LM, Deal J,Cohen HJ, Burk RF: Extracellular glutathione peroxidase (Gpx3) bindsspecifically to basementmembranes ofmouse renal cortex tubule cells.Am J Physiol Renal Physiol 298: F1244–F1253, 2010
14 Journal of the American Society of Nephrology J Am Soc Nephrol 28: ccc–ccc, 2016
CLINICAL RESEARCH www.jasn.org
42. Dai C, SaleemMA, Holzman LB,Mathieson P, Liu Y: Hepatocyte growthfactor signaling ameliorates podocyte injury and proteinuria.Kidney Int77: 962–973, 2010
43. Liu Q, Zheng J, Yin DD, Xiang J, He F, Wang YC, Liang L, Qin HY, Liu L,Liang YM, Han H: Monocyte to macrophage differentiation-associated(MMD) positively regulates ERK and Akt activation and TNF-a and NOproduction in macrophages. Mol Biol Rep 39: 5643–5650, 2012
44. Vezzoli G, Terranegra A, Arcidiacono T, Soldati L: Genetics and calciumnephrolithiasis. Kidney Int 80: 587–593, 2011
45. Yasui T, Okada A, Urabe Y, Usami M, Mizuno K, Kubota Y, Tozawa K,Sasaki S, Higashi Y, Sato Y, KuboM, Nakamura Y, Matsuda K, Kohri K: Areplication study for three nephrolithiasis loci at 5q35.3, 7p14.3 and13q14.1 in the Japanese population. J Hum Genet 58: 588–593, 2013
46. Sinke AP, Deen PM: The physiological implication of novel proteins insystemic osmoregulation. FASEB J 25: 3279–3289, 2011
47. Viers BR, Lieske JC, Vrtiska TJ, Herrera Hernandez LP, Vaughan LE,Mehta RA, Bergstralh EJ, Rule AD, Holmes DR 3rd, Krambeck AE: En-doscopic and histologic findings in a cohort of uric acid and calciumoxalate stone formers. Urology 85: 771–776, 2015
48. Pizzolato P: Histochemical recognition of calcium oxalate. J HistochemCytochem 12: 333–336, 1964
49. Bills CE, Eisenberg H, Pallante SL: Complexes of organic acidswith calcium phosphate: the von Kossa stain as a clue to the com-position of bone mineral. Johns Hopkins Med J 128: 194–207,1971
50. Hanaichi T, Sato T, Iwamoto T, Malavasi-Yamashiro J, Hoshino M,Mizuno N: A stable lead by modification of Sato’s method. J ElectronMicrosc (Tokyo) 35: 304–306, 1986
51. Hirose M, Tozawa K, Okada A, Hamamoto S, Higashibata Y, Gao B,Hayashi Y, Shimizu H, Kubota Y, Yasui T, Kohri K: Role of osteopontin inearly phase of renal crystal formation: immunohistochemical and mi-crostructural comparisons with osteopontin knock-out mice. Urol Res40: 121–129, 2012
This article contains supplemental material online at http://jasn.asnjournals.org/lookup/suppl/doi:10.1681/ASN.2015111271/-/DCSupplemental.
J Am Soc Nephrol 28: ccc–ccc, 2016 Gene Profiling of Randall’s Plaque 15
www.jasn.org CLINICAL RESEARCH