Functional Genomic Screen Identifies Klebsiella pneumoniae ...
ARTICLE
Genome-wide Association Studyof Platelet Count Identifies Ancestry-SpecificLoci in Hispanic/Latino Americans
Ursula M. Schick,1,2,3,16 Deepti Jain,4,16 Chani J. Hodonsky,5,16 Jean V. Morrison,4 James P. Davis,6
Lisa Brown,4 Tamar Sofer,4 Matthew P. Conomos,4 Claudia Schurmann,2,3 Caitlin P. McHugh,4
Sarah C. Nelson,4 Swarooparani Vadlamudi,6 Adrienne Stilp,4 Anna Plantinga,4 Leslie Baier,7
Stephanie A. Bien,1 Stephanie M. Gogarten,4 Cecelia A. Laurie,4 Kent D. Taylor,8,9 Yongmei Liu,10
Paul L. Auer,11 Nora Franceschini,5 Adam Szpiro,4 Ken Rice,4 Kathleen F. Kerr,4 Jerome I. Rotter,8
Robert L. Hanson,7 George Papanicolaou,12 Stephen S. Rich,13,14 Ruth J.F. Loos,2,3,15
Brian L. Browning,4 Sharon R. Browning,4 Bruce S. Weir,4 Cathy C. Laurie,4 Karen L. Mohlke,6
Kari E. North,5,16 Timothy A. Thornton,4,16 and Alex P. Reiner1,16,*
Platelets play an essential role in hemostasis and thrombosis. We performed a genome-wide association study of platelet count in 12,491
participants of the Hispanic Community Health Study/Study of Latinos by using a mixed-model method that accounts for admixture
and family relationships. We discovered and replicated associations with five genes (ACTN1, ETV7, GABBR1-MOG, MEF2C, and
ZBTB9-BAK1). Our strongest association was with Amerindian-specific variant rs117672662 (p value ¼ 1.16 3 10�28) in ACTN1,
a gene implicated in congenital macrothrombocytopenia. rs117672662 exhibited allelic differences in transcriptional activity and pro-
tein binding in hematopoietic cells. Our results underscore the value of diverse populations to extend insights into the allelic architec-
ture of complex traits.
Introduction
Platelets are small, anucleate cells derived frommegakaryo-
cyte cytoplasm in the bone marrow. Platelet production re-
sults from a series of tightly regulated processes that
require lineage commitment of hematopoietic stem cells
and leads to the proliferation, terminal differentiation,
and maturation of megakaryocytic progenitors. Studying
the genetic underpinnings of platelet count (PLT) can pro-
vide important insight into molecular mechanisms and
pathways involved in both normal and abnormal me-
gakaryopoiesis, which could ultimately have clinical impli-
cations for the treatment of bleeding or thrombosis in
individuals with a low (thrombocytopenia) or high
(thrombocytosis) PLT1–3 or for the relationship between
PLT and cardiovascular or autoimmune disorders.4,5
Circulating PLT in humans normally ranges between
150,000/ml and 400,000/ml. PLT differs by ethnicity, and
these ethnic differences do not appear to be explained by
environmental factors.6,7 Family-based studies have esti-
1Division of Public Health Sciences, Fred Hutchinson Cancer Research Cent
Medicine, Icahn School of Medicine at Mount Sinai, New York, NY 10029, USA
of Medicine at Mount Sinai, New York, NY 10029, USA; 4Department of Biosta
Epidemiology, University of North Carolina, Chapel Hill, NC 27514, USA; 6De
USA; 7Phoenix Epidemiology and Clinical Research Branch, National Institut
Phoenix, AZ 85004, USA; 8Institute for Translational Genomics and Population
Center, Torrance, CA 90502, USA; 9Department of Pediatrics, Los Angeles Biom
USA; 10School of Medicine, Wake Forest University, Winston-Salem, NC 2715
Milwaukee, Milwaukee, WI 53201, USA; 12Division of Cardiovascular Scienc
USA; 13Center for Public Health Genomics, University of Virginia, Charlo
Medicine, University of Virginia, Charlottesville, VA 22908, USA; 15Mindich C
Sinai, New York, NY 10029, USA16These authors contributed equally to this work
*Correspondence: [email protected]
http://dx.doi.org/10.1016/j.ajhg.2015.12.003. �2016 by The American Societ
The Americ
mated that a large component of the variability of PLT is
explained by genetic factors (h2 > 0.50).8–10 To date,
approximately 60 PLT-associated genetic variants have
been identified through genome-wide association studies
(GWASs) in populations of European, Asian, and African
descent.2,5,11–14
Hispanic and/or Latino (Hispanic/Latino) individuals
are a highly heterogeneous population with recent admix-
ture among indigenous Amerindian (primarily of South
and Central America, Mexico, and the Caribbean islands,
hereafter referred to as ‘‘Amerindian’’), European, and
West African ancestral populations. Genetic factors
contributing to PLT among Hispanic/Latino populations
have not previously been characterized. Notably, certain
Mendelian platelet disorders are more common among
Hispanic/Latino individuals,15 suggesting the possibility
of population-specific genetic contributions to platelet-
related phenotypes. To further characterize the role of
genetic factors contributing to PLT in Hispanic/Latino
populations, we performed a GWAS in 12,491 participants
er, Seattle, WA 98195, USA; 2Charles Bronfman Institute for Personalized
; 3Genetics of Obesity and Related Metabolic Traits Program, Icahn School
tistics, University of Washington, Seattle, WA 98195, USA; 5Department of
partment of Genetics, University of North Carolina, Chapel Hill, NC 27599,
e of Diabetes and Digestive and Kidney Disease, NIH, 445 North 5th Street,
Sciences, Los Angeles Biomedical Research Institute, Harbor-UCLAMedical
edical Research Institute, Harbor-UCLAMedical Center, Torrance, CA 90502,
7, USA; 11Joseph J. Zilber School of Public Health, University of Wisconsin
es, National Heart, Lung, and Blood Institute, NIH, Bethesda, MD 20892,
ttesville, VA 22908, USA; 14Division of Endocrinology, Department of
hild Health and Development Institute, Icahn School of Medicine at Mount
y of Human Genetics. All rights reserved.
an Journal of Human Genetics 98, 229–242, February 4, 2016 229
in the Hispanic Community Health Study/Study of Latinos
(HCHS/SOL). We sought to identify genetic loci associated
with PLT and assess generalization of known loci from
other populations to this diverse sample of Hispanic/
Latino individuals.
Material and Methods
HCHS/SOL PopulationThe HCHS/SOL is a community-based cohort study of 16,415 self-
identified Hispanic/Latino persons aged 18–74 years and selected
from households in predefined census-block groups across four
US field centers (in Chicago, Miami, the Bronx, and San Diego).
The census-block groups were chosen to provide diversity among
cohort participants with regard to socioeconomic status and
national origin or background. The HCHS/SOL cohort includes
participants who self-identified as having a Hispanic/Latino
background; the largest groups are Central American (n ¼1,730), Cuban (n ¼ 2,348), Dominican (n ¼ 1,460), Mexican
(n ¼ 6,471), Puerto Rican (n ¼ 2,728), and South American
(n ¼ 1,068). The sample design and cohort selection have been
previously described.16 The HCHS/SOL baseline clinical exam-
ination17 occurred between 2008 and 2011 and included compre-
hensive biological, behavioral, and sociodemographic assess-
ments. This study was approved by the institutional review
boards at each field center, where all subjects gave written
informed consent.
Measurement of PLT and Exclusion Criteria in
HCHS/SOLPLT was measured in EDTA whole blood with a Sysmex XE-2100
instrument, (Sysmex America) at the University of Minnesota
according to national and international standards and procedures.
Individuals pregnant at the time of blood draw; those with >5%
circulating blasts or immature cells, end-stage renal disease, or
any hematologic malignancy; and those undergoing chemo-
therapy for solid tumors were excluded from our analyses.
Genotyping and Quality Control in HCHS/SOLConsenting HCHS/SOL subjects were genotyped at Illumina on
the HCHS/SOL custom 15041502 B3 array. The custom array
comprised the Illumina Omni 2.5M array (HumanOmni2.5-
8v.1-1) ancestry-informative markers, known GWAS hits and
drug absorption, distribution, metabolism, and excretion
(ADME) markers, and additional custom content including
~150,000 SNPs selected from the CLM (Colombian in Medellin,
Colombia), MXL (Mexican Ancestry in Los Angeles, California),
and PUR (Puerto Rican in Puerto Rico) samples in the 1000
Genomes phase 1 data to capture a greater amount of Amerindian
genetic variation.18
We applied standardized quality-assurance and quality-control
(QA/QC) methods19 to generate recommended SNP- and sample-
level quality filters. In brief, samples were checked for annotated
or genetic sex, gross chromosomal anomalies,20 relatedness21
and population structure,22 missing call rates, batch effects, and
duplicate-sample discordance. At the SNP level, checks were per-
formed for Hardy-Weinberg equilibrium, minor allele frequency
(MAF), duplicate-probe discordance, Mendelian errors, and
missing call rate. These QA/QC procedures yielded a total of
12,803 unique study participants for imputation and downstream
230 The American Journal of Human Genetics 98, 229–242, February
association analyses. Of these, 12,491 met specific inclusion
criteria related to the study of PLT. A total of 2,232,944 SNPs passed
filters for both quality and informativeness (polymorphic and un-
duplicated) and became candidates for imputation and association
testing.
Imputation in HCHS/SOLGenome-wide imputation was carried out with the full, cosmopol-
itan 1000 Genomes Project phase 1 reference panel (n ¼ 1,092).23
The HCHS/SOL samples were imputed together with genotyped
SNPs passing the quality filter and representing unique genomic
positions on the autosomes and non-pseudoautosomal portion
of the X chromosome. Genotypes were first pre-phased with
SHAPEIT2 (v.2.r644) and then imputed with IMPUTE2
(v.2.3.0).24,25 Only variants with at least two copies of the minor
allele present in any of the four 1000 Genomes continental panels
were imputed. In addition to calculating the quality metrics
output by IMPUTE2, we also calculated ‘‘oevar’’ (the ratio of the
observed variance of imputed dosages to the expected binomial
variance) by using the MaCH imputation software.26 We assessed
overall imputation quality both by looking at the distribution of
imputed quality metrics across the MAF spectrum and by exam-
ining results from the IMPUTE2 internal masking experiments.
We performed downstream association analyses only on observed
variants passing quality filters and all imputed variants (a total of
27,887,661 variants), but we filtered the results on the basis of
imputation quality (oevar > 0.3) and MAF > 1%.
Linear Mixed-Effect Model for Association Testing in
HCHS/SOLWe analyzed PLT by using linear mixed-effect models (LMMs) to
account for the correlations due to genetic relatedness (kinship),
shared household, and block group between individuals. The
LMMused three independent random effects to model these three
sources of dispersion:
yi ¼ xTi aþ gijbj þ bik þ bih þ bib þ εi;
where yi is the square-root-transformed platelet value for individ-
ual i, xi is a vector of covariate values, a is the corresponding regres-
sion parameters, gij is the jth SNP count, where bj is its estimated
effect, and bik, bih, and bib are the random effects corresponding
to kinship, household, and block group, respectively (indepen-
dent of each other and the error term εi), of person i. Within the
LMM framework, bih (bib) is the same among individuals who
live in the same household (block group); for two individuals
i and l, the correlation between bik and blk is given by their
estimated kinship coefficient.27 The covariates included sex, age,
principle components (PCs), recruitment center, smoking, log of
sampling weight, and genetic-analysis group (a six-level catego-
rical variable derived from self-identified background). With
square-root-transformed PLT, the null-model residuals, given by
ei ¼ yi � xiTa � gijbj, were approximately normally distributed
and thus compatible with modeling assumptions. We evaluated
the goodness of fit of the LMM by using quantile-quantile plots
comparing residuals and estimated random effects to a normal dis-
tribution and scatter plots describing the relationship between
model residuals and covariates.
Ancestry and Relatedness Adjustment in HCHS/SOLWe adjusted analyses for five PCs to prevent spurious association
due to population stratification. Analyses accounted for familial
4, 2016

relatedness (kinship) by using a random effect with correlation
structure specified by pairwise kinship coefficients for preventing
inflation of test statistics. The PCs and kinship coefficients were
estimated simultaneously with an iterative procedure, alternating
between PC-AiR22 (which provides PCs robust to familial related-
ness) and PC-Relate21 (which estimates kinship coefficients robust
to population structure, admixture, and non-random mating).
PC-AiR uses relatedness estimates to identify a mutually unrelated
subset of individuals representative of the ancestral diversity of the
entire sample, performs PCA on this unrelated subset, and predicts
PC values for the remaining individuals. PC-Relate uses PCs to
account for genetic similarity due to shared ancestry and provide
accurate estimates of kinship coefficients due to familial related-
ness. We performed three iterations, each of which used
~150,000 linkage-disequilibrium (LD)-pruned SNPs.28
SNP-Based Heritability Estimation in HCHS/SOLGenetic (kinship) and shared environmental (household) effects
were estimated from a variance-component analysis that used all
genotyped SNPs with MAF > 1% (~1.7 million) and a subset of
10,093 individuals estimated to be more distant than fourth-de-
gree relatives (i.e., for whom all pairwise kinship coefficient
estimates from PC-Relate were less than 2�11/2z 0.022). Including
close relatives in the analysis can lead to inflated heritability
estimates as a result of their increased phenotypic correlations
due to other factors such as shared environmental effects.29 How-
ever, the availability of current household membership data
in HCHS/SOL made it possible that the variance-component
model could at least partially account for shared environmental
effects; therefore, the analysis was repeated with all 12,491 study
individuals.
Estimation of SNP Alleles and Allelic Frequencies
among Ancestral PopulationsWe compared allele frequencies of PLT-associated index SNPs
across ancestral Hispanic/Latino populations by using data from
phase 3 of 1000 Genomes.23 We used the R31 exactci package to
calculate exact p values and matching 95% confidence intervals
(CIs) for each sub-population from the binomial distribution.30
We also examined whether the derived alleles at our PLT-associ-
ated index SNPs were present in other ancestral human or Amerin-
dian populations by using published whole-genome sequence
data from Neandertal and Denisovan archaic human sam-
ples32,33 and Papua New Guinea samples.34
Replication of Discovery Loci in Independent
Hispanic/Latino SamplesTo replicate association findings in Hispanic/Latino samples, we
used 1000 Genomes imputed GWAS data available in three addi-
tional Hispanics/Latinos samples, including 3,454 from the
Women’s Health Initiative (WHI) SNP Health Association
Resource (SHARe) project,35 782 from the Multi-Ethnic Study of
Atherosclerosis (MESA) cohort,36,37 and 2,854 from Mount Sinai
BioMe Biobank.38 WHI-SHARe and MESA participants were geno-
typed with the Affymetrix 6.0 chip, and imputation was per-
formed with MaCH.26 BioMe participants were genotyped with
the Illumina HumanOmniExpressExome-8 v.1.0 chip, and impu-
tation was performed with IMPUTE224,25 in 1000 Genomes phase
1 data (March 2012 v.3). Association testing for typed or imputed
SNPs was performed by linear regression of square-root-trans-
formed PLT adjusted for age, sex, and PCs.
The Americ
Meta-analysis and Replication Significance CriteriaMeta-analysis of results from the three replication cohorts for PLT
and mean platelet volume (MPV) was performed with the inverse-
variance-weighted method implemented in METAL.39 To declare
significance for replicated PLT loci, we used Bonferroni correction
for the six variants carried forward for a significance threshold of
p value < 0.0083.
Admixture Mapping in HCHS/SOLWe implemented a conditional-random-field-based approach,
RFMix,40 to infer local ancestry at a set of 236,456 SNPs in com-
mon between the HCHS/SOL and reference-panel datasets. We
used selected populations from HGDP,41 HapMap 3,42 and 1000
Genomes23 phase 1 to use as a reference panel for detecting Euro-
pean, West African, and Amerindian ancestry. RFMix requires
phased data with no missing genotype values. BEAGLE (v.4) was
employed for phasing and imputation of sporadic missing geno-
types in the HCHS/SOL and reference-panel datasets.43 Admixture
mapping is a powerful gene-mapping approach that relies on
allele-frequency differences across ancestral populations and the
existence of an association between the causal variant and pheno-
type to identify an association. Using the local-ancestry estimates,
we performed a genome-wide admixture-mapping scan by using a
LMM43 with a joint test for all three ancestries (European, African,
and Amerindian). As a secondary analysis, we performed admix-
ture mapping to test Amerindian against any other ancestry
because a priori we were interested in Amerindian ancestry within
HCHS/SOL because it has not beenwell studied in previous admix-
ture-mapping studies. Covariate and ancestry adjustment used in
the analyses is described above. The recent history of admixture
gives rise to long-range correlation in local-ancestry values across
the genome, and thus the critical value for the genome-wide sig-
nificance level of admixture mapping is substantially lower than
that for the genotype test. On the basis of previous simulation
results, a nominal p value of 5.7 3 10�5 yielded a genome-wide
type I error of 0.05.
Generalization in HCHS/SOLWe performed generalization analysis for PLT-associated SNPs pre-
viously reported in GWASs of other populations, including those
of European, African, and Japanese ancestry.2,5,11–13 Because all
discovery studies, except for that of Kamatani et al.,11 used un-
transformed PLT as the outcome, we used association results
with untransformed PLT for generalization. For SNPs reported in
Kamatani et al.,11 we followed their methodology and used the
square root of PLT and reported effect sizes in SDs. We performed
generalization testing by directional false-discovery rate (FDR)
control for the generalization null hypotheses.44 The generaliza-
tion null hypothesis states that the effect does not exist in both
the discovery study and HCHS/SOL and is rejected if there is
enough evidence that a SNP affects the outcome, with the same di-
rection of effect, in both the discovery study and HCHS/SOL. We
used the number of SNPs tested in the discovery study and the
p values for the set of tested SNPs from both the discovery study
and HCHS/SOL, and we computed an r value for each of the
SNPs to quantify the evidence for generalization. A SNP was gener-
alized if the r value < 0.05.
Functional Annotation of Discovery LociWe interrogated the PLT-associated loci to determine whether
the identified non-coding SNPs and indels and correlated variants
an Journal of Human Genetics 98, 229–242, February 4, 2016 231
(r2 R 0.5, calculated in the HCHS/SOL discovery population) were
positioned within predicted regulatory regions, namely enhancers
and promoters. These regulatory regions were identified on the
basis of the enrichment of various histone-modification and
ChIP-seq (chromatin immunoprecipitation followed by
sequencing) signals in megakaryocytes.45 A genomic element en-
riched with the histone H3K4me1 signal was categorized as an
enhancer, whereas a genomic element enriched with the histone
H3K4me3 signal was categorized as a promoter. SNPs or indels
that belonged to either promoter or enhancer categories and over-
lapped a DNase I hypersensitive site (a general biochemical feature
of regulatory regions) in megakaryocytes were prioritized as puta-
tively functional variants. We also reported overlap with ChIP-seq
peaks of key megakaryocyte transcription factors and the nearest
biologically plausible gene or genes.46 Moreover, because related
cell types can share similar regulatory regions, we additionally re-
ported supplementary annotation by using data generated by
ENCODE47 on other myeloid lineage cells, including primary
erythroblasts, erythroleukemia K562 cells, peripheral-blood-
derived erythroblasts (PBDEs), myeloid leukemia (SKNO-1) cells,
and human umbilical vein endothelial cells (HUVECs). To provide
additional support, we also included overlap with transcription
start sites and enhancers identified by an alternate approach in
the Fantom5 project. 48 To identify the motifs disrupted by alleles,
includingACTN1 (MIM: 102575) variant rs117672662, we utilized
HaploReg (v.2)49 and the JASPAR motif database.50
We also included annotations from in silico prediction algo-
rithms including RegulomeDB, the Combined AnnotationDepen-
dent Depletion (CADD) score51 (a PHRED-like score indicating
deleteriousness of variants and all other substitutions in the
genome), GWAVA52 (a score that classifies non-coding variation
and uses ENCODE and Roadmap Epigenomic data to prioritize
most likely functional variants), and deltaSVM53 (a score that
captures how much a variant alters the regulatory potential of
the surrounding sequence, particularly in the context of a specific
cell type).
eQTL Analysis of American IndiansThe eQTL analysis included 1,457 American Indian adults (mini-
mum of 18 years of age) from the urban Phoenix extension of
the Family Investigation of Nephropathy and Diabetes; they
were examined after they had fasted for R8 hr.54 Blood was
collected into PAXgene Blood RNA Tubes (Becton Dickinson),
and total RNA was isolated with PAXgene Blood miRNA Kits
(QIAGEN). Amplification was performed with the Ambion Messa-
geAmp II-Biotin Enhanced aRNA Amplification Kit (Life Technol-
ogies), and transcript levels were measured with the Illumina
HumanHT-12 v.4 Expression Beadchip according to the manufac-
turer’s protocol. GenomeStudio software was used for background
normalization. Genotyping of rs117672662 was conducted ac-
cording to the Assays-on-Demand method (Life Technologies).
A normalizing transformation of transcription levels was em-
ployed in statistical analyses, and association of genotype was
analyzed under an additive model with control for age, sex, tribal
membership, and European admixture (estimated from 45
markers with large allele-frequency differences between Amerin-
dians and Europeans55).
Cell CultureTHP-1 (ATCC TIB-202) acute monocytic leukemia cells were
cultured in RPMI-1640 (Mediatech) supplemented with 10% fetal
232 The American Journal of Human Genetics 98, 229–242, February
bovine serum (FBS), and Kasumi-1 (ATCC CRL-2724) acute myelo-
blastic leukemia cells were cultured in RPMI-1640 supplemented
with 20% FBS. The cell cultures were maintained at 37�C with
5% CO2.
Transcriptional Reporter AssaysA 186 bp region (chr14: 69,425,369–69,425,554 according to
UCSC Genome Browser hg19) surrounding rs117672662
was amplified with primer pairs 50-GGTACCGCAGGAAAACATC
CACATGA-30 and 50-CTCGAGGGAAACAGTGTGGTCAGTCG-30
(forward) and 50-CTCGAGGCAGGAAAACATCCACATGA-30 and
50- GGTACCGGAAACAGTGTGGTCAGTCG-30 (reverse) and clo-
ned into the luciferase reporter vector pGL4.23 (Promega) in
both orientations with respect to the minimal promoter. The
rs117672662 C allele was created with the QuikChange Site-
Directed Mutagenesis Kit (Stratagene). Sanger sequencing was
used to verify clones for fidelity and genotype. Four verified con-
structs for each allele in both orientations were transfected in
duplicate into THP-1 and Kasumi-1 cells with Renilla control re-
porter vector (phRL-TK, Promega) with Lipofectamine 3000 (Life
Technologies) and incubated for 48 hr. The cells were lysed with
Passive Lysis Buffer (Promega), and luciferase activity was
measured with the Dual-Luciferase Reporter Assay System (Prom-
ega) as previously described.56
Electrophoretic Mobility Shift AssayElectrophoretic mobility shift assay (EMSA) oligonucleotide
probes were designed around the variant rs117672662
(50-AGAATTAT[T/C]AGCAGAGG-30) and end labeled with
50 IRDye 700 (Integrated DNA Technologies). Nuclear protein
was extracted with the NE-PER Extraction Kit (ThermoFisher Sci-
entific), and the total nuclear extract was measured with the
BCA Protein Assay (ThermoFisher Scientific). All protein-probe
binding reactions were incubated for 30 min at room tempera-
ture and consisted of the following: 13 binding buffer
(10 mM Tris, 50 mM KCl, and 1 mM DTT [pH 7.5]), 1 mg
poly(dI-dC), 7 mg nuclear extract, and 200 fmol IRDye-labeled
double-stranded oligonucleotide probe in a volume of 20 ml.
The competition reactions contained 70-fold excess of unla-
beled probe and were incubated with the nuclear extract for
15 min prior to the addition of the IRDye-labeled probe and in-
cubation for another 30 min. In a test for an antibody super-
shift, 6 mg of antibody (HOXA5 sc-13199x or GATA1 sc-1234x,
Santa Cruz Biotechnologies) was incubated with the nuclear
extract for 35 min prior to incubation with the IRDye-labeled
probe for 30 min. The probe-protein complexes were resolved
with 6% DNA retardation electrophoresis gels (Life Technolo-
gies) and visualized with an Odyssey CLx Infrared Imaging
System (LI-COR Biosciences).
Results
The characteristics of the 12,491 Hispanic/Latino partic-
ipants from the HCHS/SOL discovery sample are summa-
rized in Table S1. SNP-based heritability was estimated
from a variance-component analysis performed with a
subset of 10,093 individuals excluding close familial rel-
atives. Genetic (kinship) effects accounted for 29.4%
(95% CI: 22.6%–36.1%) of the variation in PLT, whereas
shared environmental (household) effects contributed
4, 2016

Figure 1. Manhattan Plot of Discovery Results from HCHS/SOLThe solid line indicates genome-wide significance (p value< 53 10�8), and a dashed line indicates suggestive significance (p value< 1310�7). There is an inset quantile-quantile plot of discovery p values. Discovery loci are highlighted in blue, and loci with p values lessthan the suggestive significance threshold are annotated with the names of the nearest gene(s).
little (2.6%; 95% CI: 0.0%–6.3%). When the analysis was
repeated with all individuals and adjustment for house-
hold-membership data, genetic (kinship) effects ac-
counted for 30.8% (95% CI: 25.7%–35.7%), and shared
environmental (household) effects accounted for 5.0%
(95% CI: 2.1%–7.7%) of PLT variation. Thus, the esti-
mated genetic contribution increased only slightly
(from 29.4% to 30.8%) when close relatives were
included, and the estimated household contribution
was non-zero, suggesting that household membership
is a good proxy for the shared environmental effects
contributing to PLT in this sample. These heritability
estimates are less than what has been reported
from family-based studies of PLT (approximately 50%–
80%8–10), which is consistent with previous findings
comparing family- and SNP-based heritability estima-
tion.57
In the HCHS/SOL discovery sample, the genomic in-
flation factor was 1.046, indicating adequate control of
population stratification. Nine locimet the standard signif-
icance criteria of p value < 5 3 10�8; three additional loci
had p values between 5 3 10�8 and 1 3 10�7 (Table S2).
Quantile-quantile and Manhattan plots are shown in
Figure 1. For each of the discovery and previously reported
PLT loci, we evaluated the extent of LD (calculated HCHS/
SOL discovery population) between the index SNP and
other nominally significant SNPs in the region (Figures
S1A–S1L).
Generalization of PLT Index SNPs from Other
Populations to Hispanic/Latino Populations
Of the 12 genome-wide significant or suggestive loci in the
HCHS/SOL discovery sample, seven correspond to index
SNPs (or LD proxies with r2 R 0.5 calculated in the
HCHS/SOL population) previously identified in PLT
The Americ
GWASs of other ancestries (ARHGEF3 [MIM: 612115]
rs1354034, TPM4 [MIM: 600317] rs73517714, AK3 [MIM:
609290]-RCL1 [MIM: 611405] rs409801, JMJD1C [MIM:
604503] rs10822155, ZFPM2 [MIM: 603693] rs6993770,
HBS1L [MIM: 612450]-MYB [MIM: 189990] rs6934903,
and CD9 [MIM: 143030]-VWF [MIM: 613160]
rs11064074)2,5,12–14 (Table S2). An eighth significant locus
is located in close proximity to BAK1 (MIM: 600516),
a gene previously associated with PLT in GWASs from pop-
ulations of European, African, and Asian descent.2,5,11,12,14
However, the index SNP (rs62405954) in our Hispanic/
Latino discovery sample at the BAK1 locus is distinct
from rs210134, the index SNP previously associated
with PLT in a GWAS (r2 ¼ 0.06; rs62405954 p value ¼1.10 3 10�10, versus 4.6 3 10�7 when adjusted for
rs210134; Figure S2).
In order to more comprehensively assess whether previ-
ous GWAS PLT SNPs from populations of European, Asian,
and African ancestry2,5,11–14 generalize to HCHS/SOL His-
panic/Latino populations, we evaluated all index SNPs
in the corresponding ancestral populations (Table S3) by
using a directional FDR method58 that rejects the null
hypothesis of ‘‘no generalization’’ if there is enough evi-
dence that a SNP is associated with PLT and directionally
consistent between the original discovery GWAS and
HCHS/SOL. Of the ten SNPs identified previously in pop-
ulations of African ancestry,12,13 seven of the SNPs
showed evidence of generalization (r value < 0.05) in
our Hispanic/Latino sample. Roughly half (27 of 49) of
GWAS SNPs identified previously in populations of Euro-
pean ancestry2,5,12,14 generalized to HCHS/SOL. All four
SNPs identified previously in a population of Asian
ancestry11 generalized to our study. Considering the 55
independent SNPs previously associated with PLT in any
population, we found evidence of generalization of 30
an Journal of Human Genetics 98, 229–242, February 4, 2016 233

Table
1.
PLT-A
ssociate
dVariants
from
theHCHS/SOLDiscovery
Analysis
Neare
stGene
(Function)
Chro
moso
malPosition
(GRCh37/hg19)
rsID
Coded/Altern
ative
Allele
onPlusStrand
Discovery
Replication
CodedAllele
Fre
quency
nBeta
(SE)
pValue
nBeta
(SE)
pValue
ACTN1(intronic)
chr14:69,425,467
rs117672662
T/C
0.94
12,491
0.604(0.054)
1.163
10�28
7,121
0.685(0.080)
1.073
10�17
ZBTB9-BAK1(intergen
ic)
chr6:33,524,820
rs62405954
T/C
0.86
12,491
�0.239(0.037)
1.103
10�10
7,170
�0.268(0.066)
4.933
10�5
GABBR1-M
OG
(intergen
ic)
chr6:29,608,184
rs75140056
C/C
AT
0.39
12,491
�0.151(0.025)
1.473
10�9
7,163
�0.236(0.041)
9.823
10�9
BANP-ZFPM1(intergen
ic)
chr16:88,376,014
rs80294974
G/A
0.98
12,491
0.555(0.103)
6.603
10�8
7,060
�0.082(0.138)
0.551
ETV7(intronic)
chr6:36,344,980
rs9470264
G/A
0.80
12,491
�0.181(0.034)
8.803
10�8
6,998
�0.145(0.048)
0.00263
MEF2C
(intronic)
chr5:88,133,921
rs144261491
C/T
0.97
12,491
0.426(0.083)
3.353
10�7
3,982
0.624(0.156)
6.323
10�5
234 The American Journal of Human Genetics 98, 229–242, Febru
ary(55%) SNPs in the HCHS/SOL population. We hypothe-
sized that some of the SNPs did not generalize as a result
of low power. To study this hypothesis, we (1) looked for
directional consistency of the effect sizes across our study
and previous studies for SNPs that failed to generalize and
(2) generated a genetic score for each of the analysis par-
ticipants by summing all trait-increasing alleles in the
SNPs that did not generalize. Out of 25 SNPs that did
not generalize, 24 had the same direction of effect in
the discovery study and the HCHS/SOL (exact binomial
test p value ¼ 1.5 3 10�6). We found a strong association
between PLT and the genetic score that we constructed
with the non-generalized SNPs (p value ¼ 8.8 3 10�10).
Taken together, these tests provide evidence that, indeed,
the majority of non-generalized SNPs are associated
with PLT.
Discovery of Ancestry-Specific PLTAssociation Signals
in Hispanic/Latino Populations
Four of the 12 loci with significant or suggestive associa-
tions in the HCHS/SOL discovery sample (ACTN1
rs117672662, GABBR1 [MIM: 603540]-MOG [MIM:
159465] rs75140056, ETV7 [MIM: 605255] rs9470264,
and BANP [MIM: 611564]-ZFPM1 [MIM: 601950]
rs80294974) are located within or near genes or genomic
regions not previously associated with PLT in GWASs
(Table 1). By examining the 55 other genomic regions
previously associated with PLT in populations of
European, Asian, or African descent, in addition to
ZBTB9-BAK1 rs62405954 (described above), we identified
one additional signal, MEF2C (MIM: 600662)
rs144261491, distinct from the MEF2C European index
SNP rs700585 from a GWAS (r2 ¼ 0.009; rs144261491
p value ¼ 3.4 3 10�7, versus 9.0 3 10�7 with adjustment
for rs700585; Figure S3).
Several of the PLT index SNPs discovered in HCHS/SOL
had allele frequencies that differed considerably between
continental populations represented in 1000 Genomes
phase 3 samples23 (Table 2). In particular, ACTN1
rs117672662 and MEF2C rs14426149, associated with
decreased PLT, were present at MAFs of ~7% and ~4%,
respectively, in samples of Amerindian ancestry (Colum-
bians, Mexicans, Peruvians, and Puerto Ricans) but were
significantly less common in Asian, European, and African
populations.23 Analysis of published archaic genomes32,33
and genome sequences from New Guinea Papuans34
showed that none of the risk alleles at these six PLT loci
appear to be derived from Neandertal, Denisovan, or
Australo-Melanesian sequences.
Admixture mapping based on a joint test of all three
local-ancestry estimates in HCHS/SOL confirmed the
presence of genome-wide-significant peaks (p value <
5.7 3 10�5) at the BAK1 locus on chromosome 6 and a
peak at chromosomal region q13.2, as well as a suggestive
peak at the ACTN1 locus on chromosome 14 (Figure S4A).
Considering the secondary analysis comparing Amerin-
dian ancestry to all other ancestries, we identified a
4, 2016

Table
2.
Allele
Fre
quenciesofPLT-A
ssociate
dVariants
by1000GenomesContinenta
lPopulationsandAdmixedAmericanSub-p
opulations
Gene(Function)
Chro
moso
mal
Position
(GRCh37/hg19)
rsID
Coded/Altern
ative
Allele
onPlus
Strand
HCHS/SOL
CodedAllele
Fre
quency
Super-populationCodedAllele
Fre
quency
AMRSub-p
opulationCodedAllele
Fre
quency
AFR
EAS
EUR
SAS
AMR
CLM
MXL
PEL
PUR
ACTN1(intronic)a
chr14:69,425,467
rs117672662
T/C
0.94
1.000
1.00
0.999
0.999
0.927
0.926
0.938
0.859
0.976
ZBTB9-BAK1(intergen
ic)
chr6:33,524,820
rs62405954
T/C
0.86
0.999
0.994
0.919
0.964
0.831
0.824
0.781
0.741
0.942
GABBR1-M
OG
(intergen
ic)
chr6:29,608,184
rs75140056
C/C
AT
0.39
0.384
0.213
0.417
0.304
0.365
0.452
0.391
0.206
0.399
BANP-ZFPM1(intergen
ic)
chr16:88,376,014
rs80294974
G/A
0.98
0.998
1.000
0.963
0.993
0.991
0.995
0.992
0.994
0.986
ETV7(intronic)
chr6:36,344,980
rs9470264
G/A
0.80
0.825
0.877
0.992
0.995
0.765
0.809
0.656
0.612
0.918
MEF2C
(intronic)a
chr5:88,133,921
rs144261491
C/T
0.97
1.000
1.000
1.000
1.000
0.963
0.989
0.953
0.906
0.990
Abbreviationsare
asfollo
ws:AFR
,African;EAS,EastAsian;EUR,European;SAS,S
outh
Asian;AMR,admixedAmerican;CLM
,Colombianfrom
Medellin,Colombia;MXL,Mexicanancestry
from
LosAngeles,USA;P
EL,Peruvians
from
Lima,Peru;andPUR,PuertoRicansfrom
PuertoRico.
aFo
rACTN1rs117672662andMEF2Crs144261491,theallele
frequenciesdiffersignificantlybetw
eenAMRandAFR
,EAS,EUR,andSASpopulations.
The Americ
significant peak at ACTN1 (Figure S4B). Further, there was
highly significant concordance between the number of
Amerindian ancestral alleles at the ACTN1 locus and the
rs117672662 genotype (p value < 2.20 3 10�16; Table S4).
Replication of PLT Loci in Independent Hispanic/
Latino Samples
Replication of PLT association findings discovered in
HCHS/SOL was carried out in an independent sample of
up to 7,170 Hispanic/Latino Americans derived from three
multi-ethnic US-based cohorts (WHI [n ¼ 3,534], BioMe
Biobank [n ¼ 2,854], and MESA [n ¼ 782]), whose charac-
teristics are described in Table S1. We carried forward six
SNPs from the discovery stage for replication: ACTN1
(rs117672662), GABBR1-MOG (rs75140056), ETV7
(rs9470264), BANP-ZFPM1 (rs80294974), ZBTB9-BAK1
(rs62405954), and MEF2C (rs144261491). Of these, five
SNPs (all except BANP-ZFPM1 rs80294974) met our pre-
specified criteria for replication (p value < 0.05/6 ¼0.008; Table 1). BANP-ZFPM1 rs80294974 had a lower fre-
quency (MAF ¼ 2%), so a failure to replicate might be
related to limited power to detect this association in the
smaller Hispanic/Latino replication sample. The discovery
variants and the discovery and generalized variants from
HCHS/SOL explain 1.79% and 6.14% of the total variance
of PLT, respectively.
In addition to PLT, MPVmeasurements were available in
a subset of 4,041 Hispanic/Latino WHI and BioMe partici-
pants in our replication dataset. At four out of five of
our replicated loci, the allele associated with lower PLT
was also associated with higher MPV (ACTN1
rs117672662 p value ¼ 3.90 3 10�18, GABBR1-MOG
rs75140056 p value ¼ 0.003, ETV7 rs9470264 p value ¼1.90 3 10�15, and BAK1 rs62405954 p value ¼ 0.03;
Table S5).
Functional Annotation and Characterization of the
Discovery PLT Loci
At each of the five replicated loci (ACTN1, GABBR1-MOG,
ETV7,ZBTB9-BAK1, andMEF2C),wedefined the association
interval as containing all genotyped or imputed variants
(SNPs and indels) in LD (r2 > 0.5) with the index variant.
Within each interval, we (1) identified genes and non-cod-
ing RNAs and their tissue expression patterns, (2) predicted
SNP functionality by using genome-wide epigenomic data-
sets from megakaryocytes and other blood cell types from
the BLUEPRINT,59 ENCODE,47 and FANTOM560 projects
(Table S6), and (3) assessed SNP associations with gene
expression (eQTL) in whole blood61 (Table S7).
We identified one or more SNPs that overlapped putative
megakaryocyte enhancers or promoters and were in LD
(r2 R 0.5) with the index SNP at each of the five replicated
PLT loci (Table S8). Of particular interest, ACTN1 index
SNP rs117672662 lies within a megakaryocyte-specific pu-
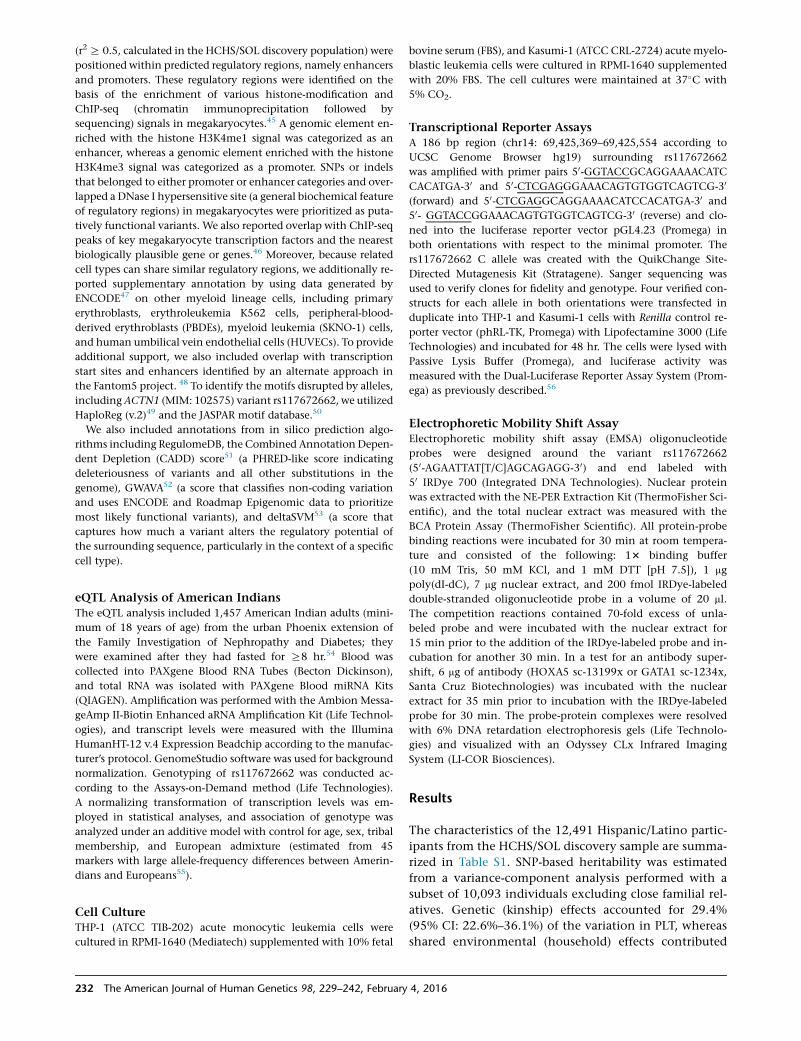
tative enhancer located within ACTN1 intron 1 (Figure 2).
The genomic element harboring rs117672662 overlaps
ChIP-seq peaks of key megakaryocyte regulators, including
an Journal of Human Genetics 98, 229–242, February 4, 2016 235
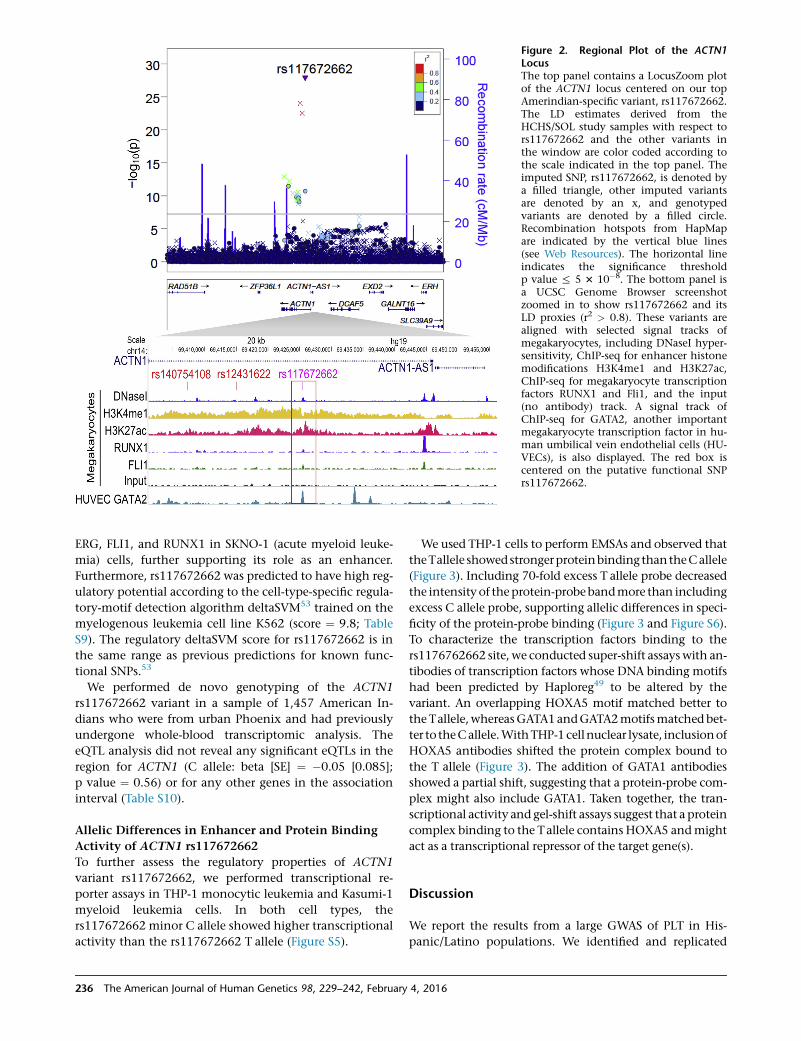
Figure 2. Regional Plot of the ACTN1LocusThe top panel contains a LocusZoom plotof the ACTN1 locus centered on our topAmerindian-specific variant, rs117672662.The LD estimates derived from theHCHS/SOL study samples with respect tors117672662 and the other variants inthe window are color coded according tothe scale indicated in the top panel. Theimputed SNP, rs117672662, is denoted bya filled triangle, other imputed variantsare denoted by an x, and genotypedvariants are denoted by a filled circle.Recombination hotspots from HapMapare indicated by the vertical blue lines(see Web Resources). The horizontal lineindicates the significance thresholdp value % 5 3 10�8. The bottom panel isa UCSC Genome Browser screenshotzoomed in to show rs117672662 and itsLD proxies (r2 > 0.8). These variants arealigned with selected signal tracks ofmegakaryocytes, including DNaseI hyper-sensitivity, ChIP-seq for enhancer histonemodifications H3K4me1 and H3K27ac,ChIP-seq for megakaryocyte transcriptionfactors RUNX1 and Fli1, and the input(no antibody) track. A signal track ofChIP-seq for GATA2, another importantmegakaryocyte transcription factor in hu-man umbilical vein endothelial cells (HU-VECs), is also displayed. The red box iscentered on the putative functional SNPrs117672662.
ERG, FLI1, and RUNX1 in SKNO-1 (acute myeloid leuke-
mia) cells, further supporting its role as an enhancer.
Furthermore, rs117672662 was predicted to have high reg-
ulatory potential according to the cell-type-specific regula-
tory-motif detection algorithm deltaSVM53 trained on the
myelogenous leukemia cell line K562 (score ¼ 9.8; Table
S9). The regulatory deltaSVM score for rs117672662 is in
the same range as previous predictions for known func-
tional SNPs.53
We performed de novo genotyping of the ACTN1
rs117672662 variant in a sample of 1,457 American In-
dians who were from urban Phoenix and had previously
undergone whole-blood transcriptomic analysis. The
eQTL analysis did not reveal any significant eQTLs in the
region for ACTN1 (C allele: beta [SE] ¼ �0.05 [0.085];
p value ¼ 0.56) or for any other genes in the association
interval (Table S10).
Allelic Differences in Enhancer and Protein Binding
Activity of ACTN1 rs117672662
To further assess the regulatory properties of ACTN1
variant rs117672662, we performed transcriptional re-
porter assays in THP-1 monocytic leukemia and Kasumi-1
myeloid leukemia cells. In both cell types, the
rs117672662 minor C allele showed higher transcriptional
activity than the rs117672662 T allele (Figure S5).
236 The American Journal of Human Genetics 98, 229–242, February
We used THP-1 cells to perform EMSAs and observed that
theTallele showedstrongerproteinbinding thantheCallele
(Figure 3). Including 70-fold excess T allele probe decreased
the intensity of theprotein-probebandmore than including
excess C allele probe, supporting allelic differences in speci-
ficity of the protein-probe binding (Figure 3 and Figure S6).
To characterize the transcription factors binding to the
rs1176762662 site, we conducted super-shift assayswith an-
tibodies of transcription factors whose DNA binding motifs
had been predicted by Haploreg49 to be altered by the
variant. An overlapping HOXA5 motif matched better to
the Tallele, whereasGATA1 andGATA2motifsmatched bet-
ter to theCallele.WithTHP-1cellnuclear lysate, inclusionof
HOXA5 antibodies shifted the protein complex bound to
the T allele (Figure 3). The addition of GATA1 antibodies
showed a partial shift, suggesting that a protein-probe com-
plex might also include GATA1. Taken together, the tran-
scriptional activity and gel-shift assays suggest that a protein
complex binding to the Tallele contains HOXA5 andmight
act as a transcriptional repressor of the target gene(s).
Discussion
We report the results from a large GWAS of PLT in His-
panic/Latino populations. We identified and replicated
4, 2016

Figure 3. Allelic Differences in Protein Binding at rs117672662EMSA using oligonucleotide probes containing different alleles atrs117672662 (T allele [lanes 1–5] and C allele [lanes 6–10]). Nu-clear extracts from human monocyte THP-1 cells were incubatedwith IRDye-labeled double-stranded oligonucleotide probe alone(lanes 1 and 6) or with 70-fold excess of unlabeled probe (lanes2, 3, 7, and 8), GATA1 antibodies (lanes 4 and 9), or HOXA5antibodies (lanes 5 and 10). The dotted black arrow indicatesprobe-protein complexes, the solid black arrows indicate probe-protein-antibody complexes, and the gray arrows indicate non-specific probe-protein binding complexes. Further support of theallelic differences is provided in Figure S6.
associations with three loci including noncoding SNPs in
or near ACTN1, ETV7, and GABBR1-MOG and two popula-
tion-specific variants at previously identified PLT GWAS
loci ZBTB9-BAK1 and MEFC2. The ACTN1 and ZBTB9-
BAK1 association signals were also detected in a genome-
wide scan for local-ancestry admixture. Overall, four of
the five PLT association signals (ACTN1, ETV7, MEF2C,
and ZBTB9-BAK1) were highly differentiated across popu-
lations of European, West African, and Amerindian
ancestry. The ACTN1 and MEF2C alleles were found only
on an Amerindian ancestral background and therefore
could realistically only have been discovered through
studies involving Hispanic/Latino or Amerindian popula-
tions. We have also demonstrated that approximately
50% of PLT-associated alleles previously identified in Euro-
pean, African American, and Japanese populations gener-
alized to HCHS/SOL populations, suggesting that many
of the same regions of the genome are involved in regula-
tion of PLT across global populations.
The identification of a common Amerindian ancestral
variant located in a putative enhancer regionwithin intron
1 of ACTN1 adds to previous studies reporting the ACTN1
The Americ
locus as a source of PLT phenotypic variation. The most
likely targets of the rs117672662 variant are either
ACTN1 itself or ACTN1-AS1, which is a long non-coding
RNA just upstream of ACTN1 and can potentially regulate
ACTN1 transcript levels. Missense mutations in ACTN1
have recently been identified in congenital macrothrom-
bocytopenia pedigrees with mild-to-moderate thrombocy-
topenia, increased MPV, and minimal bleeding manifesta-
tions.62,63 Two subsequent genetic studies (one from Italy
and one from the US and Europe) of previously uncharac-
terized inherited platelet disorders found ACTN1 missense
mutations in ~4%–5% of affected individuals.64,65 Func-
tional characterization of missense variants in ACTN1
(c.94C>A [p.Gln32Lys] and c.313G>A [p.Val105Ile]) sug-
gest that the variants disrupt the actin cytoskeleton struc-
ture and impair megakaryocyte pro-platelet production.63
Although these studies highlight the implications of
ACTN1 loss-of-function coding mutations in PLT re-
gulation, transcriptional regulation of ACTN1 is also
important for normal megakaryopoiesis.66,67 In addition
to regulating PLT, the actin cytoskeleton is involved in
determining platelet size during the final stages of pro-
platelet formation from megakaryocytes.68
Consistent with the relationship between ACTN1 muta-
tions and familial macrothrombocytopenia, the minor
allele (rs117672662 C allele) of the Amerindian ACTN1
non-coding variant was associated with lower PLT and
higher MPV. The rs117672662 C allele displayed increased
enhancer activity, whereas the rs117672662 T allele
demonstrated a super-shift that could be mediated by
HOXA5 and a partial super-shift mediated by GATA1.
GATA1 also appeared to bind to the rs117672662 T allele
probe. HOXA5 and GATA1 have each been shown to
play a role in erythrocyte and megakaryocyte develop-
ment,69–72 and both transcription factors are dysregulated
in hematopoietic stem cells showing erythroid and mega-
karyocyte differentiation blockage mediated by HOXA10
overexpression.70 Furthermore, HOXA5 might act as a
transcriptional repressor for several genes involved in actin
remodeling.73 Despite the evidence for allelic difference in
expression and binding of HOXA5 and GATA1, further ex-
periments are needed for elucidating the precise regulatory
molecular mechanism by which the ACTN1 rs117672662
C allele alters platelet production and/or PLT.74,75
Two additional PLT loci and one independent signal in a
known locus were identified on chromosome 6 in gene-
rich, extended LD regions located about 3.3 Mb cen-
tromeric (ETV7), 84 kb telomeric (GABBR1-MOG), and
25 Mb centromeric (ZBTB9-BAK1) to the major histocom-
patibility complex (MHC) region. The ETV7 index SNP
rs9470264 is located within an intron of ETV7, which en-
codes the Ets family transcription factor TEL-2. ETV7 (or
TEL2) is primarily expressed in hematopoietic tissues,
including bone marrow and spleen.76,77 Further, ETV7 is
expressed in leukemic cells and appears to be more highly
expressed in a subset of leukemic samples,78 pointing to
possible roles for this transcription factor in both normal
an Journal of Human Genetics 98, 229–242, February 4, 2016 237
hematopoiesis and oncogenesis. Mutations in a related Ets-
encoding gene, ETV6 (MIM: 600618), encoding ubiqui-
tously expressed TEL-1, were recently identified in pedi-
grees affected by congenital thrombocytopenia,79–81 and
chromosomal translocations involving ETV6 (e.g., ETV6-
PDGFRB [MIM: 173410]) are common in hematologic
malignancies.78 Despite strong biological plausibility
supporting ETV7 in hematopoiesis, in silico functional
annotation of the index SNP and LD proxies prioritized a
promoter polymorphism in neighboring KCTD20 (MIM:
615932) as the putative functional SNP. Whole-blood
eQTL analysis of the ETV7 index SNPs and LD proxies indi-
cated significant differences in KCTD20, but not ETV7,
expression (see Table S7), further supporting a role for
KCTD20 in regulating PLT at this locus.61
The index variant rs75140056 is located in an intergenic
region between MOG and GABBR1 (Figure S1C). Surveying
variation in high LD with the index SNP, we prioritized
rs29269 as the strongest functional candidate polymor-
phism on the basis of its position in a putative active
GABBR1 promoter in megakaryocytes (Table S8). GABBR1
is a member of the gamma-aminobutyric acid family of
inhibitory neurotransmitters and is most notably known
for its role in themammalian CNS. However, a recent study
reported differential regulation of GABBR1 in bone-
marrow- and fetal-liver-derived megakaryocytes from
wild-type mice, thereby suggesting a potential role of
GABBR1 in developmental-stage-specific regulation of
megakaryopoiesis.82 In addition, several proxy SNPs,
including putative functional SNP rs29269, are eQTLs
(Table S7) for MHC class I genes (e.g., HLA-F [MIM:
143110] and HLA-G [MIM: 142871]). These observations
suggest that variation at this locus might regulate one or
more genes.
The index SNP in our Hispanic/Latino discovery sample
at the ZBTB9-BAK1 locus (rs62405954) is distinct from
rs210134, which was previously associated with PLT in Eu-
ropean GWASs. rs62405954 is in LD with rs1002011,
which overlaps a DNase hypersensitive site in megakaryo-
cytes and lies within a putative enhancer overlapping the
50 UTR of VPS52 (MIM: 603443), a gene that encodes an
intracellular protein involved in endocytic recycling and
is highly expressed in hematopoietic cells of erythroid
and megakaryocyte lineages.
In addition, we identified an Amerindian-population-
specific variant at MEF2C, a known PLT locus. MEF2C,
which encodes a MADS box transcription factor and is
differentially expressed at various stages of hematopoie-
sis, is an important downstream target of stem cell
leukemia for lineage-specific megakaryocyte develop-
ment.83 The Amerindian-ancestry-specific index SNP
rs144261491 is distinct from the MEF2C European index
SNP rs700585. rs144261491 is in LD with rs200572016
(r2 ¼ 0.8), which lies in a megakaryocyte-specific DNase
hypersensitive site in the MEF2C antisense RNA and over-
laps several transcription factor binding sites (GATA2,
TAL1, and P300) in K562 cells. MEF2C and MEF2C-AS1
238 The American Journal of Human Genetics 98, 229–242, February
are differentially expressed between erythroblasts and
megakaryocytes.
In summary, we discovered and replicated three loci
associated with PLT in Hispanic/Latino populations, as
well as independent signals within two PLT-associated re-
gions previously identified in populations of European
descent. Several of these discovered PLT loci are prevalent
among populations of Amerindian ancestry but rare or ab-
sent among populations of European or African ancestry.
Amerindian-specific loci (e.g., SLC16A11 [MIM: 615765])
for metabolic traits (diabetes and glycemic traits) similarly
have been identified among other Hispanic/Latino popula-
tions.84 Given the role of blood cells in pathogen invasion
or defense, population-specific and/or rare variants might
be expected to contribute to the regulation of genes rele-
vant to quantitative blood cell phenotypes. The ACTN1
and MEF2C alleles might have arisen by mutation among
populations of Amerindian ancestry after the peopling of
the Americas85 and persisted as a result of local evolu-
tionary selective pressure or genetic drift. Unlike the
SLC16A11 locus,84 our PLT-associated loci did now show
evidence of arising from introgression due to admixture
with archaic humans. Taken together, our findings empha-
size the importance and utility of performing genetic
studies in populations with diverse ancestral backgrounds,
including Hispanic/Latino populations.
Supplemental Data
Supplemental Data include 6 figures and 12 tables and can be
found with this article online at http://dx.doi.org/10.1016/j.
ajhg.2015.12.003.
Acknowledgments
We thank the participants and staff of the Hispanic Community
Health Study/Study of Latinos (HCHS/SOL). The baseline exami-
nation of HCHS/SOL was supported by contracts from the
National Heart, Lung, and Blood Institute (NHLBI) to the Univer-
sity of North Carolina (N01-HC65233), University of Miami
(N01-HC65234), Albert Einstein College of Medicine (N01-
HC65235), Northwestern University (N01-HC65236), and San
Diego State University (N01-HC65237). The National Institute
on Minority Health and Health Disparities, National Institute
on Deafness and Other Communication Disorders, National
Institute of Dental and Craniofacial Research (NIDCR), National
Institute of Diabetes and Digestive and Kidney Diseases (NIDDK),
National Institute of Neurological Disorders and Stroke, and NIH
Office of Dietary Supplements additionally contributed funding
to HCHS/SOL. The Genetic Analysis Center at the University of
Washington was supported by NHLBI and NIDCR contracts
(HHSN268201300005C AM03 and MOD03). Additional
analysis support was provided by 1R01DK101855-01 and
13GRNT16490017. Genotyping was also supported by National
Center for Advancing Translational Sciences UL1TR000124 and
NIDDK DK063491 to the Southern California Diabetes Endocri-
nology Research Center. Additional support for rs117672662
functional studies was provided by R01 DK072193. This research
was also supported in part by the Intramural Research Program of
4, 2016
the NIDDK, contract no. HHSB268201200054C, and Illumina.
S.R.B. was supported by R01-GM110068. We thank Dr. Nick Pat-
terson and the Simons Genome Diversity Project for kindly
providing Australo-Melanesian sequence data. The Mount Sinai
IPM Biobank Program is supported by the Andrea and Charles
Bronfman Philanthropies.
Received: October 1, 2015
Accepted: December 7, 2015
Published: January 21, 2016
Web Resources
The URLs for data presented herein are as follows:
HapMap recombination hotspots, ftp://ftp.hapmap.org/hapmap/
recombination/2008-03_rel22_B36/rates/
OMIM, http://www.omim.org
UCSC Genome Browser, https://genome.ucsc.edu/
References
1. Freson, K., Wijgaerts, A., and van Geet, C. (2014). Update on
the causes of platelet disorders and functional consequences.
Int. J. Lab. Hematol. 36, 313–325.
2. Gieger, C., Radhakrishnan, A., Cvejic, A., Tang, W., Porcu, E.,
Pistis, G., Serbanovic-Canic, J., Elling, U., Goodall, A.H., Lab-
rune, Y., et al. (2011). New gene functions inmegakaryopoiesis
and platelet formation. Nature 480, 201–208.
3. Nurnberg, S.T., Rendon, A., Smethurst, P.A., Paul, D.S., Voss,
K., Thon, J.N., Lloyd-Jones, H., Sambrook, J.G., Tijssen, M.R.,
Italiano, J.E., Jr., et al.; HaemGen Consortium (2012).
A GWAS sequence variant for platelet volume marks an alter-
native DNM3 promoter inmegakaryocytes near a MEIS1 bind-
ing site. Blood 120, 4859–4868.
4. Msaouel, P., Lam, A.P., Gundabolu, K., Chrysofakis, G., Yu, Y.,
Mantzaris, I., Friedman, E., and Verma, A. (2014). Abnormal
platelet count is an independent predictor of mortality in
the elderly and is influenced by ethnicity. Haematologica 99,
930–936.
5. Shameer, K., Denny, J.C., Ding, K., Jouni, H., Crosslin, D.R., de
Andrade, M., Chute, C.G., Peissig, P., Pacheco, J.A., Li, R., et al.
(2014). A genome- and phenome-wide association study to
identify genetic variants influencing platelet count and vol-
ume and their pleiotropic effects. Hum. Genet. 133, 95–109.
6. Segal, J.B., andMoliterno, A.R. (2006). Platelet counts differ by
sex, ethnicity, and age in the United States. Ann. Epidemiol.
16, 123–130.
7. Bain, B.J. (1996). Ethnic and sex differences in the total and
differential white cell count and platelet count. J. Clin. Pathol.
49, 664–666.
8. Biino, G., Balduini, C.L., Casula, L., Cavallo, P., Vaccargiu, S.,
Parracciani, D., Serra, D., Portas, L., Murgia, F., and Pirastu,
M. (2011). Analysis of 12,517 inhabitants of a Sardinian
geographic isolate reveals that predispositions to thrombocy-
topenia and thrombocytosis are inherited traits. Haematolog-
ica 96, 96–101.
9. Buckley, M.F., James, J.W., Brown, D.E., Whyte, G.S., Dean,
M.G., Chesterman, C.N., and Donald, J.A. (2000). A novel
approach to the assessment of variations in the human
platelet count. Thromb. Haemost. 83, 480–484.
The Americ
10. Evans, D.M., Frazer, I.H., and Martin, N.G. (1999). Genetic
and environmental causes of variation in basal levels of blood
cells. Twin Res. 2, 250–257.
11. Kamatani, Y., Matsuda, K., Okada, Y., Kubo, M., Hosono,
N., Daigo, Y., Nakamura, Y., and Kamatani, N. (2010).
Genome-wide association study of hematological and
biochemical traits in a Japanese population. Nat. Genet.
42, 210–215.
12. Li, J., Glessner, J.T., Zhang, H., Hou, C., Wei, Z., Bradfield, J.P.,
Mentch, F.D., Guo, Y., Kim, C., Xia, Q., et al. (2013). GWAS of
blood cell traits identifies novel associated loci and epistatic
interactions in Caucasian and African-American children.
Hum. Mol. Genet. 22, 1457–1464.
13. Qayyum, R., Snively, B.M., Ziv, E., Nalls, M.A., Liu, Y., Tang,
W., Yanek, L.R., Lange, L., Evans, M.K., Ganesh, S., et al.
(2012). A meta-analysis and genome-wide association study
of platelet count and mean platelet volume in african ameri-
cans. PLoS Genet. 8, e1002491.
14. Soranzo, N., Spector, T.D., Mangino, M., Kuhnel, B., Rendon,
A., Teumer, A., Willenborg, C., Wright, B., Chen, L., Li, M.,
et al. (2009). A genome-wide meta-analysis identifies 22 loci
associated with eight hematological parameters in the Haem-
Gen consortium. Nat. Genet. 41, 1182–1190.
15. Witkop, C.J., Nunez Babcock, M., Rao, G.H., Gaudier, F.,
Summers, C.G., Shanahan, F., Harmon, K.R., Townsend, D.,
Sedano, H.O., King, R.A., et al. (1990). Albinism and Herman-
sky-Pudlak syndrome in Puerto Rico. Bol. Asoc. Med. P. R. 82,
333–339.
16. Lavange, L.M., Kalsbeek, W.D., Sorlie, P.D., Aviles-Santa, L.M.,
Kaplan, R.C., Barnhart, J., Liu, K., Giachello, A., Lee, D.J.,
Ryan, J., et al. (2010). Sample design and cohort selection in
the Hispanic Community Health Study/Study of Latinos.
Ann. Epidemiol. 20, 642–649.
17. Sorlie, P.D., Aviles-Santa, L.M., Wassertheil-Smoller, S.,
Kaplan, R.C., Daviglus, M.L., Giachello, A.L., Schneiderman,
N., Raij, L., Talavera, G., Allison, M., et al. (2010).
Design and implementation of the Hispanic Community
Health Study/Study of Latinos. Ann. Epidemiol. 20,
629–641.
18. Rosenberg, N.A., Li, L.M., Ward, R., and Pritchard, J.K. (2003).
Informativeness of genetic markers for inference of ancestry.
Am. J. Hum. Genet. 73, 1402–1422.
19. Laurie, C.C., Doheny, K.F., Mirel, D.B., Pugh, E.W., Bierut,
L.J., Bhangale, T., Boehm, F., Caporaso, N.E., Cornelis,
M.C., Edenberg, H.J., et al.; GENEVA Investigators (2010).
Quality control and quality assurance in genotypic data
for genome-wide association studies. Genet. Epidemiol.
34, 591–602.
20. Laurie, C.C., Laurie, C.A., Rice, K., Doheny, K.F., Zelnick, L.R.,
McHugh, C.P., Ling, H., Hetrick, K.N., Pugh, E.W., Amos, C.,
et al. (2012). Detectable clonal mosaicism from birth to old
age and its relationship to cancer. Nat. Genet. 44, 642–650.
21. Conomos, M.P., Reiner, A.P., Weir, B.S., and Thornton, T.A.
(2015). Model-free estimation of recent genetic relatedness.
Am. J. Hum. Genet. 98, 127–148.
22. Conomos, M.P., Miller, M.B., and Thornton, T.A. (2015).
Robust inference of population structure for ancestry predic-
tion and correction of stratification in the presence of related-
ness. Genet. Epidemiol. 39, 276–293.
23. Abecasis, G.R., Auton, A., Brooks, L.D., DePristo, M.A., Dur-
bin, R.M., Handsaker, R.E., Kang, H.M., Marth, G.T., and
McVean, G.A.; 1000 Genomes Project Consortium (2012).
an Journal of Human Genetics 98, 229–242, February 4, 2016 239

An integrated map of genetic variation from 1,092 human ge-
nomes. Nature 491, 56–65.
24. Howie, B., Marchini, J., and Stephens, M. (2011). Genotype
imputation with thousands of genomes. G3 (Bethesda) 1,
457–470.
25. Howie, B.N., Donnelly, P., and Marchini, J. (2009). A flexible
and accurate genotype imputationmethod for the next gener-
ation of genome-wide association studies. PLoS Genet. 5,
e1000529.
26. Li, Y., Willer, C.J., Ding, J., Scheet, P., and Abecasis, G.R.
(2010). MaCH: using sequence and genotype data to estimate
haplotypes and unobserved genotypes. Genet. Epidemiol. 34,
816–834.
27. Conomos, M.P. (2014). Inferring, estimating and accounting
for population and pedigree structure in genetic analyses.
PhD thesis (University of Washington).
28. Conomos, M.P., Laurie, C.A., Stilp, A.M., Gogarten, S.M.,
McHugh, C.P., Nelson, S.C., Sofer, T., Fernandez-Rhodes,
L., Justice, A.E., Graff, M., et al. (2015). Genetic di-
versity and association studies in US Hispanic/Latino
populations: Applications in the Hispanic Community
Health Study/Study of Latinos. Am. J. Hum. Genet. 98,
165–184.
29. Yang, J., Lee, S.H., Goddard, M.E., and Visscher, P.M. (2011).
GCTA: a tool for genome-wide complex trait analysis. Am. J.
Hum. Genet. 88, 76–82.
30. Clopper, C.J., and Pearson, E.S. (1934). The Use of Confidence
or Fiducial Limits Illustrated in the Case of the Binomial. Bio-
metrika 26, 404–413.
31. R Core Development Team (2014). R: A language and environ-
ment for statistical computing (R Foundation for Statistical
Computing).
32. Green, R.E., Krause, J., Briggs, A.W., Maricic, T., Stenzel, U.,
Kircher, M., Patterson, N., Li, H., Zhai, W., Fritz, M.H., et al.
(2010). A draft sequence of the Neandertal genome. Science
328, 710–722.
33. Meyer, M., Kircher, M., Gansauge, M.T., Li, H., Racimo, F., Mal-
lick, S., Schraiber, J.G., Jay, F., Prufer, K., de Filippo, C., et al.
(2012). A high-coverage genome sequence from an archaic
Denisovan individual. Science 338, 222–226.
34. Skoglund, P., Mallick, S., Bortolini, M.C., Chennagiri, N., Hu-
nemeier, T., Petzl-Erler, M.L., Salzano, F.M., Patterson, N., and
Reich, D. (2015). Genetic evidence for two founding popula-
tions of the Americas. Nature 525, 104–108.
35. Reiner, A.P., Beleza, S., Franceschini, N., Auer, P.L., Robinson,
J.G., Kooperberg, C., Peters, U., and Tang, H. (2012).
Genome-wide association and population genetic analysis of
C-reactive protein in African American and Hispanic Amer-
ican women. Am. J. Hum. Genet. 91, 502–512.
36. Chen,W., Brehm, J.M., Manichaikul, A., Cho,M.H., Boutaoui,
N., Yan, Q., Burkart, K.M., Enright, P.L., Rotter, J.I., Petersen,
H., et al. (2015). A genome-wide association study of chronic
obstructive pulmonary disease inHispanics. Ann. Am. Thorac.
Soc. 12, 340–348.
37. Manichaikul, A., Palmas, W., Rodriguez, C.J., Peralta, C.A.,
Divers, J., Guo, X., Chen, W.M., Wong, Q., Williams, K.,
Kerr, K.F., et al. (2012). Population structure of Hispanics in
the United States: the multi-ethnic study of atherosclerosis.
PLoS Genet. 8, e1002640.
38. Tayo, B.O., Teil, M., Tong, L., Qin, H., Khitrov, G., Zhang, W.,
Song, Q., Gottesman, O., Zhu, X., Pereira, A.C., et al. (2011).
Genetic background of patients from a universitymedical cen-
240 The American Journal of Human Genetics 98, 229–242, February
ter in Manhattan: implications for personalized medicine.
PLoS ONE 6, e19166.
39. Willer, C.J., Li, Y., and Abecasis, G.R. (2010). METAL: fast and
efficient meta-analysis of genomewide association scans. Bio-
informatics 26, 2190–2191.
40. Maples, B.K., Gravel, S., Kenny, E.E., and Bustamante, C.D.
(2013). RFMix: a discriminative modeling approach for rapid
and robust local-ancestry inference. Am. J. Hum. Genet. 93,
278–288.
41. Cavalli-Sforza, L.L. (2005). The Human Genome Diversity
Project: past, present and future. Nat. Rev. Genet. 6, 333–340.
42. Altshuler, D.M., Gibbs, R.A., Peltonen, L., Altshuler, D.M.,
Gibbs, R.A., Peltonen, L., Dermitzakis, E., Schaffner, S.F.,
Yu, F., Peltonen, L., et al.; International HapMap 3
Consortium (2010). Integrating common and rare genetic
variation in diverse human populations. Nature 467,
52–58.
43. Browning, S.R., and Browning, B.L. (2007). Rapid and accurate
haplotype phasing and missing-data inference for whole-
genome association studies by use of localized haplotype clus-
tering. Am. J. Hum. Genet. 81, 1084–1097.
44. Heller, R., Bogomolov, M., and Benjamini, Y. (2014). Deciding
whether follow-up studies have replicated findings in a pre-
liminary large-scale omics study. Proc. Natl. Acad. Sci. USA
111, 16262–16267.
45. Adams, D., Altucci, L., Antonarakis, S.E., Ballesteros, J., Beck,
S., Bird, A., Bock, C., Boehm, B., Campo, E., Caricasole, A.,
et al. (2012). BLUEPRINT to decode the epigenetic signature
written in blood. Nat. Biotechnol. 30, 224–226.
46. Tijssen, M.R., Cvejic, A., Joshi, A., Hannah, R.L., Ferreira, R.,
Forrai, A., Bellissimo, D.C., Oram, S.H., Smethurst, P.A., Wil-
son, N.K., et al. (2011). Genome-wide analysis of simultaneous
GATA1/2, RUNX1, FLI1, and SCL binding in megakaryocytes
identifies hematopoietic regulators. Dev. Cell 20, 597–609.
47. ENCODE Project Consortium (2012). An integrated encyclo-
pedia of DNA elements in the human genome. Nature 489,
57–74.
48. Andersson, R., Gebhard, C., Miguel-Escalada, I., Hoof, I., Born-
holdt, J., Boyd, M., Chen, Y., Zhao, X., Schmidl, C., Suzuki, T.,
et al.; FANTOMConsortium(2014).Anatlasof activeenhancers
across human cell types and tissues. Nature 507, 455–461.
49. Ward, L.D., and Kellis, M. (2012). HaploReg: a resource for
exploring chromatin states, conservation, and regulatory
motif alterationswithin sets of genetically linked variants. Nu-
cleic Acids Res. 40, D930–D934.
50. Sandelin, A., Alkema,W., Engstrom, P.,Wasserman,W.W., and
Lenhard, B. (2004). JASPAR: an open-access database for eu-
karyotic transcription factor binding profiles. Nucleic Acids
Res. 32, D91–D94.
51. Kircher, M., Witten, D.M., Jain, P., O’Roak, B.J., Cooper, G.M.,
and Shendure, J. (2014). A general framework for estimating
the relative pathogenicity of human genetic variants. Nat.
Genet. 46, 310–315.
52. Ritchie, G.R., Dunham, I., Zeggini, E., and Flicek, P. (2014).
Functional annotation of noncoding sequence variants. Nat.
Methods 11, 294–296.
53. Lee, D., Gorkin, D.U., Baker, M., Strober, B.J., Asoni, A.L.,
McCallion, A.S., and Beer, M.A. (2015). A method to predict
the impact of regulatory variants from DNA sequence. Nat.
Genet. 47, 955–961.
54. Knowler, W.C., Coresh, J., Elston, R.C., Freedman, B.I., Iyen-
gar, S.K., Kimmel, P.L., Olson, J.M., Plaetke, R., Sedor, J.R.,
4, 2016

and Seldin, M.F.; Family Investigation of Nephropathy and
Diabetes Research Group (2005). The Family Investigation of
Nephropathy and Diabetes (FIND): design and methods.
J. Diabetes Complications 19, 1–9.
55. Tian, C., Hinds, D.A., Shigeta, R., Adler, S.G., Lee, A., Pahl,
M.V., Silva, G., Belmont, J.W., Hanson, R.L., Knowler, W.C.,
et al. (2007). A genomewide single-nucleotide-polymorphism
panel forMexican American admixturemapping. Am. J. Hum.
Genet. 80, 1014–1023.
56. Fogarty, M.P., Cannon, M.E., Vadlamudi, S., Gaulton, K.J., and
Mohlke, K.L. (2014). Identification of a regulatory variant that
binds FOXA1 and FOXA2 at the CDC123/CAMK1D type 2
diabetes GWAS locus. PLoS Genet. 10, e1004633.
57. Zuk, O., Hechter, E., Sunyaev, S.R., and Lander, E.S. (2012).
The mystery of missing heritability: Genetic interactions
create phantom heritability. Proc. Natl. Acad. Sci. USA 109,
1193–1198.
58. Heller, R., Bogomolov, M., Benjamini, Y., and Sofer, T. (2015).
Testing for replicability in a follow-up study when the primary
study hypotheses are two-sided. arXiv, arXiv:1503.02278.
59. Martens, J.H., and Stunnenberg, H.G. (2013). BLUEPRINT:
mapping human blood cell epigenomes. Haematologica 98,
1487–1489.
60. Lizio, M., Harshbarger, J., Shimoji, H., Severin, J., Kasukawa,
T., Sahin, S., Abugessaisa, I., Fukuda, S., Hori, F., Ishikawa-
Kato, S., et al.; FANTOM consortium (2015). Gateways to the
FANTOM5 promoter level mammalian expression atlas.
Genome Biol. 16, 22.
61. Westra, H.J., Peters, M.J., Esko, T., Yaghootkar, H., Schurmann,
C., Kettunen, J., Christiansen, M.W., Fairfax, B.P., Schramm,
K., Powell, J.E., et al. (2013). Systematic identification of trans
eQTLs as putative drivers of known disease associations. Nat.
Genet. 45, 1238–1243.
62. Gueguen, P., Rouault, K., Chen, J.M., Raguenes, O., Fichou,
Y., Hardy, E., Gobin, E., Pan-Petesch, B., Kerbiriou, M.,
Trouve, P., et al. (2013). A missense mutation in the
alpha-actinin 1 gene (ACTN1) is the cause of autosomal
dominant macrothrombocytopenia in a large French family.
PLoS ONE 8, e74728.
63. Kunishima, S., Okuno, Y., Yoshida, K., Shiraishi, Y., Sanada,
M., Muramatsu, H., Chiba, K., Tanaka, H., Miyazaki, K., Sakai,
M., et al. (2013). ACTN1 mutations cause congenital macro-
thrombocytopenia. Am. J. Hum. Genet. 92, 431–438.
64. Bottega, R., Marconi, C., Faleschini, M., Baj, G., Cagioni, C.,
Pecci, A., Pippucci, T., Ramenghi, U., Pardini, S., Ngu, L.,
et al. (2015). ACTN1-related thrombocytopenia: identification
of novel families for phenotypic characterization. Blood 125,
869–872.
65. Westbury, S.K., Turro, E., Greene, D., Lentaigne, C., Kelly,
A.M., Bariana, T.K., Simeoni, I., Pillois, X., Attwood, A., Austin,
S., et al.; BRIDGE-BPD Consortium (2015). Human phenotype
ontology annotation and cluster analysis to unravel genetic
defects in 707 cases with unexplained bleeding and platelet
disorders. Genome Med. 7, 36.
66. Hamill, K.J., Hiroyasu, S., Colburn, Z.T., Ventrella, R.V., Hop-
kinson, S.B., Skalli, O., and Jones, J.C. (2015). Alpha actinin-
1 regulates cell-matrix adhesion organization in keratinocytes:
consequences for skin cell motility. J. Invest. Dermatol. 135,
1043–1052.
67. Raslova, H., Kauffmann, A., Sekkaı, D., Ripoche, H., Larbret, F.,
Robert, T., Tronik Le Roux, D., Kroemer, G., Debili, N., Dessen,
P., et al. (2007). Interrelation between polyploidization and
The Americ
megakaryocyte differentiation: a gene profiling approach.
Blood 109, 3225–3234.
68. Thon, J.N., Macleod, H., Begonja, A.J., Zhu, J., Lee, K.C., Mo-
gilner, A., Hartwig, J.H., and Italiano, J.E., Jr. (2012). Microtu-
bule and cortical forces determine platelet size during vascular
platelet production. Nat. Commun. 3, 852.
69. Alharbi, R.A., Pettengell, R., Pandha, H.S., and Morgan, R.
(2013). The role of HOX genes in normal hematopoiesis and
acute leukemia. Leukemia 27, 1000–1008.
70. Magnusson, M., Brun, A.C., Miyake, N., Larsson, J., Ehinger,
M., Bjornsson, J.M., Wutz, A., Sigvardsson, M., and Karlsson,
S. (2007). HOXA10 is a critical regulator for hematopoietic
stem cells and erythroid/megakaryocyte development. Blood
109, 3687–3696.
71. Pevny, L., Simon, M.C., Robertson, E., Klein, W.H., Tsai, S.F.,
D’Agati, V., Orkin, S.H., and Costantini, F. (1991). Erythroid dif-
ferentiation inchimaericmiceblockedbya targetedmutation in
the gene for transcription factor GATA-1. Nature 349, 257–260.
72. Shivdasani, R.A., Fujiwara, Y., McDevitt, M.A., and Orkin, S.H.
(1997). A lineage-selective knockout establishes the critical
role of transcription factor GATA-1 in megakaryocyte growth
and platelet development. EMBO J. 16, 3965–3973.
73. Wang, C.C., Su, K.Y., Chen, H.Y., Chang, S.Y., Shen, C.F., Hsieh,
C.H.,Hong,Q.S.,Chiang,C.C.,Chang,G.C., Yu, S.L., andChen,
J.J. (2015).HOXA5inhibitsmetastasisvia regulatingcytoskeletal
remodelling and associates with prolonged survival in non-
small-cell lung carcinoma. PLoS ONE 10, e0124191.
74. Ablain, J., Durand, E.M., Yang, S., Zhou, Y., and Zon, L.I.
(2015). A CRISPR/Cas9 vector system for tissue-specific gene
disruption in zebrafish. Dev. Cell 32, 756–764.
75. Bauer, D.E., Kamran, S.C., Lessard, S., Xu, J., Fujiwara, Y., Lin, C.,
Shao, Z., Canver, M.C., Smith, E.C., Pinello, L., et al. (2013). An
erythroidenhancerofBCL11Asubject togenetic variationdeter-
mines fetal hemoglobin level. Science 342, 253–257.
76. Potter, M.D., Buijs, A., Kreider, B., van Rompaey, L., and Gros-
veld, G.C. (2000). Identification and characterization of a new
human ETS-family transcription factor, TEL2, that is ex-
pressed in hematopoietic tissues and can associate with
TEL1/ETV6. Blood 95, 3341–3348.
77. Gu, X., Shin, B.H., Akbarali, Y., Weiss, A., Boltax, J., Oettgen,
P., and Libermann, T.A. (2001). Tel-2 is a novel transcriptional
repressor related to the Ets factor Tel/ETV-6. J. Biol. Chem.
276, 9421–9436.
78. Wang, Q., Dong, S., Yao, H., Wen, L., Qiu, H., Qin, L., Ma, L.,
and Chen, S. (2014). ETV6 mutation in a cohort of 970 pa-
tients with hematologic malignancies. Haematologica 99,
e176–e178.
79. Zhang, M.Y., Churpek, J.E., Keel, S.B., Walsh, T., Lee, M.K.,
Loeb, K.R., Gulsuner, S., Pritchard, C.C., Sanchez-Bonilla,
M., Delrow, J.J., et al. (2015). Germline ETV6 mutations in fa-
milial thrombocytopenia and hematologic malignancy. Nat.
Genet. 47, 180–185.
80. Noetzli, L., Lo, R.W., Lee-Sherick, A.B., Callaghan, M., Noris,
P., Savoia, A., Rajpurkar, M., Jones, K., Gowan, K., Balduini,
C.L., et al. (2015). Germline mutations in ETV6 are associated
with thrombocytopenia, red cell macrocytosis and predisposi-
tion to lymphoblastic leukemia. Nat. Genet. 47, 535–538.
81. Topka, S., Vijai, J., Walsh, M.F., Jacobs, L., Maria, A., Villano,
D., Gaddam, P., Wu, G., McGee, R.B., Quinn, E., et al.
(2015). Germline ETV6 Mutations Confer Susceptibility to
Acute Lymphoblastic Leukemia and Thrombocytopenia.
PLoS Genet. 11, e1005262.
an Journal of Human Genetics 98, 229–242, February 4, 2016 241
82. Woo, A.J., Wieland, K., Huang, H., Akie, T.E., Piers, T., Kim, J.,
and Cantor, A.B. (2013). Developmental differences in IFN
signaling affect GATA1s-induced megakaryocyte hyperprolif-
eration. J. Clin. Invest. Published online July 1, 2013. http://
dx.doi.org/10.1172/JCI40609.
83. Gekas, C., Rhodes, K.E., Gereige, L.M., Helgadottir, H., Ferrari,
R., Kurdistani, S.K., Montecino-Rodriguez, E., Bassel-Duby, R.,
Olson, E., Krivtsov, A.V., et al. (2009). Mef2C is a lineage-
restricted target of Scl/Tal1 and regulates megakaryopoiesis
and B-cell homeostasis. Blood 113, 3461–3471.
242 The American Journal of Human Genetics 98, 229–242, February
84. Williams, A.L., Jacobs, S.B., Moreno-Macıas, H., Huerta-Cha-
goya, A., Churchhouse, C., Marquez-Luna, C., Garcıa-Ortız,
H., Gomez-Vazquez, M.J., Burtt, N.P., Aguilar-Salinas, C.A.,
et al.; SIGMA Type 2 Diabetes Consortium (2014). Sequence
variants in SLC16A11 are a common risk factor for type 2 dia-
betes in Mexico. Nature 506, 97–101.
85. Reich, D., Patterson, N., Campbell, D., Tandon, A., Mazieres,
S., Ray, N., Parra, M.V., Rojas, W., Duque, C., Mesa, N., et al.
(2012). Reconstructing Native American population history.
Nature 488, 370–374.
4, 2016