Gauging Customer Expectation Over Mobile Cellular Services ...
17
Gauging Customer Expectation Over Mobile Cellular Services In Malaysia Mohd Faizun Mohamad Yazid* *Corresponding author, Senior Lecturer, Business School, University Kuala Lumpur, 1016, Jalan Sultan Ismail, 50250 Kuala Lumpur, Malaysia. Email: [email protected]. Mohd Fikri Ishak Senior Lecturer, Faculty of Business and Management, University Teknologi MARA, Puncak Alam, Selangor, Malaysia. Email: [email protected]. Anis Abd Razak Senior Lecturer, Business School, University Kuala Lumpur, 1016, Jalan Sultan Ismail, 50250 Kuala Lumpur, Malaysia. Aeshah Mohd Ali Business School, University Kuala Lumpur, 1016 Jalan Sultan Ismail, 50250 Kuala Lumpur, Malaysia. Email: [email protected]. Sanusi Abdul Manaf Senior Lecturer, University Kuala Lumpur, 1016, Jalan Sultan Ismail, 50250 Kuala Lumpur, Malaysia. Abstract This study focuses on the consumer experience of telecommunications service quality in Malaysia. Malaysia's penetration rate has gone over 100 percent, meaning that each person in Malaysia has at least one account registered with the telecommunications provider. Telecommunications industry competition is becoming fierce as there is a limited market available to share among the industry players. This study used a quantitative approach, using a questionnaire to collect data through random sampling. One hundred and fifty available respondents received, using SEM-PLS analysis. Results indicate that customers are more concerned with service quality and trust than brand image and price. Brand image and price did not impact consumer loyalty. One of the critical factors is that the facilities and packages
Transcript of Gauging Customer Expectation Over Mobile Cellular Services ...
Gauging Customer Expectation Over Mobile Cellular Services In Malaysia
Mohd Faizun Mohamad Yazid*
*Corresponding author, Senior Lecturer, Business School, University Kuala Lumpur, 1016, Jalan Sultan
Ismail, 50250 Kuala Lumpur, Malaysia. Email: [email protected].
Mohd Fikri Ishak
Senior Lecturer, Faculty of Business and Management, University Teknologi MARA, Puncak Alam,
Selangor, Malaysia. Email: [email protected].
Anis Abd Razak
Senior Lecturer, Business School, University Kuala Lumpur, 1016, Jalan Sultan Ismail, 50250 Kuala
Lumpur, Malaysia.
Aeshah Mohd Ali
Business School, University Kuala Lumpur, 1016 Jalan Sultan Ismail, 50250 Kuala Lumpur, Malaysia.
Email: [email protected].
Sanusi Abdul Manaf
Senior Lecturer, University Kuala Lumpur, 1016, Jalan Sultan Ismail, 50250 Kuala Lumpur, Malaysia.
Abstract
This study focuses on the consumer experience of telecommunications service quality in
Malaysia. Malaysia's penetration rate has gone over 100 percent, meaning that each person in
Malaysia has at least one account registered with the telecommunications provider.
Telecommunications industry competition is becoming fierce as there is a limited market
available to share among the industry players. This study used a quantitative approach, using a
questionnaire to collect data through random sampling. One hundred and fifty available
respondents received, using SEM-PLS analysis. Results indicate that customers are more
concerned with service quality and trust than brand image and price. Brand image and price did
not impact consumer loyalty. One of the critical factors is that the facilities and packages
83 Journal of Information Technology Management, 2021, Vol.13, No.3
provided are approximately the same price ranges for almost similar coverage areas. The service
provider will use the outcome for their ongoing long-term plan.
Keywords: Telecommunication; Trust, Brand Image; Customer Satisfaction; Service Quality.
DOI: http://10.22059/jitm.2021.83115 Document Type: Research Paper University of Tehran, Faculty of Management
SUBMITTED: January 12, 2021 REVISED: March 25, 2021 PUBLISHED: August 31, 2021
Introduction
Telecommunications is important for individuals, organizations, and business. The
telecommunications industry has become a common industry as the chosen telecommunications
service provider needs at least one SIM card for internet data and text and make phone calls
worldwide. The telecommunications industry remained the largest industry today, considering its
role in facilitating everyone's life. (Minarti & Segoro, 2014). This industry is continuously
innovative in every aspect of how consumers can interact with each other, forms of mobile
devices, and different services. (Giovanis et al., 2014). Technology, competitors, consumers, and
devices are continuously and rapidly changing.
In this digital era, a mobile phone is an indispensable device for everyone. Electronic devices
today are more innovative than before in giving a better and more comfortable life for users.
Mobile phones and tablets' capabilities have expanded with telecommunications service
providers (Phong et al., 2018). The role of a telecommunications service provider is to improve
communication for customers. There are wireless and wired communications that provide the
domestic and global exchange of network information electronically. Telecommunications
service providers offer internet data and services to text and make phone calls according to their
customers' needs and demands (Abd-elrahman et al., 2019). For a business that implements an
online system for its products and services, telecommunications service contributes to its
business growth (Hapsari et al., 2016). In Malaysia, numerous telecommunications service
providers compete to gain more customers to use their telecommunications service. Some of
Malaysia's most prominent telecommunications service providers are Celcom, Digi, Maxis, and
Unifi (Al-mutawkkil et al., 2009). These telecommunications service providers provide the same
services with different coverage quality, price range, and customer benefit.
Telecommunications services can boost customer relations and related services. Customers
bring significant prospects and are valuable assets for an organization or a company to generate
revenues and profits (Abd-elrahman et al., 2019). The communication relations between
telecommunications service providers and their existing and prospective customers can
strengthen their brand image and customer trust. Hence, telecommunications service providers
have to make sure that their customers are well-treated and handled to gain customer satisfaction
Gauging Customer Expectation over Mobile Cellular Services in Malaysia 84
(Phong et al., 2018). The customer service department manages telecommunications service
providers' relationships with their customers, where convenient and reliable telecommunications
service must always be available for instant customer satisfaction (Shamsudin, Yazid, et al.,
2020). The ability to connect with others through the Internet is essential for customers of the
telecommunications service providers.
In this era, having access to telecommunications service saves time and cost.
Telecommunications service allows people to interact without distance barriers using a computer,
laptop, or any mobile device through any social media app (e.g., Facebook, WhatsApp, or
WeChat). These social media apps provide an interactive platform for their users to receive voice
notes and make video calls similar to face-to-face interactions. Furthermore, telecommunication
tools have changed how a business interacts with customers (Abd-elrahman et al., 2019).
Customers can connect with the business operators using this technology with the selected
telecommunications service provider's help and even have face-to-face interactions to share their
concerns. Using this platform, an organization can benefit by having loyal customers and good
public relations, as customers would provide positive reviews. An excellent telecommunications
service provider is linked to higher customer satisfaction, attracting more prospective customers
to invest.
Literature Review
Customer Satisfaction
As customers prefer to make deals that offer good services and other benefits, customer
satisfaction has become the most crucial aspect acknowledged by all businesses, companies, or
organizations today (Moghavvemi et al., 2018). Customers' needs must always be prioritized as
their business goal to gain competitive advantages through positive customer reviews of the
products or services and good customer relations. Businesses should prioritize the essential
elements of their management policies (Lau et al., 2019). Most organizations would pursue the
basic principle of "customers come first" in developing their business according to the
characteristics of the targeted community. Moreover, organizations should contribute to better
individual lifestyles and community growth by offering the best service.
Therefore, businesses should focus on the relationship between finance, operation, and
marketing to create brand loyalty with their customers, instead of opting for the conventional
business style (Nguyen et al., 2018). Businesses should consider and generate exclusive relations
with their customers to gain a loyal customer base and promote electronic word of mouth
(EWOM) that contribute to the expansion of their online business. Businesses can also opt for
referral marketing to attract more relevant customers, gain profits, and cover the business costs,
such as offering discounts, rewards, or other special offers to the existing customers to bring in
new customers (Shamsudin, Nayan, et al., 2020b).
85 Journal of Information Technology Management, 2021, Vol.13, No.3
In this modern era, making use of the online market platform and advertising are important
for businesses to promote their products and services, as everyone can access the Internet to
search for the products and services in terms of price, promotion, and others (Eberle et al., 2016).
One of the business strategies to maintain customer satisfaction involves expanding the business
to gain more customers and increase awareness through social media platforms. Facebook,
Instagram, and Twitter are some of the most used platforms. Businesses can advertise their
business and establish their brand in social media by creating and sharing content of their
products and services (Lau et al., 2019). Although this approach may reduce profits in the form
of advertisement cost, it is actually profitable in the long run, as gaining more customers can lead
to more sales. With higher production and lower average cost, these businesses can gain more
profits. Through social media, businesses potentially have consistent sales from the first day of
their social media use. Furthermore, many businesses today actively use social media as a
platform to communicate with their existing and potential customers. Positive customer
satisfaction would raise brand image that create brand identity and positive brand association
(Moghavvemi et al., 2018).
Meanwhile, the quality of advertising can be measured through customer satisfaction.
Advertising plays a significant role in introducing new products or services to the market and
convincing customers to purchase the advertised products or services (Lau et al., 2019). A recent
business strategy is to advertise on the world's largest professional network, LinkedIn (LinkedIn
ads). The steps include creating a campaign (by the manager account), determining business
objectives in terms of creating brand awareness among the social business community, and
launching of the campaign to the targeted audience (Yussoff & Nayan, 2020). This drives
awareness and leads in the world's most viewed professional newsfeed that contribute substantial
impact on the business performance.
Finally, by taking care of customer satisfaction, businesses can maximise their effort to
maintain and improve the quality of their products and services by introducing some special
changes to their facility on the usage of the products or services to make them different from
their competitors (Ahmed et al., 2017; Yilmaz et al., 2018). They can also focus on expanding
their reach to the global market and not limiting themselves to the local market only. This also
allows them to explore new market for their products or services, while retaining the existing
market. In terms of business expansion, organisations can study their customer behaviour
according to their religion, race, and location because customers are more likely to apply their
cultural and religious backgrounds in their daily lifestyle (Hasim et al., 2020). Satisfied customer
also plays an important role in widening the market of the products and services by convincing
potential customers in rural areas to take notice of new products or services.
Service Quality
Service quality is related to the perception of customers on the efficiency of how a product or
Gauging Customer Expectation over Mobile Cellular Services in Malaysia 86
service is delivered with respect to the expectations of customers. High service quality reflects a
business that meets or exceeds the expectations of customers when they use the product or
service (Hasim et al., 2019). Generally, service quality can be observed through customer
feedback of the product or service received and the delivery system used for the business
operation that includes shipping or transport services (Ruzanna et al., 2020). Through customer
feedback, organisations can identify satisfied customers and potential customers as well as the
improvements required to provide better products or services.
For better customer experience, organisations that apply activities of selling and buying must
provide easy accessibility for customers to acquire the products or services, such as convenient
order and booking services (Shamsudin, Nayan, et al., 2020c). Organisations can make use of the
customer relationship management (CRM) system that involves easier access and management
of highly important data when they take orders and bookings from customers through phone or
online platform, including social media (e.g. Facebook, Instagram, Twitter, or website). This
approach also saves time and cost for customers. When organisations are adequately focused on
the service quality of their products or services, their business performance and opportunities can
be maximised—for examples, by upselling (encourage customers to purchase a higher priced
product or service) and cross-selling (encourage customers to purchase related or receive
complementary product or service).
Trust
Trust is very important in business when customers are aware of the products or services offered
and potential customers become more familiar with the products or services. Loyal customers
can easily recognise the brand or company (Lindberg-Repo & Grönroos, 1999). There are many
ways to achieve customer trust. Advertising is an effective way to gain more customers. Through
advertising, customers gain the impression of good product and service quality, which prompt
them to purchase. The broadcast media is a popular advertising platform that offers creative
opportunities and can reach a wide range of audience. Television and radio are two examples of
traditional broadcast media that have been long used for advertising purpose.
Besides that, organisations establish their own customer service centre to assist their
customers who encounter any problems and to provide effective solutions based on the history
records with these customers (Shamsudin, Rasol, et al., 2020). Less time is wasted as they do not
need to undergo the entire process of gathering data from customers during the service resolution
process. In addition, service and sales employees in the customer service department are
responsible to enhance communication with customers (Shamsudin, Ramle, et al., 2020). They
can gather the profile of their customers in terms of their purchase history and notes of how to
improve the services provided to improve customer relationship and communication efficiency
(Zhao et al., 2019). The customer service department has specific programmes that allow their
business operation to have an efficient schedule automated by follow-up communication with the
87 Journal of Information Technology Management, 2021, Vol.13, No.3
customers (through phone calls or emails). After all, customers should feel secured and
comfortable with the business or company at this stage through the customer service department,
which eventually lead to customer trust.
Brand Image
The biggest advantage of having a brand image is that it helps to create strong customer
awareness of the products and services offered in terms of price, promotion, and others. It is not
easy to create a brand without the influence of customers (Shamsudin, Hassan, et al., 2020;
Shamsudin & Hassim, 2020). For that, the use of advertising is the key to create long-lasting
brand image, acquire customer loyalty, introduce a new product or service in the market, and
persuade potential customers to purchase a product or service (Liu et al., 2017). Through brand
image, customers would know about the products and services offered. Organisations
continuously make effort to maintain and improve the quality of their products and services by
upgrading the products and services for competitive advantages. In order to gain a positive,
strong brand image, it is necessary for an organisation to take measures on product strategy, such
as product design (e.g. product packaging) and company logo, and design strategy, such as
customised or standardisation in upgrading their current method (Hafez, 2018). Through design
strategy, organisations can take measure to provide products and services that are customised for
their customers who demand rich and unique features and cannot be copied by competitors (e.g.
copyright, trademark, and patent).
Price
Price refers to the amount that a customer must pay to obtain a product or service. In order to
determine the best price, organisations must take into account the possible discounts available for
customers, allowances, payment period, and credit terms (Hassan et al., 2020; Shamsudin,
Nayan, et al., 2020a). Pricing is an important marketing factor given its influence on the profit
gained; getting the right price can bring sufficient profit. Meanwhile, when it comes to the third-
party business operators like shopping malls, supermarkets, or hypermarkets, there should be a
product pricing control, where all customers, regardless of their income level, are provided the
best and affordable price (Shamsudin, Azmi, et al., 2020). In the case of cross-selling, free
products are offered to customers based on their previous purchase. Meanwhile, upselling
involves offering premium products of the same product line to customers (Konuk, 2015). With
the recent technology (e.g. CRM system), both approaches can be effectively achieved based on
the available data, which can increase sales productivity. As a result, a highly targeted list of
previous customers can be generated for the business operation and campaign.
Methdology
This study aimed to assess the influence of service quality, brand image, trust, and price on
customer satisfaction among mobile telecommunications service customers in Malaysia. For that,
Gauging Customer Expectation over Mobile Cellular Services in Malaysia 88
an online survey link was developed using Google forms and distributed via Facebook and
WhatsApp. The survey involved more than 150 randomly selected Malaysian customers of age
13 years and above across the country. They were required to indicate the level of their
satisfaction towards their current telecommunications service provider. The developed
questionnaire consists of two parts: (1) Part A focuses on the demographic information of
respondents, which include gender, age, education level, income level, type of brand for the
mobile telecommunications service provider, and many more; (2) Part B consists of dependent
and independent variables, which are customer satisfaction, service quality, brand image, trust,
and price. For the survey, a five-point Likert scale was applied with the endpoints of "strongly
disagree" (1) and "strongly agree" (5). This scale was selected because it was deemed easier for
the respondents to understand and select the option that best reflects their opinion for each
question.
Results and Discussion
Analysis of the Research Model with the Method Partial Least Square (PLS)
This study uses the PLS analysis technique with the SmartPLS Program. From the results of data
processing, PLS evaluating the structural equation model can do analysis. In this evaluation,
there are two basic evaluations. First, evaluating the measurement model (outer model) to find
out the validity and reliability of indicators that measure latent variables; the instrument validity
and reliability test criteria in this study refer to discriminant validity, convergent validity, and
composite reliability. Second, assess the inner model or structural model to see the relationship
between constructs, the significance value and the R-square of the research model. Testing Inner
model in PLS analysis is done through bootstrap resampling.
Evaluation of the Measurement Model
Evaluation of the measurement model or the outer model is to determine the measurement scales
and construct used in the hypothesized model is reliable and valid. It is an important stage to
determine that the indicators and construct associated in the study is fits for full scales analyses
that on the structure model assessment is in line with the data and theory underpinned. Following
the standard adopted assessment for this stage of outer model is to carry out by assessing the
internal consistency, convergent validity and discriminant validity.
Discriminant Validity
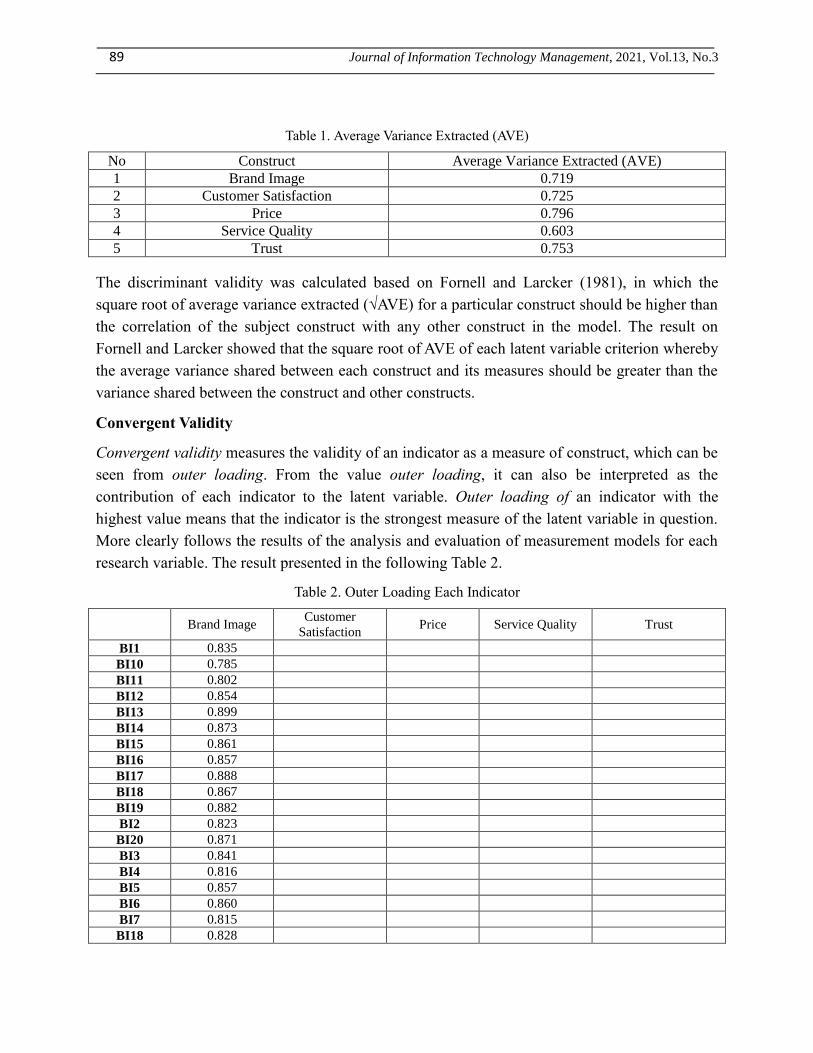
Table 1 show that the value of average variance extracted (AVE) is more than 0.5. According to
Hair, Sarstedt, & Ringle (2017) the average variance extracted (AVE) of each latent construct
should 0.5 or higher. All constructs showed a satisfactory which explained more than 50% of
variances of its items that ranges from 0.603 to 0.796.
89 Journal of Information Technology Management, 2021, Vol.13, No.3
Table 1. Average Variance Extracted (AVE)
No Construct Average Variance Extracted (AVE)
1 Brand Image 0.719
2 Customer Satisfaction 0.725
3 Price 0.796
4 Service Quality 0.603
5 Trust 0.753
The discriminant validity was calculated based on Fornell and Larcker (1981), in which the
square root of average variance extracted (√AVE) for a particular construct should be higher than
the correlation of the subject construct with any other construct in the model. The result on
Fornell and Larcker showed that the square root of AVE of each latent variable criterion whereby
the average variance shared between each construct and its measures should be greater than the
variance shared between the construct and other constructs.
Convergent Validity
Convergent validity measures the validity of an indicator as a measure of construct, which can be
seen from outer loading. From the value outer loading, it can also be interpreted as the
contribution of each indicator to the latent variable. Outer loading of an indicator with the
highest value means that the indicator is the strongest measure of the latent variable in question.
More clearly follows the results of the analysis and evaluation of measurement models for each
research variable. The result presented in the following Table 2.
Table 2. Outer Loading Each Indicator
Brand Image Customer
Satisfaction Price Service Quality Trust
BI1 0.835
BI10 0.785
BI11 0.802
BI12 0.854
BI13 0.899
BI14 0.873
BI15 0.861
BI16 0.857
BI17 0.888
BI18 0.867
BI19 0.882
BI2 0.823
BI20 0.871
BI3 0.841
BI4 0.816
BI5 0.857
BI6 0.860
BI7 0.815
BI18 0.828
Gauging Customer Expectation over Mobile Cellular Services in Malaysia 90
BI19 0.838
CS1 0.798
CS2 0.849
CS3 0.838
CS4 0.834
CS5 0.871
CS6 0.881
CS7 0.889
PR1 0.885
PR2 0.887
PR3 0.891
PR4 0.906
SQ1 0.694
SQ10 0.822
SQ11 0.791
SQ12 0.870
SQ13 0.782
SQ14 0.821
SQ15 0.667
SQ16 0.738
SQ17 0.738
SQ18 0.793
SQ19 0.822
SQ2 0.788
SQ20 0.766
SQ21 0.795
SQ22 0.731
SQ3 0.693
SQ4 0.755
SQ5 0.804
SQ6 0.767
SQ7 0.785
SQ8 0.815
SQ9 0.818
TR1 0.890
TR2 0.869
TR3 0.854
TR4 0.844
TR5 0.880
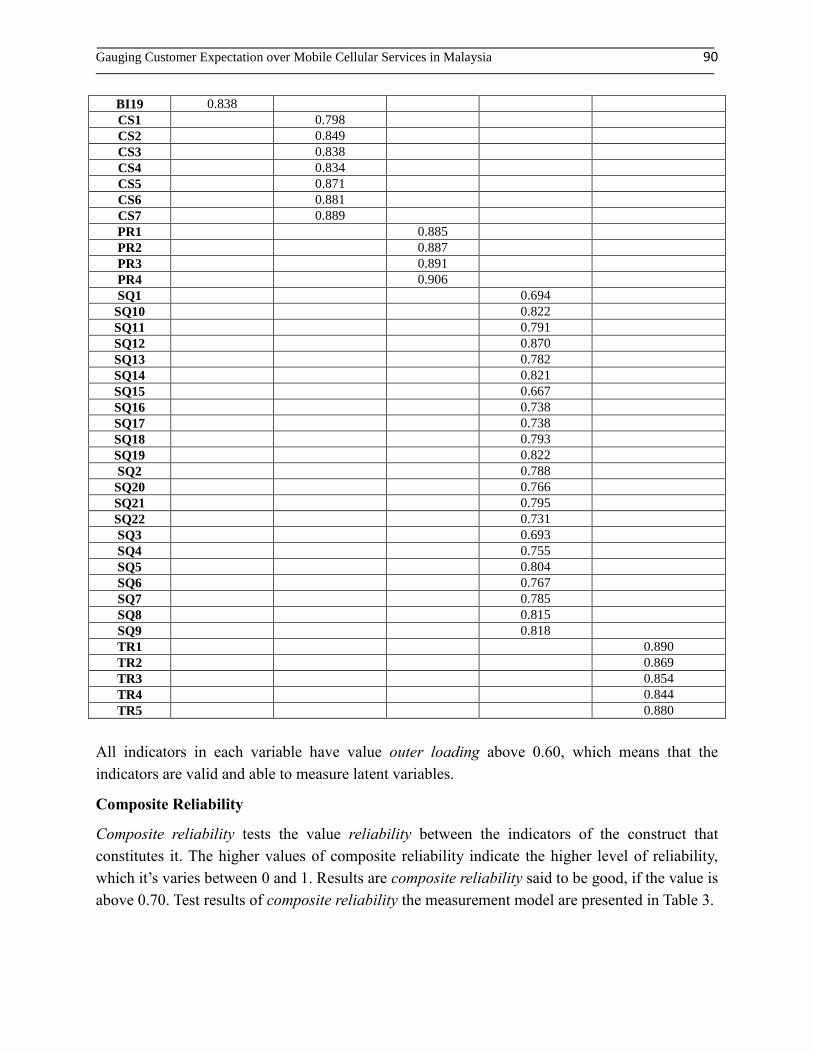
All indicators in each variable have value outer loading above 0.60, which means that the
indicators are valid and able to measure latent variables.
Composite Reliability
Composite reliability tests the value reliability between the indicators of the construct that
constitutes it. The higher values of composite reliability indicate the higher level of reliability,
which it’s varies between 0 and 1. Results are composite reliability said to be good, if the value is
above 0.70. Test results of composite reliability the measurement model are presented in Table 3.
91 Journal of Information Technology Management, 2021, Vol.13, No.3
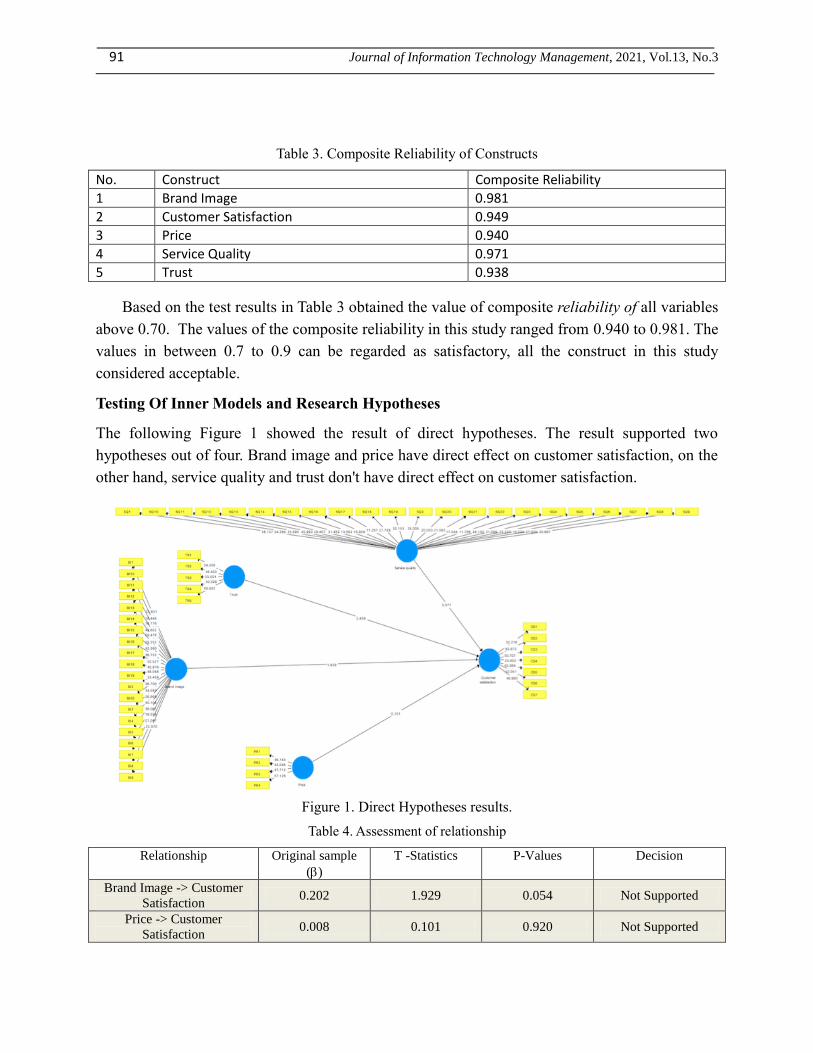
Table 3. Composite Reliability of Constructs
No. Construct Composite Reliability
1 Brand Image 0.981
2 Customer Satisfaction 0.949
3 Price 0.940
4 Service Quality 0.971
5 Trust 0.938
Based on the test results in Table 3 obtained the value of composite reliability of all variables
above 0.70. The values of the composite reliability in this study ranged from 0.940 to 0.981. The
values in between 0.7 to 0.9 can be regarded as satisfactory, all the construct in this study
considered acceptable.
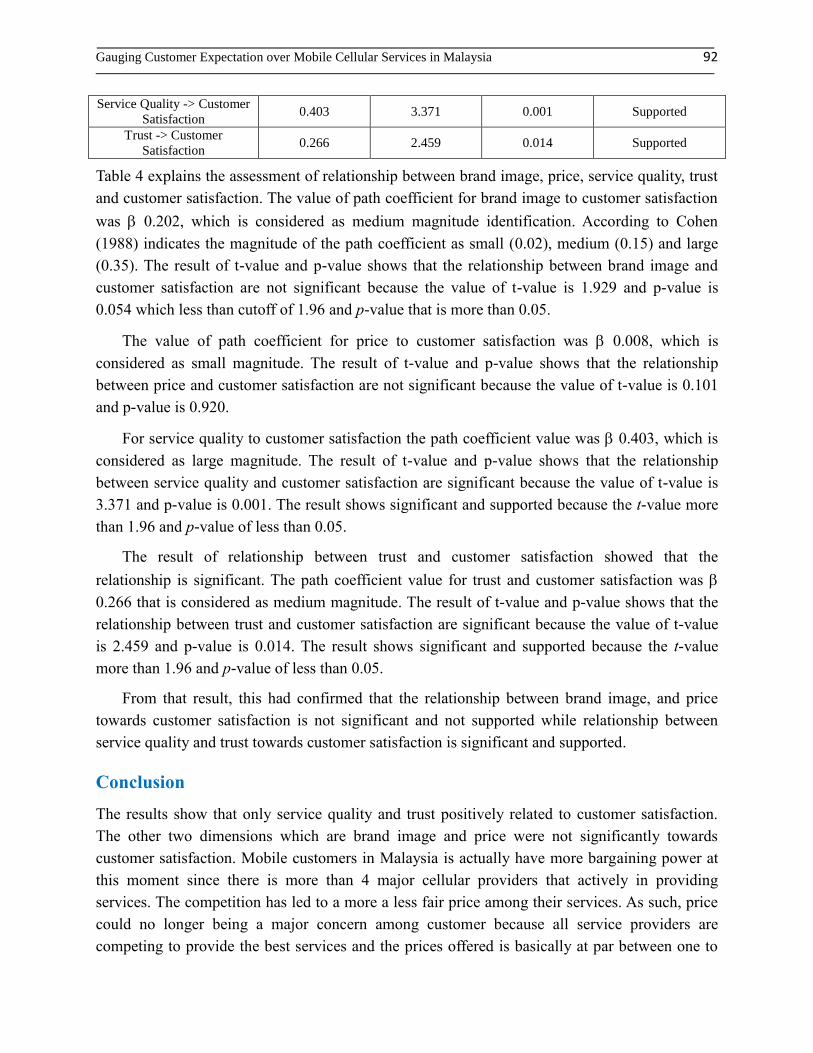
Testing Of Inner Models and Research Hypotheses
The following Figure 1 showed the result of direct hypotheses. The result supported two
hypotheses out of four. Brand image and price have direct effect on customer satisfaction, on the
other hand, service quality and trust don't have direct effect on customer satisfaction.
Figure 1. Direct Hypotheses results.
Table 4. Assessment of relationship
Relationship Original sample
()
T -Statistics P-Values Decision
Brand Image -> Customer
Satisfaction 0.202 1.929 0.054 Not Supported
Price -> Customer
Satisfaction 0.008 0.101 0.920 Not Supported
Gauging Customer Expectation over Mobile Cellular Services in Malaysia 92
Service Quality -> Customer
Satisfaction 0.403 3.371 0.001 Supported
Trust -> Customer
Satisfaction 0.266 2.459 0.014 Supported
Table 4 explains the assessment of relationship between brand image, price, service quality, trust
and customer satisfaction. The value of path coefficient for brand image to customer satisfaction
was 0.202, which is considered as medium magnitude identification. According to Cohen
(1988) indicates the magnitude of the path coefficient as small (0.02), medium (0.15) and large
(0.35). The result of t-value and p-value shows that the relationship between brand image and
customer satisfaction are not significant because the value of t-value is 1.929 and p-value is
0.054 which less than cutoff of 1.96 and p-value that is more than 0.05.
The value of path coefficient for price to customer satisfaction was 0.008, which is
considered as small magnitude. The result of t-value and p-value shows that the relationship
between price and customer satisfaction are not significant because the value of t-value is 0.101
and p-value is 0.920.
For service quality to customer satisfaction the path coefficient value was 0.403, which is
considered as large magnitude. The result of t-value and p-value shows that the relationship
between service quality and customer satisfaction are significant because the value of t-value is
3.371 and p-value is 0.001. The result shows significant and supported because the t-value more
than 1.96 and p-value of less than 0.05.
The result of relationship between trust and customer satisfaction showed that the
relationship is significant. The path coefficient value for trust and customer satisfaction was
0.266 that is considered as medium magnitude. The result of t-value and p-value shows that the
relationship between trust and customer satisfaction are significant because the value of t-value
is 2.459 and p-value is 0.014. The result shows significant and supported because the t-value
more than 1.96 and p-value of less than 0.05.
From that result, this had confirmed that the relationship between brand image, and price
towards customer satisfaction is not significant and not supported while relationship between
service quality and trust towards customer satisfaction is significant and supported.
Conclusion
The results show that only service quality and trust positively related to customer satisfaction.
The other two dimensions which are brand image and price were not significantly towards
customer satisfaction. Mobile customers in Malaysia is actually have more bargaining power at
this moment since there is more than 4 major cellular providers that actively in providing
services. The competition has led to a more a less fair price among their services. As such, price
could no longer being a major concern among customer because all service providers are
competing to provide the best services and the prices offered is basically at par between one to
93 Journal of Information Technology Management, 2021, Vol.13, No.3
another.
At this moment, all service providers have a very strong brand positioning in Malaysia. Each
of them trying hard to win the customer choice through many creative advertisements and
attractive packaging. Most of them have been established their services more than 10 years and
as such there could be no issues in terms of branding. Customer is more concerns about the
service quality rather than the brand image. Service quality have been reported as positively
towards customer satisfaction. Indirectly it means that service provider must not take for granted
of their prominent branding and long establishment as a factor to attract customer to retain in
their services. Most of customer stay longer in the lifecycle because of trust. The trust is so
important that may blocked the competitor from pinching them through any acquisition
campaign. Based on the results, service provider should take notes on the customer expectations
and requirements in order to lead and sustain in the industry.
Conflict of interest
The authors declare no potential conflict of interest regarding the publication of this work. In
addition, the ethical issues including plagiarism, informed consent, misconduct, data fabrication
and, or falsification, double publication and, or submission, and redundancy have been
completely witnessed by the authors.
Funding The author(s) received no financial support for the research, authorship, and/or publication of
this article.
References
Abd-elrahman, A. H., Hassan, S. A., El-borsaly, A. A., & Hafez, E. A. (2019). A critical review of
alternative measures of telecommunications service quality. https://doi.org/10.1108/IJQSS-08-2018-
0066
Ahmed, S., Tarique, K. M., & Arif, I. (2017). Service quality, patient satisfaction and loyalty in the
Bangladesh healthcare sector. International Journal of Health Care Quality Assurance, 30(5), 477–
488. https://doi.org/10.1108/IJHCQA-01-2017-0004
Al-mutawkkil, A., Heshmati, A., & Hwang, J. (2009). Development of telecommunication and
broadcasting infrastructure indices at the global level. Telecommunications Policy, 33(3–4), 176–
199. https://doi.org/10.1016/j.telpol.2008.12.008
Eberle, L., Milan, G. S., & Dorion, E. (2016). Service quality dimensions and customer satisfaction in a
Brazilian university context. Benchmarking, 23(7), 1697–1716. https://doi.org/10.1108/BIJ-09-
2014-0089
Gauging Customer Expectation over Mobile Cellular Services in Malaysia 94
Giovanis, A. N., Zondiros, D., & Tomaras, P. (2014). The Antecedents of Customer Loyalty for
Broadband Services: The Role of Service Quality, Emotional Satisfaction and Corporate Image.
Procedia - Social and Behavioral Sciences, 148, 236–244.
https://doi.org/10.1016/j.sbspro.2014.07.039
Hafez, M. (2018). Measuring the impact of corporate social responsibility practices on brand equity in the
banking industry in Bangladesh: The mediating effect of corporate image and brand awareness.
International Journal of Bank Marketing, 36(5), 806–822. https://doi.org/10.1108/IJBM-04-2017-
0072
Hair, J., Sarstedt, M., & Ringle, C. M. (2017). Partial Least Squares Structural Equation Modeling (Issue
September, pp. 2–41). https://doi.org/10.1007/978-3-319-05542-8
Hapsari, R., Clemes, M., & Dean, D. (2016). The Mediating Role of Perceived Value on the Relationship
between Service Quality and Customer Satisfaction: Evidence from Indonesian Airline Passengers.
Procedia Economics and Finance, 35(October 2015), 388–395. https://doi.org/10.1016/s2212-
5671(16)00048-4
Hasim, M. A., Hassan, S., Ishak, M. F., & Razak, A. A. (2020). Factors influencing gen-Y in Malaysia to
purchase impulsively: A mediating effect of perceived enjoyment. International Journal of
Innovation, Creativity and Change, 11(5), 385–396.
Hasim, M. A., Ishak, M. F., & Hassim, A. A. (2019). The relationship between online shopping
environments, sales promotions, website quality, and impulsive buying behaviour: A structural
equation modelling approach. International Journal of Innovation, Creativity and Change, 6(9),
215–230.
Hassan, S., Shamsudin, M. F., Hasim, M. A., Mustapha, I., Zakaria, M. H., Daril, M. A. M., & Jaafar, J.
(2020). Investigation on mediating role of corporate image of university on the link between service
quality and student loyalty. Journal of Critical Reviews, 7(8), 117–121.
https://doi.org/10.31838/jcr.07.08.24
Konuk, F. A. (2015). The effects of price consciousness and sale proneness on purchase intention towards
expiration date-based priced perishable foods. British Food Journal, 117(2), 793–804.
https://doi.org/10.1108/BFJ-10-2013-0305
Lau, T., Cheung, M. L., Pires, G. D., & Chan, C. (2019). Customer satisfaction with sommelier services
of upscale Chinese restaurants in Hong Kong. International Journal of Wine Business Research,
ahead-of-p(ahead-of-print). https://doi.org/10.1108/ijwbr-10-2018-0060
Lindberg-Repo, K., & Grönroos, C. (1999). Word-of-Mouth Referrals in the Domain of Relationship
Marketing. Australasian Marketing Journal (AMJ), 7(1), 109–117. https://doi.org/10.1016/s1441-
3582(99)70208-9
Liu, M. T., Wong, I. K. A., Tseng, T. H., Chang, A. W. Y., & Phau, I. (2017). Applying consumer-based
brand equity in luxury hotel branding. Journal of Business Research.
https://doi.org/10.1016/j.jbusres.2017.06.014
Minarti, S. N., & Segoro, W. (2014). The Influence of Customer Satisfaction, Switching Cost and Trusts
95 Journal of Information Technology Management, 2021, Vol.13, No.3
in a Brand on Customer Loyalty – The Survey on Student as im3 Users in Depok, Indonesia.
Procedia - Social and Behavioral Sciences, 143, 1015–1019.
https://doi.org/10.1016/j.sbspro.2014.07.546
Moghavvemi, S., Lee, S. T. S. P., & Lee, S. T. S. P. (2018). Perceived overall service quality and customer
satisfaction: A comparative analysis between local and foreign banks in Malaysia. International
Journal of Bank Marketing, 36(5), 908–930. https://doi.org/10.1108/IJBM-06-2017-0114
Nguyen, Q., Nisar, T. M., Knox, D., & Prabhakar, G. P. (2018). Understanding customer satisfaction in
the UK quick service restaurant industry: The influence of the tangible attributes of perceived
service quality. British Food Journal, 120(6), 1207–1222. https://doi.org/10.1108/BFJ-08-2017-
0449
Phong, N. D., Khoi, N. H., & Nhat-Hanh Le, A. (2018). Factors affecting mobile shopping: a Vietnamese
perspective. Journal of Asian Business and Economic Studies, 25(2), 186–205.
https://doi.org/10.1108/jabes-05-2018-0012
Ruzanna, A., Baharin, K., & Nayan, S. (2020). Make a customer , not a sale : Review on customer trust.
Journal of Undergraduate Social Science and Technology, 2(2), 2015–2019.
Afif, M., Razak, A., & Nayan, S. (2020). The price of customer satisfaction. Journal of Undergraduate
Social Science and Technology, 2(2).
Amirul, M., Islaini, A., & Nayan, S. (2020). The Role of Price in the Marketing Mix. Journal of
Undergraduate Social Science and Technology, 2(2), 1–3.
Bachok, S., Osman, M. M., & Ponrahono, Z. (2014). Passenger’s Aspiration Towards Sustainable Public
Transportation System: Kerian District, Perak, Malaysia. Procedia - Social and Behavioral Sciences.
https://doi.org/10.1016/j.sbspro.2014.10.088
Berry, L. L., & Parasuraman, A. (1992). Prescriptions for a service quality revolution in America.
Organizational Dynamics, 20(4), 5–15. https://doi.org/10.1016/0090-2616(92)90071-T
Berry, L. L., Zeithaml, V. A., & Parasuraman, A. (1985). Quality counts in services, too. Business
Horizons, 28(3), 44–52. https://doi.org/10.1016/0007-6813(85)90008-4
Chee, W. L., & Fernandez, J. L. (2013). Factors that Influence the Choice of Mode of Transport in
Penang: A Preliminary Analysis. Procedia - Social and Behavioral Sciences.
https://doi.org/10.1016/j.sbspro.2013.08.409
Chen, P. T., & Hu, H. H. (2010). How determinant attributes of service quality influence customer-
perceived value: An empirical investigation of the Australian coffee outlet industry. International
Journal of Contemporary Hospitality Management, 22(4), 535–551.
https://doi.org/10.1108/09596111011042730
Famiyeh, S., Asante-Darko, D., & Kwarteng, A. (2018). Service quality, customer satisfaction, and loyalty
in the banking sector: The moderating role of organizational culture. International Journal of Quality
and Reliability Management, 35(8), 1546–1567. https://doi.org/10.1108/IJQRM-01-2017-0008
Hair, J., Sarstedt, M., & Ringle, C. M. (2017). Partial Least Squares Structural Equation Modeling (Issue
Gauging Customer Expectation over Mobile Cellular Services in Malaysia 96
September, pp. 2–41). https://doi.org/10.1007/978-3-319-05542-8
Hamzah, Z. L., Lee, S. P., & Moghavvemi, S. (2017). Elucidating perceived overall service quality in
retail banking. International Journal of Bank Marketing, 35(5), 781–804.
https://doi.org/10.1108/IJBM-12-2015-0204
Ilyas, N. A., & Nayan, S. (2020). Advertisement for growing business. Journal of Undergraduate Social
Science and Technology, 2(2).
Izarul, S., Syed, H., & Nayan, S. (2020). WOW Your Customers : Tips to Retain Customers. Journal of
Undergraduate Social Science and Technology, 2(2), 2–5.
Janahi, M. A., & Al Mubarak, M. M. S. (2017). The impact of customer service quality on customer
satisfaction in Islamic banking. Journal of Islamic Marketing, 8(4), 595–604.
https://doi.org/10.1108/JIMA-07-2015-0049
Kaffashi, S., Shamsudin, M. N., Clark, M. S., Sidique, S. F., Bazrbachi, A., Radam, A., Adam, S. U., &
Rahim, K. A. (2016). Are Malaysians eager to use their cars less? Forecasting mode choice
behaviors under new policies. Land Use Policy. https://doi.org/10.1016/j.landusepol.2016.05.005
Khamis, F. M., & AbRashid, R. (2018). Service quality and customer’s satisfaction in Tanzania’s Islamic
banks: A case study at People’s Bank of Zanzibar (PBZ). Journal of Islamic Marketing, 9(4), 884–
900. https://doi.org/10.1108/JIMA-09-2016-0068
Khoo, H. L., & Ong, G. P. (2015). Understanding Sustainable Transport Acceptance Behavior: A Case
Study of Klang Valley, Malaysia. International Journal of Sustainable Transportation.
https://doi.org/10.1080/15568318.2012.757401
Kim, S. H., & Lee, S. (Ally). (2017). Promoting customers’ involvement with service brands: evidence
from coffee shop customers. Journal of Services Marketing, 31(7), 733–744.
https://doi.org/10.1108/JSM-03-2016-0133
Moghavvemi, S., Lee, S. T. S. P., & Lee, S. T. S. P. (2018). Perceived overall service quality and customer
satisfaction: A comparative analysis between local and foreign banks in Malaysia. International
Journal of Bank Marketing, 36(5), 908–930. https://doi.org/10.1108/IJBM-06-2017-0114
Nguyen, Q., Nisar, T. M., Knox, D., & Prabhakar, G. P. (2018). Understanding customer satisfaction in
the UK quick service restaurant industry: The influence of the tangible attributes of perceived
service quality. British Food Journal, 120(6), 1207–1222. https://doi.org/10.1108/BFJ-08-2017-0449
Nur, W., Wan, S., Tajuddin, A., & Nayan, S. (2020). Rising customer satisfaction. Journal of
Undergraduate Social Science and Technology, 2(2).
Oliver, R. L. (1993). Cognitive, Affective, and Attribute Bases of the Satisfaction Response. Journal of
Consumer Research, 20(3), 418. https://doi.org/10.1086/209358
Parasuraman, A. A., Zeithaml, V. A., & Berry, L. L. (1991). Refinement and reassessment of the
SERVQUAL instrument. Journal of Retailing, 67(4), 420–450.
Parasuraman, A., Berry, L. L., & Zeithaml, V. A. (1993). More on improving service quality
measurement. Journal of Retailing, 69(1), 140–147. https://doi.org/10.1016/S0022-4359(05)80007-7
97 Journal of Information Technology Management, 2021, Vol.13, No.3
Rosli, N., & Nayan, S. (2020). Why Customer First ? Journal of Undergraduate Social Science and
Technology, 2(2), 2018–2021.
Shafiq, A., Mostafiz, M. I., & Taniguchi, M. (2019). Using SERVQUAL to determine Generation Y’s
satisfaction towards hoteling industry in Malaysia. Journal of Tourism Futures, 5(1), 62–74.
https://doi.org/10.1108/JTF-01-2018-0004
Shamsudin, M. F., Azmi, N. A., Nayan, S., Esa, S. A., & Kadir, B. (2020). Service quality of mobile
telecommunications service. Journal of Critical Reviews, 7(19), 628–636.
Shamsudin, M. F., Azuwan, S. A., Nayan, S., Esa, S. A., & Kadir, B. (2021). Evaluating factors that lead
to customer satisfaction in e-wallet. Journal of Critical Reviews, 7(19), 649–659.
Shamsudin, M. F., Hassan, S., Ishak, M. F., & Ahmad, Z. (2020). Study of purchase intention towards
skin care products based on brand awareness and brand association. Journal of Critical Reviews,
7(16), 990–996. https://doi.org/10.31838/jcr.07.16.127
Shamsudin, M. F., & Hassim, A. A. (2020). Mediating role of organizational innovation on market
orientation and business performance: SEM-AMOS approach. International Journal of Advanced
Science and Technology, 29(2), 3607–3613.
Shamsudin, M. F., Ishak, M. F., Ahmad, A. H., & Hassan, S. (2020). Market orientation and customer
engagement towards customer satisfaction in banking industry. Journal of Critical Reviews, 7(16),
966–974. https://doi.org/10.31838/jcr.07.16.124
Shamsudin, M. F., Johari, N., Nayan, S., Esa, S. A., & Kadir, B. (2020). The influence of service quality ,
brand image , trust , and price on customer satisfaction : Case of airline services. Journal of Critical
Reviews, 7(19), 620–627.
Shamsudin, M. F., Nayan, S., Ishak, M. F., Esa, S. A., & Hassan, S. (2020a). Customer loyalty in the fast
food restaurants : Case of Gen Z. Journal of Critical Reviews, 7(19), 684–692.
Shamsudin, M. F., Nayan, S., Ishak, M. F., Esa, S. A., & Hassan, S. (2020b). Food quality and tourist
satisfaction in tioman island. Journal of Critical Reviews, 7(19), 693–699.
Shamsudin, M. F., Nayan, S., Ishak, M. F., Esa, S. A., & Hassan, S. (2020c). Measuring the employee
interactions towards customer satisfaction in langkawi island hopping services. Journal of Critical
Reviews, 7(19), 668–676.
Shamsudin, M. F., Nayan, S., Ishak, M. F., Esa, S. A., & Hassan, S. (2020d). Role of price perceptions
towards customer satisfaction. Journal of Critical Reviews, 7(19), 677–683.
Shamsudin, M. F., Nayan, S., Ishak, M. F., Esa, S. A., & Hassan, S. (2020e). The consequence of food
quality and atmosphere in fast food towards. Journal of Critical Reviews, 7(19), 660–667.
Shamsudin, M. F., Ramle, N. H., Nayan, S., & Esa, S. A. (2020). Understanding customer expectation in
facial treatment services in Malaysia. Journal of Critical Reviews, 7(19), 637–648.
Shamsudin, M. F., Rasol, N. F., Nayan, S., Esa, S. A., & Kadir, B. (2020). The effect of service quality on
customer satisfaction towards Myrapid bus services. Journal of Critical Reviews, 10(9), 2011–2020.
https://doi.org/10.5267/j.msl.2020.2.011
Gauging Customer Expectation over Mobile Cellular Services in Malaysia 98
Shamsudin, M. F., Yazid, M. F. M., Hasan, S., & Kadir, B. (2020). Review on service quality in fast food
restaurant. Customer satisfaction as mediator. Journal of Critical Reviews, 7(16), 997–1006.
https://doi.org/10.31838/jcr.07.16.128
Yilmaz, V., Ari, E., & Gürbüz, H. (2018). Investigating the relationship between service quality
dimensions, customer satisfaction and loyalty in Turkish banking sector: An application of structural
equation model. International Journal of Bank Marketing, 36(3), 423–440.
https://doi.org/10.1108/IJBM-02-2017-0037
Yussoff, N. M., & Nayan, S. (2020). Review on customer satisfaction. Journal of Undergraduate Social
Science and Technology, 2(2).
Zhao, L., Lee, S. H., & Copeland, L. R. (2019). Social media and Chinese consumers’ environmentally
sustainable apparel purchase intentions. Asia Pacific Journal of Marketing and Logistics, 31(4),
855–874. https://doi.org/10.1108/APJML-08-2017-0183
Bibliographic information of this paper for citing:
Mohamad Yazid, M.F.; Ishak, M.F.; Abd Razak, A.; Mohd Ali, A.; Abdul Manaf, S. (2021). Gauging Customer Expectation over Mobile Cellular Services in Malaysia. Journal of
Information Technology Management, 13(3), 82-98.
Copyright © 2021, Mohd Faizun Mohamad Yazid, Mohd Fikri Ishak, Anis Abd Razak, Aeshah Mohd Ali,
Sanusi Abdul Manaf