FY2011.3 Financial Results Presentation1991.10~ 2017.3 1991.10~ 2017.3 1991.10~ 2051.9 Japan...
47
FY2011.3 Financial Results Presentation April 28, 2011 East Japan Railway Company
Transcript of FY2011.3 Financial Results Presentation1991.10~ 2017.3 1991.10~ 2017.3 1991.10~ 2051.9 Japan...
FY2011.3 Financial Results Presentation
April 28, 2011East Japan Railway Company
2
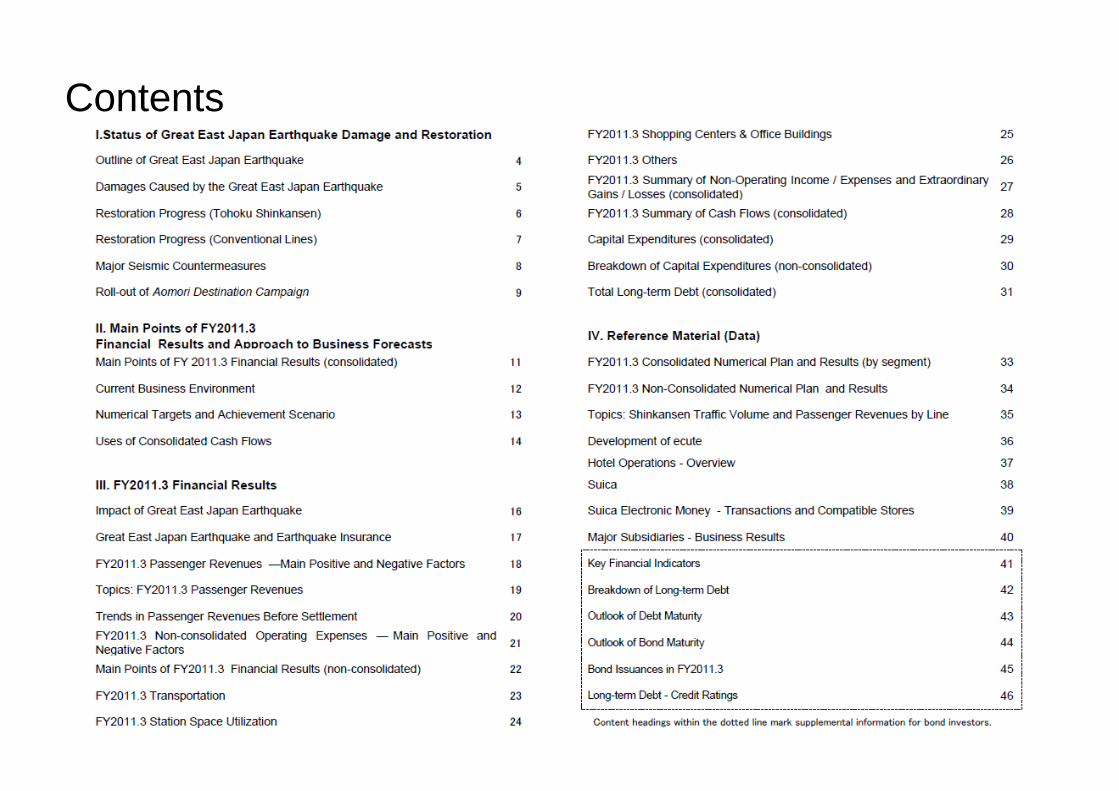
Contents
I. Status of Great East Japan Earthquake Damage and Restoration
4
Outline of Great East Japan Earthquake
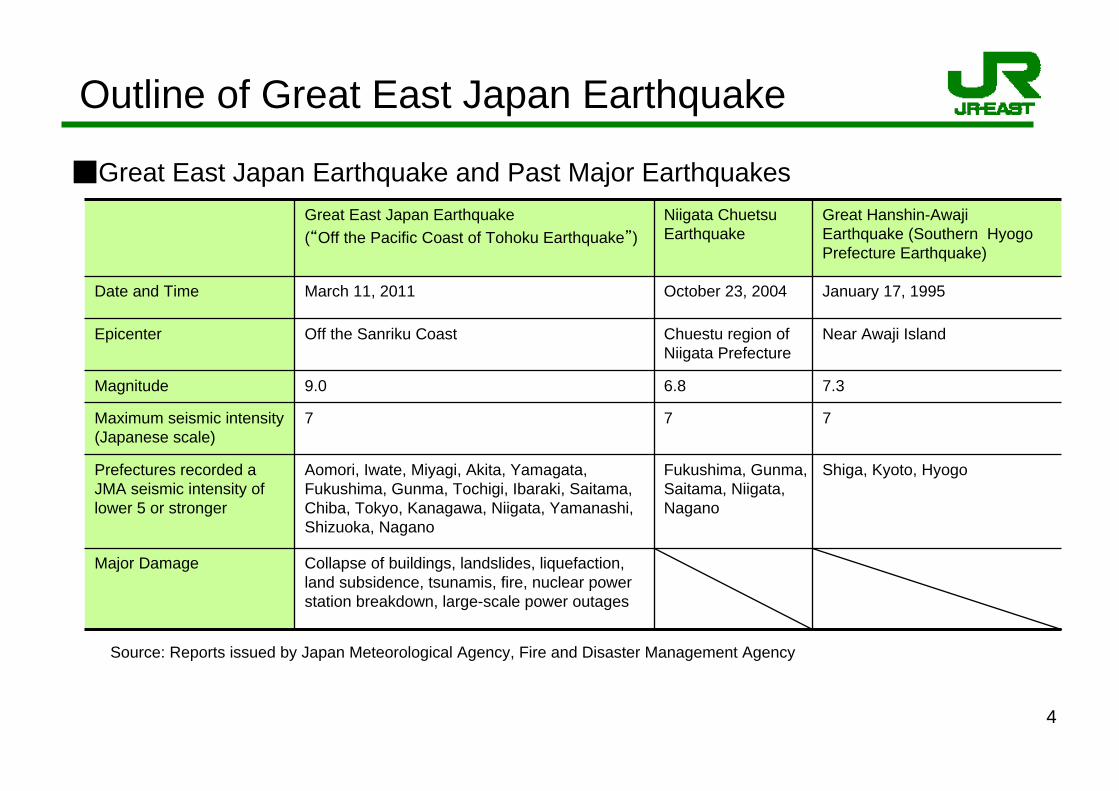
Shiga, Kyoto, HyogoFukushima, Gunma, Saitama, Niigata, Nagano
Aomori, Iwate, Miyagi, Akita, Yamagata, Fukushima, Gunma, Tochigi, Ibaraki, Saitama, Chiba, Tokyo, Kanagawa, Niigata, Yamanashi, Shizuoka, Nagano
Prefectures recorded a JMA seismic intensity of lower 5 or stronger
Collapse of buildings, landslides, liquefaction, land subsidence, tsunamis, fire, nuclear power station breakdown, large-scale power outages
Major Damage
777Maximum seismic intensity(Japanese scale)
7.36.89.0Magnitude
Near Awaji IslandChuestu region of Niigata Prefecture
Off the Sanriku CoastEpicenter
January 17, 1995October 23, 2004March 11, 2011Date and Time
Great Hanshin-Awaji Earthquake (Southern Hyogo Prefecture Earthquake)
Niigata Chuetsu Earthquake
Great East Japan Earthquake(“Off the Pacific Coast of Tohoku Earthquake”)
■Great East Japan Earthquake and Past Major Earthquakes
Source: Reports issued by Japan Meteorological Agency, Fire and Disaster Management Agency
5
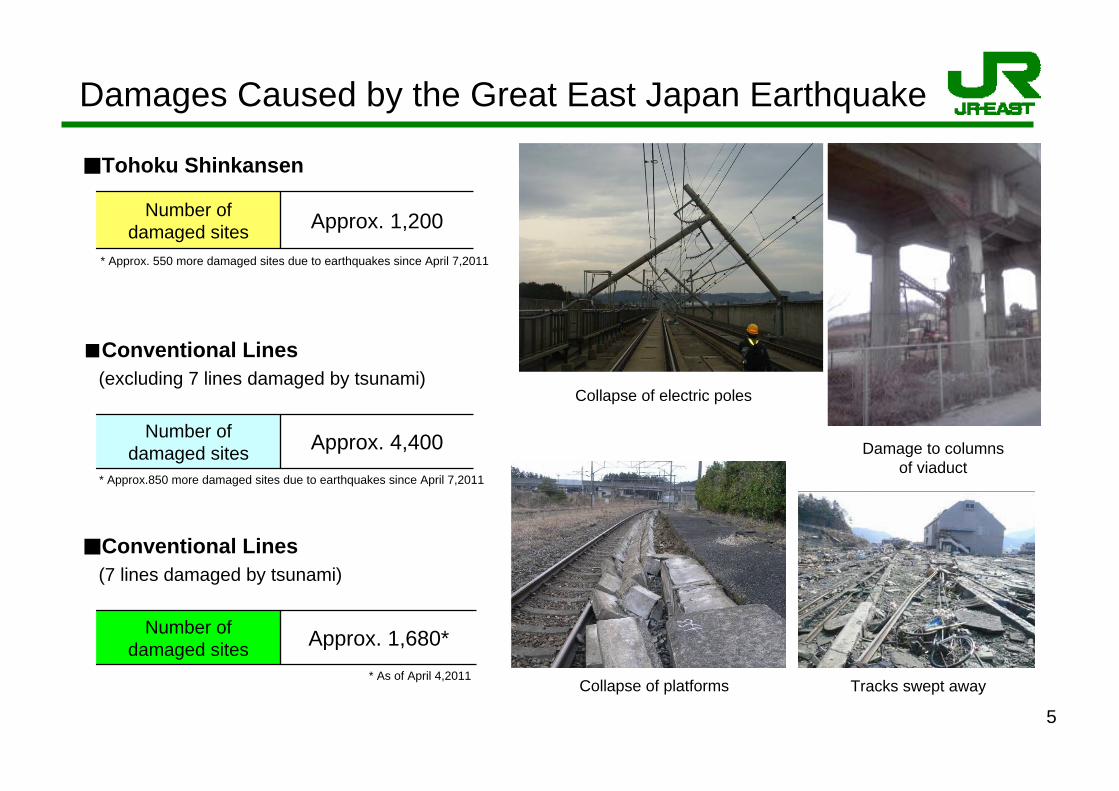
Damages Caused by the Great East Japan Earthquake
Approx. 1,200Number of damaged sites
■Tohoku Shinkansen
■Conventional Lines(excluding 7 lines damaged by tsunami)
■Conventional Lines(7 lines damaged by tsunami)
Approx. 4,400Number of damaged sites
Approx. 1,680*Number of damaged sites
* As of April 4,2011
* Approx. 550 more damaged sites due to earthquakes since April 7,2011
* Approx.850 more damaged sites due to earthquakes since April 7,2011
Collapse of electric poles
Damage to columns of viaduct
Tracks swept awayCollapse of platforms
6
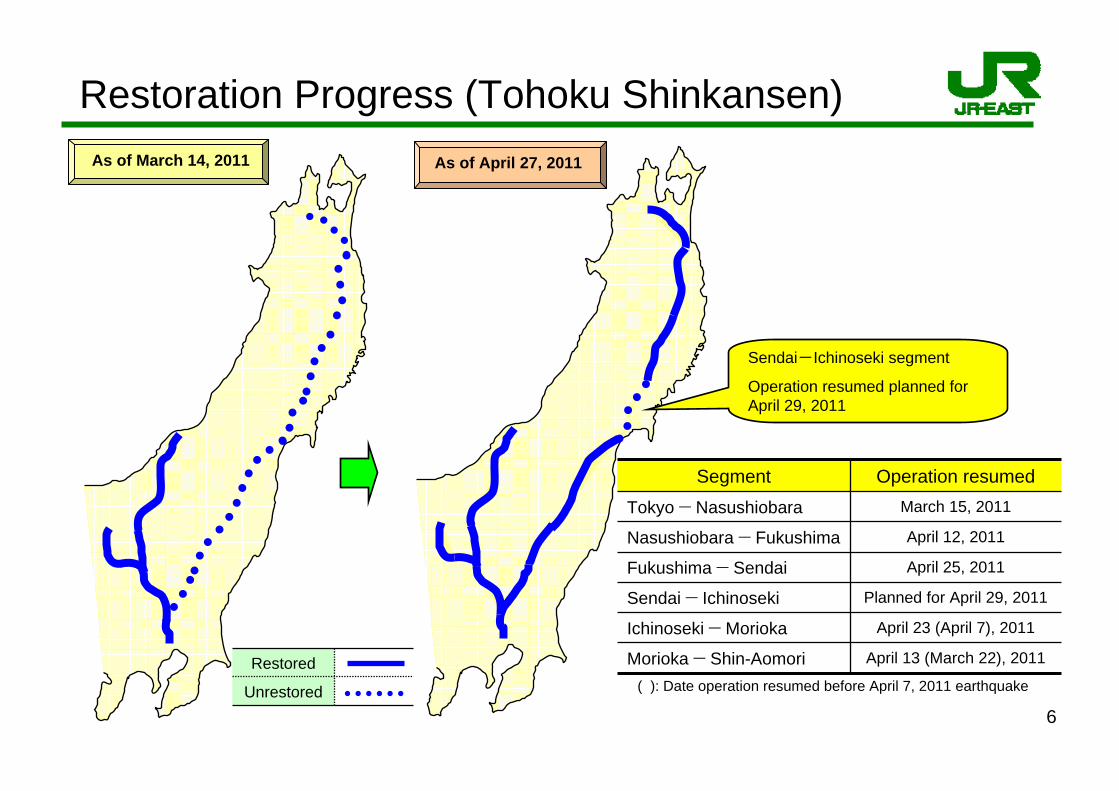
Restoration Progress (Tohoku Shinkansen)
Planned for April 29, 2011Sendai ― Ichinoseki
April 23 (April 7), 2011Ichinoseki ― Morioka
March 15, 2011Tokyo ― Nasushiobara
April 12, 2011Nasushiobara ― Fukushima
April 25, 2011Fukushima ― Sendai
April 13 (March 22), 2011Morioka ― Shin-Aomori
Operation resumedSegment
As of April 27, 2011As of March 14, 2011
Sendai-Ichinoseki segment
Operation resumed planned for April 29, 2011
Unrestored
Restored( ): Date operation resumed before April 7, 2011 earthquake
7
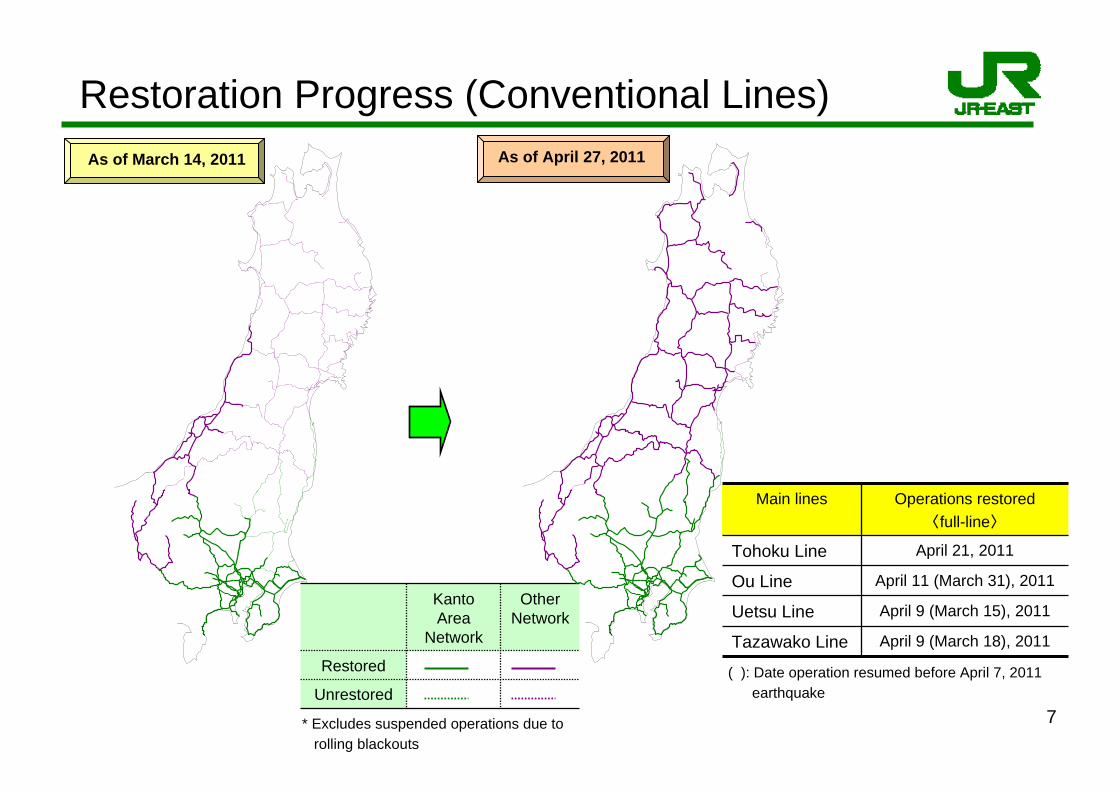
Restoration Progress (Conventional Lines)
* Excludes suspended operations due to rolling blackouts
Unrestored
Restored
Other Network
Kanto Area
Network
April 11 (March 31), 2011Ou Line
April 9 (March 15), 2011Uetsu Line
April 9 (March 18), 2011Tazawako Line
April 21, 2011Tohoku Line
Operations restored〈full-line〉
Main lines
( ): Date operation resumed before April 7, 2011 earthquake
As of March 14As of March 14, 2011 As of April 27, 2011
8
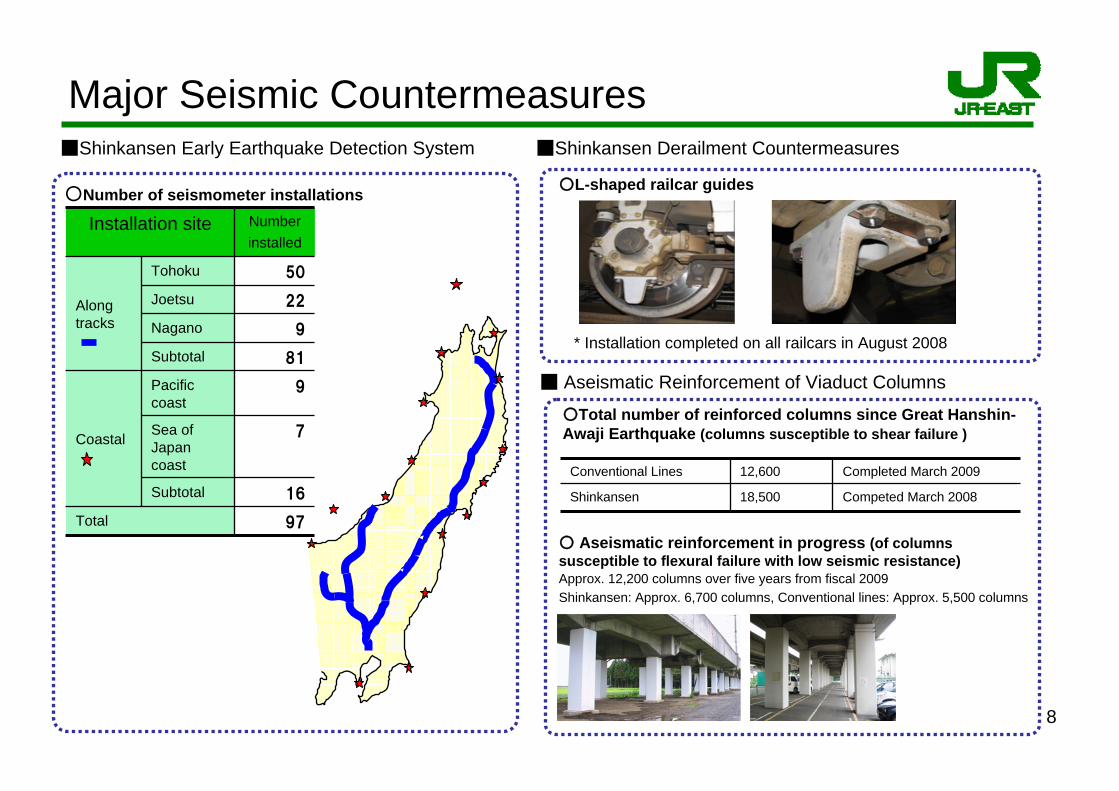
Major Seismic Countermeasures
9Pacific coast
Coastal 7Sea of Japan coast
22Joetsu
50Tohoku
Along tracks
81Subtotal
97Total
16Subtotal
9Nagano
Number installed
Installation site
■ Aseismatic Reinforcement of Viaduct Columns
■Shinkansen Derailment Countermeasures■Shinkansen Early Earthquake Detection System
○Number of seismometer installations
* Installation completed on all railcars in August 2008
○L-shaped railcar guides
Competed March 200818,500Shinkansen
Completed March 200912,600Conventional Lines
○Total number of reinforced columns since Great Hanshin-Awaji Earthquake (columns susceptible to shear failure )
○ Aseismatic reinforcement in progress (of columns susceptible to flexural failure with low seismic resistance)Approx. 12,200 columns over five years from fiscal 2009Shinkansen: Approx. 6,700 columns, Conventional lines: Approx. 5,500 columns
9
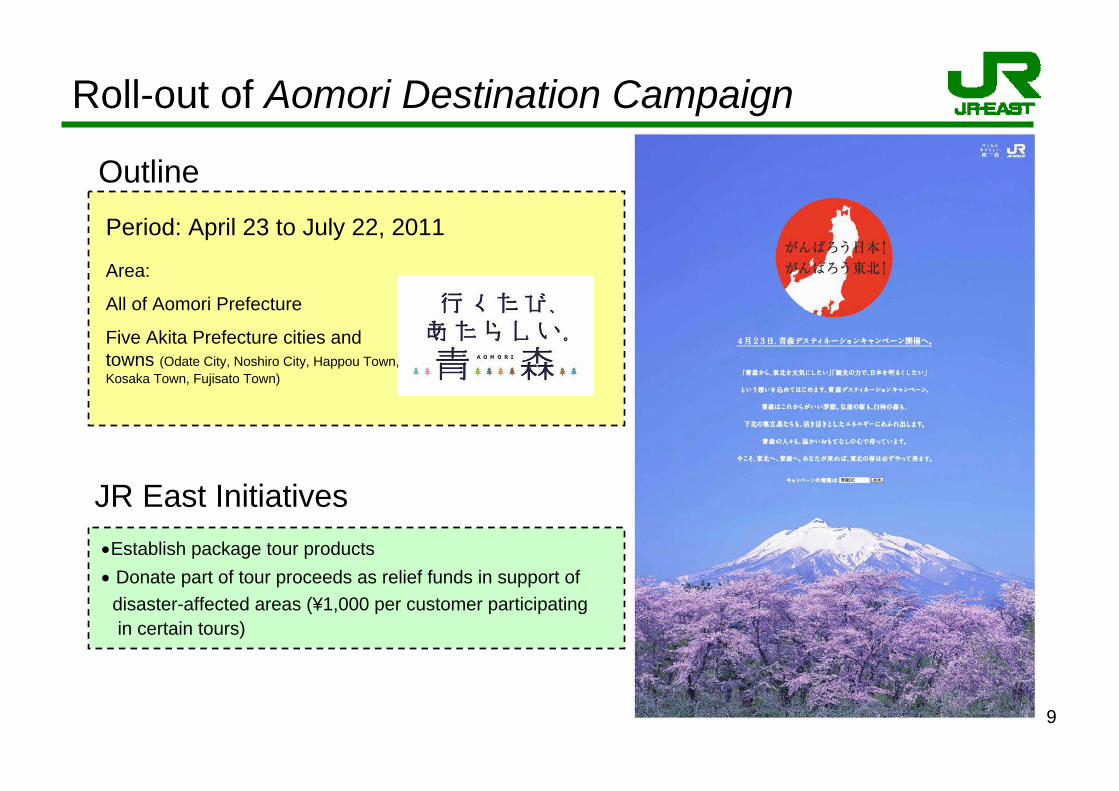
Roll-out of Aomori Destination Campaign
Period: April 23 to July 22, 2011
Area:
All of Aomori Prefecture
Five Akita Prefecture cities and towns (Odate City, Noshiro City, Happou Town, Kosaka Town, Fujisato Town)
•Establish package tour products• Donate part of tour proceeds as relief funds in support of disaster-affected areas (¥1,000 per customer participating in certain tours)
Outline
JR East Initiatives

II. Main Points of FY2011.3 Financial Results and Approach to
Business Forecasts
11
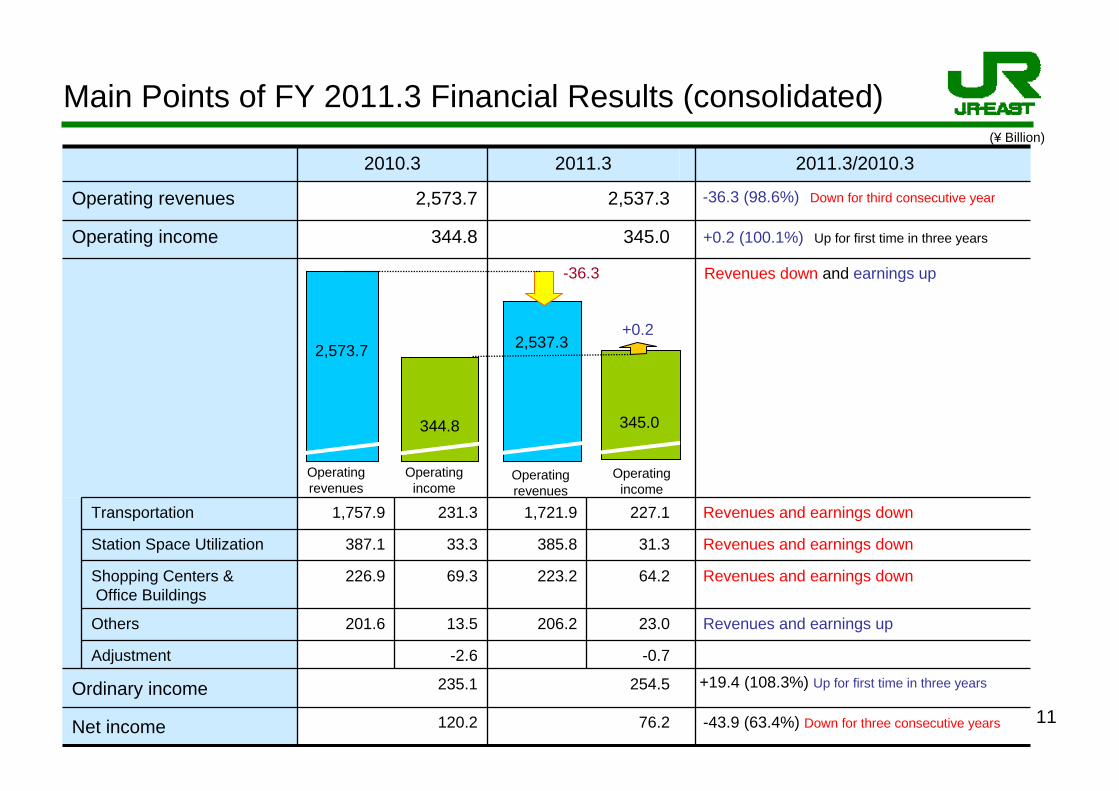
Revenues down and earnings up
+0.2 (100.1%) Up for first time in three years345.0344.8Operating income
+19.4 (108.3%) Up for first time in three years254.5235.1Ordinary income
-0.7-2.6Adjustment
Net income
Revenues and earnings up23.0206.213.5201.6Others
64.2
31.3
227.1
69.3
33.3
231.3
2011.32010.3
76.2
223.2
385.8
1,721.9
2,537.3
-43.9 (63.4%) Down for three consecutive years 120.2
Revenues and earnings down1,757.9Transportation
Revenues and earnings down226.9Shopping Centers & Office Buildings
Revenues and earnings down387.1Station Space Utilization
2,573.7Operating revenues -36.3 (98.6%) Down for third consecutive year
2011.3/2010.3
2,573.7
Operatingrevenues
+0.2
Operatingincome
2,537.3
344.8 345.0
-36.3
Operatingrevenues
Operatingincome
(¥ Billion)
Main Points of FY 2011.3 Financial Results (consolidated)
12
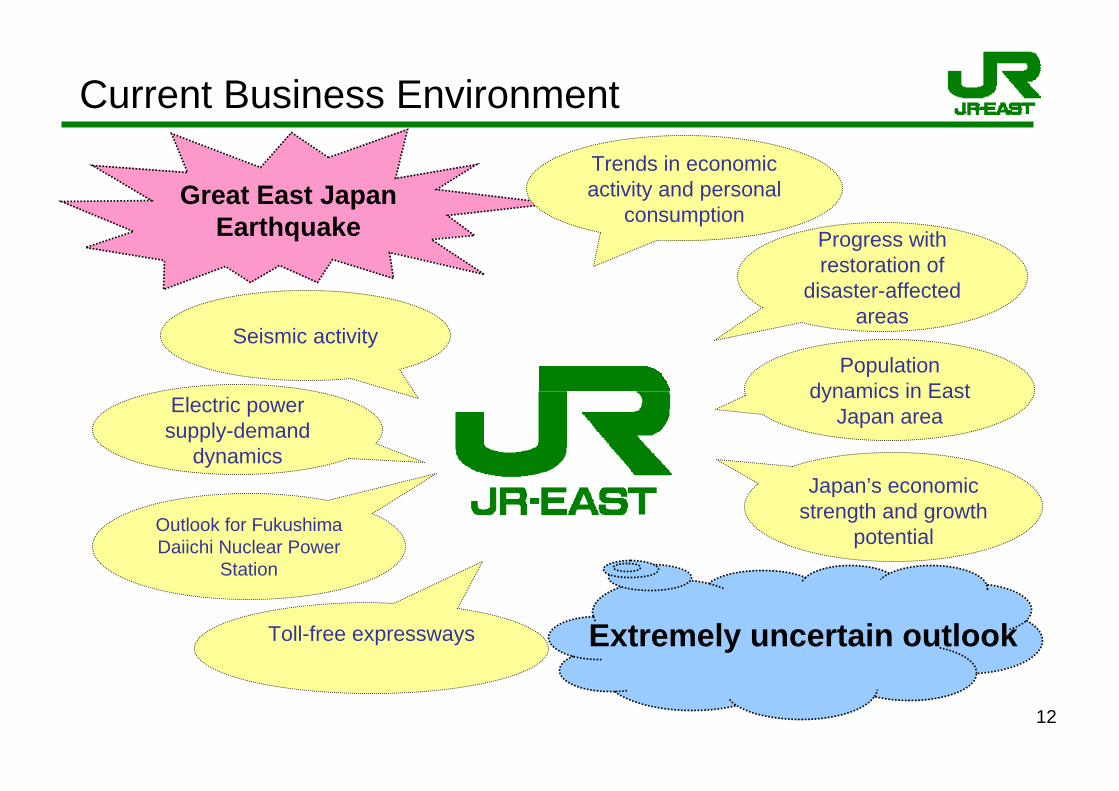
Current Business Environment
Seismic activity
Outlook for Fukushima Daiichi Nuclear Power
Station
Electric power supply-demand
dynamics
Toll-free expressways
Progress with restoration of
disaster-affectedareas
Population dynamics in East
Japan area
Japan’s economic strength and growth
potential
Trends in economic activity and personal
consumptionGreat East Japan
Earthquake
Extremely uncertain outlook
13
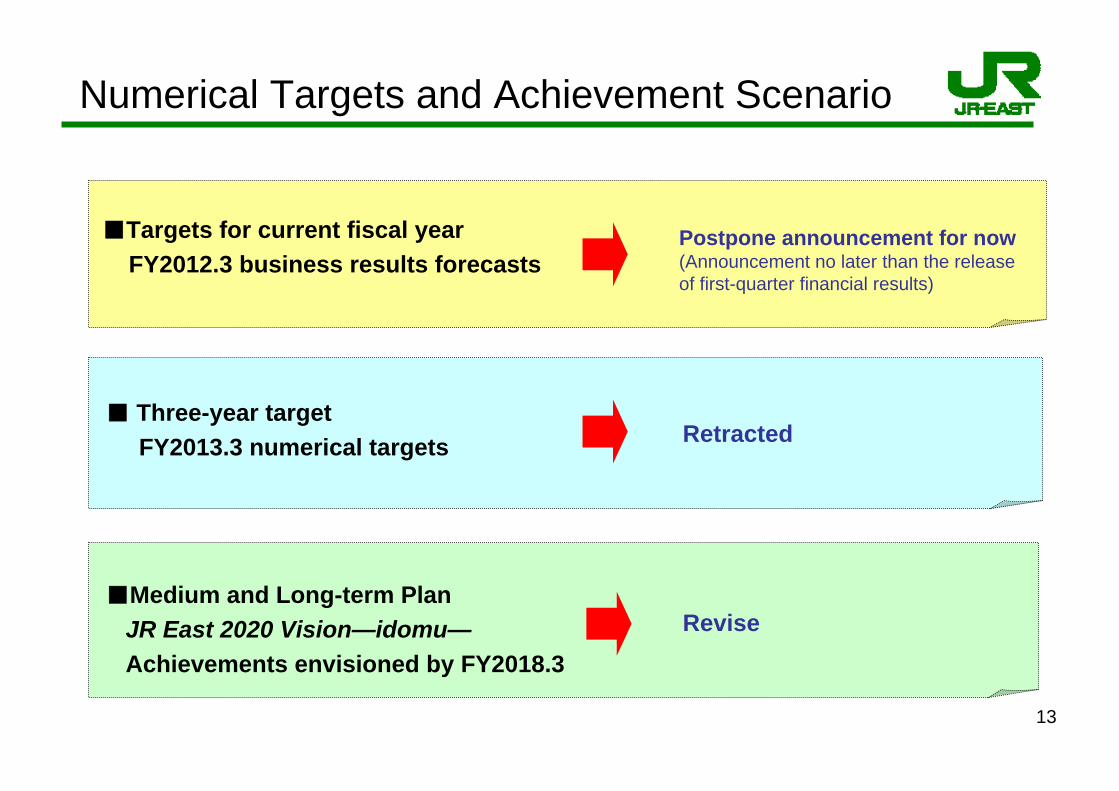
Numerical Targets and Achievement Scenario
Postpone announcement for now(Announcement no later than the release of first-quarter financial results)
Revise
■Targets for current fiscal year FY2012.3 business results forecasts
■Medium and Long-term Plan JR East 2020 Vision—idomu—Achievements envisioned by FY2018.3
■ Three-year targetFY2013.3 numerical targets Retracted
14
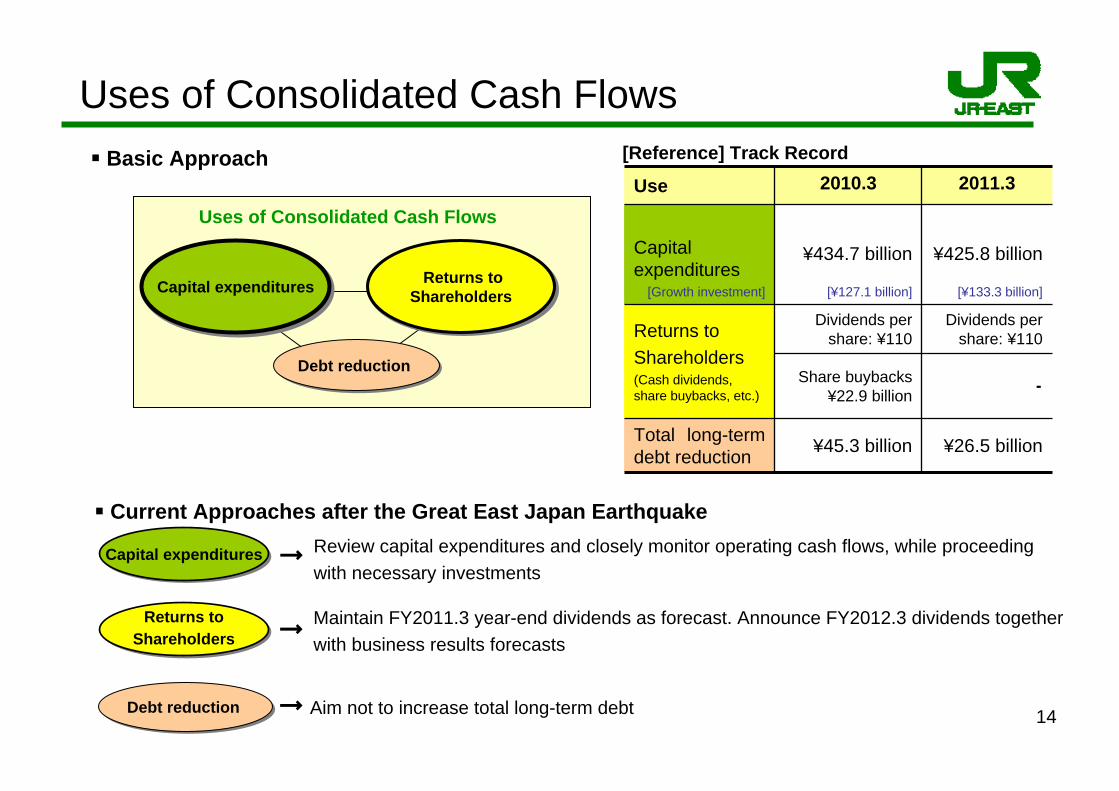
Uses of Consolidated Cash Flows
Uses of Consolidated Cash Flows
Debt reduction Debt reduction
Capital expendituresCapital expenditures Returns toShareholders
Returns toShareholders
Basic Approach
Current Approaches after the Great East Japan Earthquake
Debt reduction Debt reduction
Returns toShareholdersReturns to
Shareholders
→ Aim not to increase total long-term debt
Maintain FY2011.3 year-end dividends as forecast. Announce FY2012.3 dividends together with business results forecasts
Capital expendituresCapital expenditures Review capital expenditures and closely monitor operating cash flows, while proceeding with necessary investments
¥45.3 billion
Share buybacks¥22.9 billion
Dividends per share: ¥110
¥434.7 billion
[¥127.1 billion]
2010.3
‐
¥26.5 billion
Dividends per share: ¥110
¥425.8 billion
[¥133.3 billion]
2011.3
Returns toShareholders(Cash dividends, share buybacks, etc.)
Total long-term debt reduction
Capital expenditures
[Growth investment]
Use
[Reference] Track Record
→
→
III. FY2011.3 Financial Results
16
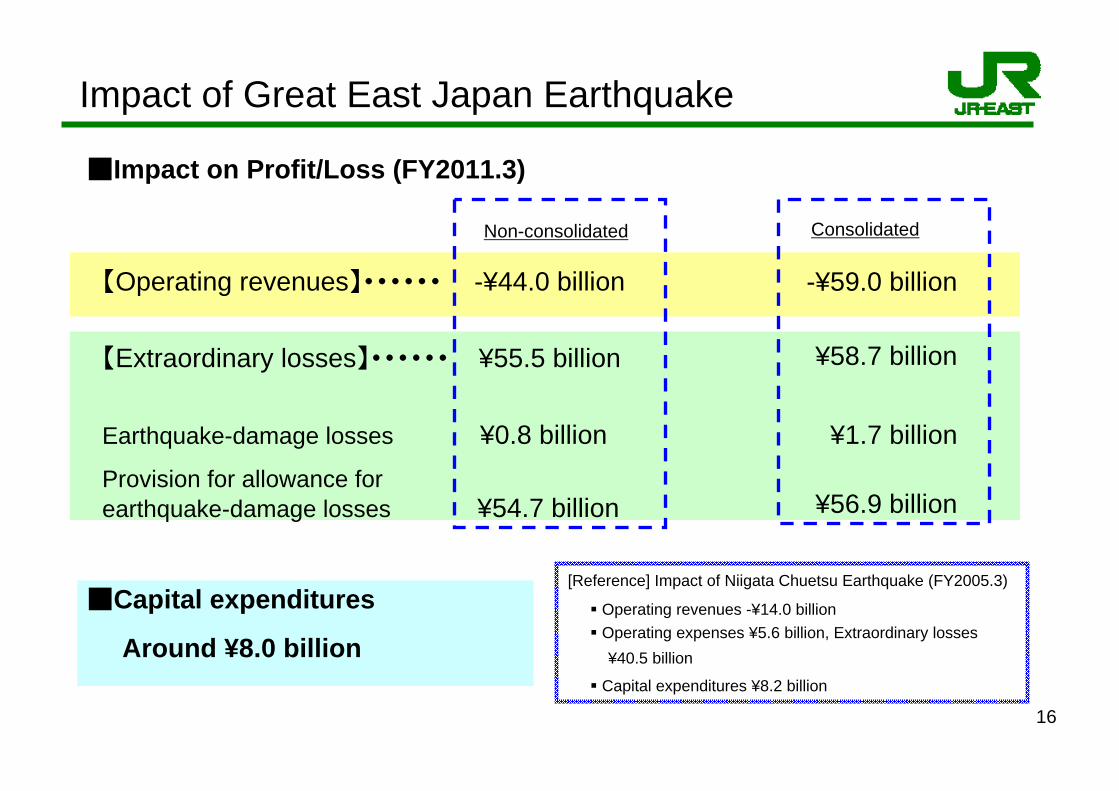
Impact of Great East Japan Earthquake
【Operating revenues】・・・・・・ -¥44.0 billion
【Extraordinary losses】・・・・・・ ¥55.5 billion
Earthquake-damage losses ¥0.8 billionProvision for allowance for earthquake-damage losses ¥54.7 billion
Non-consolidated
[Reference] Impact of Niigata Chuetsu Earthquake (FY2005.3)
Operating revenues -¥14.0 billionOperating expenses ¥5.6 billion, Extraordinary losses¥40.5 billion
Capital expenditures ¥8.2 billion
Consolidated
-¥59.0 billion
¥58.7 billion
¥1.7 billion
¥56.9 billion
■Capital expenditures
Around ¥8.0 billion
■Impact on Profit/Loss (FY2011.3)
17
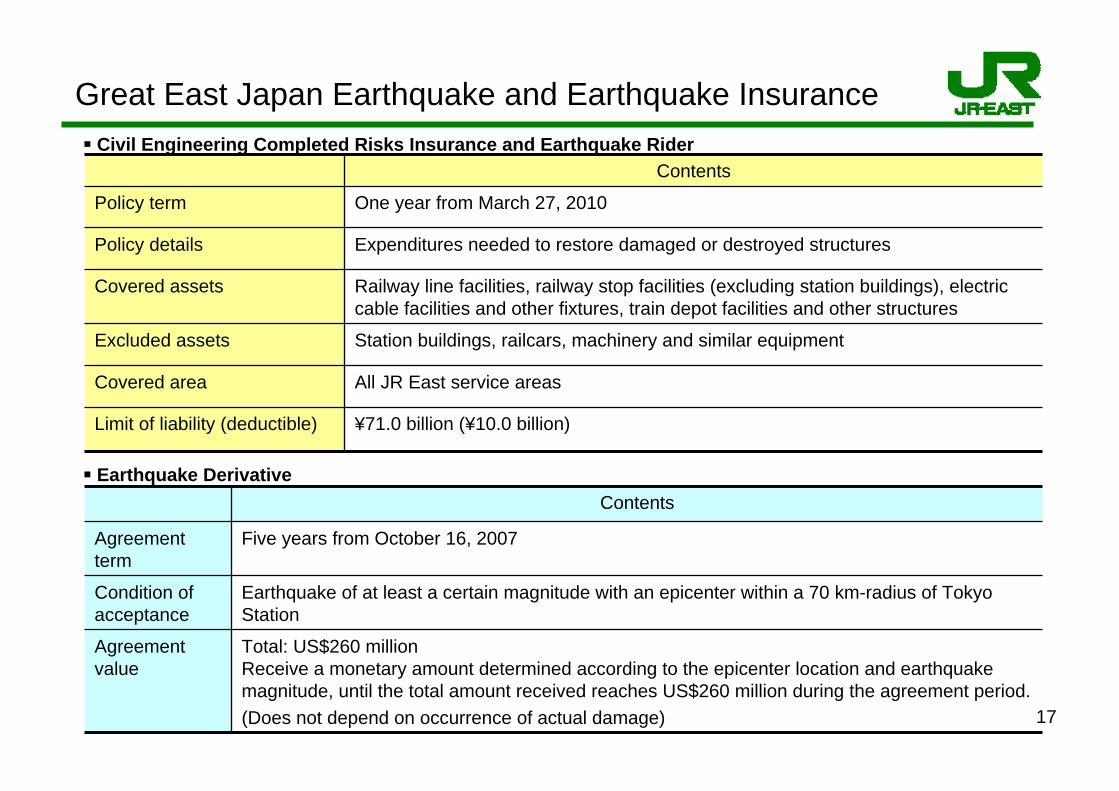
Great East Japan Earthquake and Earthquake InsuranceCivil Engineering Completed Risks Insurance and Earthquake Rider
Expenditures needed to restore damaged or destroyed structuresPolicy details
One year from March 27, 2010Policy term
Station buildings, railcars, machinery and similar equipmentExcluded assets
Railway line facilities, railway stop facilities (excluding station buildings), electriccable facilities and other fixtures, train depot facilities and other structures
Covered assets
¥71.0 billion (¥10.0 billion)Limit of liability (deductible)
All JR East service areasCovered area
Contents
Earthquake Derivative
Five years from October 16, 2007Agreement term
Earthquake of at least a certain magnitude with an epicenter within a 70 km-radius of Tokyo Station
Condition of acceptance
Total: US$260 millionReceive a monetary amount determined according to the epicenter location and earthquake magnitude, until the total amount received reaches US$260 million during the agreement period. (Does not depend on occurrence of actual damage)
Agreement value
Contents
18
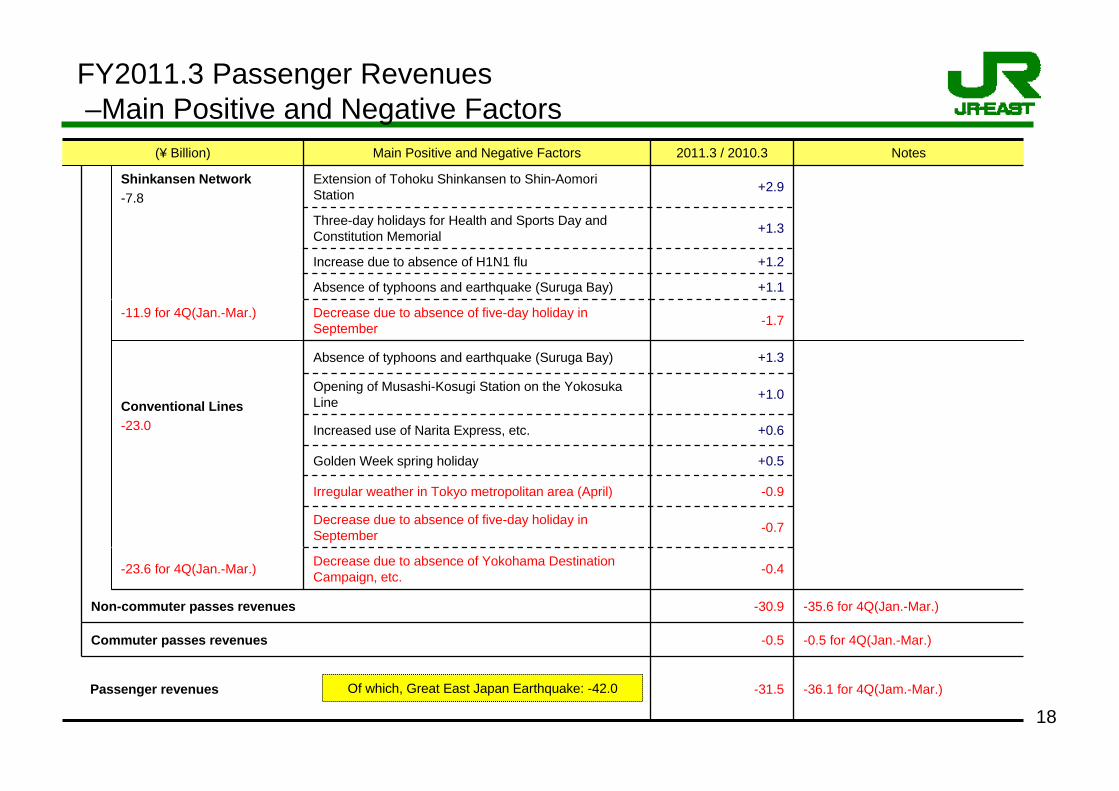
FY2011.3 Passenger Revenues–Main Positive and Negative Factors
Commuter passes revenues
-23.6 for 4Q(Jan.-Mar.)
-11.9 for 4Q(Jan.-Mar.)
Non-commuter passes revenues
+1.2Increase due to absence of H1N1 flu
+1.3Three-day holidays for Health and Sports Day and Constitution Memorial
+2.9Extension of Tohoku Shinkansen to Shin-Aomori Station
+1.1Absence of typhoons and earthquake (Suruga Bay)
+1.3Absence of typhoons and earthquake (Suruga Bay)
+0.5Golden Week spring holiday
Conventional Lines-23.0
Shinkansen Network-7.8
-0.4Decrease due to absence of Yokohama Destination Campaign, etc.
-0.7Decrease due to absence of five-day holiday in September
-0.9Irregular weather in Tokyo metropolitan area (April)
+0.6Increased use of Narita Express, etc.
-35.6 for 4Q(Jan.-Mar.)-30.9
-0.5 for 4Q(Jan.-Mar.)-0.5
-1.7Decrease due to absence of five-day holiday in September
-36.1 for 4Q(Jam.-Mar.)Passenger revenues
Main Positive and Negative Factors
-31.5
+1.0Opening of Musashi-Kosugi Station on the Yokosuka Line
2011.3 / 2010.3 Notes(¥ Billion)
Of which, Great East Japan Earthquake: -42.0
19
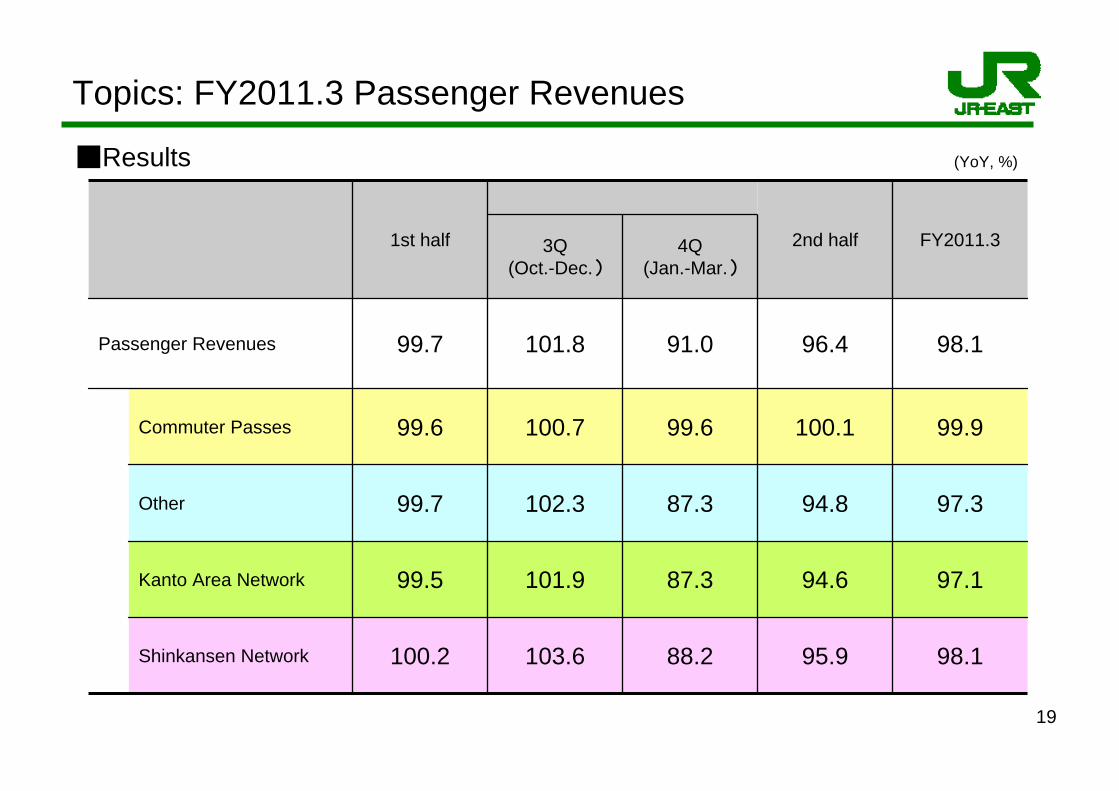
■Results
4Q(Jan.-Mar.)
3Q(Oct.-Dec.)
103.6
101.9
102.3
100.7
101.8
88.2
87.3
87.3
99.6
91.0
98.195.9100.2Shinkansen Network
97.194.699.5Kanto Area Network
97.394.899.7Other
99.9100.199.6Commuter Passes
98.196.499.7Passenger Revenues
FY2011.32nd half1st half
(YoY, %)
Topics: FY2011.3 Passenger Revenues
20
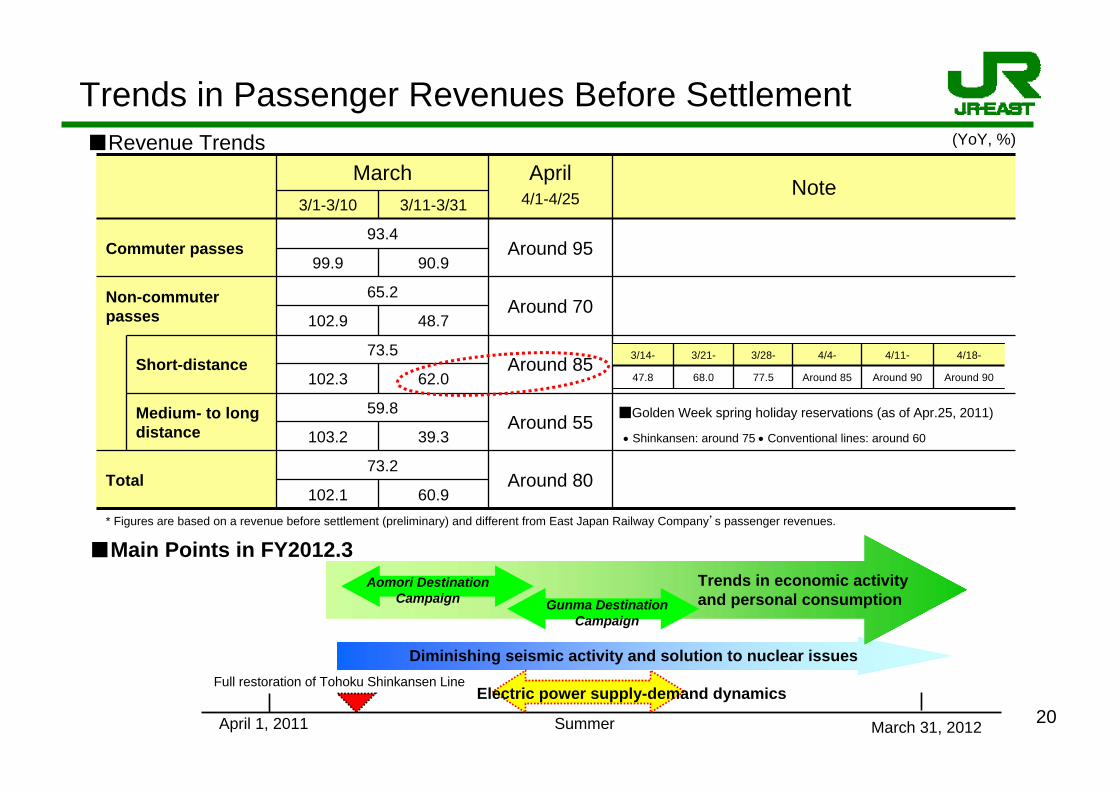
Trends in Passenger Revenues Before Settlement■Revenue Trends
60.9102.1
39.3103.2
62.0102.3
48.7102.9
90.999.9
3/11-3/313/1-3/10
Around 5559.8Medium- to long
distance
Around 8073.2
Total
Around 8573.5
Short-distance
Around 7065.2Non-commuter
passes
Around 9593.4
Commuter passes
NoteApril
4/1-4/25March
Around 90Around 90Around 8577.568.047.8
4/18-4/11-4/4-3/28-3/21-3/14-
• Shinkansen: around 75 • Conventional lines: around 60
■Golden Week spring holiday reservations (as of Apr.25, 2011)
■Main Points in FY2012.3Aomori Destination
Campaign
Full restoration of Tohoku Shinkansen Line
April 1, 2011 Summer March 31, 2012
Trends in economic activity and personal consumption
Diminishing seismic activity and solution to nuclear issues
(YoY, %)
* Figures are based on a revenue before settlement (preliminary) and different from East Japan Railway Company’s passenger revenues.
Gunma Destination Campaign
Electric power supply-demand dynamics
21
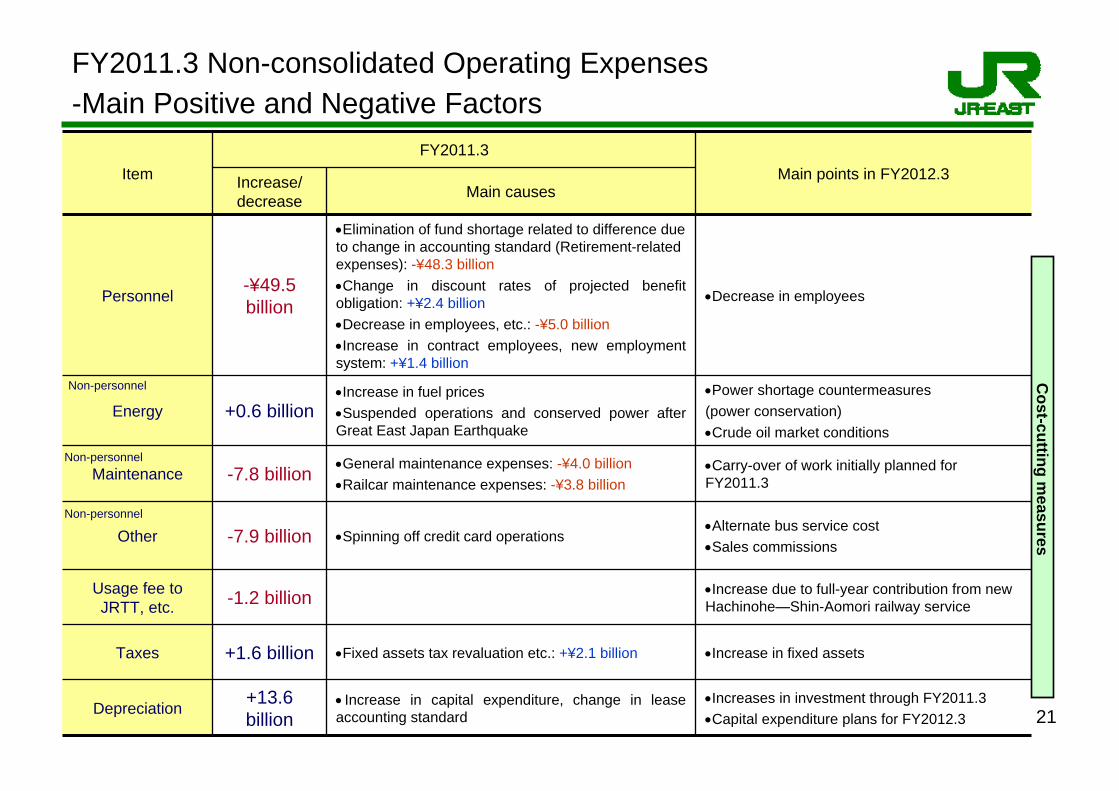
FY2011.3 Non-consolidated Operating Expenses-Main Positive and Negative Factors
•Increase due to full-year contribution from new Hachinohe―Shin-Aomori railway service-1.2 billionUsage fee to
JRTT, etc.
• Increase in capital expenditure, change in lease accounting standard
•Fixed assets tax revaluation etc.: +¥2.1 billion
•Spinning off credit card operations
•General maintenance expenses: -¥4.0 billion•Railcar maintenance expenses: -¥3.8 billion
•Increase in fuel prices •Suspended operations and conserved power after Great East Japan Earthquake
•Elimination of fund shortage related to difference due to change in accounting standard (Retirement-related expenses): -¥48.3 billion•Change in discount rates of projected benefit obligation: +¥2.4 billion•Decrease in employees, etc.: -¥5.0 billion•Increase in contract employees, new employment system: +¥1.4 billion
Main causesIncrease/ decrease
•Carry-over of work initially planned for FY2011.3
•Power shortage countermeasures (power conservation)•Crude oil market conditions
Depreciation
Taxes
Other
-7.8 billionMaintenance
•Increases in investment through FY2011.3•Capital expenditure plans for FY2012.3
+13.6billion
•Alternate bus service cost•Sales commissions-7.9 billion
Energy
Personnel
+1.6 billion
+0.6 billion
-¥49.5 billion
FY2011.3
•Increase in fixed assets
•Decrease in employees
Main points in FY2012.3Item
Cost-cutting m
easures
Non-personnel
Non-personnel
Non-personnel
22
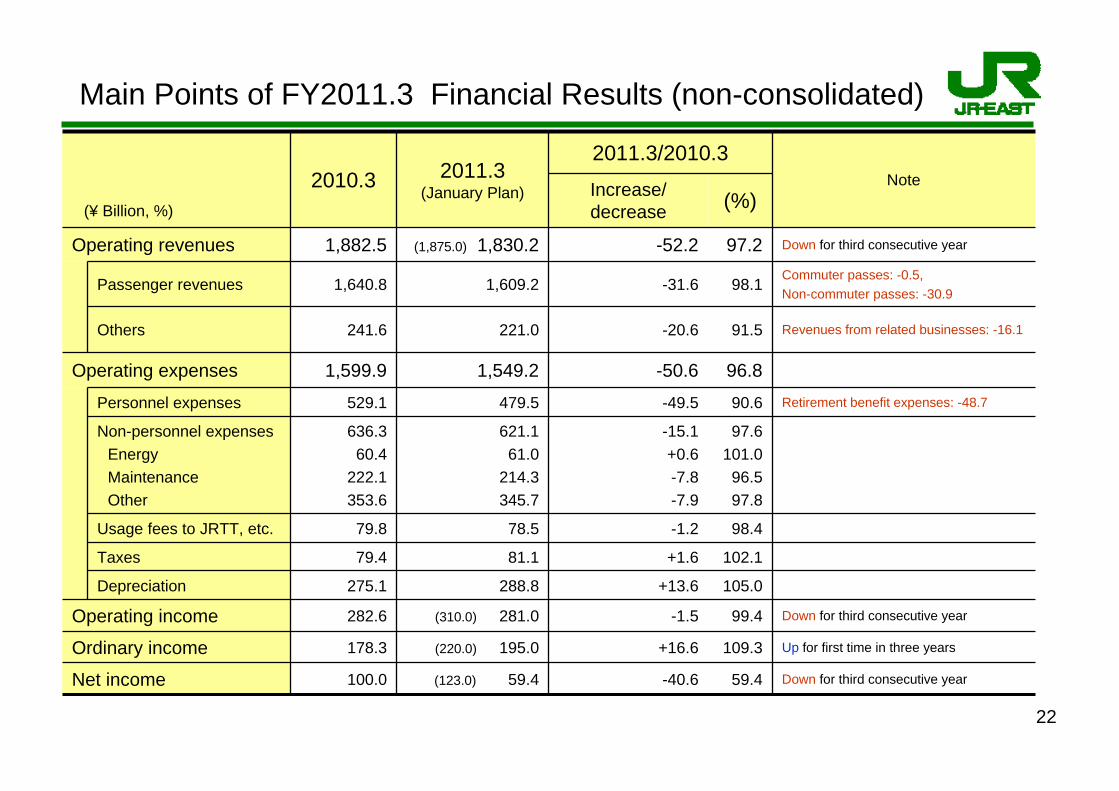
(%)Increase/ decrease
-40.6
+16.6
-1.5
+13.6
+1.6
-1.2
-15.1+0.6-7.8-7.9
-49.5
-50.6
-20.6
-31.6
-52.2
2011.3/2010.3
(123.0) 59.4
(220.0) 195.0
(310.0) 281.0
288.8
81.1
78.5
621.161.0
214.3345.7
479.5
1,549.2
221.0
1,609.2
(1,875.0) 1,830.2
2011.3 (January Plan)
100.0
178.3
282.6
275.1
79.4
79.8
636.360.4
222.1353.6
529.1
1,599.9
241.6
1,640.8
1,882.5
2010.3
59.4
109.3
99.4
105.0
102.1
98.4
97.6101.096.597.8
90.6
96.8
91.5
98.1
97.2
Down for third consecutive year
Up for first time in three years
Down for third consecutive year
Retirement benefit expenses: -48.7
Revenues from related businesses: -16.1
Commuter passes: -0.5, Non-commuter passes: -30.9
Down for third consecutive year
Note
Others
Passenger revenues
Operating expenses
Ordinary income
Operating income
Personnel expenses
Non-personnel expensesEnergyMaintenanceOther
Depreciation
Net income
Taxes
Usage fees to JRTT, etc.
Operating revenues
(¥ Billion, %)
Main Points of FY2011.3 Financial Results (non-consolidated)
23
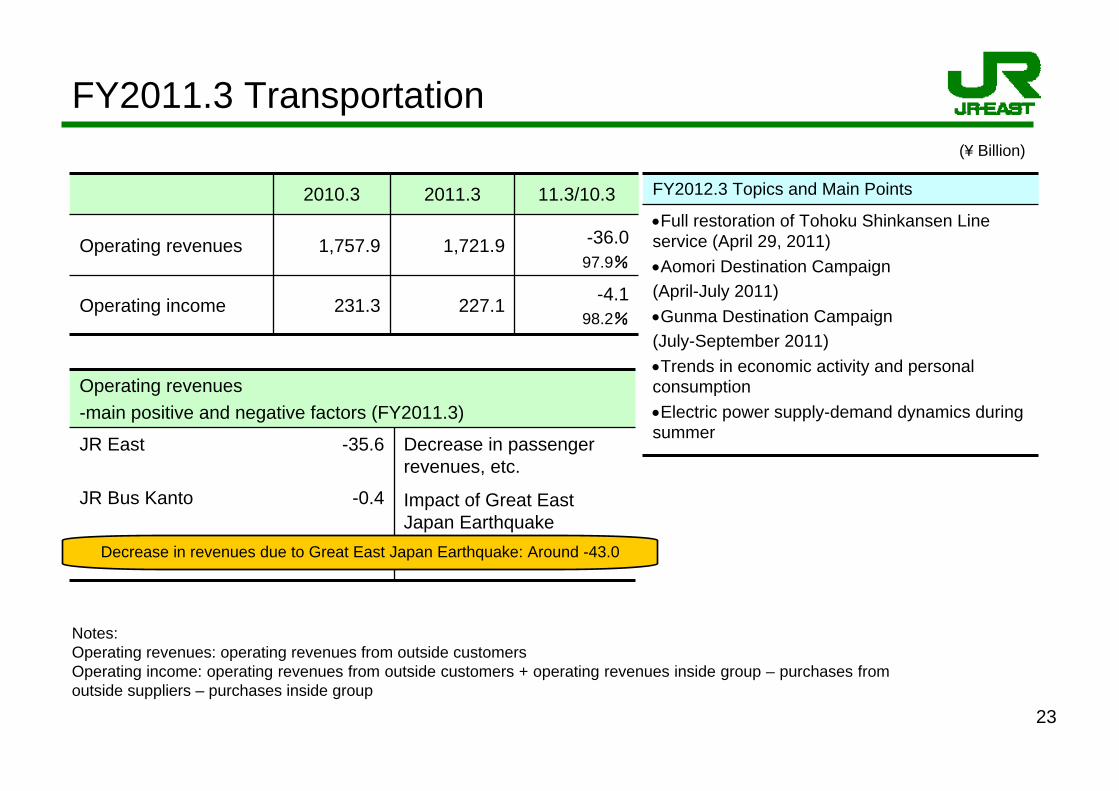
-4.198.2%
227.1231.3Operating income
-36.097.9%
1,721.91,757.9Operating revenues
11.3/10.32011.32010.3
(¥ Billion)
Notes: Operating revenues: operating revenues from outside customersOperating income: operating revenues from outside customers + operating revenues inside group – purchases from outside suppliers – purchases inside group
Operating revenues-main positive and negative factors (FY2011.3)
Decrease in passenger revenues, etc.
Impact of Great East Japan Earthquake
-35.6
-0.4
JR East
JR Bus Kanto
•Full restoration of Tohoku Shinkansen Line service (April 29, 2011)•Aomori Destination Campaign(April-July 2011)•Gunma Destination Campaign(July-September 2011)•Trends in economic activity and personal consumption •Electric power supply-demand dynamics during summer
FY2012.3 Topics and Main Points
Decrease in revenues due to Great East Japan Earthquake: Around -43.0
FY2011.3 Transportation
24Notes: Operating revenues: operating revenues from outside customers Operating income: operating revenues from outside customers + operating revenues inside group – purchases from outside suppliers – purchases inside group
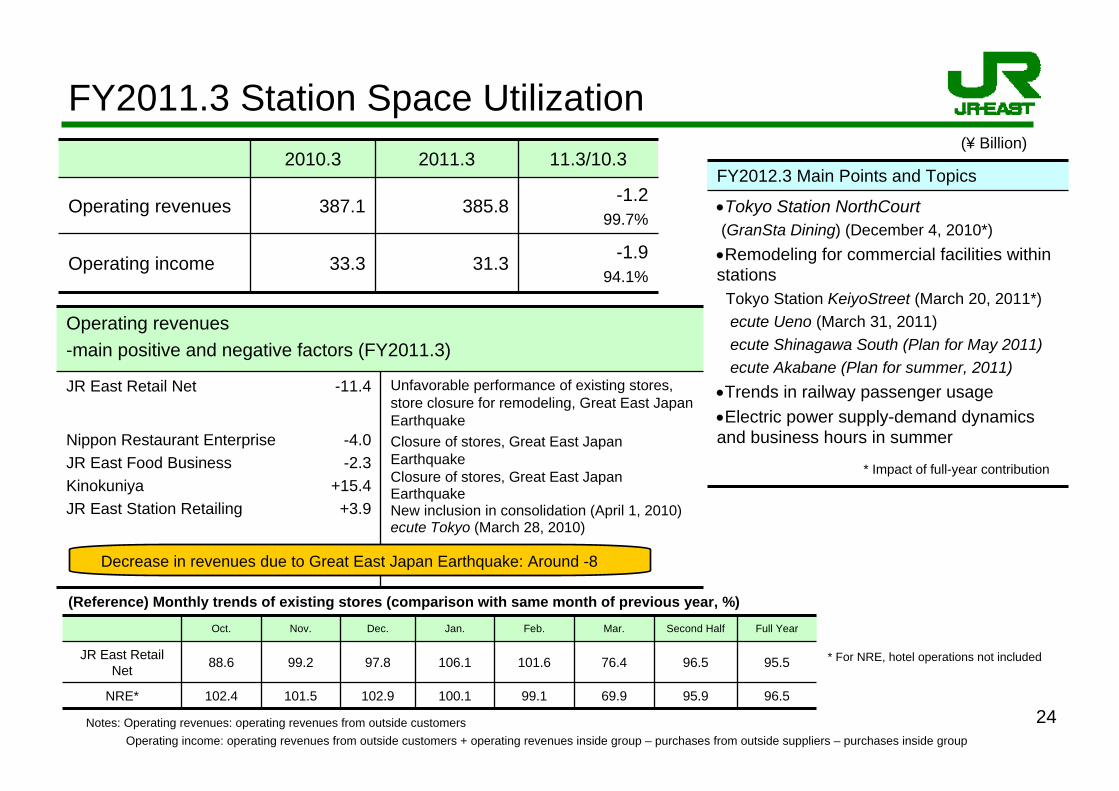
(¥ Billion)
Operating revenues-main positive and negative factors (FY2011.3)
Unfavorable performance of existing stores, store closure for remodeling, Great East JapanEarthquakeClosure of stores, Great East Japan EarthquakeClosure of stores, Great East JapanEarthquakeNew inclusion in consolidation (April 1, 2010) ecute Tokyo (March 28, 2010)
-11.4
-4.0-2.3
+15.4+3.9
JR East Retail Net
Nippon Restaurant EnterpriseJR East Food BusinessKinokuniyaJR East Station Retailing
•Tokyo Station NorthCourt(GranSta Dining) (December 4, 2010*)•Remodeling for commercial facilities within stations
Tokyo Station KeiyoStreet (March 20, 2011*)ecute Ueno (March 31, 2011)ecute Shinagawa South (Plan for May 2011)ecute Akabane (Plan for summer, 2011)
•Trends in railway passenger usage•Electric power supply-demand dynamics and business hours in summer
FY2012.3 Main Points and Topics
101.5
99.2
Nov.
102.9
97.8
Dec.
100.1
106.1
Jan.
99.1
101.6
Feb.
69.9
76.4
Mar.
95.9
96.5
Second Half
96.5102.4NRE*
95.588.6JR East Retail Net
Full YearOct.
(Reference) Monthly trends of existing stores (comparison with same month of previous year, %)
* For NRE, hotel operations not included
-1.994.1%
31.333.3Operating income
-1.299.7%
385.8387.1Operating revenues
11.3/10.32011.32010.3
* Impact of full-year contribution
Decrease in revenues due to Great East Japan Earthquake: Around -8
FY2011.3 Station Space Utilization
25Notes: Operating revenues: operating revenues from outside customersOperating income: operating revenues from outside customers + operating revenues inside group – purchases from outside suppliers – purchases inside group
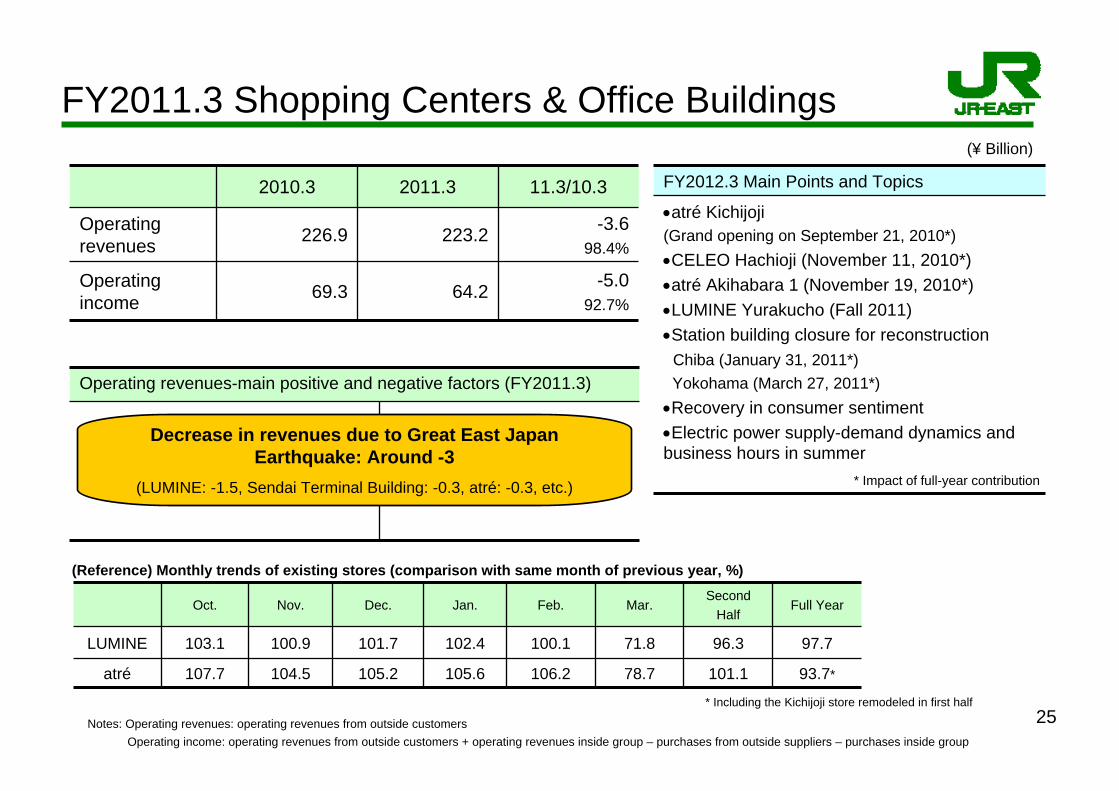
(¥ Billion)
Operating revenues-main positive and negative factors (FY2011.3)
•atré Kichijoji(Grand opening on September 21, 2010*)•CELEO Hachioji (November 11, 2010*)•atré Akihabara 1 (November 19, 2010*) •LUMINE Yurakucho (Fall 2011)•Station building closure for reconstruction
Chiba (January 31, 2011*)Yokohama (March 27, 2011*)•Recovery in consumer sentiment •Electric power supply-demand dynamics and business hours in summer
FY2012.3 Main Points and Topics
107.7
103.1
Oct.
104.5
100.9
Nov.
105.2
101.7
Dec.
105.6
102.4
Jan.
106.2
100.1
Feb.
78.7
71.8
Mar.
93.7*101.1atré
97.796.3LUMINE
Full YearSecond
Half
(Reference) Monthly trends of existing stores (comparison with same month of previous year, %)
* Including the Kichijoji store remodeled in first half
-5.092.7%
64.269.3Operating income
-3.698.4%
223.2226.9Operating revenues
11.3/10.32011.32010.3
* Impact of full-year contribution
Decrease in revenues due to Great East Japan Earthquake: Around -3
(LUMINE: -1.5, Sendai Terminal Building: -0.3, atré: -0.3, etc.)
FY2011.3 Shopping Centers & Office Buildings
26
(¥ Billion)
Notes: Operating revenues: operating revenues from outside customers
Operating income: operating revenues from outside customers + operating revenues inside group – purchases from outside suppliers – purchases inside group
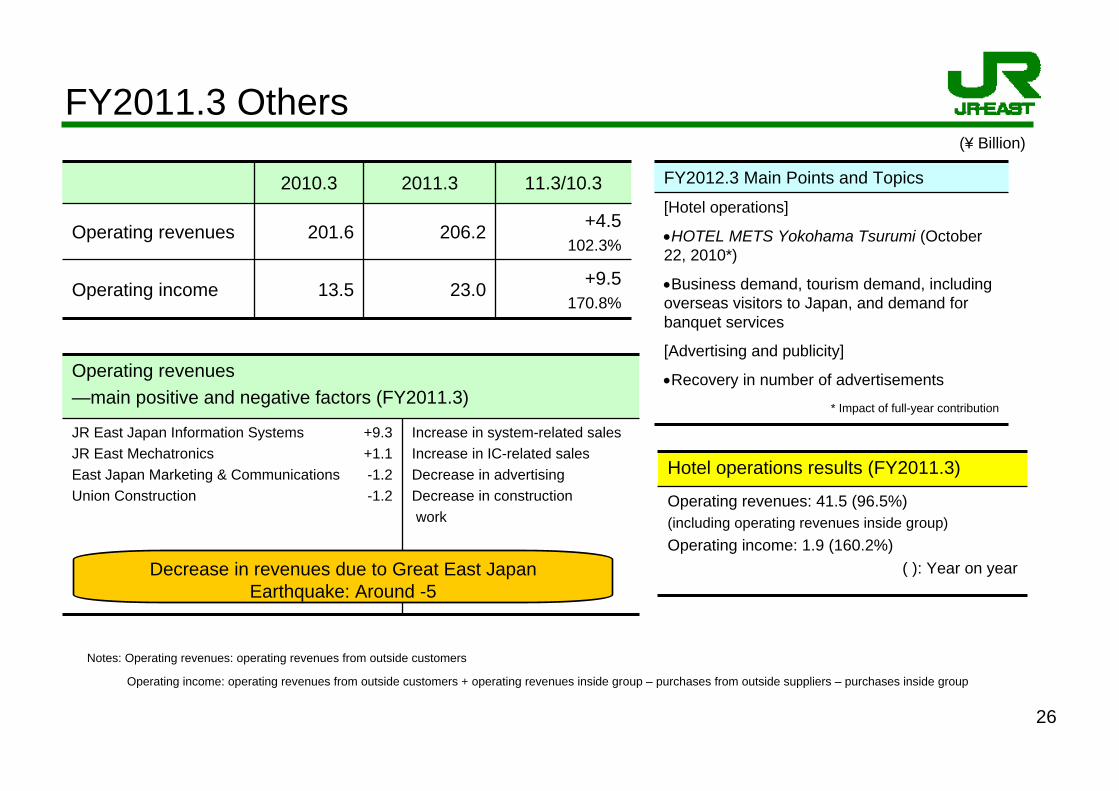
Operating revenues—main positive and negative factors (FY2011.3)
Increase in system-related salesIncrease in IC-related salesDecrease in advertisingDecrease in constructionwork
+9.3+1.1-1.2-1.2
JR East Japan Information SystemsJR East MechatronicsEast Japan Marketing & CommunicationsUnion Construction
[Hotel operations]
•HOTEL METS Yokohama Tsurumi (October 22, 2010*)
•Business demand, tourism demand, including overseas visitors to Japan, and demand for banquet services
[Advertising and publicity]
•Recovery in number of advertisements
FY2012.3 Main Points and Topics
Operating revenues: 41.5 (96.5%)(including operating revenues inside group)Operating income: 1.9 (160.2%)
( ): Year on year
Hotel operations results (FY2011.3)
+9.5170.8%
23.013.5Operating income
+4.5102.3%
206.2201.6Operating revenues
11.3/10.32011.32010.3
* Impact of full-year contribution
Decrease in revenues due to Great East Japan Earthquake: Around -5
FY2011.3 Others
27
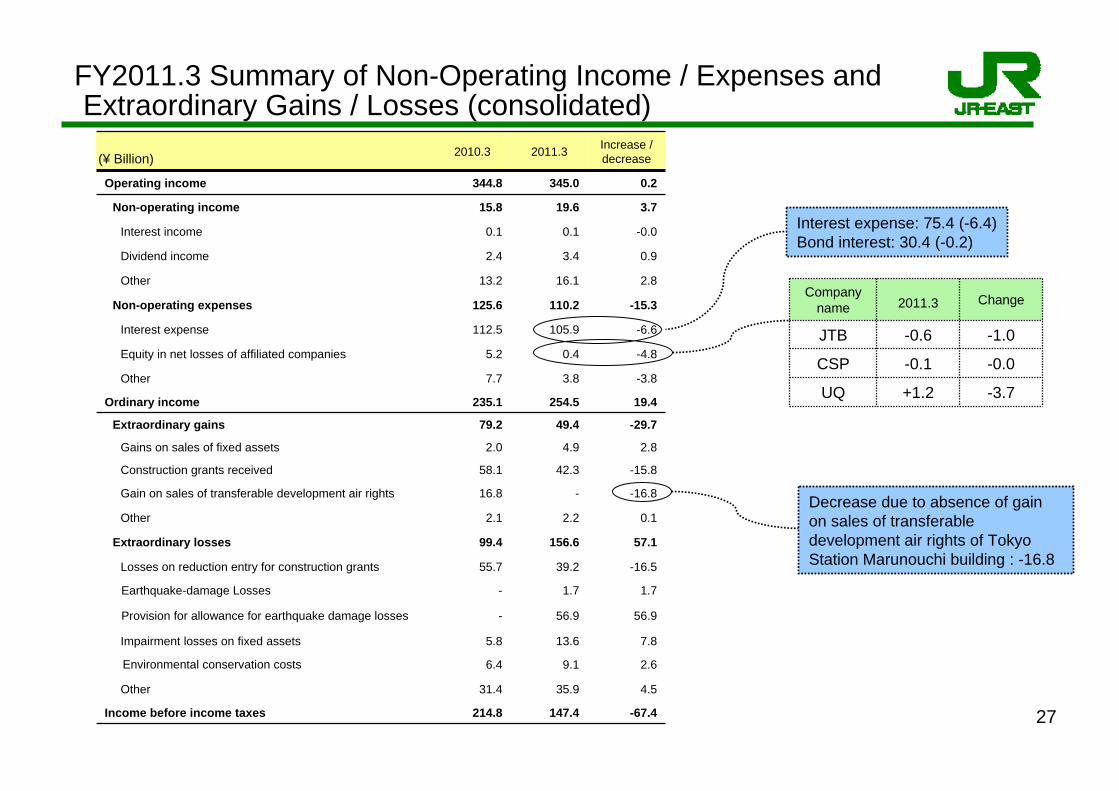
FY2011.3 Summary of Non-Operating Income / Expenses and Extraordinary Gains / Losses (consolidated)
Interest expense: 75.4 (-6.4)Bond interest: 30.4 (-0.2)
2.69.16.4Environmental conservation costs
56.956.9-Provision for allowance for earthquake damage losses
1.71.7-Earthquake-damage Losses
2010.3 2011.3 Increase /decrease
Operating income 344.8 345.0 0.2
Non-operating income 15.8 19.6 3.7
Interest income 0.1 0.1 -0.0
Dividend income 2.4 3.4 0.9
Other 13.2 16.1 2.8
Non-operating expenses 125.6 110.2 -15.3
Interest expense 112.5 105.9 -6.6
Equity in net losses of affiliated companies 5.2 0.4 -4.8
Other 7.7 3.8 -3.8
Ordinary income 235.1 254.5 19.4
Extraordinary gains 79.2 49.4 -29.7
Gains on sales of fixed assets 2.0 4.9 2.8
Construction grants received 58.1 42.3 -15.8
Gain on sales of transferable development air rights 16.8 - -16.8
Other 2.1 2.2 0.1
Extraordinary losses 99.4 156.6 57.1
Losses on reduction entry for construction grants 55.7 39.2 -16.5
Impairment losses on fixed assets 5.8 13.6 7.8
Other 31.4 35.9 4.5
Income before income taxes 214.8 147.4 -67.4
(¥ Billion)
Company name 2011.3 Change
JTB -0.6 -1.0
CSP -0.1 -0.0
UQ +1.2 -3.7
Decrease due to absence of gain on sales of transferable development air rights of Tokyo Station Marunouchi building : -16.8
28
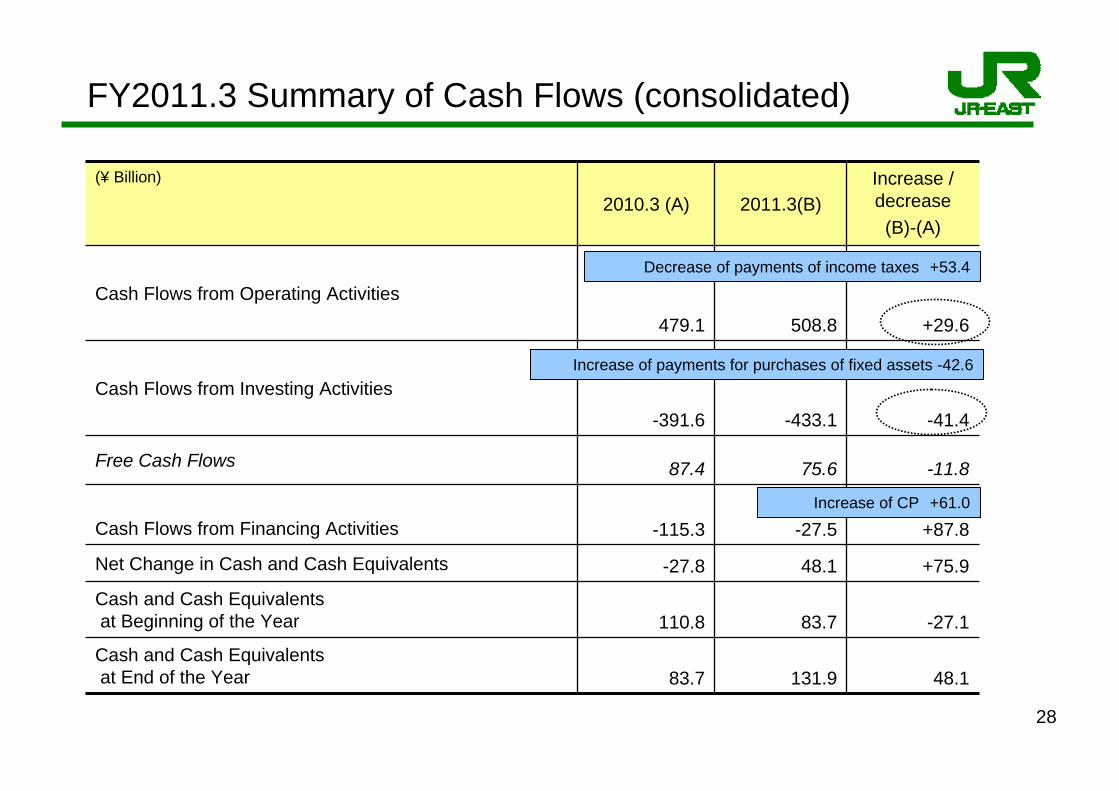
FY2011.3 Summary of Cash Flows (consolidated)
(¥ Billion)
2010.3 (A) 2011.3(B)Increase /decrease(B)-(A)
Cash Flows from Operating Activities
479.1 508.8 +29.6
Cash Flows from Investing Activities
-391.6 -433.1 -41.4
Free Cash Flows 87.4 75.6 -11.8
Cash Flows from Financing Activities -115.3 -27.5 +87.8
Net Change in Cash and Cash Equivalents -27.8 48.1 +75.9
Cash and Cash Equivalentsat Beginning of the Year 110.8 83.7 -27.1
Cash and Cash Equivalentsat End of the Year 83.7 131.9 48.1
Decrease of payments of income taxes +53.4
Increase of payments for purchases of fixed assets -42.6
Increase of CP +61.0
2929
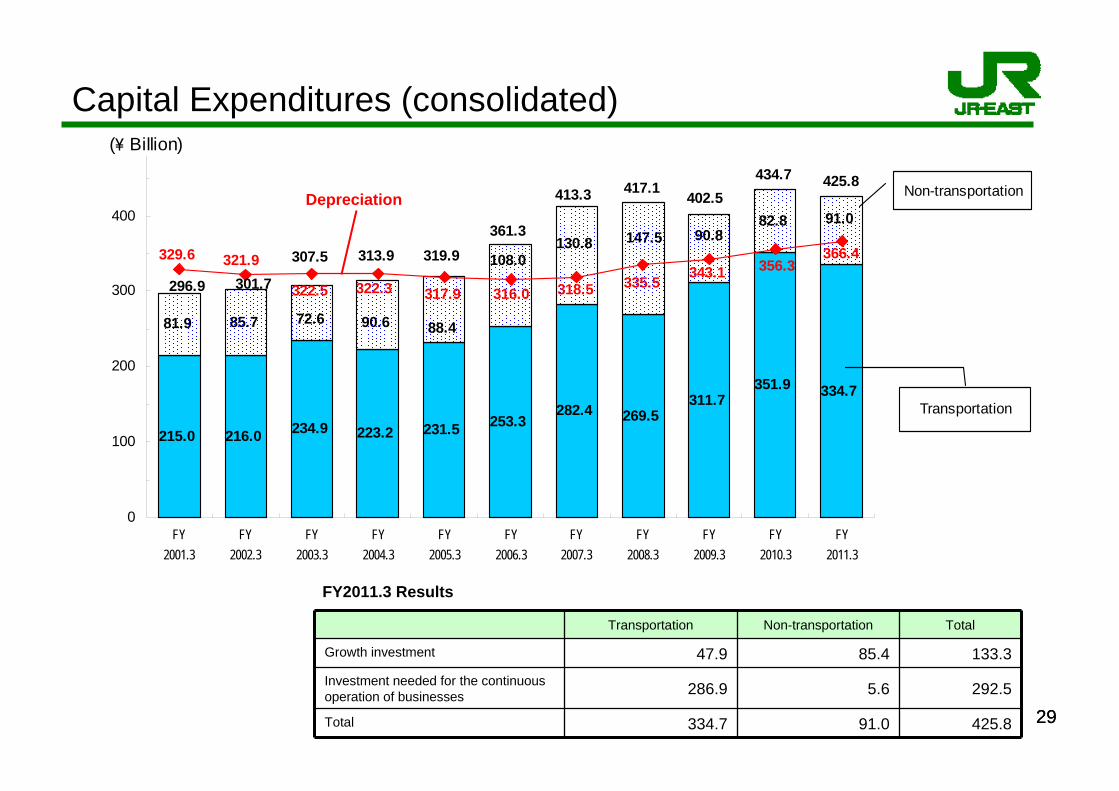
215.0 216.0 234.9 223.2 231.5 253.3282.4 269.5
311.7351.9 334.7
81.9 85.7
82.8 91.0
88.4
108.0147.5 90.8130.8
90.672.6
434.7402.5417.1413.3
361.3
296.9
319.9
301.7
307.5 313.9
425.8
329.6 321.9
322.5 322.3 317.9 316.0 318.5 335.5 343.1 356.3366.4
0
100
200
300
400
FY2001.3
FY2002.3
FY2003.3
FY2004.3
FY2005.3
FY2006.3
FY2007.3
FY2008.3
FY2009.3
FY2010.3
FY2011.3
(\ Billion)
Transportation
Non-transportation
Transportation Non-transportation Total
Growth investment 47.9 85.4 133.3Investment needed for the continuous operation of businesses 286.9 5.6 292.5
Total 334.7 91.0 425.8
Capital Expenditures (consolidated)
Depreciation
FY2011.3 Results
3030
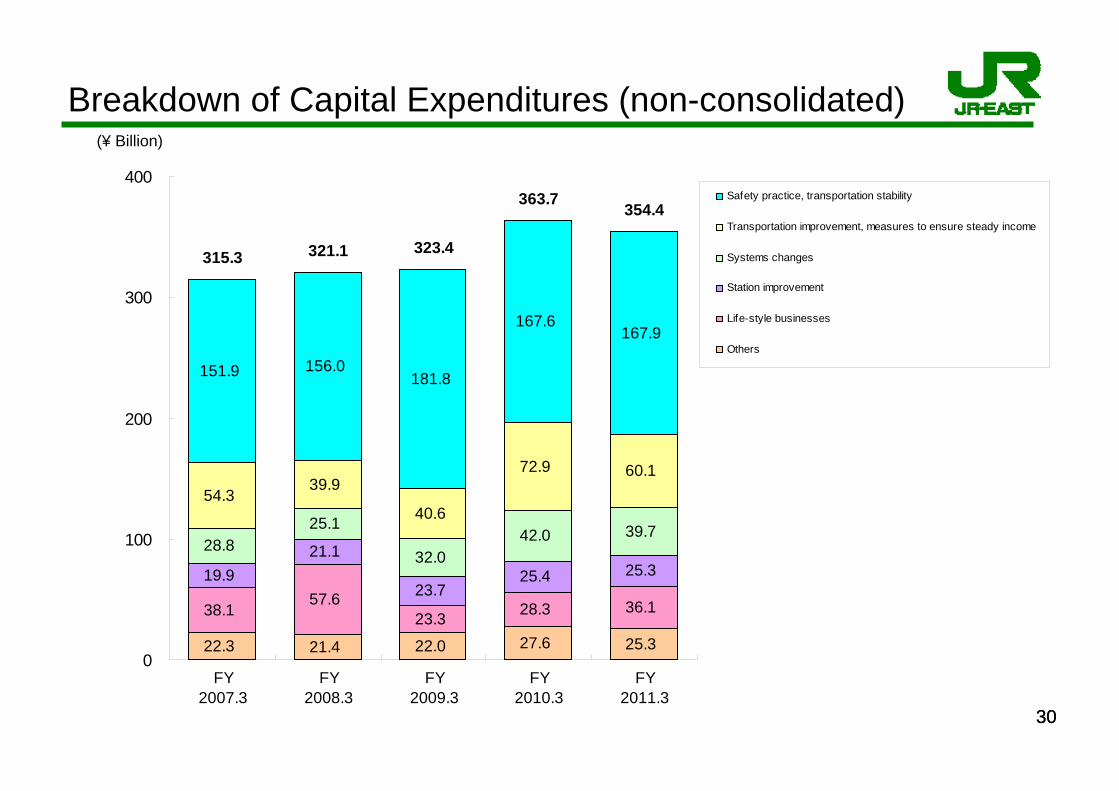
22.3 21.4 22.0 27.6 25.3
38.157.6
23.3 28.3 36.1
19.921.1
23.725.4 25.3
28.825.1
32.042.0 39.7
54.339.9
40.6
72.9 60.1
156.0181.8
167.6167.9
151.9
315.3 321.1 323.4
354.4363.7
0
100
200
300
400
FY2007.3
FY2008.3
FY2009.3
FY2010.3
FY2011.3
Safety practice, transportation stability
Transportation improvement, measures to ensure steady income
Systems changes
Station improvement
Life-style businesses
Others
(¥ Billion)
Breakdown of Capital Expenditures (non-consolidated)
3131* ( ): Average interest rate for existing debt (%)
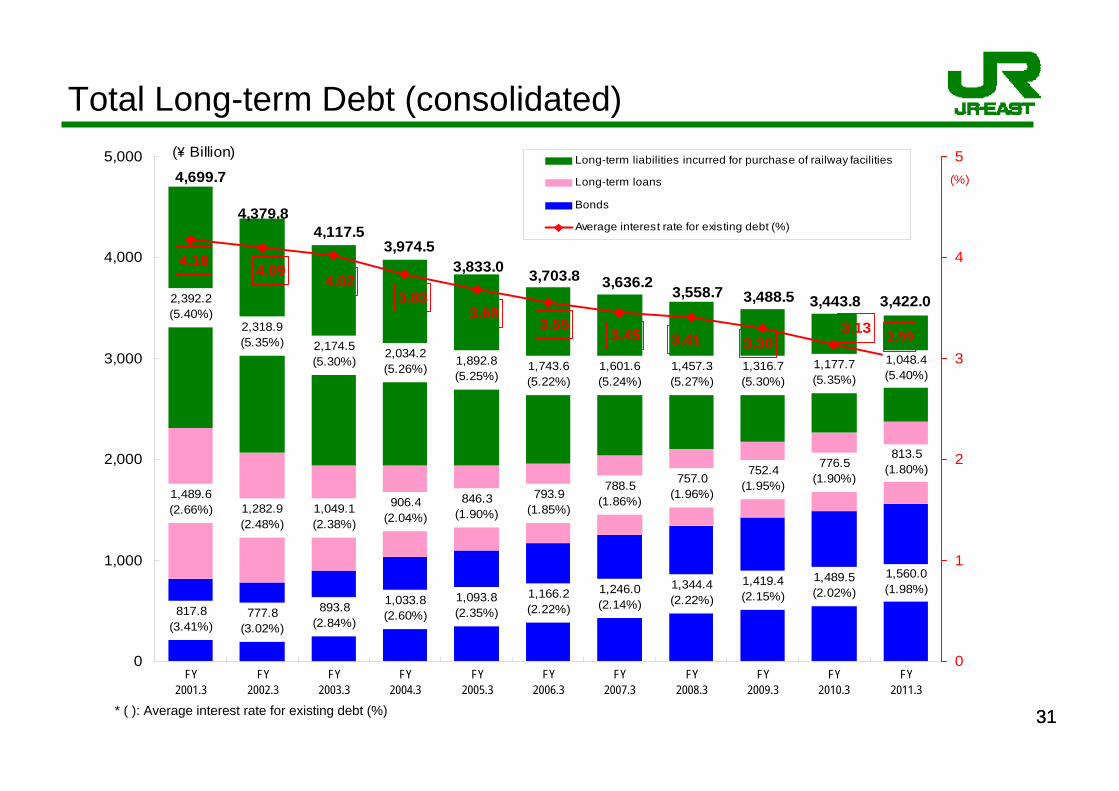
Total Long-term Debt (consolidated)
1,560.0(1.98%)
1,489.5(2.02%)
1,419.4(2.15%)
1,344.4(2.22%)
1,246.0(2.14%)
1,166.2(2.22%)
1,093.8(2.35%)
1,033.8(2.60%)
893.8(2.84%)
777.8(3.02%)
817.8(3.41%)
813.5(1.80%)776.5
(1.90%)752.4
(1.95%)757.0(1.96%)
788.5(1.86%)793.9
(1.85%)846.3
(1.90%)906.4
(2.04%)1,049.1(2.38%)
1,282.9(2.48%)
1,489.6(2.66%)
1,048.4(5.40%)
1,177.7(5.35%)
1,316.7(5.30%)
1,457.3(5.27%)
1,601.6(5.24%)
1,743.6(5.22%)
1,892.8(5.25%)
2,034.2(5.26%)
2,174.5(5.30%)
2,318.9(5.35%)
2,392.2(5.40%)
2.993.133.303.413.45
3.553.68
3.834.02
4.094.18
0
1,000
2,000
3,000
4,000
5,000
FY2001.3
FY2002.3
FY2003.3
FY2004.3
FY2005.3
FY2006.3
FY2007.3
FY2008.3
FY2009.3
FY2010.3
FY2011.3
0
1
2
3
4
5Long-term liabilities incurred for purchase of railway facilities
Long-term loans
Bonds
Average interest rate for existing debt (%)
(\ Billion)
4,699.7
3,703.8
4,379.84,117.5
3,974.53,833.0
3,636.23,488.5 3,443.83,558.7
(%)
3,422.0

IV. Reference Material (Data)
33
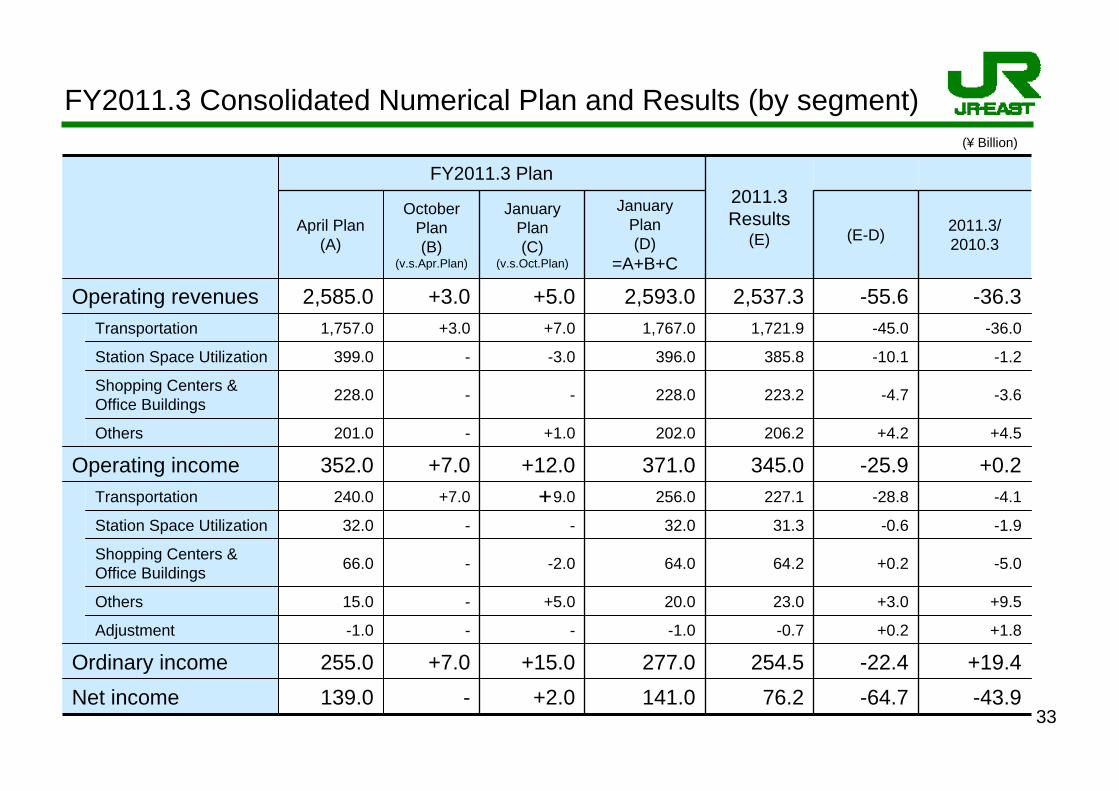
(¥ Billion)
76.2254.5
-0.7
23.0
64.2
31.3
227.1
345.0206.2
223.2
385.8
1,721.9
2,537.3
2011.3Results
(E)
-64.7-22.4
+0.2
+3.0
+0.2
-0.6
-28.8
-25.9+4.2
-4.7
-10.1
-45.0
-55.6
(E-D)
141.0277.0
-1.0
20.0
64.0
32.0
256.0
371.0202.0
228.0
396.0
1,767.0
2,593.0
January Plan(D)
=A+B+C
+9.5+5.0-15.0Others
Adjustment
Shopping Centers & Office Buildings
Station Space Utilization
Transportation
Others
Shopping Centers & Office Buildings
Station Space Utilization
Transportation
-4.1+9.0+7.0240.0
-1.9--32.0
-5.0-2.0-66.0
+1.8---1.0
-36.0+7.0+3.01,757.0
-1.2-3.0-399.0
-3.6--228.0
+4.5+1.0-201.0
2011.3/2010.3
-43.9+19.4
+0.2
-36.3
+2.0+15.0
+12.0
+5.0
JanuaryPlan(C)
(v.s.Oct.Plan)
October Plan(B)
(v.s.Apr.Plan)
April Plan(A)
-+7.0
+7.0
+3.0
139.0Net income255.0Ordinary income
352.0Operating income
2,585.0Operating revenues
FY2011.3 Plan
FY2011.3 Consolidated Numerical Plan and Results (by segment)
34
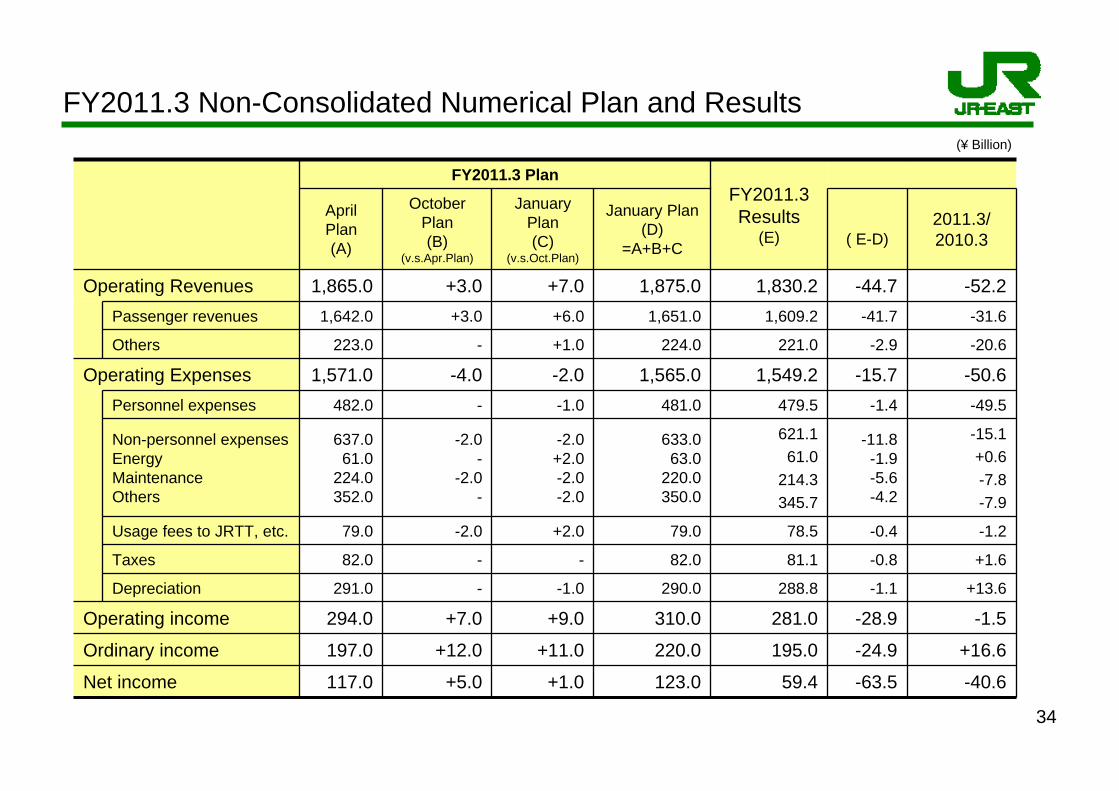
FY2011.3 Non-Consolidated Numerical Plan and Results
59.4
195.0
281.0
288.8
81.1
78.5
621.161.0
214.3345.7
479.5
1,549.2
221.0
1,609.2
1,830.2
FY2011.3Results
(E)
-63.5
-24.9
-28.9
-1.1
-0.8
-0.4
-11.8-1.9-5.6-4.2
-1.4
-15.7
-2.9
-41.7
-44.7
( E-D)
123.0
220.0
310.0
290.0
82.0
79.0
633.063.0
220.0350.0
481.0
1,565.0
224.0
1,651.0
1,875.0
January Plan(D)
=A+B+C
2011.3/2010.3
April Plan(A)
+5.0
+12.0
+7.0
-
-
-2.0
-2.0-
-2.0-
-
-4.0
-
+3.0
+3.0
October Plan(B)
(v.s.Apr.Plan)
-40.6
+16.6
-1.5
+13.6
+1.6
-1.2
-15.1+0.6-7.8-7.9
-49.5
-50.6
-20.6
-31.6
-52.2
January Plan(C)
(v.s.Oct.Plan)
+1.0
+11.0
+9.0
-2.0
+7.0
+1.0
+6.0
Others
Passenger revenues
223.0
1,642.0
1,571.0Operating Expenses
197.0Ordinary income
294.0Operating income
-1.0482.0Personnel expenses
-2.0+2.0-2.0-2.0
637.061.0
224.0352.0
Non-personnel expensesEnergyMaintenanceOthers
-1.0291.0Depreciation
Net income
-82.0Taxes
+2.0
FY2011.3 Plan
117.0
79.0Usage fees to JRTT, etc.
1,865.0Operating Revenues
(¥ Billion)
35
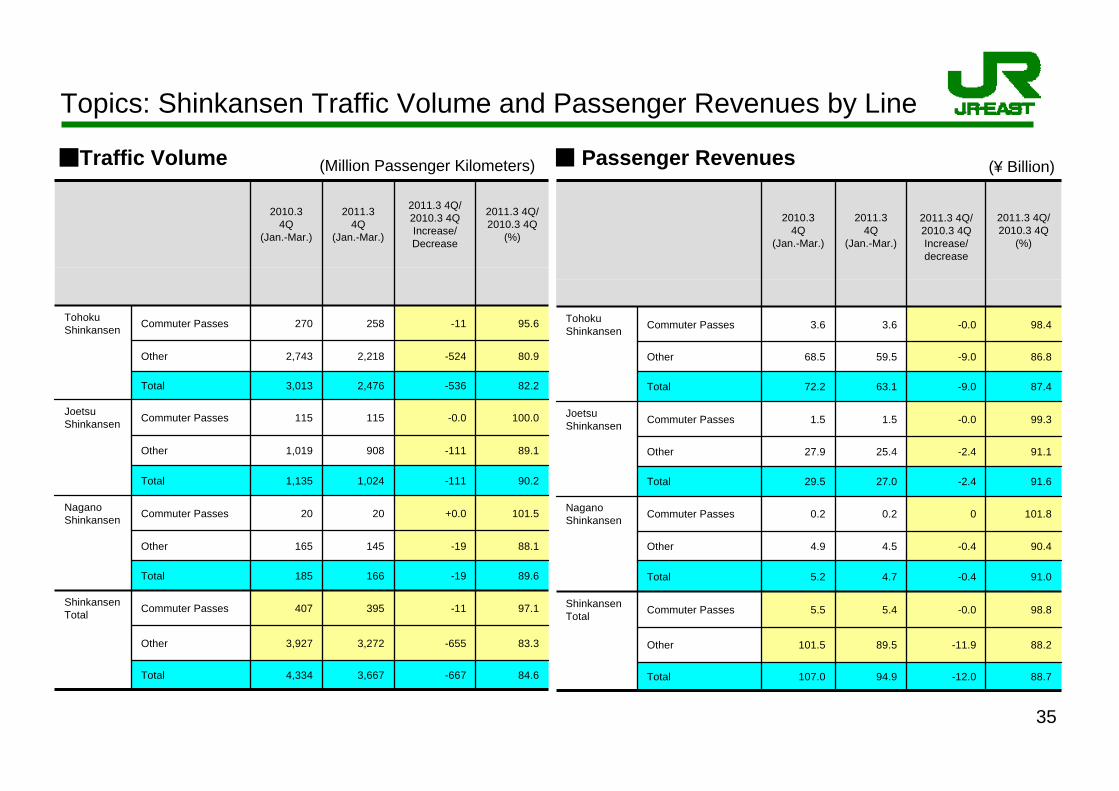
Topics: Shinkansen Traffic Volume and Passenger Revenues by Line
84.6-6673,6674,334Total
83.3-6553,2723,927Other
97.1-11395407Commuter PassesShinkansenTotal
89.6-19166185Total
88.1-19145165Other
101.5+0.02020Commuter PassesNaganoShinkansen
90.2-1111,0241,135Total
89.1-1119081,019Other
100.0-0.0115115Commuter PassesJoetsuShinkansen
82.2-5362,4763,013Total
80.9-5242,2182,743Other
95.6-11258270Commuter PassesTohokuShinkansen
2011.3 4Q/2010.3 4Q
(%)
2011.3 4Q/2010.3 4QIncrease/Decrease
2011.34Q
(Jan.-Mar.)
2010.34Q
(Jan.-Mar.)
88.7-12.094.9107.0Total
88.2-11.989.5101.5Other
98.8-0.05.45.5Commuter PassesShinkansenTotal
91.0-0.44.75.2Total
90.4-0.44.54.9Other
101.800.20.2Commuter PassesNaganoShinkansen
91.6-2.427.029.5Total
91.1-2.425.427.9Other
99.3-0.01.51.5Commuter PassesJoetsuShinkansen
87.4-9.063.172.2Total
86.8-9.059.568.5Other
98.4-0.03.63.6Commuter PassesTohokuShinkansen
2011.3 4Q/2010.3 4Q
(%)
2011.3 4Q/2010.3 4QIncrease/decrease
2011.34Q
(Jan.-Mar.)
2010.34Q
(Jan.-Mar.)
(Million Passenger Kilometers)■Traffic Volume ■ Passenger Revenues (¥ Billion)
36
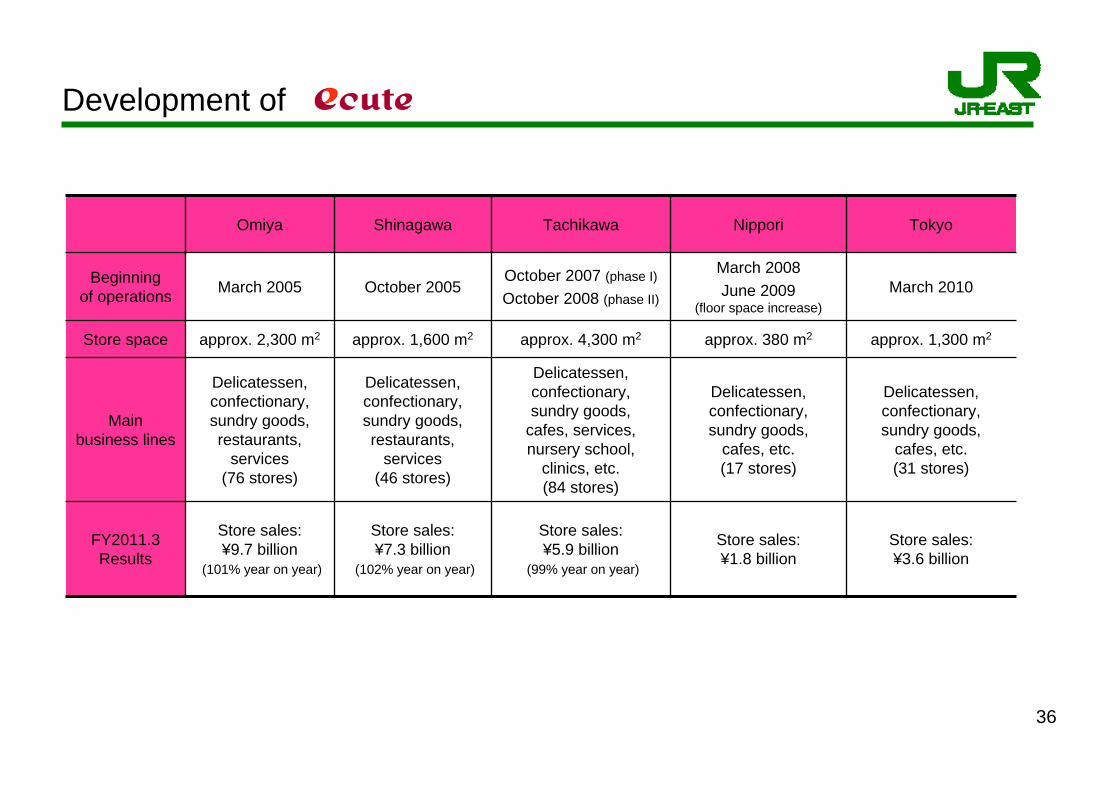
Omiya Shinagawa Tachikawa Nippori Tokyo
Beginning of operations March 2005 October 2005
October 2007 (phase I)
October 2008 (phase II)
March 2008June 2009
(floor space increase)March 2010
Store space approx. 2,300 m2 approx. 1,600 m2 approx. 4,300 m2 approx. 380 m2 approx. 1,300 m2
Mainbusiness lines
Delicatessen, confectionary, sundry goods, restaurants,
services (76 stores)
Delicatessen, confectionary, sundry goods, restaurants,
services (46 stores)
Delicatessen, confectionary,sundry goods,
cafes, services, nursery school,
clinics, etc.(84 stores)
Delicatessen, confectionary,sundry goods,
cafes, etc.(17 stores)
Delicatessen, confectionary,sundry goods,
cafes, etc.(31 stores)
FY2011.3 Results
Store sales: ¥9.7 billion
(101% year on year)
Store sales: ¥7.3 billion
(102% year on year)
Store sales: ¥5.9 billion
(99% year on year)
Store sales: ¥1.8 billion
Store sales: ¥3.6 billion
Development of
37
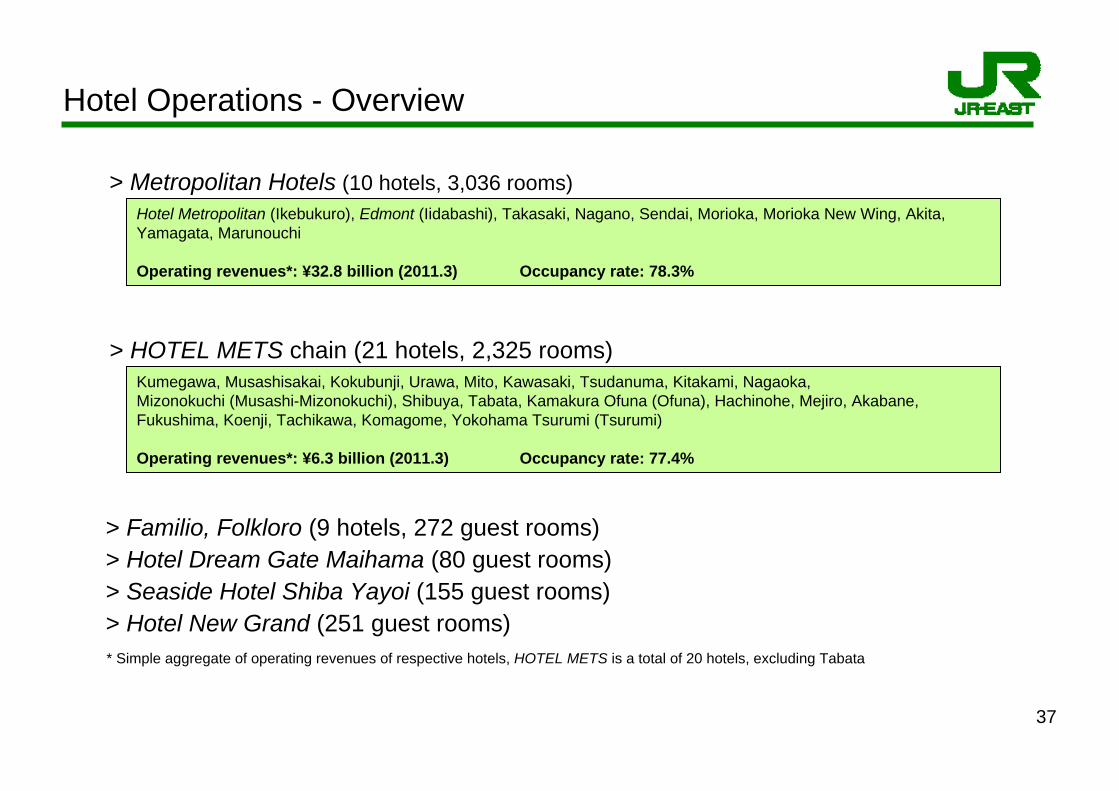
Hotel Operations - Overview
> Metropolitan Hotels (10 hotels, 3,036 rooms)
> HOTEL METS chain (21 hotels, 2,325 rooms)
> Familio, Folkloro (9 hotels, 272 guest rooms)> Hotel Dream Gate Maihama (80 guest rooms)> Seaside Hotel Shiba Yayoi (155 guest rooms)> Hotel New Grand (251 guest rooms)* Simple aggregate of operating revenues of respective hotels, HOTEL METS is a total of 20 hotels, excluding Tabata
Hotel Metropolitan (Ikebukuro), Edmont (Iidabashi), Takasaki, Nagano, Sendai, Morioka, Morioka New Wing, Akita, Yamagata, Marunouchi
Operating revenues*: ¥32.8 billion (2011.3) Occupancy rate: 78.3%
Kumegawa, Musashisakai, Kokubunji, Urawa, Mito, Kawasaki, Tsudanuma, Kitakami, Nagaoka, Mizonokuchi (Musashi-Mizonokuchi), Shibuya, Tabata, Kamakura Ofuna (Ofuna), Hachinohe, Mejiro, Akabane, Fukushima, Koenji, Tachikawa, Komagome, Yokohama Tsurumi (Tsurumi)
Operating revenues*: ¥6.3 billion (2011.3) Occupancy rate: 77.4%
38
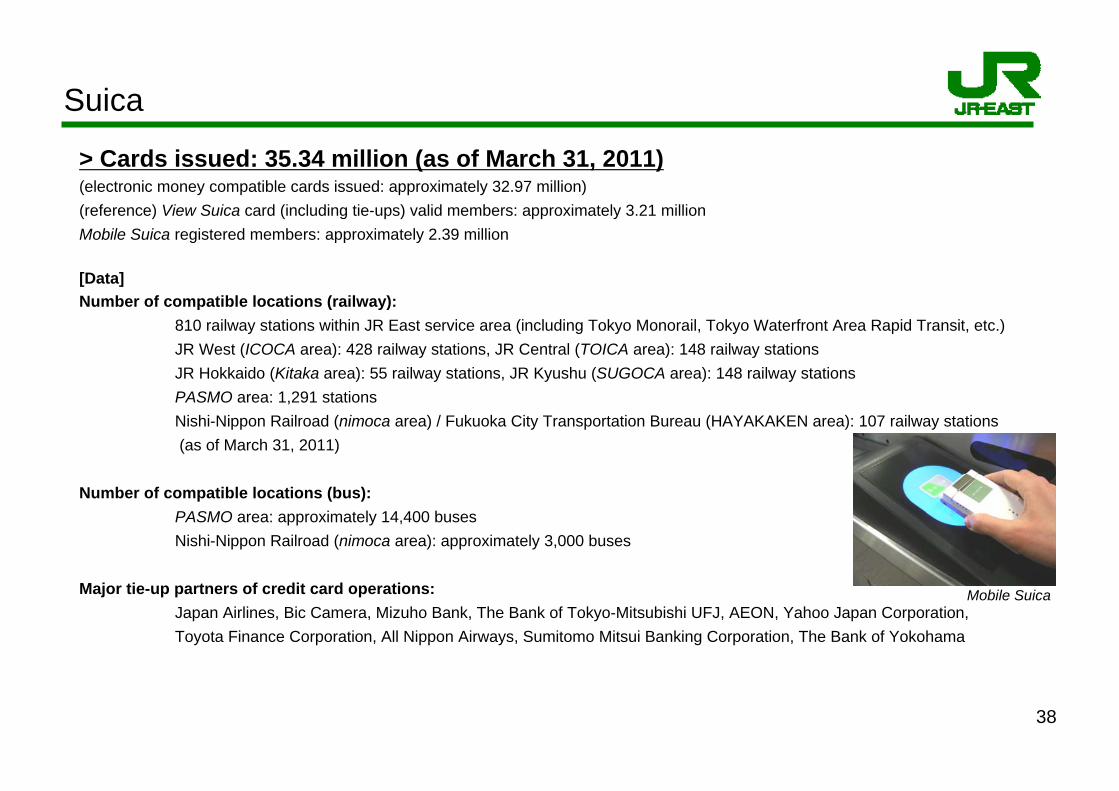
Mobile Suica
> Cards issued: 35.34 million (as of March 31, 2011)(electronic money compatible cards issued: approximately 32.97 million) (reference) View Suica card (including tie-ups) valid members: approximately 3.21 millionMobile Suica registered members: approximately 2.39 million
[Data]Number of compatible locations (railway):
810 railway stations within JR East service area (including Tokyo Monorail, Tokyo Waterfront Area Rapid Transit, etc.)JR West (ICOCA area): 428 railway stations, JR Central (TOICA area): 148 railway stationsJR Hokkaido (Kitaka area): 55 railway stations, JR Kyushu (SUGOCA area): 148 railway stationsPASMO area: 1,291 stationsNishi-Nippon Railroad (nimoca area) / Fukuoka City Transportation Bureau (HAYAKAKEN area): 107 railway stations(as of March 31, 2011)
Number of compatible locations (bus):PASMO area: approximately 14,400 busesNishi-Nippon Railroad (nimoca area): approximately 3,000 buses
Major tie-up partners of credit card operations:Japan Airlines, Bic Camera, Mizuho Bank, The Bank of Tokyo-Mitsubishi UFJ, AEON, Yahoo Japan Corporation,Toyota Finance Corporation, All Nippon Airways, Sumitomo Mitsui Banking Corporation, The Bank of Yokohama
Suica
39
0
10,000
20,000
30,000
40,000
50,000
60,000
70,000
80,000
90,000
100,000
110,000
120,000
130,000
140,000
150,000
'04/3 '05/3 '06/3 '07/3 '08/3 '09/3 '10/3
(Compatible stores)
0.00.10.20.30.40.50.60.70.80.91.01.11.21.31.41.51.61.71.81.92.02.12.22.32.42.5
(Transactions per day : millions)
Other Suica compatible stores
Suica compatible stores outside stations
Suica compatible stores in stationsTransactions per day
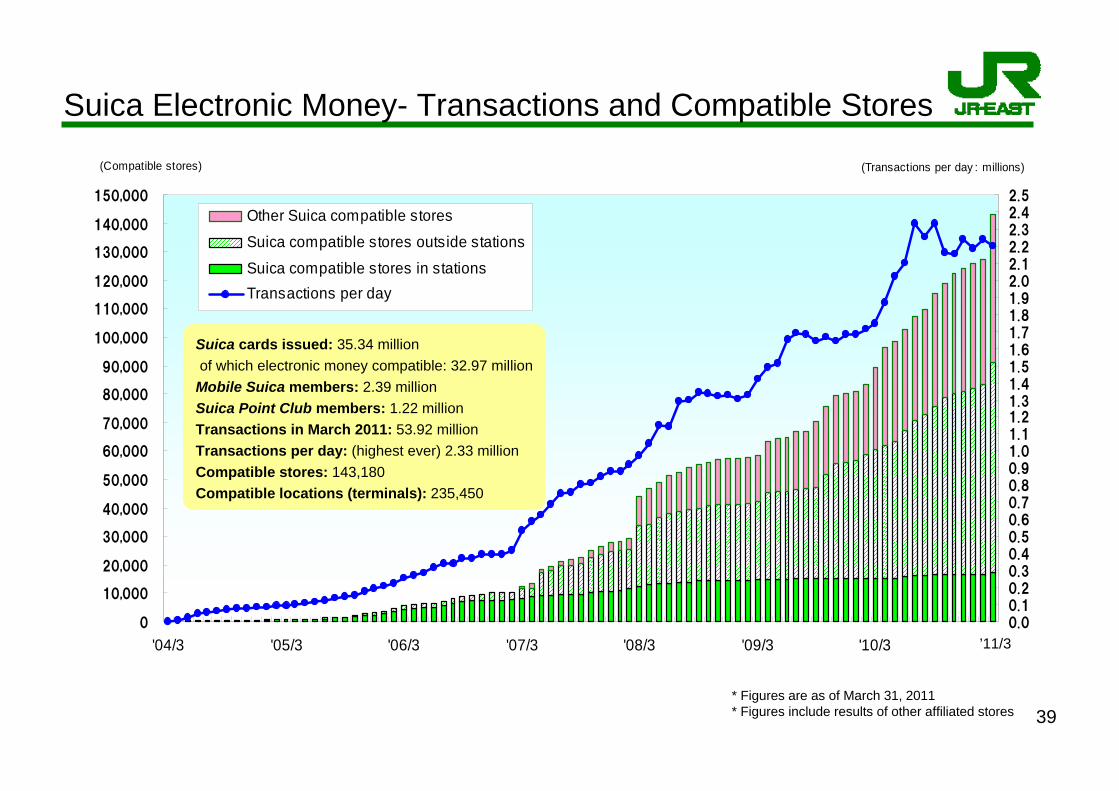
Suica Electronic Money- Transactions and Compatible Stores
* Figures are as of March 31, 2011* Figures include results of other affiliated stores
Suica cards issued: 35.34 millionof which electronic money compatible: 32.97 million
Mobile Suica members: 2.39 millionSuica Point Club members: 1.22 millionTransactions in March 2011: 53.92 millionTransactions per day: (highest ever) 2.33 millionCompatible stores: 143,180Compatible locations (terminals): 235,450
’11/3
40
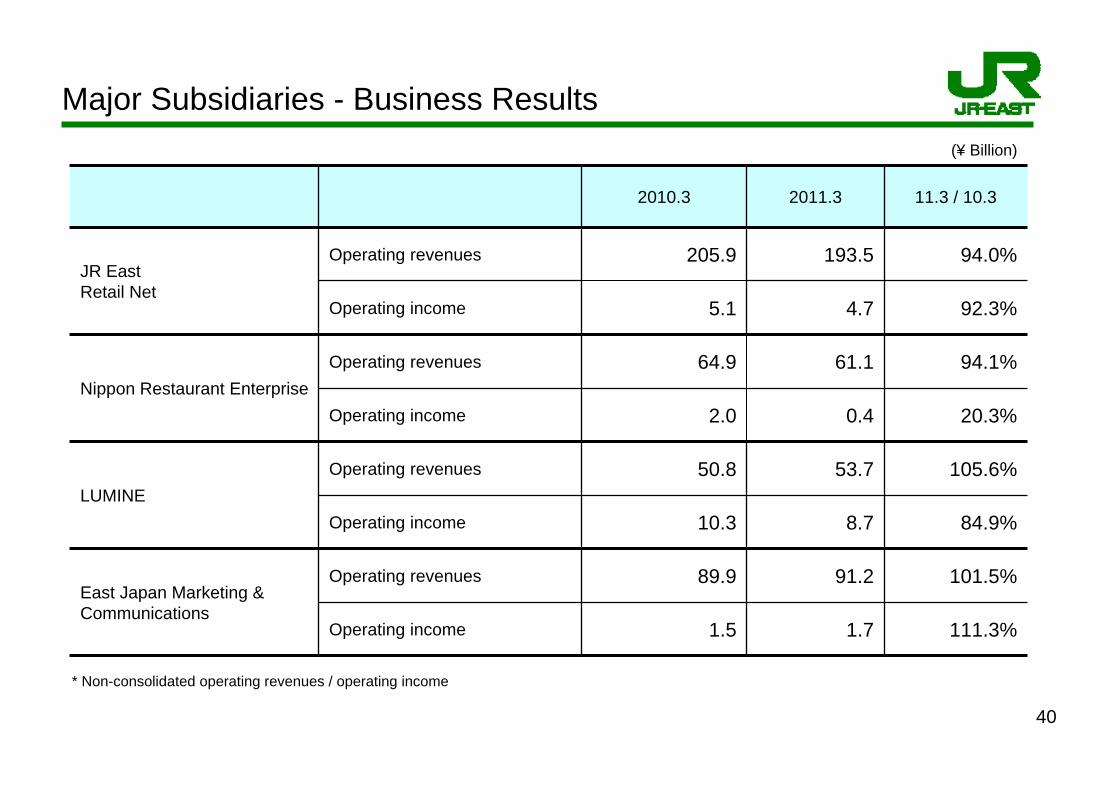
(¥ Billion)
2010.3 2011.3 11.3 / 10.3
JR EastRetail Net
Operating revenues 205.9 193.5 94.0%
Operating income 5.1 4.7 92.3%
Nippon Restaurant EnterpriseOperating revenues 64.9 61.1 94.1%
Operating income 2.0 0.4 20.3%
LUMINEOperating revenues 50.8 53.7 105.6%
Operating income 10.3 8.7 84.9%
East Japan Marketing &Communications
Operating revenues 89.9 91.2 101.5%
Operating income 1.5 1.7 111.3%
* Non-consolidated operating revenues / operating income
Major Subsidiaries - Business Results
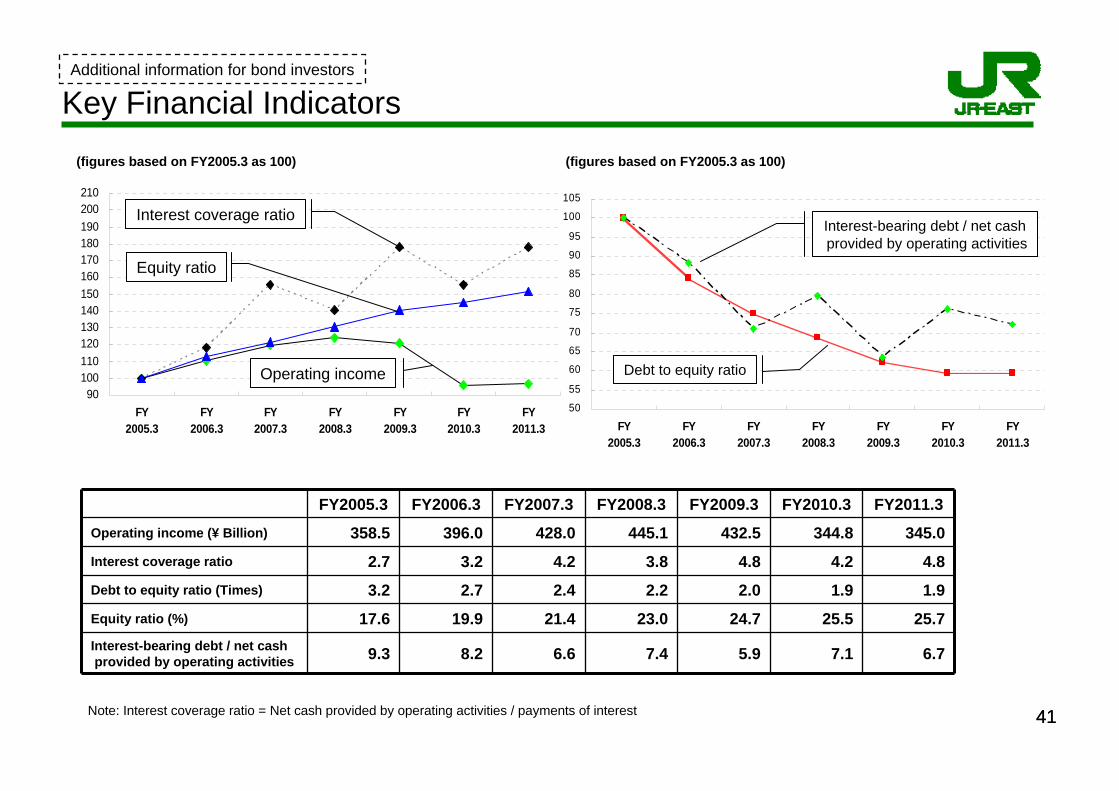
4141Note: Interest coverage ratio = Net cash provided by operating activities / payments of interest
Additional information for bond investors
Key Financial Indicators
FY2005.3 FY2006.3 FY2007.3 FY2008.3 FY2009.3 FY2010.3 FY2011.3Operating income (¥ Billion) 358.5 396.0 428.0 445.1 432.5 344.8 345.0Interest coverage ratio 2.7 3.2 4.2 3.8 4.8 4.2 4.8Debt to equity ratio (Times) 3.2 2.7 2.4 2.2 2.0 1.9 1.9Equity ratio (%) 17.6 19.9 21.4 23.0 24.7 25.5 25.7Interest-bearing debt / net cashprovided by operating activities 9.3 8.2 6.6 7.4 5.9 7.1 6.7
90100110120130140150160170180190200210
FY2005.3
FY2006.3
FY2007.3
FY2008.3
FY2009.3
FY2010.3
FY2011.3
50
55
60
65
70
75
80
85
90
95
100
105
FY2005.3
FY2006.3
FY2007.3
FY2008.3
FY2009.3
FY2010.3
FY2011.3
(figures based on FY2005.3 as 100)
Interest coverage ratio
Equity ratio
Operating income Debt to equity ratio
Interest-bearing debt / net cashprovided by operating activities
(figures based on FY2005.3 as 100)
42
Additional information for bond investors
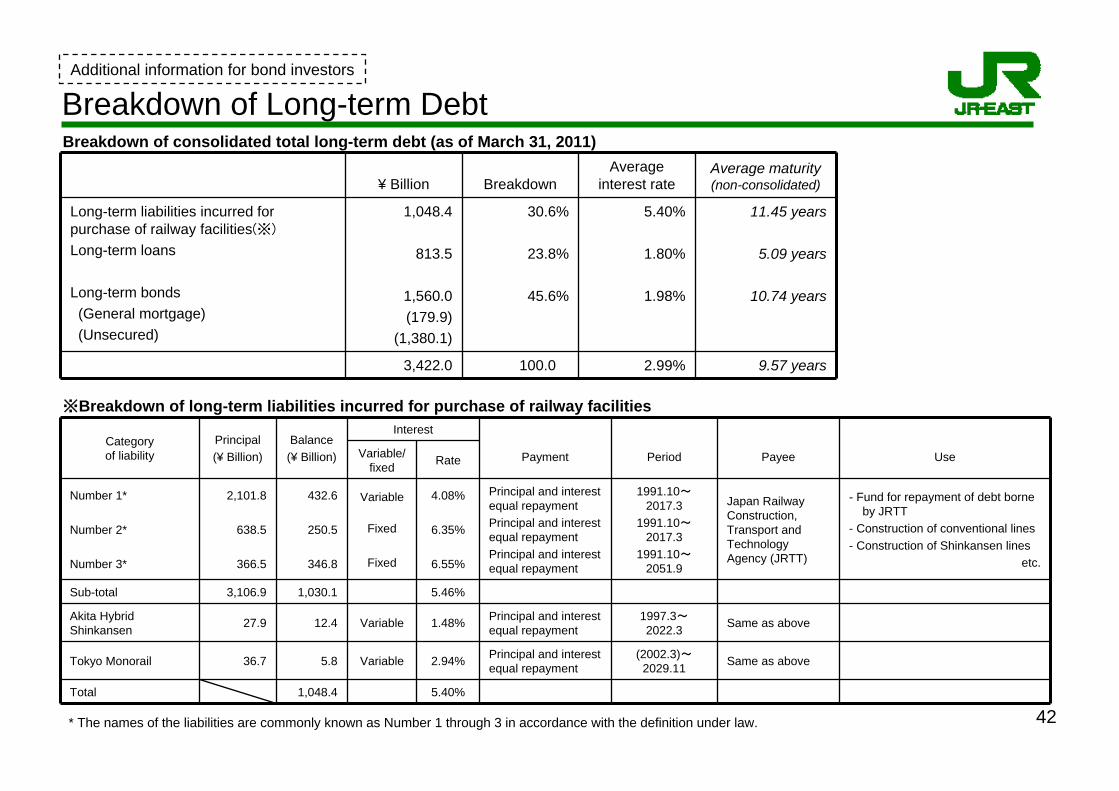
Breakdown of Long-term Debt
※Breakdown of long-term liabilities incurred for purchase of railway facilities
* The names of the liabilities are commonly known as Number 1 through 3 in accordance with the definition under law.
¥ Billion BreakdownAverage
interest rateAverage maturity(non-consolidated)
Long-term liabilities incurred for purchase of railway facilities(※)
Long-term loans
Long-term bonds(General mortgage)(Unsecured)
1,048.4
813.5
1,560.0(179.9)
(1,380.1)
30.6%
23.8%
45.6%
5.40%
1.80%
1.98%
11.45 years
5.09 years
10.74 years
3,422.0 100.0% 2.99% 9.57 years
Breakdown of consolidated total long-term debt (as of March 31, 2011)
Categoryof liability
Principal(¥ Billion)
Balance(¥ Billion)
Interest
Payment Period Payee UseVariable/fixed Rate
Number 1*
Number 2*
Number 3*
2,101.8
638.5
366.5
432.6
250.5
346.8
Variable
Fixed
Fixed
4.08%
6.35%
6.55%
Principal and interestequal repaymentPrincipal and interestequal repaymentPrincipal and interestequal repayment
1991.10~2017.3
1991.10~2017.3
1991.10~2051.9
Japan RailwayConstruction,Transport andTechnologyAgency (JRTT)
- Fund for repayment of debt borneby JRTT
- Construction of conventional lines- Construction of Shinkansen lines
etc.
Sub-total 3,106.9 1,030.1 5.46%
Akita HybridShinkansen 27.9 12.4 Variable 1.48% Principal and interest
equal repayment1997.3~2022.3 Same as above
Tokyo Monorail 36.7 5.8 Variable 2.94% Principal and interestequal repayment
(2002.3)~2029.11 Same as above
Total 1,048.4 5.40%
4343
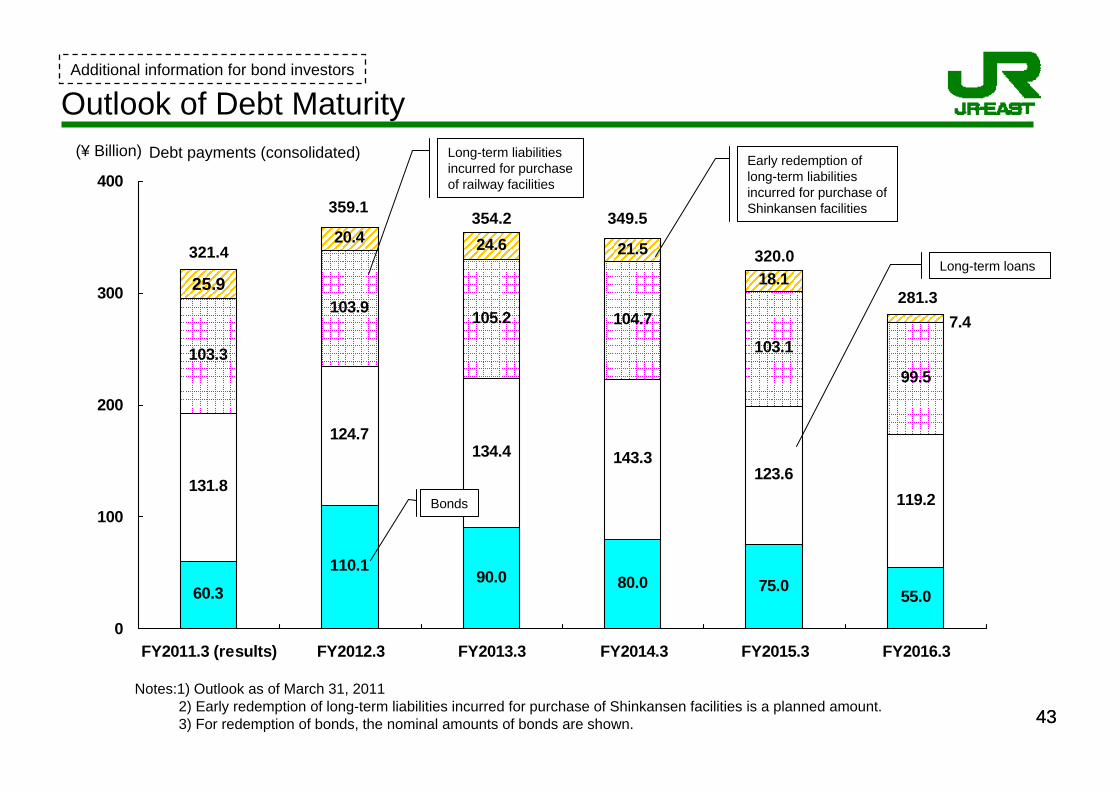
Additional information for bond investors
Outlook of Debt MaturityDebt payments (consolidated)(¥ Billion)
Notes:1) Outlook as of March 31, 20112) Early redemption of long-term liabilities incurred for purchase of Shinkansen facilities is a planned amount.3) For redemption of bonds, the nominal amounts of bonds are shown.
80.0 75.0 55.0
131.8
124.7134.4 143.3
123.6119.2
103.3
103.9 105.2 104.7
103.1
99.5
24.6 21.5
18.1
90.060.3
110.1
7.4
20.4
25.9
0
100
200
300
400
FY2011.3 (results) FY2012.3 FY2013.3 FY2014.3 FY2015.3 FY2016.3
Bonds
Long-term loans
Early redemption of long-term liabilities incurred for purchase of Shinkansen facilities
Long-term liabilities incurred for purchase of railway facilities
321.4
359.1354.2 349.5
320.0
281.3
4444
Additional information for bond investors
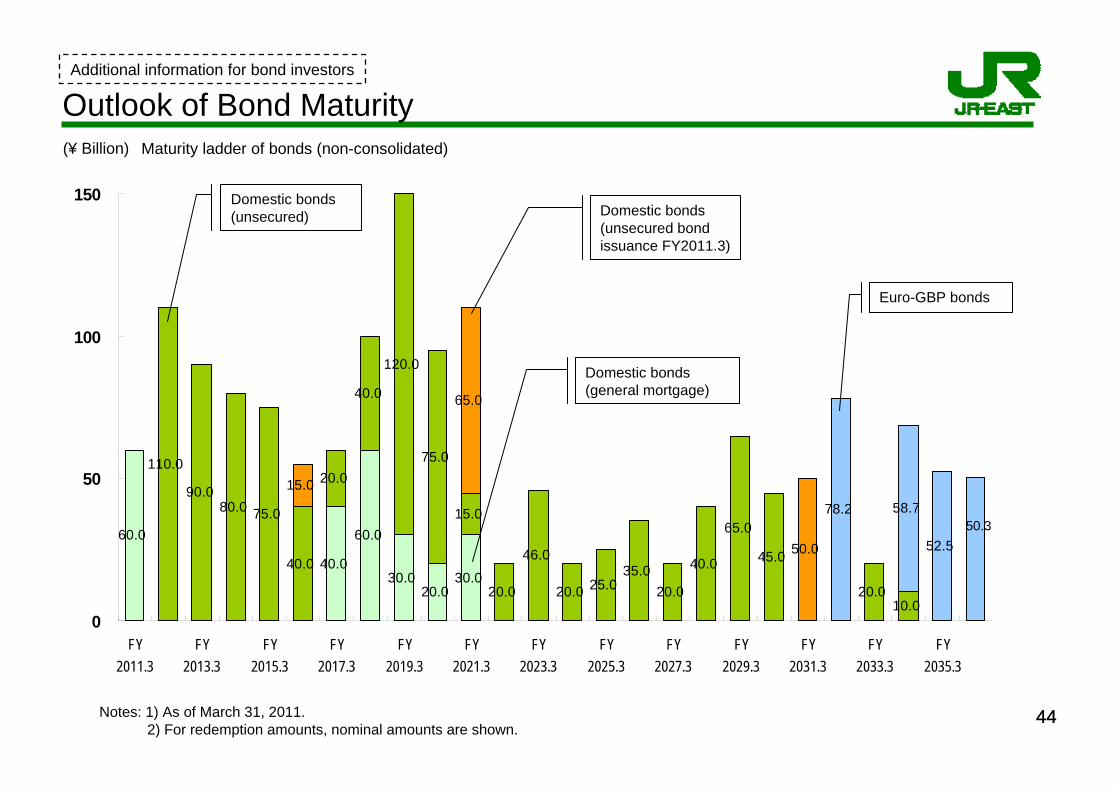
Outlook of Bond Maturity
Notes: 1) As of March 31, 2011.2) For redemption amounts, nominal amounts are shown.
60.0
40.0
60.0
30.020.0
30.0
110.0
90.080.0 75.0
40.0
20.0
40.0
120.0
75.0
15.0
20.0
46.0
20.0 25.035.0
20.0
40.0
65.0
45.0
20.010.0
78.2 58.7
52.5
15.0
65.0
50.0
0
50
100
150
FY2011.3
FY2013.3
FY2015.3
FY2017.3
FY2019.3
FY2021.3
FY2023.3
FY2025.3
FY2027.3
FY2029.3
FY2031.3
FY2033.3
FY2035.3
(¥ Billion) Maturity ladder of bonds (non-consolidated)
Domestic bonds (general mortgage)
Domestic bonds (unsecured) Domestic bonds
(unsecured bond issuance FY2011.3)
Euro-GBP bonds
50.3
45
Additional information for bond investors
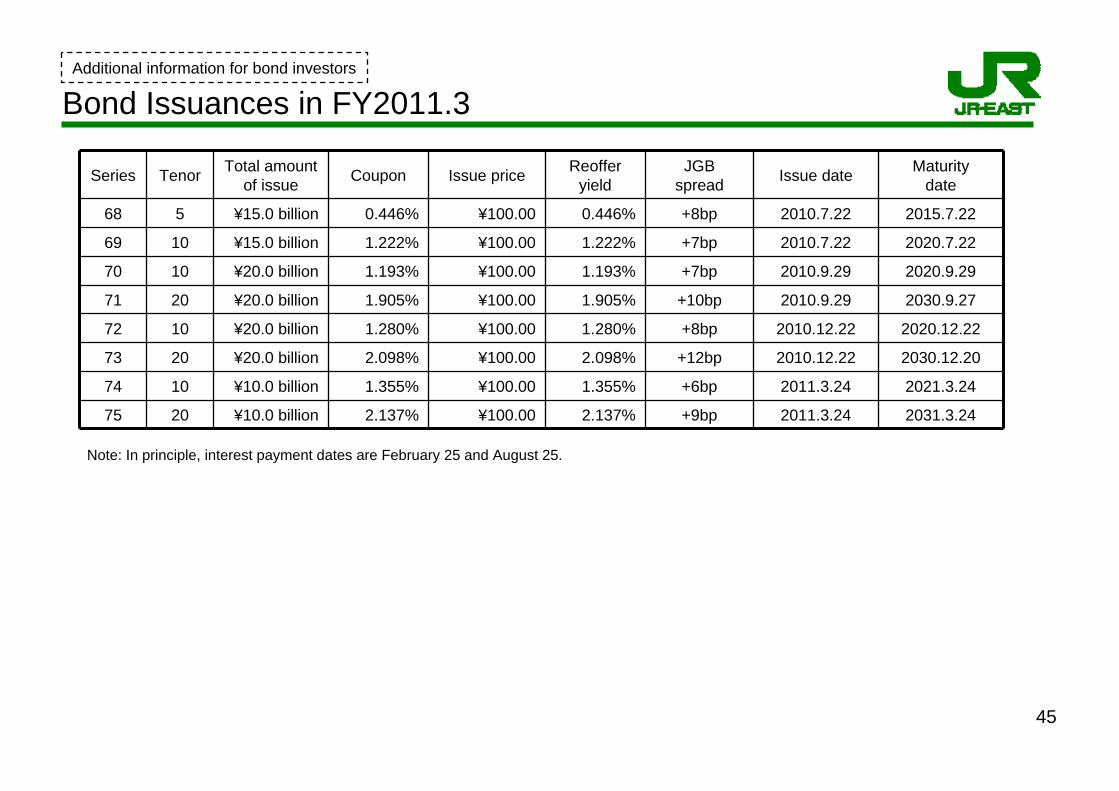
Note: In principle, interest payment dates are February 25 and August 25.
Series Tenor Total amountof issue Coupon Issue price Reoffer
yieldJGB
spread Issue date Maturitydate
68 5 ¥15.0 billion 0.446% ¥100.00 0.446% +8bp 2010.7.22 2015.7.22
69 10 ¥15.0 billion 1.222% ¥100.00 1.222% +7bp 2010.7.22 2020.7.22
70 10 ¥20.0 billion 1.193% ¥100.00 1.193% +7bp 2010.9.29 2020.9.29
71 20 ¥20.0 billion 1.905% ¥100.00 1.905% +10bp 2010.9.29 2030.9.27
72 10 ¥20.0 billion 1.280% ¥100.00 1.280% +8bp 2010.12.22 2020.12.22
73 20 ¥20.0 billion 2.098% ¥100.00 2.098% +12bp 2010.12.22 2030.12.20
74 10 ¥10.0 billion 1.355% ¥100.00 1.355% +6bp 2011.3.24 2021.3.24
75 20 ¥10.0 billion 2.137% ¥100.00 2.137% +9bp 2011.3.24 2031.3.24
Bond Issuances in FY2011.3
46
Additional information for bond investors
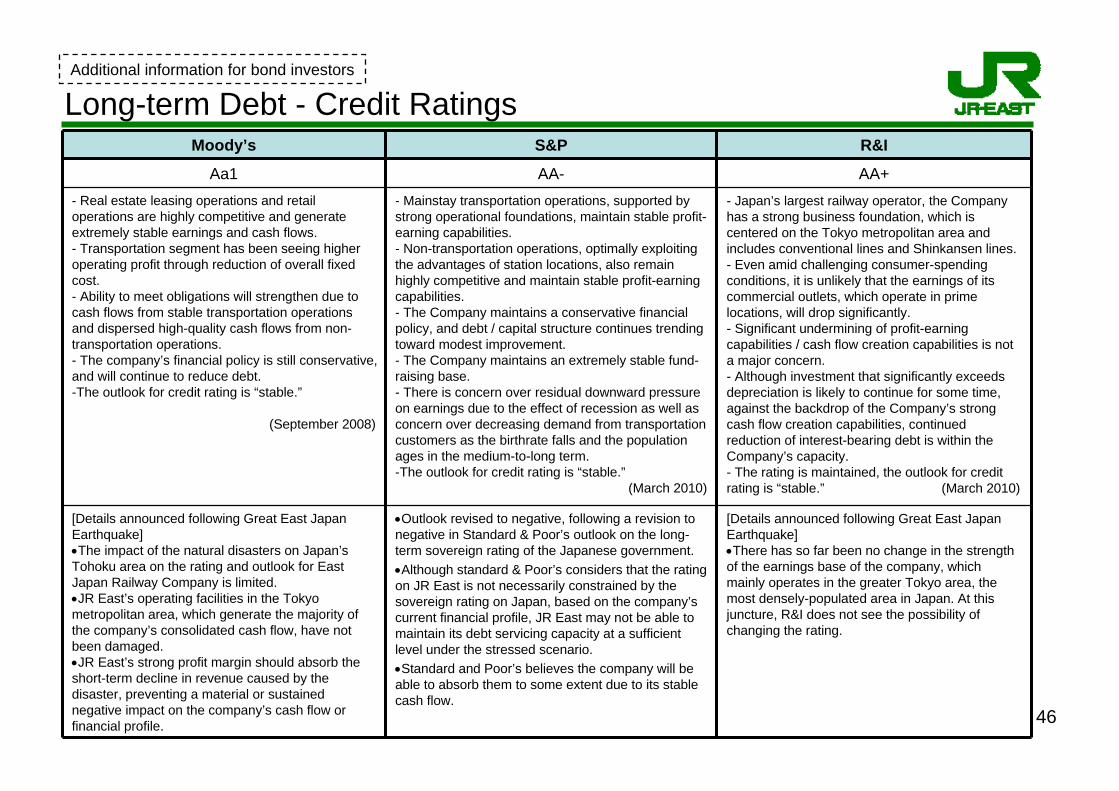
Moody’s S&P R&I
Aa1 AA- AA+- Real estate leasing operations and retail operations are highly competitive and generate extremely stable earnings and cash flows.- Transportation segment has been seeing higher operating profit through reduction of overall fixed cost.- Ability to meet obligations will strengthen due to cash flows from stable transportation operations and dispersed high-quality cash flows from non-transportation operations.- The company’s financial policy is still conservative, and will continue to reduce debt.-The outlook for credit rating is “stable.”
(September 2008)
- Mainstay transportation operations, supported by strong operational foundations, maintain stable profit-earning capabilities.- Non-transportation operations, optimally exploiting the advantages of station locations, also remain highly competitive and maintain stable profit-earning capabilities.- The Company maintains a conservative financial policy, and debt / capital structure continues trending toward modest improvement.- The Company maintains an extremely stable fund-raising base.- There is concern over residual downward pressure on earnings due to the effect of recession as well as concern over decreasing demand from transportation customers as the birthrate falls and the population ages in the medium-to-long term.-The outlook for credit rating is “stable.”
(March 2010)
- Japan’s largest railway operator, the Company has a strong business foundation, which is centered on the Tokyo metropolitan area and includes conventional lines and Shinkansen lines.- Even amid challenging consumer-spending conditions, it is unlikely that the earnings of its commercial outlets, which operate in prime locations, will drop significantly.- Significant undermining of profit-earning capabilities / cash flow creation capabilities is not a major concern.- Although investment that significantly exceeds depreciation is likely to continue for some time, against the backdrop of the Company’s strong cash flow creation capabilities, continued reduction of interest-bearing debt is within the Company’s capacity.- The rating is maintained, the outlook for credit rating is “stable.” (March 2010)
[Details announced following Great East Japan Earthquake]•The impact of the natural disasters on Japan’s Tohoku area on the rating and outlook for East Japan Railway Company is limited.•JR East’s operating facilities in the Tokyo metropolitan area, which generate the majority of the company’s consolidated cash flow, have not been damaged. •JR East’s strong profit margin should absorb the short-term decline in revenue caused by the disaster, preventing a material or sustained negative impact on the company’s cash flow or financial profile.
•Outlook revised to negative, following a revision to negative in Standard & Poor’s outlook on the long-term sovereign rating of the Japanese government.•Although standard & Poor’s considers that the rating on JR East is not necessarily constrained by the sovereign rating on Japan, based on the company’s current financial profile, JR East may not be able to maintain its debt servicing capacity at a sufficient level under the stressed scenario. •Standard and Poor’s believes the company will be able to absorb them to some extent due to its stable cash flow.
[Details announced following Great East Japan Earthquake]•There has so far been no change in the strength of the earnings base of the company, which mainly operates in the greater Tokyo area, the most densely-populated area in Japan. At this juncture, R&I does not see the possibility of changing the rating.
Long-term Debt - Credit Ratings

These materials and the video of the presentation can be viewed at the JR East’s web site.
JR East Web site, IR (Investor Relations)http://www.jreast.co.jp/e/investor/
Forward-Looking StatementsStatements contained in this report with respect to JR East’s plans, strategies, and beliefs that are not historical facts are forward-looking statements about the future performance of JR East, which are based on management’s assumptions and beliefs in light of the information currently available to it. These forward-looking statements involve known and unknown risks, uncertainties, and other factors that may cause JR East’s actual results, performance, or achievements to differ materially from the expectations expressed herein. These factors include, without limitation, (i) JR East’s ability to successfully maintain or increase current passenger levels on railway services, (ii) JR East’s ability to improve the profitability of railway and other operations, (iii) JR East’s ability to expand non-transportation operations, and (iv) general changes in economic conditions and laws, regulations, and government policies in Japan.