Financial Report - Finnair · 4 Financial Report ˜˚˛˛. ˝˙ˆ˜ ˇ,˘˘˘ , ˘ , ˘˘ ˘...
96
Group Report 2008 www.finnair.com/group Financial Report
Transcript of Financial Report - Finnair · 4 Financial Report ˜˚˛˛. ˝˙ˆ˜ ˇ,˘˘˘ , ˘ , ˘˘ ˘...
Group Report 2008 www.finnair.com/group
Financial Report

1
Financial Report
CONTENTS
Finnair Group Key Figures .......................................................2Board of Directors’ Report .....................................................4
Shares and Shareholders .......................................... 13Financial Indicators 2006–2008 ............................ 18Calculation of Key Indicators .................................. 19
Financial Statements, 1 January–31 December 2008 ... 21Consolidated Income Statement ........................... 22Consolidated Balance Sheet .................................... 23Consolidated Cash Flow Statement ...................... 24Shareholders’ Equity ................................................. 26Notes to the Financial Statements ........................ 27Board of Directors’ Proposal on the Dividend ... 79Auditors’ Report ......................................................... 80
Corporate Governance .......................................................... 81Risk Management .................................................................... 84Stock Exchange Releases in 2008 ....................................... 87The Brokerage Firms analysing Finnair Equity ................ 89Information for Shareholders .............................................. 90Contact Information .............................................................. 92

2 Financial Report
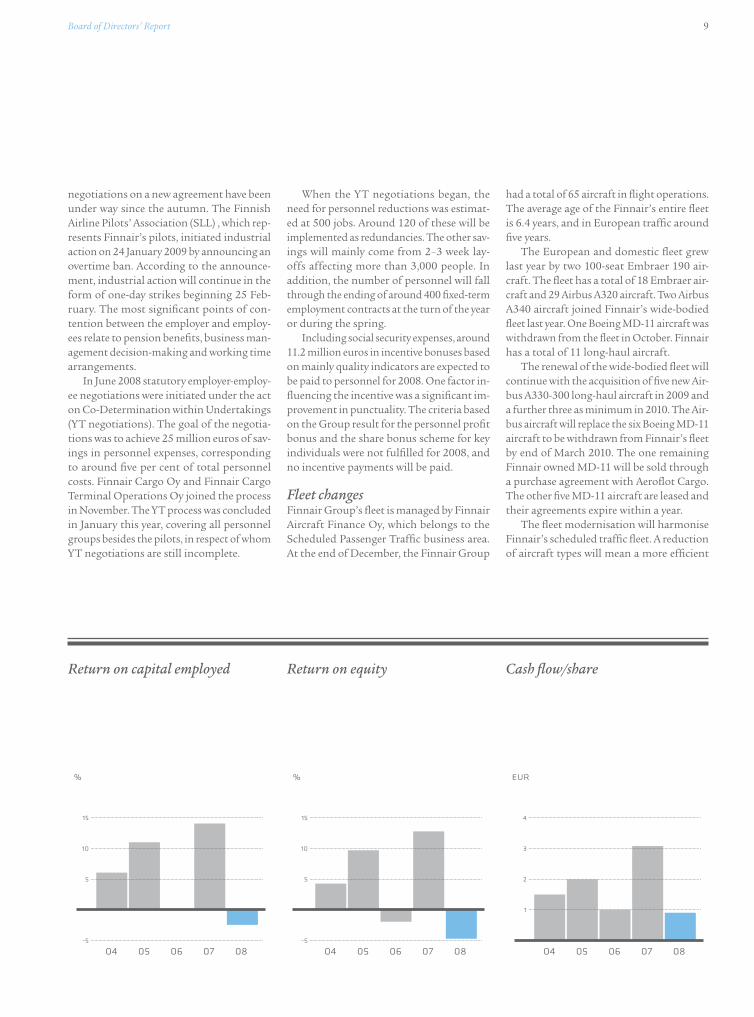
FINNAIR gRoup key FIguRes 2008 2007 2006Turnover EUR mill. 2,263 2,181 1,990Operating profit (adjusted), EBIT 1) EUR mill. 7 97 11Operating profit (adjusted), EBIT 1) % of turnover % 0.3 4.4 0.6Operating profit, EBIT EUR mill. -52 142 -11Result before taxes EUR mill. -56 139 -15Unit revenues on flight operations c/RTK 70.1 72.6 74.0Unit costs on flight operations c/ATK 43.5 43.5 46.0Earning per share EUR -0.33 1.04 -0.14Equity per share EUR 6.04 7.70 6.14Gross investment EUR mill. 233 326 252Interest-bearing net debt EUR mill. -90 -222 43Equity ratio % 38.1 47.1 37.2Gearing % -11.6 -22.5 7.1Adjusted gearing % 63.2 35.1 112.8Return on capital employed (ROCE) % -2.5 14.2 -0.1Average number of employees 9,595 9,480 9,598
1) Excluding capital gains, non recurring items and change in fait value of derivatives.
Finnair Group Key figures

Finnair Group Key Figures 3
FINNAIR gRoup FLeeT 31 DecembeR 2008Seats Number Owned Leased Average age
Airbus A319 105–123 11 7 4 7.2Airbus A320 111–159 12 6 6 6.4Airbus A321 136–196 6 4 2 7.9Airbus A340 269 5 5 0 3.6Boeing MD-11 282 6 1 5 14.2Boeing B757 227 7 0 7 9.6Embraer 170 76 10 6 4 2.7Embraer 190 100 8 4 4 1.4Total 65 33 32 6.4
FINNAIR TRAFFIc peRFoRmANce 2004–2008 2008 2007 2006 2005 2004Flight hours 232,389 228,487 211,813 202,070 196,795Flight kilometres 1,000 155,300 147,094 133,890 125,410 121,027Available seat kilometres mill. 29,101 26,878 23,846 23,038 21,907Revenue passenger kilometres mill. 21,896 20,304 17,923 16,735 15,604Passenger load factor % 75.2 75.5 75.2 72.6 71.2Available tonne kilometres mill. 4,485 4,074 3,602 3,400 3,162Revenue tonne kilometres mill. 2,545 2,365 2,100 1,940 1,791Overall load factor % 56.7 58.0 58.3 57.0 56.6Passengers 1,000 8,270 8,653 8,792 8,517 8,149Cargo and mail 1,000 kg 102,144 98,684 93,807 90,242 86,245

4 Financial Report
mill. tnkm
3,000
2,250
1,500
750
Revenue tonne kilometers
04 05 06 07 08
mill. passengers
domesticinternational
10.0
7.5
5.0
2.5
Number of passengers
04 05 06 07 08
%
100
75
50
25
Passenger load factor
04 05 06 07 08
Market and General ReviewIn 2008 Finnair’s profitability clearly fell from the previous year, despite strong vol-ume growth. The operational result re-mained weak. The key reasons were record prices for fuel during the year and a sharp decline in average yield per passenger kilo-metre at the end of the year.
Attempts to increase prices during the spring had a strongly adverse effect on the passenger load factors of Finnair’s scheduled flights. A reduction of business travel and a shift to cheaper price classes rapidly under-mined the average yield from flight tickets. It was not possible to adjust the cost struc-ture to a corresponding degree. The generally strong second and third quarters suffered from these factors. Declining profitability development continued in the final quar-ter and sent the operational result clearly into the red.
In 2008 air transport followed the gener-al economic trend, if in a slightly more pro-nounced way. The early part of the year was a time of strong growth, but development of demand weakened both quantitatively and structurally towards the end of the year.
A study for the full year revealed that revenue passenger kilometres of Europe-an airlines (AEA) grew by little more than one per cent from the previous year. Capac-ity growth was around three per cent. The change from early-year growth figures to late-year declines in traffic volume and capacity was very marked.
Last year Finnair traffic grew clearly more strongly than the European average due to the company’s investment in Asia. Finnair’s passen-ger load factor remained, at the previous year’s level, however, despite capacity additions.
In 2008 Finnair carried more than 1.3 million passengers in Asian traffic. Asian traf-fic growth was more than 16 per cent from the previous year. Scheduled passenger traffic overall grew by more than six per cent, and leisure flights by more than 12 per cent. In terms of traffic volumes, Finnair remains a growth company.
Scheduled passenger traffic capacity has already been cut from original plans by nearly ten per cent. The 2009 passenger kilometre capacity will be at least three per cent below the 2008 level. If the present trend in demand continues, capacity cuts will continue.
In leisure traffic, 2008 was a peak year in the business cycle. Due to good demand, Lei-sure Flights’ capacity was increased by 10 per cent. For winter season 2008/09, a wide-bod-ied aircraft plus crew was leased from Spain for direct, non-stop flights to Phuket, Thai-land. As Aurinkomatkat-Suntours managed to sell its own production almost completely at brochure prices without last-minute re-ductions, the business area’s result rose to the best in its history, despite oil prices ris-ing to record levels. Aurinkomatkat’s own package tour production, sales and market-ing began in Russia.
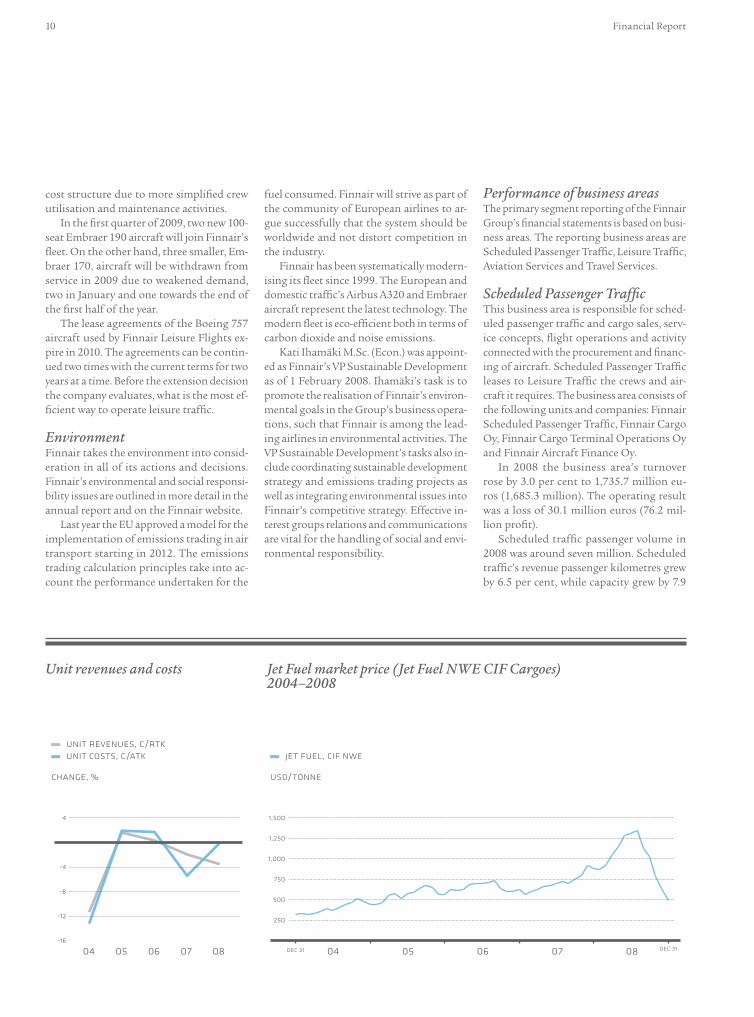
The price of fuel, which remained at a record high until the autumn, increased Finnair’s fuel costs by nearly 26 per cent, despite an effective hedging policy. Lower jet fuel prices, which have fallen from their peak, will reduce fuel costs with delayed effect.
Air cargo traffic on Finnair’s Asian flights grew along with increased capacity until Sep-tember of last year, at which time the world-wide decline in cargo demand that had begun in the spring was also reflected in Finnair’s cargo demand in the final quarter. The air cargo market fell by around 20 per cent in
Board of Directors’ Report for the Financial year 1 January–31 December 2008
Board of Directors’ Report 5
eur mill.
2,500
2,000
1,500
1,000
500
Turnover
04 05 06 07 08
* excluding capital gains, changes in fair value of derivatives and non recurring items
100
80
60
40
20
5
4
3
2
1
EBIT*
04 05 06 07 08
eur mill. % of turnover eur mill.
EBITDAR*
20072008
* excluding capital gains, changes in fair value of derivates and non recurring items
q1 q2 q3 q4
100
75
50
25
the latter part of the year.The 50 million euro efficiency pro-
gramme initiated in Finnair Group in May last year has proceeded according to plan. As part of the programme, statutory em-ployer-employee negotiations under the Act on Co-Determination within Undertakings were completed during the second half of the year. The outcome of the negotiations was that around 120 people were made re-dundant from Finnair Group and more than 3,000 employees will be laid off during this year, mainly for 2–3 weeks. Weakening prof-itability and capacity cuts require the initia-tion of a new programme of corresponding magnitude as soon as possible.
Finnair’s fleet modernisation is proceed-ing according to plan. Last year the company acquired two new long-haul traffic Airbus A340 aircraft. This year, the Finnair fleet will receive five new Airbus A330 wide-bodied air-craft, which will replace the Boeing MD-11 aircraft over the next year or so. At the be-ginning of next year, Finnair will have one of the most modern fleets in the world.
To finance the f leet investment pro-gramme, a 248 million euro share issue di-
rected at existing shareholders was arranged in December 2007. In addition, Finnair has secured credit facilities totalling 300 mil-lion euros.
Financial Result, 1 January– 31 December 2008The comparison figures for 2007 include the financial and performance figures of FlyNor-dic, sold in July 2007, in terms of the first six months of the year.
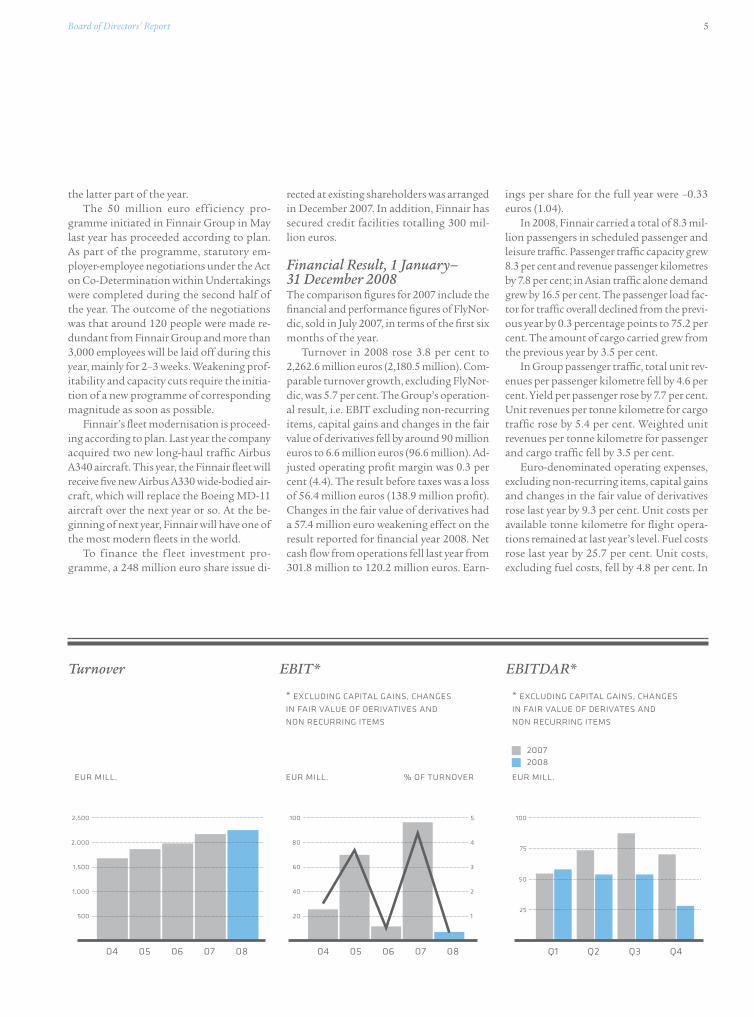
Turnover in 2008 rose 3.8 per cent to 2,262.6 million euros (2,180.5 million). Com-parable turnover growth, excluding FlyNor-dic, was 5.7 per cent. The Group’s operation-al result, i.e. EBIT excluding non-recurring items, capital gains and changes in the fair value of derivatives fell by around 90 million euros to 6.6 million euros (96.6 million). Ad-justed operating profit margin was 0.3 per cent (4.4). The result before taxes was a loss of 56.4 million euros (138.9 million profit). Changes in the fair value of derivatives had a 57.4 million euro weakening effect on the result reported for financial year 2008. Net cash flow from operations fell last year from 301.8 million to 120.2 million euros. Earn-
ings per share for the full year were –0.33 euros (1.04).
In 2008, Finnair carried a total of 8.3 mil-lion passengers in scheduled passenger and leisure traffic. Passenger traffic capacity grew 8.3 per cent and revenue passenger kilometres by 7.8 per cent; in Asian traffic alone demand grew by 16.5 per cent. The passenger load fac-tor for traffic overall declined from the previ-ous year by 0.3 percentage points to 75.2 per cent. The amount of cargo carried grew from the previous year by 3.5 per cent.
In Group passenger traffic, total unit rev-enues per passenger kilometre fell by 4.6 per cent. Yield per passenger rose by 7.7 per cent. Unit revenues per tonne kilometre for cargo traffic rose by 5.4 per cent. Weighted unit revenues per tonne kilometre for passenger and cargo traffic fell by 3.5 per cent.
Euro-denominated operating expenses, excluding non-recurring items, capital gains and changes in the fair value of derivatives rose last year by 9.3 per cent. Unit costs per available tonne kilometre for flight opera-tions remained at last year’s level. Fuel costs rose last year by 25.7 per cent. Unit costs, excluding fuel costs, fell by 4.8 per cent. In

6 Financial Report
eur mill.
% of turnover
150
100
50
-50
-100
7.5
5.0
2.5
-2.5
-5.0
Operating profi t, EBIT
04 05 06 07 08
% eur mill. %
7.5
5.0
2.5
-2.5
-5.0
0.75
0.50
0.25
-0.25
-0.50
Financial income and expences
04 05 06 07 08
% of turnover
eur mill.
150
100
50
-50
-100
Result before taxes
04 05 06 07 08
the comparison, fuel costs also take into ac-count realised hedging gains and losses out-side the scope of hedge accounting, which have been recognised in the income state-ment item ‘Other expenses’.
Fleet material and service expenses rose last year by 25.3 per cent. The main reasons for the growth in costs are increased materi-al, tool, engine and component acquisitions resulting for the expansion of Finnair’s fleet. Costs have also been increased by the ending of the guarantee periods of some aircraft and a general rise in material and subcontract-ing prices as well as by service provisions and write-downs of inventories.
A 15.2 per cent rise in package tour pro-duction expenses was mainly due to the in-tegration into Aurinkomatkat-Suntours of the St. Petersburg Calypso travel agency and the Estonian Horizon tour operator, ac-quired in 2007. Volume growth has also in-creased costs.
Personnel expenses as a whole remained almost at the previous year’s level. Salary costs have increased, however, by an aver-age of around five per cent per employee. On the other hand, personnel expenses have not been increased this year to the same degree
by profit and incentive bonuses, which in 2007 amounted to around 30 million eu-ros, and last year by more than 11 million euros based mainly on quality and punctu-ality indicators.
Investment, Financing and Risk ManagementInvestments in 2008 were 232.8 million euros (326.3 million). The investments included two Airbus A340 wide-bodied aircraft and two Embraer 190 aircraft. Including advance payments, the cash-flow impact of fleet and auxiliary investments was around 160 mil-lion euros last year. The cash-flow impact of the new aircraft acquisition programme and auxiliary investments in 2009 will be around 400 million euros and in 2010 more than 300 million euros. The final investment sum will depend on how many of the aircraft are ac-quired on operational leasing agreements.
Finnair is negotiating operational leasing agreements with various parties in respect of aircraft sale and leaseback arrangements for aircraft to be delivered during 2009.
Balance sheet cash and cash equivalents totalled 392.1 million euros (540.1 million) at the end of the year. The company’s cash
position has been kept strong because of the investments that lie ahead. In addition to the share issue held at the end of 2007, the com-pany’s financial position has been reinforced through credit arrangements.
Agreed, but to date unused credit facili-ties, total around 300 million euros, includ-ing a 60 million dollar credit facility obtained in October from the Nordic Investment Bank (NIB). In addition to this, Finnair has a 250 million euros credit facility from the Eu-ropean Investment Bank and a more than 400 million euro option on the loan-back of employment pension fund reserves from llmarinen Mutual Pension Insurance Com-pany, which both require bank guarantees. Flexibility in financing will also be achieved through a 100 million euro commercial pa-per programme.
Gearing at year end was –11.6 per cent (–22.5), i.e. the company was debt-free. Gear-ing adjusted for leasing liabilities was 63.2 per cent (35.1). The equity ratio was 38.1% (47.1).
According to the financial risk manage-ment policy approved by Finnair’s Board of Directors, the company has hedged 75 per cent of scheduled traffic’s jet fuel purchases

Board of Directors’ Report 7
buildingsflight equipment
other capital expenditure
400
300
200
100
Capital expenditure (gross)
04 05 06 07 08
eur mill. eur mill.
04 05 06 07 08
600
450
300
150
Interest bearing liabilities and liquid funds
interest bearing liabilitiesliquid funds
eur mill.
400
300
200
100
Cash fl ow from operating activities
04 05 06 07 08
during the next six months and thereafter for the following 24 months with a decreas-ing level of hedging. Finnair Leisure Flights price hedges fuel consumption according to its agreed traffic programme within the framework of the hedging policy. Deriva-tives linked to jet fuel and gasoil prices are mainly used as the fuel price hedging in-struments.
Under IFRS rules, a change during a fi-nancial quarter in the fair value of deriva-tives that mature in future is recognised in the Finnair income statement item “Other expenses”. The said change in the fair value of derivatives is not realised nor does it have an effect on cash flow; it is a valuation loss in accordance with IFRS reporting practice. In October-December, the change in the fair value of derivatives was -43.8 million euros, whereas in January-December it was -57.4 million euros.
The operational result for January-De-cember includes realised gains on derivatives of 62.8 million euros, which appear mainly in the fuel item of the income statement and partly in the item “Other expenses”. The figure includes both foreign exchange and fuel derivatives.
Shareholders’ equity includes, as a vari-able item, the hedging reserve, whose value is directly affected by oil price and foreign ex-change rate changes. The impact of the item on the closing date was -110.5 million euros, which includes foreign exchange and fuel de-rivatives as well as, to lesser degree, other fi-nancial items less deferred taxes. In June 2008 the corresponding impact was around 110 million euros, which indicates the strong im-pact of fuel price volatility on the valuation of hedging items in shareholders’ equity.
A weakening of the US dollar against the euro had a positive impact on Finnair’s op-erational result for the whole of 2008 com-pared to the previous year. Taking foreign exchange hedging into account, the impact is 37 million euros. At the end of December, the degree of hedging for a dollar basket over the following 12 months was 75 per cent.
Board of Directors and Senior ManagementAt the Annual General Meeting held on 27 March 2008, the following former members were elected as members of Finnair Plc’s Board of Directors for a term lasting until the end of the next Annual General Meeting:
Christoffer Taxell (Chairman), Sigurdur Hel-gason, Satu Huber, Markku Hyvärinen, Kari Jordan, Ursula Ranin and Veli Sundbäck. In addition, a new member, Pekka Timonen, was elected.
The Annual General Meeting elected as the company’s regular auditors Jyri Heikkin-en, Authorised Public Accountant, and Price-waterhouseCoopers Oy, Authorised Public Accountants, in which APA Eero Suomela will serve as the auditor with main responsibility. Tuomas Honkamäki APA and Timo Takalo APA were elected deputy auditors.
Henrik Arle, Finnair’s EVP Scheduled Pas-senger Traffic and Deputy CEO, retired on 31 December 2008. In the same context, changes were made in the Finnair Group organisation and management responsibilities.
The Finnair Group’s Chief Financial Of-ficer Lasse Heinonen was appointed Execu-tive Vice President and Finnair’s Deputy CEO as of 13 January 2009. Heinonen continues as the Group’s CFO. In addition to Econom-ics and Finance units, in the new manage-ment structure, the business units of Aviation Services report to EVP Heinonen: Northport Oy (ground handling), Finnair Catering Oy, Finnair Technical Services and Finnair Fa-

8 Financial Report
cilities Management Oy (property manage-ment). Heinonen is also in charge of Finnair Cargo Oy and Finnair Cargo Terminal Op-erations Oy and Finnair Aircraft Finance Oy (fleet management).
As of 1 January 2009, Finnair’s President & CEO Jukka Hienonen will lead the Sched-uled Passenger Traffic organisation togeth-er with the business area’s revised manage-ment group. SVP Flight Operations Division Veikko Sievänen will serve as the Accountable Manager referred to in the Airline Operator’s Certificate (AOC). At the same time, Sievänen was also appointed member of the Group’s executive board. SVP Technical Services Kim-mo Soini will serve as Accountable Manager for technical areas of responsibility. Opera-tional risk management, which was previous-ly under the authority of Henrik Arle, will be now be under the President & CEO.
SVP Community Relations and Commu-nications Christer Haglund was appointed to the executive board as of 1 March 2008.
Finnair’s Corporate Governance is out-lined in more detail in the Financial Report section of the annual report.
PersonnelDuring 2008, the average number of staff employed by the Finnair Group totalled 9,595, which was 1.2 per cent more than a year before. Scheduled Passenger Traffic had 4,254 employees and Leisure Traffic 464 employees. The total number of personnel in technical, catering and ground handling services was 3,650 and in travel services 1,078. A total of 149 people were employed in oth-er functions.
At the end of the year, Finnair Group had around 770 employees outside of Finland, of which 270 worked in sales and customer serv-ice duties for Finnair’s passenger and cargo traffic. There are a total of 500 employees working for travel agencies and tour opera-tors based in the Baltic states and Russia, and as guides at Aurinkomatkat-Suntours’ holiday destinations. Foreign personnel are included in the total number of Group em-ployees.
Full-time staff account for 94 per cent of employees. Around half of part-time staff are employees on partial child-care leave. Some 93 per cent of staff are employed on a per-
manent basis. Seasonal staff are included among those on fixed-term contracts. The average age of employees was 42 years, with most being between 30 and 50 years of age. More than 20 per cent were over 50 years old and one in ten under 30.
Employees’ average number of years in service is 14. One third of Finnair’s person-nel have been in the service of the Group for more than 20 years. Nearly half of these have been employed for more than 30 years.
The Finnair Group’s personnel consists equally of men and women. Of the twelve members of the Finnair Group’s executive board, two are women. Two of the eight mem-bers of Finnair Plc’s Board of Directors are women.
Finnair has collective employment agree-ments valid until spring 2010 with six labour unions. During spring 2009, negotiations will be held with the Finnish Aviation Un-ion and Finnair’s Technical Services person-nel on a wage solution for the final year of the agreement.
The pilots’ collective employment agree-ment expired at the end of November and
%
50
40
30
20
10
Equity ratio
04 05 06 07 08
%
10
-10
-20
-30
Gearing
04 05 06 07 08
%
120
90
60
30
Adjusted gearing
04 05 06 07 08
Board of Directors’ Report 9
negotiations on a new agreement have been under way since the autumn. The Finnish Airline Pilots’ Association (SLL) , which rep-resents Finnair’s pilots, initiated industrial action on 24 January 2009 by announcing an overtime ban. According to the announce-ment, industrial action will continue in the form of one-day strikes beginning 25 Feb-ruary. The most significant points of con-tention between the employer and employ-ees relate to pension benefits, business man-agement decision-making and working time arrangements.
In June 2008 statutory employer-employ-ee negotiations were initiated under the act on Co-Determination within Undertakings (YT negotiations). The goal of the negotia-tions was to achieve 25 million euros of sav-ings in personnel expenses, corresponding to around five per cent of total personnel costs. Finnair Cargo Oy and Finnair Cargo Terminal Operations Oy joined the process in November. The YT process was concluded in January this year, covering all personnel groups besides the pilots, in respect of whom YT negotiations are still incomplete.
When the YT negotiations began, the need for personnel reductions was estimat-ed at 500 jobs. Around 120 of these will be implemented as redundancies. The other sav-ings will mainly come from 2–3 week lay-offs affecting more than 3,000 people. In addition, the number of personnel will fall through the ending of around 400 fixed-term employment contracts at the turn of the year or during the spring.
Including social security expenses, around 11.2 million euros in incentive bonuses based on mainly quality indicators are expected to be paid to personnel for 2008. One factor in-fluencing the incentive was a significant im-provement in punctuality. The criteria based on the Group result for the personnel profit bonus and the share bonus scheme for key individuals were not fulfilled for 2008, and no incentive payments will be paid.
Fleet changes Finnair Group’s fleet is managed by Finnair Aircraft Finance Oy, which belongs to the Scheduled Passenger Traffic business area. At the end of December, the Finnair Group
had a total of 65 aircraft in flight operations. The average age of the Finnair’s entire fleet is 6.4 years, and in European traffic around five years.
The European and domestic fleet grew last year by two 100-seat Embraer 190 air-craft. The fleet has a total of 18 Embraer air-craft and 29 Airbus A320 aircraft. Two Airbus A340 aircraft joined Finnair’s wide-bodied fleet last year. One Boeing MD-11 aircraft was withdrawn from the fleet in October. Finnair has a total of 11 long-haul aircraft.
The renewal of the wide-bodied fleet will continue with the acquisition of five new Air-bus A330-300 long-haul aircraft in 2009 and a further three as minimum in 2010. The Air-bus aircraft will replace the six Boeing MD-11 aircraft to be withdrawn from Finnair’s fleet by end of March 2010. The one remaining Finnair owned MD-11 will be sold through a purchase agreement with Aeroflot Cargo. The other five MD-11 aircraft are leased and their agreements expire within a year.
The fleet modernisation will harmonise Finnair’s scheduled traffic fleet. A reduction of aircraft types will mean a more efficient
%
15
10
5
-5
Return on capital employed
04 05 06 07 08
%
15
10
5
-5
Return on equity
04 05 06 07 08
eur
4
3
2
1
Cash fl ow/share
04 05 06 07 08
10 Financial Report
change, %
4
-4
-8
-12
-16
Unit revenues and costs
04 05 06 07 08
unit revenues, c/rtkunit costs, c/atk
usd/tonne
1,500
1,250
1,000
750
500
250
Jet Fuel market price (Jet Fuel NWE CIF Cargoes)2004–2008
jet fuel, cif nwe
04 05 06 07 08dec 31 dec 31
cost structure due to more simplified crew utilisation and maintenance activities.
In the first quarter of 2009, two new 100-seat Embraer 190 aircraft will join Finnair’s fleet. On the other hand, three smaller, Em-braer 170, aircraft will be withdrawn from service in 2009 due to weakened demand, two in January and one towards the end of the first half of the year.
The lease agreements of the Boeing 757 aircraft used by Finnair Leisure Flights ex-pire in 2010. The agreements can be contin-ued two times with the current terms for two years at a time. Before the extension decision the company evaluates, what is the most ef-ficient way to operate leisure traffic.
Environment Finnair takes the environment into consid-eration in all of its actions and decisions. Finnair’s environmental and social responsi-bility issues are outlined in more detail in the annual report and on the Finnair website.
Last year the EU approved a model for the implementation of emissions trading in air transport starting in 2012. The emissions trading calculation principles take into ac-count the performance undertaken for the
fuel consumed. Finnair will strive as part of the community of European airlines to ar-gue successfully that the system should be worldwide and not distort competition in the industry.
Finnair has been systematically modern-ising its fleet since 1999. The European and domestic traffic’s Airbus A320 and Embraer aircraft represent the latest technology. The modern fleet is eco-efficient both in terms of carbon dioxide and noise emissions.
Kati Ihamäki M.Sc. (Econ.) was appoint-ed as Finnair’s VP Sustainable Development as of 1 February 2008. Ihamäki’s task is to promote the realisation of Finnair’s environ-mental goals in the Group’s business opera-tions, such that Finnair is among the lead-ing airlines in environmental activities. The VP Sustainable Development’s tasks also in-clude coordinating sustainable development strategy and emissions trading projects as well as integrating environmental issues into Finnair’s competitive strategy. Effective in-terest groups relations and communications are vital for the handling of social and envi-ronmental responsibility.
Performance of business areas The primary segment reporting of the Finnair Group’s financial statements is based on busi-ness areas. The reporting business areas are Scheduled Passenger Traffic, Leisure Traffic, Aviation Services and Travel Services.
Scheduled Passenger TrafficThis business area is responsible for sched-uled passenger traffic and cargo sales, serv-ice concepts, flight operations and activity connected with the procurement and financ-ing of aircraft. Scheduled Passenger Traffic leases to Leisure Traffic the crews and air-craft it requires. The business area consists of the following units and companies: Finnair Scheduled Passenger Traffic, Finnair Cargo Oy, Finnair Cargo Terminal Operations Oy and Finnair Aircraft Finance Oy.
In 2008 the business area’s turnover rose by 3.0 per cent to 1,735.7 million eu-ros (1,685.3 million). The operating result was a loss of 30.1 million euros (76.2 mil-lion profit).
Scheduled traffic passenger volume in 2008 was around seven million. Scheduled traffic’s revenue passenger kilometres grew by 6.5 per cent, while capacity grew by 7.9
Board of Directors’ Report 11
per cent, leading to a weakening of passen-ger load factor by one percentage point to 72 per cent.
In 2008, unit revenues for scheduled pas-senger traffic fell by 5.1 per cent. In the fi-nal quarter, unit revenues fell by 11.7 per cent. A shifting of demand to cheaper price classes contributed to the decline in unit revenues.
Cargo revenues account for a good ten per cent of all Scheduled Passenger Traffic’s revenues. Unit revenues for cargo in sched-uled traffic rose by 2.4 per cent in 2008. The total amount of cargo carried in scheduled traffic grew by seven per cent. The amount of cargo carried in Asian traffic rose by 14 per cent from the previous year.
The profitability of Finnair’s cargo op-erations was good in 2008. The key reason for the improved performance was the price level, which remained good, as well as an im-provement in operational efficiency. In the final quarter, however, cargo demand weak-ened rapidly and the situation is also expect-ed to continue in the current year due to the global economic situation.
In international scheduled passenger traf-fic, Finnair has increased its market share compared with its main competitors. In do-mestic traffic, Finnair’s market share has fallen, mainly due to the discontinuation of short routes. This has, however, improved the passenger load factor and profitability.
During 2008, the arrival punctuality of scheduled passenger flights improved slight-ly the previous year to 80.8 per cent (80.4%). Finnair’s flight punctuality was weak in a sector comparison at the beginning of last year. Through many measures, punctuality has again been raised to an excellent level to match the best European airlines.
The operations of the Estonian subsid-iary Aero were discontinued at the begin-ning of 2008 and all seven ATR 72 turbo-prop aircraft were sold. At the same time, this marked the end of Finnair’s propeller traffic, which had continued uninterrupted since 1924.
Leisure TrafficThis business area consists of Finnair Leisure Flights plus the Aurinkomatkat-Suntours package tour company and its subsidiaries, the Estonian tour operator Horizon Travel
and the St. Petersburg Calypso travel agency, as well as the Finnish takeOFF brand, which focuses on youth travel. Aurinkomatkat-Sun-tours is Finland’s leading tour operator, with a market share of 37 per cent. Finnair Lei-sure Flights enjoys strong market leadership in leisure travel flights and all of Finland’s largest tour operators are its customers. For their package tour production, tour opera-tors buy the flight series they need to holi-day destinations for the summer and win-ter seasons.
Leisure travel enjoyed a peak year in 2008. From Finland 989,000 package tours were made using flights abroad, which was 3.3 per cent more than the previous year. More than 23 per cent of these journeys were made to the Canary Islands. Thailand’s share. more-over, has risen to ten per cent. Due to the financial crisis, demand for package tours clearly weakened in the Estonian and Rus-sian markets in the autumn.
Due to good demand, Leisure Traffic’s turnover in 2008 rose by 11.0 per cent to 454.6 million euros. The operational result, i.e. adjusted EBIT, improved by 10.3 per cent to an all-time best of 26.7 million euros (24.2 million), which corresponds to 5.9 per cent of turnover. The result was burdened by the start-up costs of Aurinkomatkat’s package tour production in Russia as well as the price of jet fuel, which rose to a record high.
In 2008 Finnair Leisure Flights carried over 1.3 million passengers, around ten per cent more than in the previous year. In ad-dition to its own Boeing 757 fleet, Leisure Flights leased from Air Europe a 299-seat Air-bus A330 wide-bodied aircraft with crew for flights to Phuket in Thailand for the winter season 2008/09. In the winter season, there were 14 return flights per week to Asia, of which six were with leased capacity. Available passenger kilometres grew by 9.7 per cent. As the proportion of winter season long-haul traffic grew, performance calculated in rev-enue passenger kilometres rose by 12.4 per cent from the previous year. Leisure Flights’ passenger load factor therefore improved by 2.1 percentage points to 88.1 per cent.
Internet advance sales to consumers of additional services, seat place of a passen-ger’s choice and meals, as well as in-flight sales grew according to set targets.
Finnair has agreed fixed prices with tour
operators for charter flights and provided for the fuel risk with price hedging in accordance with the Group’s financial policy.
Aurinkomatkat-Suntours has a record year in 2008. Good demand and poor sum-mer weather in Finland was evident in turn-over growth, as there was no need to resort to last-minute price reductions to main-tain sales. Sales of winter 2008/09 holidays also went well. Aurinkomatkat’s passenger number grew by 3.7 per cent from the pre-vious year to 345,000. The utilisation rate and the result rose to record levels. Estonia-based Horizon increased its passenger num-bers by over 17 per cent as other tour opera-tors cut back their offerings, but its result was loss-making due to the bankruptcy of the airline Futura.
At the beginning of the year, Au-rinkomatkat-Suntours purchased the St. Petersburg travel agency Calypso. The com-pany has been used as a platform and dis-tribution channel for the start-up of Au-rinkomatkat’s own package production in Russia. In the first summer-winter pro-duction season, Aurinkomatkat produced more than 10,000 package tours involving flights abroad, with the utilisation rate at the end of the year rising to 84 per cent. Aurinkomatkat’s partner is Rossiya Airlines. Aurinkomatkat’s customer satisfaction in Russia is on a good level.
Aviation ServicesThis business area comprises aircraft main-tenance services, ground handling and the Group’s catering operations. In addition, the Group’s property holdings, the procurement of office services, and the management and maintenance of properties related to the Group’s operational activities also belong to the Aviation Services business area. Avi-ation Services’ business consists mainly of intra-Group service provision. Of the busi-ness area’s turnover 24 per cent consists of business outside of the Group.
In 2008 Aviation Services’ turnover rose 2.7 per cent to 445.8 million euros. The op-erational result grew 34 per cent from the previous year’s level and was a profit of 13.8 million euros (10.3 million).
The Catering business is the most prof-itable of the Aviation Services. Operations are divided into meal production and related
12 Financial Report
logistics as well travel retail functions, which include inflight sales plus pre-order services and airport shops in Helsinki, Tampere and Turku. Both business areas increased their turnover and improved their result. In Cater-ing operations, production efficiency was en-hanced, while Finnair Catering received new premises at the beginning of last year.
Finnair Technical Services’ operational result was a loss in 2008. A nearly three mil-lion euro item in credit losses resulting from the bankruptcy of the Gemini Air Cargo cus-tomer relationship as well as some inventory write-downs was recognised in the result.
It is important for Finnair Technical Serv-ices’ long-term functional capacity and prof-itability that the unit also has customers from outside the Group. At the beginning of 2008, Finnair Technical Services signed a maintenance agreement with Aeroflot until 2016. The value of the agreement is estimated to be around 200 million euros.
The ground handling company North-port Oy is still loss-making. The quality of ground handling operations has significantly improved, however, from the previous year.
Travel ServicesThe business area consists of the Group’s travel agencies: Matkatoimisto Area, Fin-land Travel Bureau and its subsidiary Es-travel, which operates in the Baltic states, as well as Amadeus Finland Oy, which inte-grates travel agency systems and sells travel reservation systems.
Finland Travel Bureau (FTB) and Area are Finland’s leading travel agencies, and Es-travel, which celebrated the 20th anniversary of its founding in August, is one of the lead-ing travel agencies in the Baltic states. The companies were highly rated in a customer satisfaction survey of business travellers in the Nordic countries.
With FTB having discontinued its own Etumatkat city break production, which had come to the end of its life cycle, the business area’s turnover declined in 2008 by 5.3 per cent to 77.9 million euros (82.3 million). In the autumn, the economic downturn was evi-dent as a significant contraction of business travel, which was reflected in the travel agen-cies’ sales and results. The operating result fell to 2.1 million euros (2.9 million).
The travel agencies’ distribution is mov-
ing to the internet. Online travel agencies have won market share, but Area is Finland’s biggest traditional travel agency on the inter-net. Nearly a quarter of the company’s sales comes via the internet. Automation is being used to improve the efficiency of providing corporate travel services.
Estravel, which is part of the FTB Group, is still doing well in the Baltic states. For the first time in these markets, travel was at a lower level last year and margins narrowed. In Estonia the company’s market share is 40 per cent.
Travel Services’ Amadeus Finland, a pro-vider of travel reservation and information systems to travel agencies, brought to the market many new services relating to com-panies’ and travel agencies’ travel manage-ment. A hotel booking service was added to the Amadeus reservation system. Growth in the volume of Finns’ air travel increased the company’s turnover.
Air Traffic Services and Products In recent years, the Finnair route network has been developed to serve traffic between Europe and Asia passing through Helsinki. At the same time, Finns have been offered efficient and diverse connections to destina-tions all over the world.
Finnair has a total of 60 direct flights per week to 10 Asian destinations. In June Finnair began direct flights to Seoul, the capital of South Korea. The Seoul route is flown four times per week during the winter. Finnair’s other Asian destinations are Bangkok, Delhi, Mumbai, Hong Kong, Nagoya, Osaka, Bei-jing, Shanghai and Tokyo. The Guangzhou route was discontinued at the end of Octo-ber. The Guangzhou area is now served by a daily connection with Hong Kong.
Flights covering 45 European and 13 do-mestic destinations connect into Finnair’s Asia network. At the same time, a wide se-lection of direct connections is offered from Finland to the rest of Europe.
In the early autumn, Finnair began sched-uled flights from Helsinki to Yekaterinburg, located in the Urals. The route is flown three times per week with Airbus A319 aircraft and represents Finnair’s third scheduled destina-tion in Russia after Moscow and St. Peters-burg. Finnair flies the route in cooperation with Ural Airlines. The three-hour flight time
and onward connections with short transit times at both ends of the route make the service very competitive in Russia, the Nordic countries and elsewhere in Europe.
Leisure Flights’ fleet consists of seven Boe-ing 757 aircraft. Due to increased demand, Leisure Flights has leased for the current winter season one Airbus A330 wide-bod-ied aircraft, which flies non-stop to Phuket in Thailand. In the summer season, Leisure Flights flies, in addition to charter flight traf-fic, certain so-called holiday routes, includ-ing Boston and Toronto.
In October Finnair and oneworld alliance partner British Airways began code-sharing flights between Bangkok, Thailand and Syd-ney, Australia. In December, the frequency of flights to Brussels was increased. From January, Finnair flies 25 times per week to the Belgian capital. A new service that de-parts Helsinki in the evening and returns from Brussels in the morning is particularly convenient for business travellers between the cities.
Finnair will begin direct flights to Is-tanbul, Turkey in March 2009. Flights will start on a two flights per week schedule and the flight frequency will double at the end of March. The Istanbul route will provide good connections via Helsinki from Turkey to Scandinavia, the Baltic states and Finnair’s Asian network – and back again.
Based on an audit carried out in Decem-ber, Skytrax rated Finnair a four-star airline on a scale of one to five. Finnair had previ-ously been rated a three-star airline. Skytrax is an international research company which evaluates the world’s commercial airlines and their services in great detail.
At the beginning of June 2008, the elec-tronic ticket (e-ticket) was adopted world-wide for all flights. Finnair has been among the leading companies in introducing the e-ticket. Using e-tickets is more economical than using paper tickets.
Finnair’s growing international demand has created an increasing need to serve cus-tomers in local languages in different mar-ketplaces. At the end of December, Finnair opened websites also in the Spanish, Ital-ian, French, Russian and Chinese languages. Finnair range of languages covers around 3.3 billion people. Finnair now offers an in-ternet booking service in a total of 11 lan-

Board of Directors’ Report 13
guages. In addition to the new languages, websites are offered in Finnish, Swedish, Eng-lish, Japanese, Korean and German. Around one fifth of Finnair tickets are currently sold via the internet and this proportion is ex-pected to grow.
Short-term risks and uncertainty factorsThe tightening of the financial markets has raised the cost of planned financing high-er than was anticipated. The availability of funding has deteriorated, but a lack of suf-ficient funding is not considered to be a risk during 2009.
The risk in the acquisition of new aircraft is that demand will fall more quickly than capacity can be meaningfully reduced. The lease agreements of Finnair Leisure Flights’ seven Boeing 757 aircraft will expire in 2010, at which time the fleet can be optimised ac-cording to demand forecasts.
Fuel costs constitute approximately one fifth of the Group’s total costs and, despite the recent fall in oil prices, are one of the most significant uncertainty factors where costs are concerned. Foreign exchange rate changes also represent a risk. Finnair pro-vides against fuel price and foreign exchange rate volatility by entering into option and future contracts. The rising cost of hedging arrangements also poses a risk.
Finnair’s more than 70 per cent hedging level over the next six months will slow the transfer of the benefit of the fall in oil prices in the company’s fuel costs. Finnair’s relative competitive position in terms of costs is also influenced by competitors’ fuel price hedging policies. The company’s main competitors adhere to the same principles as Finnair in their hedging policies.
A deepening of the worldwide recession might reduce demand sharply as well as av-erage yields in passenger and cargo traffic. Due to the short booking horizon, it is dif-ficult to predict demand far into the future. A change of one percentage point in the load factor of scheduled passenger traffic serv-ices affects the Group’s operating profit by around 15 million euros. A change of one per-centage point in the average yield of sched-uled passenger traffic services also affects the Group’s operating profit by around 15 million euros.
The development of gross domestic prod-uct will affect the development of air trans-port passenger and cargo demand. A weak-ening of domestic consumer confidence might also have an adverse impact on de-mand for non-business travel in both leisure and scheduled traffic services.
When examining quarterly earnings de-velopment, it is worth noting that Easter, when fewer higher-priced business trips are made, falls this year in the second quarter, when last year it was in the first quarter. The Chinese New Year, moreover, might have a weakening impact on Finnair’s demand in the Chinese-language passenger market.
Negotiations on the pilots’ collective em-ployment agreement, which ended on 30 November 2008, are under way and present a risk of industrial action. The halting of Finnair’s traffic would result in estimated losses of around three million euros per day. In addition, the uncertainty caused by traf-fic disruptions would also be reflected neg-atively in demand on the days surrounding the strike.
OutlookYear 2009 is expected to be a difficult one for financial development of the airline indus-try. Development will shape industry struc-tures via bankruptcies and mergers. Finnair will closely follow the restructuring of the industry.
Finnair’s holds on to its Asia strategy. The long-term goal of scheduled traffic is to grow in services between Europe and Asia, utilis-ing Helsinki as a geographically and logis-tically ideal transit location. Route network expansion will take place through additions to Finnair’s own capacity and through in-creased cooperation.
Finnair has secured credit facilities total-ling around 300 million euros as well as a 250 million credit facility requiring a bank guarantee from the European Investment Bank, plus a more than 400 million euro option on the loan-back of employment pension fund reserves. The financial crisis will be reflected in the financing of Finnair’s fleet modernisation primarily via the cost of borrowed capital and the price level of lease agreements.
Finnair’s fuel costs are expected to be low-er during the current year than last year. The
hedging policy practised by Finnair dampens fuel price fluctuations. At the present price level, fuel costs are expected to be over 22 per cent of Finnair’s turnover in 2009.
The world economy recession is expect-ed to weaken Finnair’s demand and aver-age yields in passenger and cargo traffic in all marketplaces. Gross domestic product in Europe has begun to fall. In the Asian na-tional economies, growth figures have fallen significantly short of earlier forecasts.
In Leisure Traffic, strong demand for win-ter long-haul trips will be evident in the first quarter. Due to decreasing consumer con-fidence, demand for leisure trips this com-ing summer is expected to be clearly weaker than the previous year. Over capacity in the market forces down price level.
Finnair is preparing for capacity cuts throughout its route network as well as for an adjustment of costs during the current year. In 2009 the capacity of Asian traffic and scheduled traffic as a whole will fall, on the basis of decisions made to date, by around three per cent.
In May last year was initiated a 50 million euro productivity improvement programme, in which the portion attributed to savings in personnel costs was around one half. This programme was implemented in full in 2009. The Group, however, is initiating a new pro-gramme of similar magnitude and areas of cost-cutting and efficiency improvement are being actively explored.
The first quarter is expected to remain clearly loss-making. The operational result for the full year will substantially depend on the demand situation and cost develop-ment. The outlook for the full year is ex-tremely challenging.
Shares and shareholdersShares and Share CapitalOn 31 December 2008 the company’s regis-tered share capital was 75,442,904.30 euros and number of shares issued was 128,136,115. Each share has one vote at the Annual Gen-eral Meeting.
Share Quotations Finnair Plc shares are quoted on the NAS-DAQ OMX Helsinki Stock Exchange.

14 Financial Report
Dividend per year
% of earnings
*2008 proposal of the board of directors to the agm
eur mill. %
50
40
30
20
10
50
40
30
20
10
04 05 06 07 08*
Dividend Policy and the Payment of DividendThe aim of Finnair’s dividend policy is to pay on average at least one-third of the earnings per share as dividend during an economic cy-cle, taking into account the company’s earn-ings trend and outlook, financing position and capital needs for any given period.
Incentive Schemes for Key PersonnelOn 22 March 2007, Finnair Plc’s Board of Directors approved a share bonus scheme 2007–2009 directed at key individuals of the Group. Details of the scheme are presented in Note 26 of this annual report. The scheme does not affect the total number of shares. The amount of share bonuses is determined on the basis of the Finnair Group’s financial development.
Board of Directors’ Authorisations At the beginning of the financial year, Finnair held 151,903 of its own shares, which it had purchased in previous years. Between 1 Jan-uary and 17 March 2008, Finnair acquired 598,097 of its own shares, on the basis of an authorisation of the Annual General Meet-ing held on 22 March 2007.
On 27 March 2008 the Annual General Meeting granted the Board of Directors new authorisations for a period of up to one year to purchase the company’s own shares up to a maximum of 5,000,000 shares and dispose of the company’s own shares up to a maxi-mum of 5,500,000 shares. The authorisation applies to shares amounting to less than five per cent of the company’s share capital. Un-der the authorisation, in 2008 Finnair trans-ferred a total of 364,912 of its own shares to
share-Related key Figures 2008 2007 2006Earnings/share EUR -0.33 1.04 -0.14Equity/share EUR 6.04 7.70 6.14Dividend/share EUR 0.0 0.25 0.10Dividend-to-earnings ratio % 0.0 31.5 -64.4P/E ratio -14.82 7.79 -88.05P/CEPS 5.0 2.5 12.5Effective dividend yield % 0.0 3.1 0.8 Number of shares and share prices 2008 2007 2006Average number of shares adjusted for share issue pcs 127,969,796 98,032,358 96,690,131Average number of shares adjusted for share issue (with diluted effect) pcs 127,969,796 98,032,358 96,690,131The number of shares adjusted for share issue at the end of financial year pcs 127,969,796 98,032,358 97,782,880The number of shares adjusted for share issue at the end of financial year (with diluted effect) pcs 127,969,796 98,032,358 97,782,880Number of shares, end of the financial year pcs 128,136,115 128,136,115 88,756,358Trading price highest EUR 8.49 14.35 15.00Trading price lowest EUR 3.5 7.51 10.01Market value of share capital Dec 31 EUR mill. 627 1,037 1,102No. of shares traded pcs 64,783,468 37,672,530 29,965,410No. of shares traded as % of average no. of shares % 50.55 29.40 33.76

Board of Directors’ Report 15
Finnair plc largest shareholders as at 31 December, 2008
Number of shares % Changes, pcs
1 State of Finland; Office of Counsil of State 71,515,426 55.8 02 Skagen Global Verdipapirfonds (I-II-III-Vekst) 6,963,143 5.4 6,963,1433 Ilmarinen Mutual Pension Insurance Co 3,725,564 2.9 824,0004 Suomi Mutual Life Insurance Company 3,597,224 2.8 1,000,0005 Odin Förvaltning AS 2,790,418 2.2 06 Mandatum Life Insurance Company 2,400,000 1.9 07 Tapiola Insurance Company Group 2,276,444 1.8 08 State Pension Fund 2,100,000 1.6 1,100,0009 Local Government Pensions Institution 1,606,575 1.3 1,209,49910 OP Funds 1,383,734 1.1 -2,286,07311 Nordea Funds 1,131,619 0.9 -33,64512 Aktia Funds 665,400 0.5 147,19713 Etera Mutual Pension Insurance Company 601,747 0.5 89,62814 Varma Mutual Pension Insurance Company 600,000 0.5 015 Kaleva Mutual Insurance Company 568,538 0.4 370,00016 City of Turku 387,434 0.3 387,43417 Finnair Plc (own shares) 387,429 0.3 235,52618 Gyllenberg Funds 357,404 0.3 28,99419 City of Turku, Claim Fund 295,907 0.2 13,32620 Finnair Plc Staff Fund 230,982 0.2 151,34421 Norvestia Plc 227,387 0.2 60,77622 Pohjola Insurance Company 216,668 0.2 023 Alandia Insurance Company 189,299 0.1 66,79924 Finnair Pension Fund 136,842 0.1 025 Kotimaa Saving Bank Fund 121,700 0.1 121,70026 Arvo Finland Value Fund 120,000 0.1 120,00027 Ingman Finance Oy Ab 120,000 0.1 120,00028 Aro Olavi Sakari 110,000 0.1 110,00029 Neste Oil Pension Fund 105,826 0.1 030 Fennia Mutual Pension Insurance Company 100,000 0.1 -705,49531 Kamprad Ingvar 100,000 0.1 100,00032 ESR EQ Fund 100,000 0.1 -25,000
Nominee registered 14,999,663 11.7 -9,852,222 1)
Others 7,903,742 6.2
Total number of shares 128,136,115 100.0
1) On 31 March 2008 FL Group sold 16,252,921 shares of Finnair Plc and FL Group direct and indirect holding decreased to 0.
16 Financial Report
shareholders by type at 31 December 2008
Number
of sharesShares,
%Number of
shareholdersShareholders,
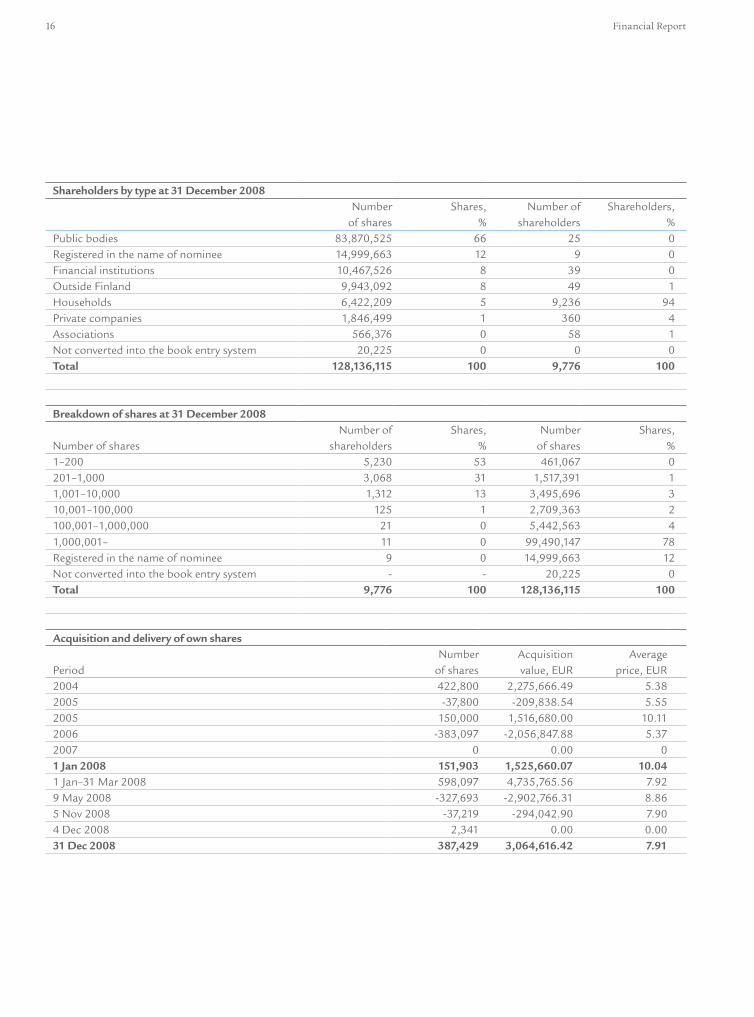
%Public bodies 83,870,525 66 25 0Registered in the name of nominee 14,999,663 12 9 0Financial institutions 10,467,526 8 39 0Outside Finland 9,943,092 8 49 1Households 6,422,209 5 9,236 94Private companies 1,846,499 1 360 4Associations 566,376 0 58 1Not converted into the book entry system 20,225 0 0 0Total 128,136,115 100 9,776 100 breakdown of shares at 31 December 2008
Number of sharesNumber of
shareholdersShares,
%Number
of sharesShares,
%1–200 5,230 53 461,067 0201–1,000 3,068 31 1,517,391 11,001–10,000 1,312 13 3,495,696 310,001–100,000 125 1 2,709,363 2100,001–1,000,000 21 0 5,442,563 41,000,001– 11 0 99,490,147 78Registered in the name of nominee 9 0 14,999,663 12Not converted into the book entry system - - 20,225 0Total 9,776 100 128,136,115 100
Acquisition and delivery of own shares Period
Number of shares
Acquisition value, EUR
Average price, EUR
2004 422,800 2,275,666.49 5.382005 -37,800 -209,838.54 5.552005 150,000 1,516,680.00 10.112006 -383,097 -2,056,847.88 5.372007 0 0.00 01 Jan 2008 151,903 1,525,660.07 10.041 Jan–31 Mar 2008 598,097 4,735,765.56 7.929 May 2008 -327,693 -2,902,766.31 8.865 Nov 2008 -37,219 -294,042.90 7.904 Dec 2008 2,341 0.00 0.0031 Dec 2008 387,429 3,064,616.42 7.91
Board of Directors’ Report 17
index 31 dec 2003 = 100
500
400
300
200
100
Finnair Plc Share Index and NASDAQ OMX Helsinki indices
finnair plc shareindustrials index
all-share indexhelsinki benchmark index
Helsinki benchmark -indeksi Yleisindeksi Toimialaindeksi Finnair -osake
04 05 06 07 08 jan 1 dec 31
index 31 dec 2003 = 100
500
400
300
200
100
Share price development compared with other European airlines
bloomberg europe airline indexfinnair plc
Helsinki benchmark -indeksi Yleisindeksi Toimialaindeksi Finnair -osake
04 05 06 07 08 jan 1 dec 31
individuals within the sphere of the 2007–2009 share bonus scheme as share bonuses payable on the basis of the 2007 result. In 2008, a total of 2,341 shares were returned to the company by those belonging to the share scheme. At the end of 2008, Finnair held 387,429 of its own shares, namely 0.30 per cent of the total number of shares out-standing on the last day of the year.
The Board of Directors has no other au-thorisations, such as authorisations for share issues or for the issuing of convertible bonds or share options.
Government OwnershipAt the end of the financial year, on 31 Decem-ber 2008, the Finnish Government owned 55.8% of the company’s shares and votes. On 20 June 1994, the Finnish Parliament, while giving its consent to reduce the Gov-ernment’s holding to less than two-thirds, decided that the Government must own more than half of Finnair Plc’s shares.
Share Ownership by ManagementOn 31 December 2008, members of the com-pany’s Board of Directors and the President & CEO owned 78,480 shares, representing 0.06 % of all shares and votes.
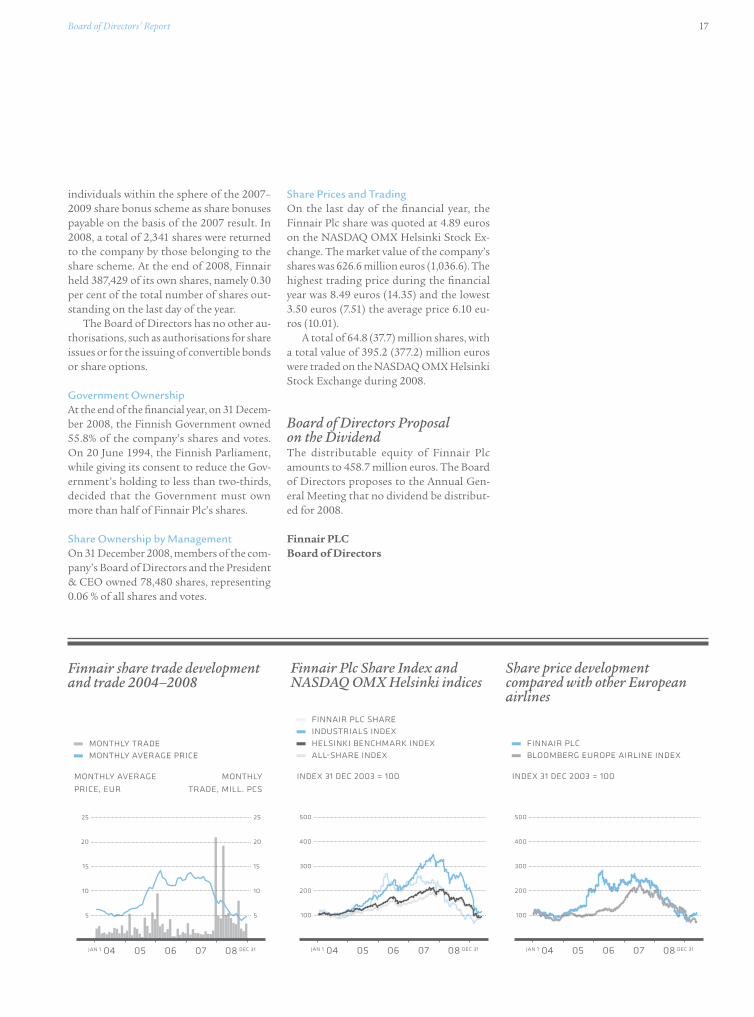
Share Prices and TradingOn the last day of the financial year, the Finnair Plc share was quoted at 4.89 euros on the NASDAQ OMX Helsinki Stock Ex-change. The market value of the company’s shares was 626.6 million euros (1,036.6). The highest trading price during the financial year was 8.49 euros (14.35) and the lowest 3.50 euros (7.51) the average price 6.10 eu-ros (10.01).
A total of 64.8 (37.7) million shares, with a total value of 395.2 (377.2) million euros were traded on the NASDAQ OMX Helsinki Stock Exchange during 2008.
Board of Directors Proposal on the DividendThe distributable equity of Finnair Plc amounts to 458.7 million euros. The Board of Directors proposes to the Annual Gen-eral Meeting that no dividend be distribut-ed for 2008.
Finnair PLC Board of Directors
monthly average price, eur
monthly trade, mill. pcs
Finnair share trade development and trade 2004–2008
monthly average pricemonthly trade
04 05 06 07 08 jan 1 dec 31
25
20
15
10
5
25
20
15
10
5
18 Financial Report
2008 2007 2006
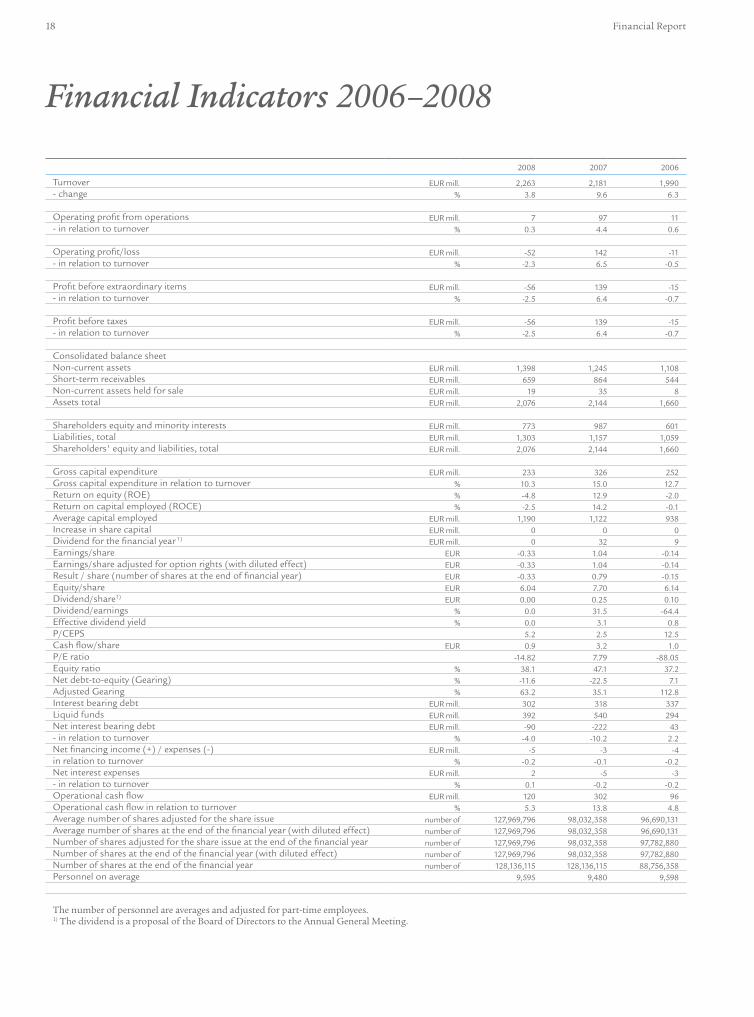
Turnover EUR mill. 2,263 2,181 1,990- change % 3.8 9.6 6.3 Operating profit from operations EUR mill. 7 97 11- in relation to turnover % 0.3 4.4 0.6
Operating profit/loss EUR mill. -52 142 -11- in relation to turnover % -2.3 6.5 -0.5 Profit before extraordinary items EUR mill. -56 139 -15- in relation to turnover % -2.5 6.4 -0.7 Profit before taxes EUR mill. -56 139 -15- in relation to turnover % -2.5 6.4 -0.7
Consolidated balance sheetNon-current assets EUR mill. 1,398 1,245 1,108Short-term receivables EUR mill. 659 864 544Non-current assets held for sale EUR mill. 19 35 8Assets total EUR mill. 2,076 2,144 1,660
Shareholders equity and minority interests EUR mill. 773 987 601Liabilities, total EUR mill. 1,303 1,157 1,059Shareholders' equity and liabilities, total EUR mill. 2,076 2,144 1,660
Gross capital expenditure EUR mill. 233 326 252Gross capital expenditure in relation to turnover % 10.3 15.0 12.7Return on equity (ROE) % -4.8 12.9 -2.0Return on capital employed (ROCE) % -2.5 14.2 -0.1Average capital employed EUR mill. 1,190 1,122 938Increase in share capital EUR mill. 0 0 0Dividend for the financial year 1) EUR mill. 0 32 9Earnings/share EUR -0.33 1.04 -0.14Earnings/share adjusted for option rights (with diluted effect) EUR -0.33 1.04 -0.14Result / share (number of shares at the end of financial year) EUR -0.33 0.79 -0.15Equity/share EUR 6.04 7.70 6.14Dividend/share1) EUR 0.00 0.25 0.10Dividend/earnings % 0.0 31.5 -64.4Effective dividend yield % 0.0 3.1 0.8P/CEPS 5.2 2.5 12.5Cash flow/share EUR 0.9 3.2 1.0P/E ratio -14.82 7.79 -88.05Equity ratio % 38.1 47.1 37.2Net debt-to-equity (Gearing) % -11.6 -22.5 7.1Adjusted Gearing % 63.2 35.1 112.8Interest bearing debt EUR mill. 302 318 337Liquid funds EUR mill. 392 540 294Net interest bearing debt EUR mill. -90 -222 43- in relation to turnover % -4.0 -10.2 2.2Net financing income (+) / expenses (-) EUR mill. -5 -3 -4in relation to turnover % -0.2 -0.1 -0.2Net interest expenses EUR mill. 2 -5 -3- in relation to turnover % 0.1 -0.2 -0.2Operational cash flow EUR mill. 120 302 96Operational cash flow in relation to turnover % 5.3 13.8 4.8Average number of shares adjusted for the share issue number of 127,969,796 98,032,358 96,690,131Average number of shares at the end of the financial year (with diluted effect) number of 127,969,796 98,032,358 96,690,131Number of shares adjusted for the share issue at the end of the financial year number of 127,969,796 98,032,358 97,782,880Number of shares at the end of the financial year (with diluted effect) number of 127,969,796 98,032,358 97,782,880Number of shares at the end of the financial year number of 128,136,115 128,136,115 88,756,358Personnel on average 9,595 9,480 9,598
The number of personnel are averages and adjusted for part-time employees. 1) The dividend is a proposal of the Board of Directors to the Annual General Meeting.
Financial Indicators 2006–2008
Board of Directors’ Report 19
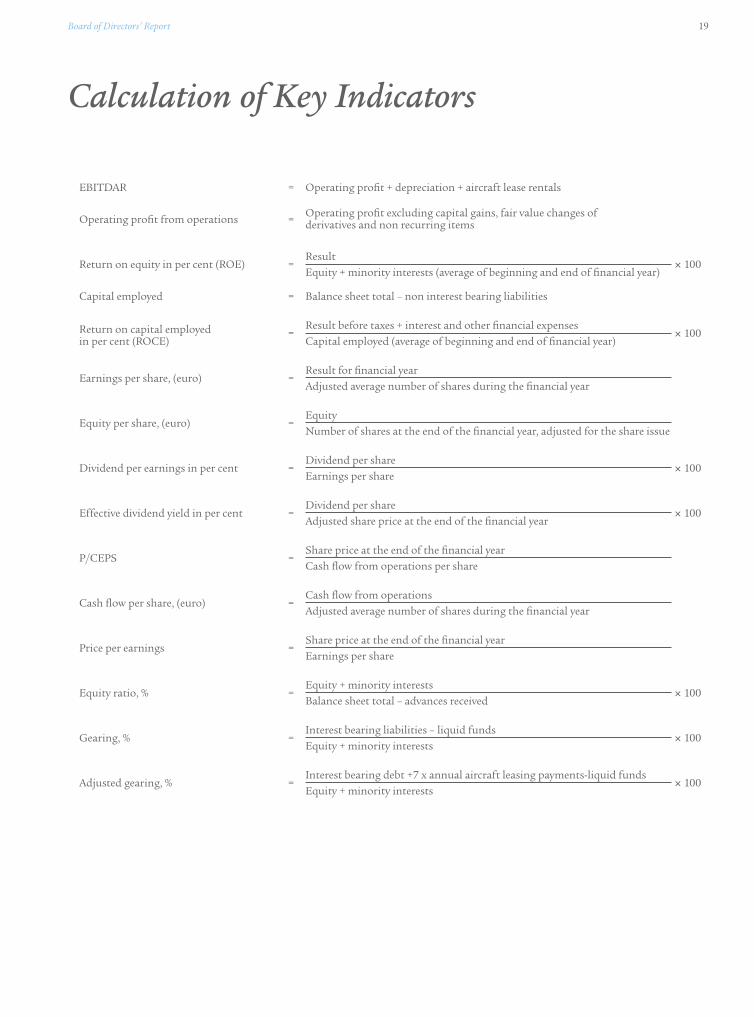
EBITDAR = Operating profit + depreciation + aircraft lease rentals
Operating profit from operations =
Result Return on equity in per cent (ROE) = × 100 Equity + minority interests (average of beginning and end of financial year)
Capital employed = Balance sheet total – non interest bearing liabilities
Result before taxes + interest and other financial expenses Return on capital employed = × 100in per cent (ROCE) Capital employed (average of beginning and end of financial year)
Result for financial year Earnings per share, (euro) = Adjusted average number of shares during the financial year
EquityEquity per share, (euro) = Number of shares at the end of the financial year, adjusted for the share issue
Dividend per shareDividend per earnings in per cent = × 100 Earnings per share
Dividend per shareEffective dividend yield in per cent = × 100 Adjusted share price at the end of the financial year
Share price at the end of the financial year P/CEPS = Cash flow from operations per share
Cash flow from operationsCash flow per share, (euro) = Adjusted average number of shares during the financial year
Share price at the end of the financial year Price per earnings = Earnings per share
Equity + minority interestsEquity ratio, % = × 100 Balance sheet total – advances received
Interest bearing liabilities – liquid fundsGearing, % = × 100 Equity + minority interests
Interest bearing debt +7 x annual aircraft leasing payments-liquid fundsAdjusted gearing, % = × 100 Equity + minority interests
Calculation of Key Indicators
Operating profit excluding capital gains, fair value changes of derivatives and non recurring items

20 Financial Report
Consolidated Statements 21
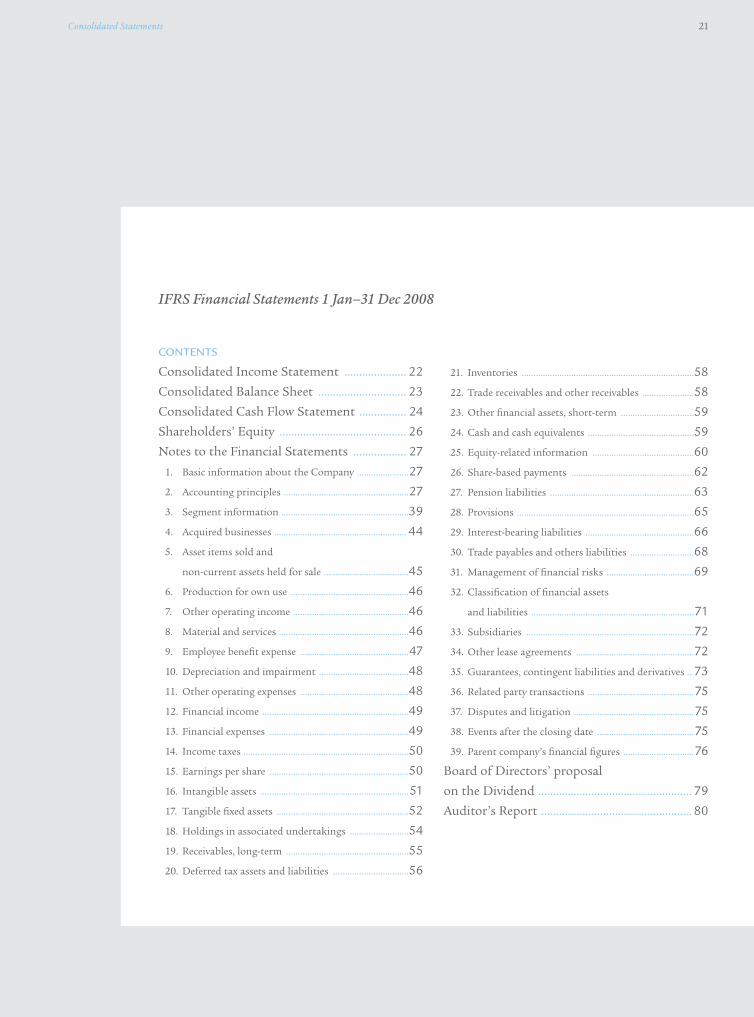
IFRS Financial Statements 1 Jan–31 Dec 2008
CONTENTS
Consolidated Income Statement ..................... 22
Consolidated Balance Sheet .............................. 23
Consolidated Cash Flow Statement ................ 24
Shareholders’ Equity ........................................... 26
Notes to the Financial Statements .................. 27
1. Basic information about the Company ......................27
2. Accounting principles .....................................................27
3. Segment information ......................................................39
4. Acquired businesses ........................................................ 44
5. Asset items sold and
non-current assets held for sale ....................................45
6. Production for own use ..................................................46
7. Other operating income .................................................46
8. Material and services .......................................................46
9. Employee benefit expense ..............................................47
10. Depreciation and impairment ......................................48
11. Other operating expenses ..............................................48
12. Financial income ..............................................................49
13. Financial expenses ...........................................................49
14. Income taxes ......................................................................50
15. Earnings per share ...........................................................50
16. Intangible assets ...............................................................51
17. Tangible fixed assets ........................................................52
18. Holdings in associated undertakings .........................54
19. Receivables, long-term ....................................................55
20. Deferred tax assets and liabilities ................................56
21. Inventories .........................................................................58
22. Trade receivables and other receivables ......................58
23. Other financial assets, short-term ...............................59
24. Cash and cash equivalents .............................................59
25. Equity-related information ...........................................60
26. Share-based payments ....................................................62
27. Pension liabilities .............................................................63
28. Provisions ...........................................................................65
29. Interest-bearing liabilities ..............................................66
30. Trade payables and others liabilities ...........................68
31. Management of financial risks .....................................69
32. Classification of financial assets
and liabilities .....................................................................71
33. Subsidiaries .......................................................................72
34. Other lease agreements ..................................................72
35. Guarantees, contingent liabilities and derivatives ...73
36. Related party transactions .............................................75
37. Disputes and litigation ...................................................75
38. Events after the closing date .........................................75
39. Parent company’s financial figures ..............................76
Board of Directors’ proposal
on the Dividend .................................................... 79
Auditor’s Report ................................................... 80
22 Financial Report
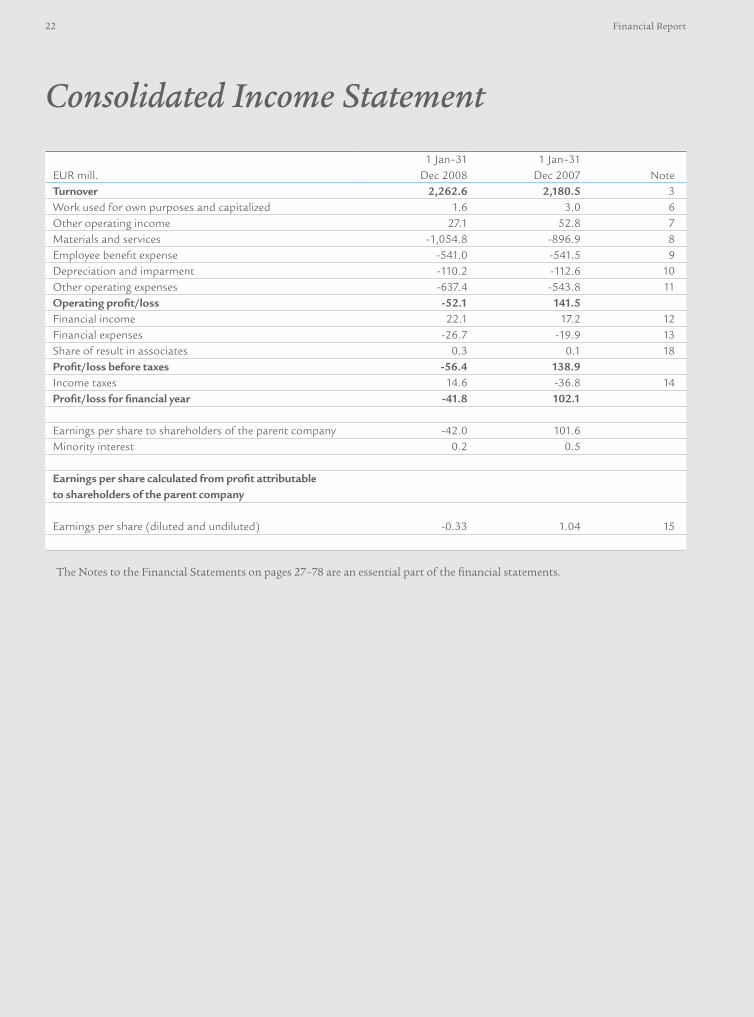
EUR mill.1 Jan–31
Dec 20081 Jan–31
Dec 2007 NoteTurnover 2,262.6 2,180.5 3Work used for own purposes and capitalized 1.6 3.0 6Other operating income 27.1 52.8 7Materials and services -1,054.8 -896.9 8Employee benefit expense -541.0 -541.5 9Depreciation and imparment -110.2 -112.6 10Other operating expenses -637.4 -543.8 11operating profit/loss -52.1 141.5Financial income 22.1 17.2 12Financial expenses -26.7 -19.9 13Share of result in associates 0.3 0.1 18profit/loss before taxes -56.4 138.9Income taxes 14.6 -36.8 14profit/loss for financial year -41.8 102.1
Earnings per share to shareholders of the parent company -42.0 101.6 Minority interest 0.2 0.5
earnings per share calculated from profit attributable to shareholders of the parent company
Earnings per share (diluted and undiluted) -0.33 1.04 15
The Notes to the Financial Statements on pages 27–78 are an essential part of the financial statements.
Consolidated Income Statement

Consolidated Statements 23
EUR mill. 31 Dec 2008 31 Dec 2007 NoteAsseTsNon-current assetsIntangible assets 48.1 46.6 16Tangible assets 1,272.1 1,168.9 17Investments in associates 6.1 5.7 18Receivables 21.5 13.8 19Deferred tax receivables 49.8 10.4 20
1,397.6 1,245.4short-term receivablesInventories 35.1 36.1 21Trade receivables and other receivables 231.8 287.3 22Other financial assets 373.8 518.6 23Cash and cash equivalents 18.3 21.5 24
659.0 863.5Non-current assets held for sale 19.4 34.7 5
Assets, total 2,076.0 2,143.6
sHAReHoLDeRs’ eQuITy AND LIAbILITIesequity attributable to shareholders of parent companyShareholders’ equity 75.4 75.4Other equity 696.3 909.9
771.7 985.3minority interest 1.1 1.7equity, total 772.8 987.0 25
Long-term liabilitiesDeferred tax liability 120.6 144.5 20Interest bearing liabilities 261.1 269.6 29Pension obligations 6.1 15.8 27
387.8 429.9short-term liabilitiesCurrent income tax liabilities 1.5 8.2 14Provisions 61.5 53.6 28Interest bearing liabilities 48.5 54.5 29Trade payables and other liabilities 803.9 610.4 30
915.4 726.7
Liabilities, total 1,303.2 1,156.6
shareholders’ equity and liabilities, total 2,076.0 2,143.6
The Notes to the Financial Statements on pages 27–78 are an essential part of the financial statements.
Consolidated Balance Sheet

24 Financial Report
EUR mill. 1 Jan–31 Dec 2008 1 Jan–31 Dec 2007cash flow from operating activityProfit/-loss for the financial year -41.8 102.1Operations for which a payment is not included 1) 117.2 100.0Interest and other financial expenses 26.7 19.9Interest income -18.9 -11.9Other financial income 2) -3.2 -5.1Dividend income 0.0 -0.2Taxes -14.6 36.8
Changes in working capital:Change in trade and other receivables -2.7 2.4Change in inventories 1.0 2.4Change in accounts payables and other liabilities 39.8 86.4
Interest paid -13.1 -14.6Other financial expenses paid -1.3 -2.3Received interest income 15.4 9.6Received financial income 3.2 0.5Taxes paid 12.5 -24.2Net cash flow from operating activities 120.2 301.8
cash flow from investing activitySell of subsidiaries, net of cash sold 3) 0.0 0.6Acquisitions of subsidiaries -2.6 -0.6Investments in intangible assets -12.7 -15.4Investments in tangible assets -215.9 -346.2Net change of financial interest bearing assets at fair value through profit or loss 4) 183.1 -205.6Sales of tangible fixed assets 69.0 65.2Received dividends 0.0 0.2Change in non-current receivables -7.8 1.7Net cash flow from investing activities 13.1 -500.1
cash flow from financing activities Loan withdrawals 4.9 95.6Loan repayments -50.0 -115.0Share issue 0.0 244.9Purchase of own shares -4.7 0.0Dividends paid -31.9 -8.9Net cash flow from financing activity -81.7 216.6
change in cash flows 51.6 18.3
change in liquid fundsLiquid funds, at the beginning 291.8 273.5Change in cash flows 51.6 18.3Liquid funds, in the end 5) 343.4 291.8
The cash flow statement analyses changes in the Group’s cash and cash equivalents during the financial year. The cash flow statement has been divided according into the IAS 7 standard in operating, investing and financing cash flows.
Consolidated Cash Flow Statement
Consolidated Statements 25
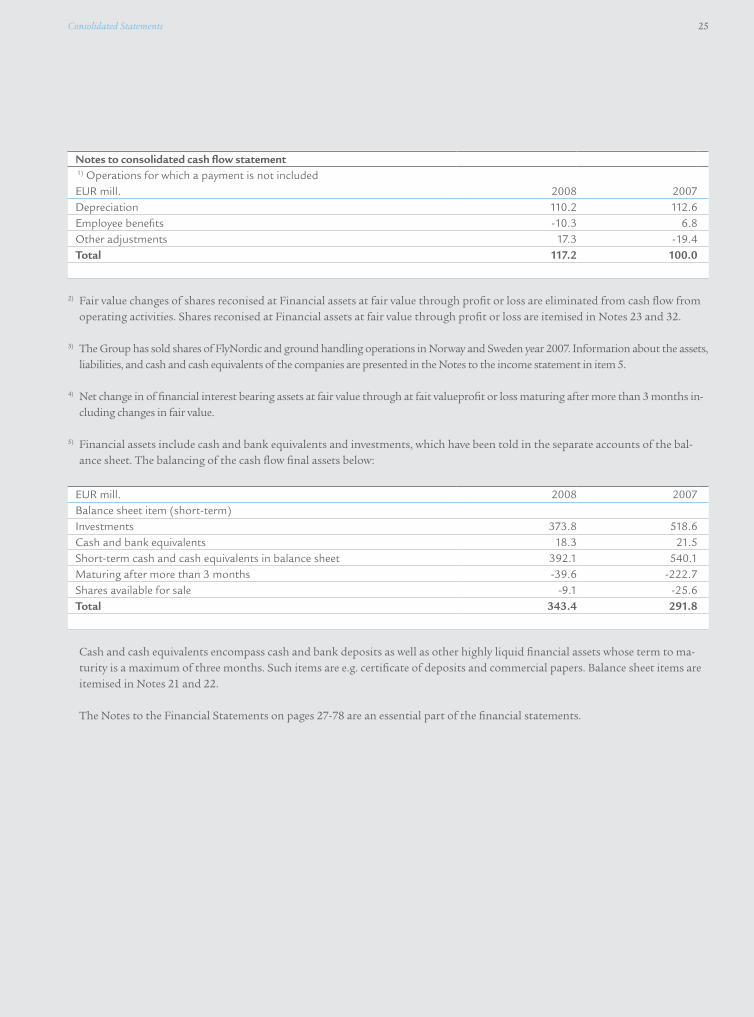
Notes to consolidated cash flow statement 1) Operations for which a payment is not includedEUR mill. 2008 2007Depreciation 110.2 112.6Employee benefits -10.3 6.8Other adjustments 17.3 -19.4Total 117.2 100.0
2) Fair value changes of shares reconised at Financial assets at fair value through profit or loss are eliminated from cash flow from operating activities. Shares reconised at Financial assets at fair value through profit or loss are itemised in Notes 23 and 32.
3) The Group has sold shares of FlyNordic and ground handling operations in Norway and Sweden year 2007. Information about the assets, liabilities, and cash and cash equivalents of the companies are presented in the Notes to the income statement in item 5.
4) Net change in of financial interest bearing assets at fair value through at fait valueprofit or loss maturing after more than 3 months in-cluding changes in fair value.
5) Financial assets include cash and bank equivalents and investments, which have been told in the separate accounts of the bal-ance sheet. The balancing of the cash flow final assets below:
Cash and cash equivalents encompass cash and bank deposits as well as other highly liquid financial assets whose term to ma-turity is a maximum of three months. Such items are e.g. certificate of deposits and commercial papers. Balance sheet items are itemised in Notes 21 and 22.
The Notes to the Financial Statements on pages 27-78 are an essential part of the financial statements.
EUR mill. 2008 2007Balance sheet item (short-term) Investments 373.8 518.6Cash and bank equivalents 18.3 21.5Short-term cash and cash equivalents in balance sheet 392.1 540.1Maturing after more than 3 months -39.6 -222.7Shares available for sale -9.1 -25.6Total 343.4 291.8
26 Financial Report
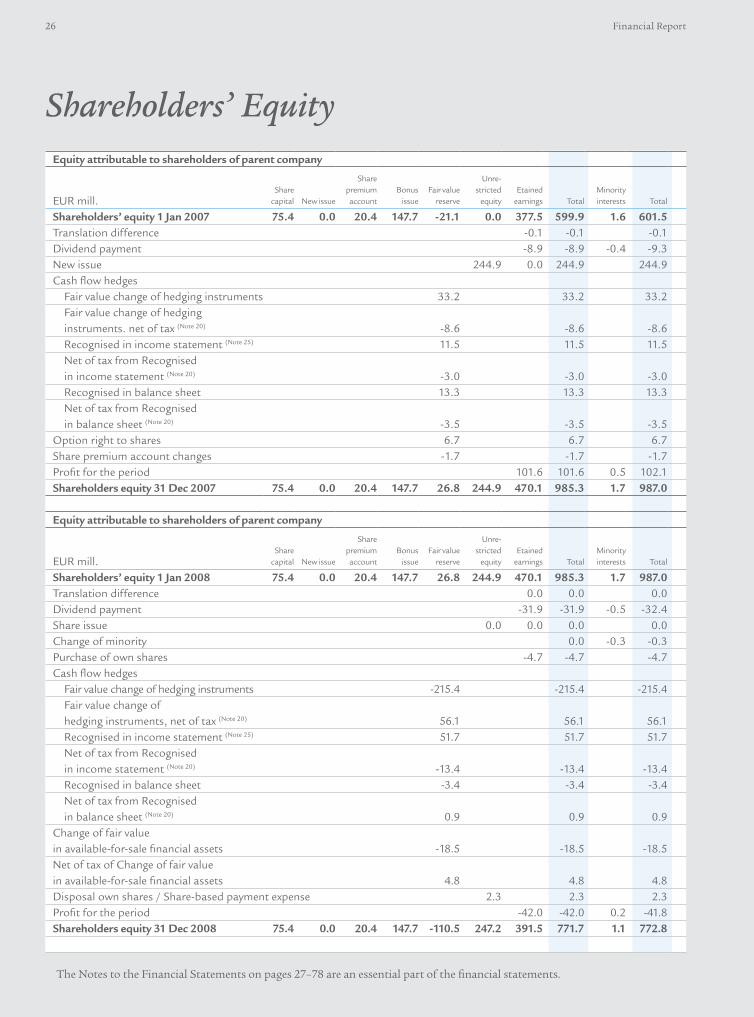
equity attributable to shareholders of parent company
EUR mill. Share capital New issue
Share premium account
Bonus issue
Fair value reserve
Unre-stricted
equityEtained
earnings TotalMinority interests Total
shareholders’ equity 1 Jan 2007 75.4 0.0 20.4 147.7 -21.1 0.0 377.5 599.9 1.6 601.5Translation difference -0.1 -0.1 -0.1Dividend payment -8.9 -8.9 -0.4 -9.3New issue 244.9 0.0 244.9 244.9Cash flow hedges
Fair value change of hedging instruments 33.2 33.2 33.2Fair value change of hedging instruments. net of tax (Note 20) -8.6 -8.6 -8.6Recognised in income statement (Note 25) 11.5 11.5 11.5Net of tax from Recognised in income statement (Note 20) -3.0 -3.0 -3.0Recognised in balance sheet 13.3 13.3 13.3Net of tax from Recognised in balance sheet (Note 20) -3.5 -3.5 -3.5
Option right to shares 6.7 6.7 6.7Share premium account changes -1.7 -1.7 -1.7Profit for the period 101.6 101.6 0.5 102.1shareholders equity 31 Dec 2007 75.4 0.0 20.4 147.7 26.8 244.9 470.1 985.3 1.7 987.0
equity attributable to shareholders of parent company
EUR mill. Share capital New issue
Share premium account
Bonus issue
Fair value reserve
Unre-stricted
equityEtained
earnings TotalMinority interests Total
shareholders’ equity 1 Jan 2008 75.4 0.0 20.4 147.7 26.8 244.9 470.1 985.3 1.7 987.0Translation difference 0.0 0.0 0.0Dividend payment -31.9 -31.9 -0.5 -32.4Share issue 0.0 0.0 0.0 0.0Change of minority 0.0 -0.3 -0.3Purchase of own shares -4.7 -4.7 -4.7Cash flow hedges
Fair value change of hedging instruments -215.4 -215.4 -215.4Fair value change of hedging instruments, net of tax (Note 20) 56.1 56.1 56.1Recognised in income statement (Note 25) 51.7 51.7 51.7Net of tax from Recognised in income statement (Note 20) -13.4 -13.4 -13.4Recognised in balance sheet -3.4 -3.4 -3.4Net of tax from Recognised in balance sheet (Note 20) 0.9 0.9 0.9
Change of fair value in available-for-sale financial assets -18.5 -18.5 -18.5Net of tax of Change of fair value in available-for-sale financial assets 4.8 4.8 4.8Disposal own shares / Share-based payment expense 2.3 2.3 2.3Profit for the period -42.0 -42.0 0.2 -41.8shareholders equity 31 Dec 2008 75.4 0.0 20.4 147.7 -110.5 247.2 391.5 771.7 1.1 772.8
The Notes to the Financial Statements on pages 27–78 are an essential part of the financial statements.
Shareholders’ Equity
Consolidated Statements 27
1. BASIC INfOrMATION ABOuT ThE COMPANy
The Finnair Group engages in worldwide air transport oper-ations and supporting services. The Group’s operations are divided into the Scheduled Passenger Traffic, Leisure Traf-fic, Aviation Services and Travel Services business areas. The Group’s parent company is Finnair Plc, which is domiciled in Helsinki at the registered address Tietotie 11 A, Vantaa, Fin-land. The parent company is listed on the Helsinki Stock Ex-changes. The Board of Directors of Finnair Plc has approved these financial statements for publication at its meeting on 4 February 2009. Under Finland’s Companies Act, shareholders have the option to accept or reject the financial statements in a meeting of shareholders, which will be held after the publi-cation of the financial statements. The AGM can also change the financial statements.
2. ACCOuNTING PrINCIPLES
The accounting principles of the consolidated financial state-ments are presented below. The accounting principles have been followed in the periods presented in the consolidated financial statements unless otherwise stated.
Basis of preparation Finnair Plc’s consolidated financial statements for 2008 have been prepared according to the International Financial Re-porting Standards (IFRS) and in their preparation the IAS and IFRS standards as well as the SIC and IFRIC interpretations in effect on 31 December 2008 have been followed. By Interna-tional Financial Reporting Standards is meant the standards accepted for application in the EU and interpretations issued about them in accordance with the procedure laid down in Finnish law and provisions issued by virtue thereof in the EU Regulation (EC) No.1606/2002. The notes to the consolidat-ed financial statements also comply with Finnish accounting and corporate laws.
The 2008 consolidated financial statements have been pre-pared based on original acquisition costs, except for financial assets recognisable through profit and loss at fair value, finan-cial assets which are available-for-sale, and derivative contracts, which have been valued at fair value. Financial statement data is presented in millions of euros, rounded to the nearest one hundred thousand euros.
The preparation of financial statements in accordance with IFRS standards requires Group management to make certain estimates and to exercise discretion in applying the account-ing principles. Information about the discretion exercised by management in applying the accounting principles followed by the Group and that which has most impact on the figures presented in the financial statements has been presented in the item “ACCOUNTING PRINCIPLES THAT REQUIRE MAN-AGEMENT DISCRETION AND MAIN UNCERTAINTY FAC-TORS RELATING TO ESTIMATES”.
Principles of consolidation
SuBSIDIArIES Finnair Plc’s consolidated financial statements include the parent company Finnair Plc and all its subsidiaries. As sub-sidiaries are deemed to be those companies in which the par-ent company directly or indirectly owns more than 50% of the votes or in which it otherwise exercises the right to determine the company’s financial and business policies in order to ben-efit from its activities.
The book value of shares in undertakings included in consol-idation has been eliminated using the acquisition cost method. Subsidiaries that have been acquired are consolidated from the date on which the Group has acquired control, and sub-sidiaries that have been disposed of are no longer consolidat-ed from the date that control ceases. All of the Group’s inter-nal transactions, receivables, liabilities and unrealised gains as well as internal distribution of profit are eliminated in the consolidated financial statements. Unrealised losses are not eliminated in the event that a loss results from impairment. The financial statements of subsidiaries have been amended to correspond with the accounting principles in use within the Group.
ASSOCIATED uNDErTAKINGSAssociated undertakings are undertakings in which the Group generally has 20–50% of the votes or in which the Group has sig-nificant influence but in which it does not exercise control.
Holdings in associated undertakings have been included in the consolidated financial statements by the equity method. The Group’s share of earnings after the time of acquisition is recognised in the income statement. If the Group’s share of the loss of an associated undertaking exceeds the book value of the investment, the investment is entered in the balance sheet at zero value unless the Group has incurred obligations on be-half of the associated undertaking. Unrealised gains between the Group and associated undertakings have been eliminated to the extent of the Group’s holding. The Group’s share of an associated undertaking includes goodwill arising from its ac-quisition. Associated undertakings’ financial statements have been converted to correspond with the accounting principles in use in the Group.
MINOrITy INTErEST AND TrANSACTIONS wITh MINOrITyMinority interest is presented in the balance sheet separately from liabilities and the parent company’s shareholders’ equity as its own item as part of shareholders’ equity. In the income statement is presented the distribution of profit for the finan-cial year to the parent company’s shareholders and minority interest. Minority interest of accrued losses are recognised in the consolidated financial statements up to a maximum of the amount of the investment.
The Group applies the same accounting principles to trans-actions made with minorities as with shareholders. In acqui-sitions of minority interests, the difference between acqui-
Notes to the Financial Statements
28 Financial Report
sition cost and the acquired equity is recognised directly in shareholders’ equity.
Translations of foreign currency itemsItems included in each subsidiary’s financial statements are valued in the foreign currency that is the main currency of operating environment of each subsidiary (“operational cur-rency”). The consolidated financial statements have been pre-sented in euros, which is the parent company’s operational and presentation currency.
Monetary items denominated in foreign currency have been translated into the operating currency using the mid-market exchange rates on the closing date. Advance payments made and received are entered at the exchange rate of the operating currency on the date of payment. Non-monetary items have been translated into the operating currency using the exchange rate on the date of the transaction. Translation differences on operations are included in the income statement’s operating profit, and translation differences on foreign currency loans are included in financial items.
The income statements of foreign subsidiaries have been translated into euros using the exchange rates on date of oc-casion. Balance sheets of foreign subsidiaries have been trans-lated into euros using the exchange rates on the closing date. Translation differences of shareholders’ equity items arising from eliminations of the acquisition cost of foreign subsidi-aries are recognised in shareholders’ equity. When a foreign subsidiary is sold, these translation differences are recognised in the income statement as part of the overall profit or loss arising from the sale. Translation differences that have arisen since the IFRS transition date are presented as a separate item in shareholder’s equipment when preparing the consolidated financial statements.
Goodwill arising from foreign acquisitions is treated as a foreign exchange asset of the foreign unit and is translated into euros using the exchange rate on the closing date.
Derivate contracts and hedge accountingAccording to its financial policy, the Finnair Group uses foreign exchange, interest rate and commodity derivatives to reduce the exchange rate, interest rate and commodity risks which arise from its balance sheet items, foreign exchange purchase contracts, anticipated purchases and sales as well as future jet fuel purchases.
The derivatives are recognised at the time they are made in the balance sheet at original acquisition cost and are subse-quently valued at fair value in each financial statement and interim report. Gains and losses arising from changes in the fair value are presented in the financial statements according to the original classification of the derivative. Gains and loss-es on derivatives qualifying for hedge accounting are recog-nised in accordance with the underlying asset being hedged. Derivative contracts are designated at inception as hedges for future cash flows and binding purchase contracts (cash flow hedges or fair value hedges) or as derivatives not meeting the hedge accounting criteria or to which hedge accounting is
not applied (economic hedges). Hedging of the fair value of the net investment of foreign units or embedded derivatives have not been used.
At the inception of hedge accounting, the Finnair Group documents the relationship between the hedged item and the hedging instrument as well as the Group’s risk management objectives and the strategy for the inception of hedging. The Group documents and assesses, at the inception of hedging and at least in connection with each financial statements, the effectiveness of hedge relationships by examining the capacity of the hedging instrument to offset changes in the fair value of the hedged item or changes in cash flows. The values of de-rivatives in a hedging relationship are presented in the balance sheet item short–term financial asset and liabilities.
The Finnair Group implements in accordance with IAS 39 hedge accounting principles the hedging of future cash flows (cash flow hedging) in terms of the price and foreign curren-cy risk of jet fuels as well as foreign currency hedging of lease payments and aircraft purchases.
Fair value hedging is implemented in Finnair in respect of firm orders for new Airbus aircrafts. These binding purchase agreements are treated under IAS 39 as firm commitments whose fair value changes of hedged part arising from foreign currency movements is recognised in the balance sheet as an asset item and any corresponding gains or losses recognised through profit and loss. Similarly the fair value of instruments hedging these purchases are presented in the balance sheet as a liability or receivable and the change in fair value is recog-nised through profit and loss.
The change in the fair value of effective portion of deriva-tive instruments that fulfil the terms of cash flow hedging are entered directly in a fair value reserve in equity to the extent that the requirements for the application of hedge account-ing have been fulfilled. The gains and losses recognised in eq-uity are transferred to the income statement in the period in which the hedged item is entered in the income statement. When an instrument acquired for the hedging of cash flow matures or is sold or when the criteria for hedge accounting are no longer fulfilled, the gain or loss accrued from hedging instruments remain in equity until the forecast transaction takes place. However, if the forecast hedged transaction is not longer expected to occur, the gain or loss accrued in equity is released immediately to the income statement.
The effectiveness of hedging is tested on a quarterly basis. The effective portion of hedging is recognised in the fair value reserve of shareholders’ equity, from which it is transferred to income statement when the hedged item is realised or, in terms of investments, as an acquisition cost adjustment.
To hedge the interest rate and foreign exchange risks of for-eign currency loans the Finnair Group uses foreign exchange and interest-rate swap contracts. The translation difference arising from foreign exchange and interest–rate swap contracts that fulfil the conditions of hedge accounting is recognised concurrently against the translation difference arising from the loan, while other changes in fair value are recognised in terms of the effective portion in the fair value reserve of share-
Consolidated Statements 29
holders’ equity. Interest income and expenses are recognised in financial income and expenses.
The Finnair Group concludes jet fuel swaps (forward con-tracts) and options in order to even out future price fluctua-tions in jet fuel purchases. Changes in the fair value of jet fuel hedging derivatives are recognised directly in the fair value re-serve in respect of derivatives defined as cash-flow hedges that fulfil the requirements of IAS 39 hedge accounting. Accrued gains and losses on derivatives recognised in shareholders’ equity are recognised in the income statement as income or expenses for the financial period in which the hedged item is recognised in the income statement. If a forecasted cash flow is no longer expected to occur, the accrued gains and losses reported in the shareholder’s equity are presented directly as other income and expenses for the financial period. Changes in the fair value of derivative contracts, in so far as the IAS 39 hedge accounting criteria are not fulfilled, are presented in other operating income and expenses during their term to maturity.
The change in the fair value of derivatives not qualifying for hedge accounting and which are arranged to hedge operational cash flow are recognised in the income statement item other operating expenses. Changes in the fair value of interest rate derivatives not qualifying for hedge accounting are recognised in the income statement’s financial income and expenses.
Principle of revenue recognitionRevenue from services is recognised as revenue in the finan-cial period in which the services are provided for the customer. Revenue from the sale of goods is recognised when significant risks and rewards of owning the goods are transferred to the buyer. In such cases the Group has no longer any supervision of control over the products.
Scheduled Passenger Traffic and Leisure Traffic sales are recognised as revenue when the flight is flown in accordance with the flight traffic programme. Aviation Services’ sales are recognised as revenue when the service is completely per-formed. Travel Services’ sales are recognised as revenue when the service has been conveyed. Discounts granted and indi-rect taxes, among other things, are deducted from sales as adjustment items.
The recognition as revenue of unused flight tickets is based on the expiry dates of the tickets.
Interest incomeInterest income is recognised on a time-proportion basis us-ing the effective interest method. When a receivable is im-paired, the group reduces the carrying amount to its recover-able amount, being the estimated future cash flow discounted at the original effective interest of the instrument, and con-tinues unwinding the discount as interest income. Interest income on impaired loans is recognised using the original effective interest rate.
Dividend incomeDividend income is recognised when the company has acquired a legal right to receive the dividends.
Operating profitThe IAS 1 Presentation of Financial Statements standard does not define the concept ‘operating profit’. The Group has de-fined it as follows: operating profit is the net sum that is formed from turnover plus other operating income, less purchase costs adjusted by change in inventories of work in progress as well as costs arising from production for own use, less costs, de-preciation and possible impairment losses arising from em-ployee benefits as well as other operating expenses. All income statement items other than those mentioned above are pre-sented below the operating profit. Translation differences and changes in fair values of derivatives are included in operating profit if they arise from items related to business operations; otherwise they are recognised in financial items.
Income taxesThe tax expense for the period comprises current and deferred tax. Tax is recognised in the income statement, except to the extent that it relates to items recognised directly in equity. In this case, the tax is also recognised in equity.
A deferred tax liability or asset is calculated for all tempo-rary differences between accounting and taxation using the tax rates prescribed at the closing date.
The largest temporary differences arise from sales of tangi-ble assets, depreciation, revaluations of derivative contracts, defined-benefit pension schemes, unused tax losses, and val-uations at fair value made in connection with acquisitions. Deferred tax is not recognised for subsidiaries’ undistributed earnings where it is probable that the difference will not re-verse in the foreseeable future.
A deferred tax asset is recognised to the extent that it will prob-ably be available to taxable profit of future financial years, against which the deductible temporary difference can be utilised.
The Group’s main business takes place in Finland. Taxes based on taxable income for the financial year have been cal-culated with a tax rate of 26 per cent. Taxes based on the tax-able income of foreign subsidiaries for the financial year have been calculated at tax rates of 0–26 per cent.
Public grantsPublic grants, for example government aid for simulator train-ing, has been recognised in other operating income. Public grants that the Group may receive, for example, for fixed as-set acquisitions are recognised as a reduction in original ac-quisition cost. Grants are recognised in the form of smaller depreciations over the useful life of the asset.
Tangible fixed assetsTangible fixed assets are recognised in the balance sheet when the financial benefit is longer than one year, in acquisition cost, including the direct costs arising from the acquisition. Tangi-ble fixed assets are valued at original acquisition cost less ac-
30 Financial Report
cumulated depreciation and write-downs. Aircraft and their engines as well as flight simulators are
depreciated on a straight-line basis over their expected useful lives. The acquisition cost of aircraft is allocated to the air-craft fuselage, engines and heavy maintenance and these are depreciated as separate assets. Residual value depreciations or straight-line basis over their expected useful lives are made for buildings and residual value depreciations for other fixed assets. Land areas are not depreciated.
Other equipment includes office equipment, furnishings, cars and transportation vehicles used at airports.
Depreciation is calculated using the following principles, depending on the type of asset:
•Buildings,50yearsfromtimeofacquisitiontoaresidual value of 10% or 3–7% of expenditure residue
•Aircraftandtheirengines:onastraight-linebasisasfollows:
- Airbus A320 family aircraft, over 20 years to a residual value of 10%
- Embraer fleet aircraft, over 20 years to a residual value of 10%
- New A340 family aircraft, over 15 years to a residual value of 10%
- New A330 family aircraft, over 18 years to a residual value 10 %
- Used jet aircraft more than six years old, over 10 years to a residual value of 10%
- New turboprop aircraft, over 12 years to a residual value of 10%
- Turboprop aircraft acquired as used, over 10 years to a residual value of 10%
- Aircraft to be withdrawn from use, fully on a straight-line basis according to their useful life outlined in the fleet modernisation plan
•Heavymaintenanceofaircraft,onastraight-linebasisduring the maintenance period
•Embraercomponents,over15years to a residual value of 10%
•Airbuscomponents,over15years to a residual value of 10%
•Flightsimulatorsaredepreciatedasper the corresponding type of aircraft
•Depreciationofothertangiblefixedassets, 23% of the undepreciated residual value
The residual values and estimated useful lives of assets are adjusted at each closing date and if they differ significantly from previous estimates, the depreciation periods and residual values are changed accordingly.
Ordinary repair and maintenance expenditure is recognised as an expense in the financial period in which it arises. Expendi-ture of modernisation and improvement projects that are sig-nificant in size (mainly aircraft modifications) are capitalised in the balance sheet if it is probable that an additional finan-cial reward will arise to the Group in future. Modernisation and improvement projects are depreciated on a straight-line basis over their expected useful lives. The carrying amount of the replaced part is derecognised.
Depreciation of a tangible fixed asset is discontinued when the tangible fixed asset is classified as being held for sale in ac-cordance with IFRS 5 standard Non–Current Assets Held for Sale and Discontinued Operations.
Gains arising from the disposal and withdrawal from use of tangible fixed assets are included in the income statement in the item other operating income, and losses in the item other operating expenses.
Intangible assetsIntangible fixed assets are recognised in the balance sheet, when the financial benefit is longer than one year, at acquisi-tion cost, including the direct costs arising from the acqui-sition. Depreciation and impairment of intangible assets are based on the following expected economic lifetimes:
Goodwill impairment testingComputer programs 3–8 yearsOther intangible assets, depending on their nature 3–10 years
GOODwILLGoodwill corresponds to the portion of acquisition costs that exceeds the Group’s share of the fair value of the net assets at the time of acquisition of the subsidiary, associated under-taking or joint venture.
Goodwill is tested annually for possible impairment. For this purpose goodwill has been allocated to cash generating units. Annual impairment testing is performed on the basis of discounted cash flows. This method is based on expected cash flows that have been updated by revenue growth rate and the cost of capital. If the present value of the expected fu-ture operational cash flow of some business operation is low-er than the corresponding balance sheet value that includes goodwill, the impairment is recognised as an expense in the income statement.
rESEArCh AND DEVELOPMENT EXPENDITurEResearch and development on aircraft, systems and opera-tions is conducted primarily by the manufacturers. Research and product development expenditure relating to marketing and customer service is recognised as an expense at the time at which it is incurred because the capitalization criterion will not fill. Expenses are included in the consolidated income state-ment in a cost item according to the nature of the expense.
Development expenditure is recognised in the balance sheet as an intangible asset when it is probable that the develop-ment project will succeed both commercially and technically and the project expenses can be reliably assessed. The Group has no capitalisable development expenditure.
COMPuTEr SOfTwArEComputer software maintenance costs and expenditure on the research stage of software projects are recognised as expenses at the time they are incurred. Software projects’ minor devel-opment costs, moreover, are not capitalised; they are recog-nised as an expense.

Consolidated Statements 31
User rights and licences acquired for IT software are pre-sented in the category intangible rights and in other respects in other intangible assets. Acquired user rights and licences are entered in the balance sheet at acquisition cost, plus the costs of making the licence and software ready for use. Capitalised expenses are depreciated over a useful life of 3–8 years.
OThEr INTANGIBLE ASSETSOther intangible assets, such as e.g. patents, trademarks and licences, are valued at acquisition cost less recognised depre-ciation and impairment. Intangible assets are depreciated on a straight-line basis over 3–10 years.
NON-CurrENT ASSETS hELD fOr SALE AND DISPOSAL GrOuPSNon-current assets or asset groups and their related liabili-ties (disposal groups) that have a high probability of being sold within a year of classification are classified as assets held for sale.
Immediately before classification, assets held for sale or as-sets and liabilities of disposal groups are valued according to the IFRS standards applicable to them. From the moment of classification, assets held for sale (or disposal groups) are valued at the lower of the carrying amount or their fair value less cost of sale. Depreciation of these assets is discontinued at the moment of classification.
Lease agreements
ThE GrOuP IS ThE LESSEETangible fixed asset lease agreements where a substantial part of the risks and rewards of ownership are transferred to the Group are classified as finance leases. The asset item acquired with a finance lease is entered at the start of the agreement as an asset in the balance sheet at the lower of the fair value of the leased property and the present value of the minimum lease payments. A corresponding sum is recognised as a fi-nancial asset. The lease payments payable are allocated be-tween finance expenses and debt reduction. The correspond-ing rental obligations, net of finance charges, are included in other long-term interest-bearing liabilities. Financing inter-est is recognised in the income statement during the lease so as to achieve a constant interest rate on the finance balance outstanding in each financial period. Asset items leased under a finance lease are depreciated over the shorter of the asset’s useful life and the term of the lease.
Tangible fixed asset-related lease agreements where a sub-stantial part of the risks and rewards of ownership are retained by the lessor are classified as other leases. Payments made un-der other leases are charged to the income statement over the term of the lease.
The operating lease liabilities under other leases of Finnair Group aircraft have been treated as rental expenses in the income statement. Lease payments due in future years under agreements are presented in the notes to the financial statements.
ImpairmentOn every closing date the Group reviews asset items for any indication of impairment losses. If there are such indications, the amount recoverable from the said asset item is assessed. The recoverable amount is also assessed for the following asset items irrespective of whether there are indications of impair-ment: goodwill and intangible assets which have an indefinite useful life. The need for impairment is examined on the cash generating unit level.
The recoverable amount is the higher of the asset item’s fair value, less the cost arising from disposal, and its value in use. By value in use is meant the expected future net cash flows obtainable from the said asset item or cash generating unit, discounted to their present value. The value of the re-coverable amount of financial assets is either the fair value or the present value of expected future cash flows discount-ed at the original effective interest rate. An impairment loss is recognised when the carrying amount of an asset item is greater than the recoverable amount. The impairment loss is recognised in the income statement. The impairment loss is reversed if a change in conditions has occurred and the recov-erable amount of the asset has changed since the date when the impairment loss was recognised. The impairment loss is not reversed, however, by more than that which the carrying amount of the asset would be without the recognition of the impairment loss. Impairment losses recognised for goodwill are not cancelled under any circumstances, neither are impair-ment losses on equity investments classified as available for sale financial assets cancelled through profit and loss. From receivables included according to IAS 39 in the allocated ac-quisition price, interest income is recovered after impairment using the interest rate that has been used as the discount rate when calculating the impairment.
InventoriesInventories are asset items that are intended for sale in the nor-mal course of business, are handled in the production process for sale or are raw materials or supplies intended for consump-tion in the production process.
Inventories are valued at the lower of their acquisition cost and probable net realisable value. Acquisition cost is deter-mined using the average cost method. The acquisition cost of inventories includes all acquisition-related costs, produc-tion costs and other costs that have arisen from the transfer of the inventory item to the location and space where the item is situated at the time of inspection. The production costs of inventories also include a systematically allocated propor-tion of variable and fixed production overheads. Net realisa-ble value is the estimated selling price in the ordinary course of business, less the costs required to complete the product and selling expenses.
Trade receivablesIn trade receivables are recognised assets received on an ac-crual basis for the products and services of the company’s
32 Financial Report
classified as Financial assets at fair value through profit and loss and are valued in each financial statement at fair value. Realised and unrealised gains and losses arising from changes in fair value are recognised in the income statement (either in other operating income and expenses or in financial items) in the period in which they arise. Financial assets at fair value through profit and loss as well as those maturing within 12 months are included in current assets.
Held-to-maturity investments are financial assets not belong-ing to derivative contracts which mature on a specified date and which a company has the firm intent and ability to hold to maturity. They are valued at allocated acquisition cost and they are included in long-term assets. On the closing date the Group had no assets belonging to the said group.
Investments which do not have a maturity date and whose date of sales has not been decided are classified as available-for-sale financial assets. Available-for-sale financial assets are presented in the balance sheet in non-current financial assets. A change in the fair value of available-for-sale financial assets is recognised in the shareholders’ equity fair value reserve, from which it is transferred to the income statement in con-nection with a sale.
Finnair Group assesses on each closing date whether there is any objective evidence that the value of a financial asset item or group of items has been impaired. If there is objective evi-dence that an impairment loss has arisen for loans and other receivables entered at allocated acquisition cost in the balance sheet or for held-to-maturity investments, the size of the loss is determined as the difference the book value of the asset item and the present value of expected future cash flows of the said financial asset item discounted at the original effective interest rate. The loss is recognised through profit and loss.
Financial liabilities are recognised at fair value on the ba-sis of the original consideration received. Transactions costs have been included in the original carrying amount of the fi-nancial liabilities. Later, all financial liabilities are valued at allocated acquisition cost using the effective yield method or at fair value through profit or loss. Financial liabilities are included in long- and short-term liabilities and they can be interest-bearing or non-interest-bearing.
Unquoted shares are valued in the Finnair Group at their acquisition price in the absence of a reliable fair value.
Loan receivables and other receivables are recognised at am-ortised cost using the effective interest method. Loans and other receivables include trade receivables, deferred charges, other long term receivables and security deposits for aircraft operational lease agreements.
Trade payables are recognised initially at fair value and sub-sequently measured at amortised cost using the effective in-terest method.
Derecognition of financial liabilities takes place when Group has filled the contractual obligations.
Derecognition of financial assets takes place when the Group has lost a contractual right to receive the cash flows or when it has trans-ferred substantially the risks and rewards outside the Group.
Fair values of financial liabilities are based to discounted cash
operations. Trade receivables are recognised initially at fair value and subsequently measured at amortised cost using the effective interest method.
When the Group has objective evidence that uncertainty is attached to the collection of trade receivables, then they are valued at their lower probable fair value. Public financial prob-lems that indicate that a customer is going into bankruptcy, significant financial restructuring or substantial delays in pay-ments are examples of objective evidence that might cause trade receivables to be valued at probable fair value. Impairment of trade receivables is recognised in other operating expenses.
Trade receivables denominated in foreign currency are val-ued at the exchange rate on the closing date.
Expences of liabilitiesExpences of liabilities are recognised in income statement at the period when they are occurred.
LOANSInitially loans are valued at their fair value. Loans that are due for payment within 12 months are presented in short-term li-abilities. Foreign currency loans are valued at the mid-market exchange rate on the closing date and translation differences are recognised in financial items.
The Group’s fixed-interest USD-denominated aircraft fi-nancing loans have been hedged with long-term cross cur-rency interest rate swaps. Fixed-interest derivative contracts and their corresponding loans form a hedging relationship. The derivative contracts in question are valued at fair value. Change of fair value is recognised in the shareholder’s equity fair value reserve. Correspondingly, loans in the hedging rela-tionship are valued at the allocated acquisition cost.
Other USD-denominated loans and their corresponding variable interest derivative contracts are valued at fair value, and the change in fair value is recognised in the income state-ment’s financial items. Euro-denominated loans and bonds are valued at allocated acquisition cost.
Financial assets and financial liabilitiesIn the Group, financial assets have been classified according to the IAS 39 standard “Financial Instruments: Recognition and Valuation” into the following categories: financial assets at fair value through profit or loss (assets held for trading), held-to-maturity investments, loans and other receivables, as well as available-for-sale financial assets. The classification is made on the basis of the purpose of the acquisition of the financial assets in connection with the original acquisition. All purchases and sales of financial assets are recognised on the trade date.
The financial asset category recognised at fair value through profit or loss includes assets held for trading purposes and as-sets measured at fair value through profit or loss on initial rec-ognition. Financial assets at fair value through profit and loss have mainly been acquired to obtain a gain from short-term changes in market prices. All those derivatives that do not ful-fil the conditions for the application of hedge accounting are
Consolidated Statements 33
flows. Interest rate arises from risk free portion and company risk premium. Fair value of Finance lease contracts is evalu-ated by discounting cash flows with interest, which complies with interest from other similar lease contracts. Other than derivative receivables are in balance sheet at their original val-ue, because discounting them is irrelevant considering short maturity. Accounts payable and other loans are recognised at their original value, because discounting them is irrelevant considering short maturity.
Cash and cash equivalentsCash and cash equivalents consist of cash reserves and short-term bank deposits whose term to maturity is a maximum of three months. Foreign exchange-denominated items have been converted into euros using the mid-market exchange rates on the closing date.
Derivate instrumentsDerivative instruments are valued in the balance sheet at fair value, which is determined as the value at which the instru-ment could be exchanged between knowledgeable, willing and independent parties, with no compulsion in the sales situ-ation to sell or buy. The fair values of derivatives are deter-mined as follows:
The fair values of all derivatives are calculated using the ex-change rates, interest rates, volatilities and commodity price quotations on the closing date. The fair values of currency forward contracts are calculated at the present value of fu-ture cash flows. The fair values of currency options are calcu-lated using generally accepted option valuation models. The fair values of interest rate swap contracts are calculated at the present value of future cash flows. The fair values of in-terest rate and currency swap contracts are calculated at the present value of future cash flows. The fair values of interest rate options are calculated using generally accepted option valuation models. The fair values of commodity contracts are calculated at the present value of future cash flows. The fair values of options are calculated using generally accepted op-tion valuation models.
Shareholders’ equityThe nominal value of shares has been recognised in the share capital before an amendment to the Articles of Association registered on 22 March 2007.
At the end of the financial year, the nominal value of paid but as yet unregistered shares is recognised in the share issue account. Share issue gains that arose in 1997–2006 have been recognised in the share premium account, less transaction expenses, reduced by tax effect, relating to increases in share capital. Additionally, costs of the company’s share-based pay-ments are recognised in the share premium account as per the IFRS 2 standard. Possible gains from the sale of treas-ury shares, reduced by tax effect, have been recognised in the share premium account before the new Companies Act came into effect on 1 September 2006 Gains from the sale of treas-ury shares that take place after the change in legislation are
recognised, reduced by tax effect, in the invested unrestricted equity fund.
The share issue gain from the 2007 share issue, less trans-action expenses, has been recognised in the invested unre-stricted equity fund.
Gains from share issues arising before 1997 have been rec-ognised in the general reserve.
The fair value reserve includes changes in the fair value of derivative instruments used in cash-flow hedging, less de-ferred taxes.
Retained earnings include profit from previous financial years, less dividends distributed and acquisitions of own shares. In connection with the sale of own shares (treasury stock) the original acquisition cost is returned to retained earnings. Under the IAS 8 standard, changes in accounting principles and errors are also recognised in the results of previous fi-nancial years.
DividendThe dividend liability to the company’s shareholders is rec-ognised as a liability in the consolidated financial statements when a meeting of shareholders has decided on the dividend distribution.
Treasury stock (own shares)When the company or its subsidiaries have acquired their own shares, the company’s shareholders’ equity is deducted by an amount consisting of the consideration paid less transaction costs after taxes unless the own shares are cancelled. No gain or loss is entered in the income statement for the sale, issue or cancellation of own shares; the consideration received is presented as a change of shareholders’ equity.
Employee benefits
PENSION LIABILITIESPension schemes are classified as defined-benefit and defined-contribution schemes. Payments made into defined-contribu-tion pension schemes are recognised in the income statement in the period to which the payment applies. In defined-benefit pension schemes, obligations are calculated using the projected unit credit method. Pension expenses are recognised as an ex-pense over the employees’ period of service based on calcula-tions made by authorised actuaries. Actuarial gains and losses are recognised in the income statement over the employees’ average remaining term of service to the extent that they ex-ceed the greater of the following: 10% of pension obligations or 10% of the fair value of assets. When calculating the present value of pension obligations the interest rate on government securities is used as the discount rate. The terms to maturity of government securities approximate to the terms to matu-rity of the related pension liabilities.
The Group’s foreign sales offices and subsidiaries have vari-ous pension schemes that comply with the local rules and practices of the countries in question. All of the most signifi-cant pension schemes are defined-contribution schemes. The
34 Financial Report
statutory pension cover of the employees of the Group’s Finn-ish companies has been handled by a Finnish pension insur-ance company. The pension cover is a defined-contribution scheme. The pension schemes of the parent company’s Presi-dent & CEO and members of the Board of Management as well as those of the managing directors of subsidiaries are in-dividual schemes, and the retirement ages under these schemes vary from 60 to 65 years. All of these pension schemes are also defined-contribution schemes.
Other (voluntary) pension cover has been arranged in Finnair Plc’s Pension Fund, in which the pension schemes are entirely defined-benefit schemes. These schemes specify pension ben-efits, disability compensation, post-retirement health-care and life insurance benefits as well as benefits paid in connection with the termination of employment.
OThEr POST-EMPLOyMENT BENEfITSAll of the Group’s post-employment benefits are defined-con-tribution benefits.
ShArE-BASED PAyMENTS During the financial year the Group has had a share bonus scheme to which the IFRS 2 standard applies.
In the share bonus scheme 2007–2009, key individuals are allocated shares and those who belong to the scheme have the possibility to receive as the bonus both company shares and cash amounting to 1.5 times the share bonus. The bonus is awarded for a three-year performance period and according to how targets set for the performance period have been achieved. The Board of Directors decides annually the targets to be set. The targets are determined on the basis of the Group’s financial and/or operational development. Achieving the targets set for the performance period determines how large a proportion of the maximum bonus will be paid. The fair value of the granted shares on the date they are granted is recognised in personnel expenses and as an increase in shareholders’ equity during the financial period according to how the degree of fulfilment of the targets is assessed. The cash bonus is recognised on the basis of the fair value of the shares at each point in time in personnel expenses and as a liability. The expense impact on the period in question is allocated in the interim reports. Own shares for the share bonus scheme have been acquired in the market, so the granting of these shares does not dilute share ownership.
ProvisionsProvisions are recognised when the Group has a present legal or constructive obligation as the result of a past event, the ful-filment of the payment obligation is probable, and a reliable estimate of the amount of the obligation can be made. If it is possible to receive compensation for part of the obligation from a third party, the compensation is recognised as an as-set item when it is in practice certain that the compensation will be received. Provisions are valued at the net present val-ue of the expenses required to cover the obligation. The dis-count factor used when calculating present value is selected so that it describes the market view at the time of examina-
tion of the time value of the money and the risk relating to the obligation.
Restructuring provisions are recognised when the Group has prepared a detailed restructuring plan and has begun to implement the plan or has announced it will do so. A restruc-turing plan must include at least the following information: the operations affected, the main operating points affected, the workplace locations, working tasks and estimated number of the people who will be paid compensation for the ending of their employment, the likely costs and the date of imple-mentation of the plan.
The Group is obliged to surrender leased aircraft at a cer-tain maintenance standard. To fulfil these maintenance obli-gations the Group recognises heavy maintenance provisions. The basis for the provision is flight hours flown during the maintenance period.
Segment reportingSegment information is presented according to the Group’s business and geographical segment division. The Group’s pri-mary form of segment reporting is according to business seg-ments. Business segments are based on the Group’s internal organisational structure and financial reporting of manage-ment. The business segments are Scheduled Passenger Traffic, Leisure Traffic, Aviation Services and Travel Services.
The Scheduled Passenger Traffic segment is responsible for sales, service concepts, flight operations and functions related to the procurement and financing of aircraft. Scheduled Pas-senger Traffic leases to the Leisure Traffic division the flight crews it requires. In 2008 the units belonging the Scheduled Passenger Traffic segment were Finnair Scheduled Passenger Traffic, the feeder airline Aero As, Finnair Cargo Oy and Finnair Cargo Terminal Operations Oy as well as Finnair Aircraft Fi-nance Oy, which manages the Group’s fleet.
The Leisure Traffic segment consists of Finnair Leisure Flights and the package tour companies Oy Aurinkomatkat-Suntours Ltd Ab, Matkayhtymä Oy, Calypso and Ou Hori-zon Travel.
The Aviation Services segment comprises aircraft mainte-nance services, ground handling and the Group’s catering op-erations as well as real-estate management and facility serv-ices for Finnair’s operational premises. In 2008 the following companies belonged to the Aviation Services business seg-ment: Finnair Catering Oy, Finncatering Oy, Finnair Facili-ties Management Oy and Northport Oy.
The Travel Services segment consists of the Group’s domestic and foreign travel agency operations as well as the operations of the reservations systems supplier Amadeus Finland Oy. The most significant companies in 2008 are Finland Travel Bureau Ltd, A/S Estravel and Matkatoimisto Oy Area.
Pricing between segments takes place at the going market price.The assets and liabilities of segments are business items
which the segment uses in its business operations or which on sensible grounds are attributable to the segments. Unattribut-able items include tax and financial items as well as items com-mon to the whole company. Investments consist of increases
Consolidated Statements 35
in tangible fixed assets and intangible assets which are used in more than one financial year.
Although the Group’s four business segments are managed from Finland, they operate in five geographical areas: Finland, Europe, Asia, North America and Others.
The turnover of the geographical segments is presented ac-cording to sales destination, and assets according to the lo-cation of the asset.
Accounting principles requiring management discretion and the main uncertainity factors relating to estimatesThe preparation of financial statements requires the use of estimates and assumptions relating to the future, and the ac-tual outcomes may differ from the estimates and assumptions made. In addition, discretion has to be exercised in applying the accounting principles of the financial statements. Estimates are based on management’s best view on the closing date. Pos-sible changes in estimates and assumptions are entered into the accounts in the financial period during which the estimates and assumptions are adjusted and in all subsequent financial periods. The main items requiring management discretion are as follows: impairment testing and deferred taxes.
Impairment testing The recoverable amounts of cash generating units have been determined in calculations based on value in use. The prepa-ration of these calculations requires the use of estimates. Es-timates are based on budgets and forecasts, which inherently contain some degree of uncertainty. The main uncertainty factors in calculations are the USD/EUR exchange rate, unit revenue and estimated sales volumes. Further information on impairment testing is presented in Note 16.
Deferred taxesUtilising deferred taxes, arising particularly from losses, re-quires a management assessment of the future trend of busi-ness operations. Further information on deferred taxes is pre-sented in Note 20.
Application of new and amended IFRS standards and IFRIC interpretationsThe IASB has published the following standards and inter-pretations whose application will be mandatory in 2009 or later. The group has not early adopted these standards, but will adopt them in later periods.
ThE fOLLOwING STANDArDS AND INTErPrETATIONS wILL BE ADOPTED By ThE GrOuP IN 2009:
IFRIC 13, ‘Customer Loyalty Programmes’. The interpretation •clarifies that where goods or services are sold together with a customer loyalty incentive, the arrangement is a multiple-element arrangement and the consideration receivable from the customer is allocated between the components of the
arrangement using fair values. The group operates loyalty programmes as defined by the interpretation in the scheduled traffic segment. The adoption of the interpretation will result in reclassification of about 30 million euros to deferred credits on 1 January 2009 when it will change the turnover, deferred taxes and retained earnings of the previous year.
IAS 1 (Revised), ‘Presentation of Financial Statements’. The •revised standard is aimed at improving users’ ability to analyse and compare the information given in financial statements by separating changes in equity of an entity arising from transactions with owners from other changes in equity. Non-owner changed in equity will be presented in the statement of comprehensive income. It is likely that the group will in the future present both the income statement and statement of comprehensive income.
Amendment to IAS 23, ‘Borrowing Costs’. The amended •standard requires an entity to capitalise borrowing costs directly attributable to a qualifying asset as part of the cost of that asset. The option of immediately expensing those borrowing costs will be removed. The group will commence capitalisa-tion of borrowing cost related to such undertakings as well as projects to be accounted for under the stage of completion method embarked in 2009. Such Borrowing Costs are expected to be most in the Scheduled Traffic segment.
Amendments to IAS 32, ‘Financial Instruments: Presentation’ •and IAS 1, ‘Presentation of Financial Statements’ – Puttable Financial Instruments and Obligations Arising on Liquidation. The amendments require some puttable financial instruments and some financial instruments that impose on the entity an obligation to deliver to another party a pro rata share of the net assets of the entity only on liquidation to be classified as equity. The amendment is not expected to have an impact on the group’s financial statements.
Amendment to IFRS 2, ‘Share-based payment’, clarifies that •only service conditions and performance conditions are vesting conditions. All other features need to be included in the grant date fair value and do not impact the number of awards expected to vest or the valuation subsequent to grant date. The amend-ment also specifies that all cancellations, whether by the entity or by other parties, should receive the same accounting treat-ment. The amendment is not expected to have an impact on the group’s financial statements.
IFRS 8, ‘Operating Segments’. The new standard replaces IAS •14. The new standard requires a ‘management approach’, under which segment information is presented on the same basis as that used for internal reporting purposes. The segments reported by the group will also in the future be the same as the business segments under IAS 14, but the manner in which the segments are reported, will change slightly to be consistent with the internal reporting.
36 Financial Report
IFRIC 11, ‘IFRS 2 – Group and treasury share transactions’. •The interpretation provides guidance on whether share-based transactions involving treasury shares or involving group enti-ties should be accounted for as equity settled or cash-settled share-based payment transactions in the stand-alone accounts of the parent and group companies. The interpretation will not have a material impact on the group’s financial statements.
IFRIC 14, ‘IAS 19 – The Limit on a Defined Benefit Asset, •Minimum Funding Requirements and their Interaction’. The interpretation is applied to post-employment defined benefit plans and other long-term defined benefit plans under IAS 19, if the plan includes minimum funding requirements. The interpretation also clarifies the criteria for recognition of an asset on future refunds or reductions in future contributions. The management assesses that the interpretation will have an effect on the accounting for some of the defined benefit plans of the group, but the impact on the on the group’s financial statements will most likely not be material.
IFRIC 15, ‘Agreements for the Construction of Real Estate’. The •interpretation clarifies whether an agreement for the construc-tion of real estate is within the scope of IAS 11, ‘Construction Contracts’, or IAS 18, ‘Revenue’, and when revenue from such construction projects can be recognised on a percentage of completion basis. This interpretation does not have an impact on the group’s financial statements.*
IFRIC 16, ’Hedges of a Net Investment in a Foreign Opera-•tion’. IFRIC 16 clarifies the accounting treatment in respect of a hedge of a net investment in a foreign operation. This includes the fact that net investment hedging relates to differ-ences in functional currency not presentation currency. In addition hedging instruments may be held anywhere in the group. The requirements of IAS 21, ‘The effects of changes in foreign exchange rates’, do apply to the hedged item. Management assesses that the interpretation will increase the group’s possi-bilities to apply hedge accounting, but the impact on the on the group’s financial statements will most likely not be material.*
IASB PuBLIShED ChANGES TO 34 STANDArDS IN MAy 2008 AS PArT Of ThE ANNuAL IMPrOVEMENTS TO IfrSS PrOjECT. ThE fOLLOwING PrESENTATION INCLuDES ThOSE ChANGES, ThAT ThE GrOuP wILL ADOPT IN 2009 AND whErE ThE MANAGEMENT ASSESSES ThAT ThE ChANGE MAy hAVE AN IMPACT ON ThE GrOuP’S fINANCIAL STATEMENTS:
IAS 1 (Amendment), ‘Presentation of financial statements’. •The amendment clarifies that some rather than all financial assets classified as held for trading in accordance with IAS 39 are current assets. Management assesses that the amend-ment will not have a material impact on the financial state-ments of the group.
IAS 16 (Amendment), ‘Property, plant and equipment’ (and •consequential amendment to IAS 7, ‘Statement of cash flows’). Entities whose ordinary activities comprise renting and subse-quently selling assets present proceeds from the sale of those assets as revenue and should transfer the carrying amount of the asset to inventories when the asset becomes held for sale. A consequential amendment to IAS 7 states that cash flows arising from purchase, rental and sale of those assets are clas-sified as cash flows from operating activities. Management is assessing the impact of this amendment on the financial statements of the group.
IAS 19 (Amendment), ‘Employee benefits’. The amendment •clarifies among others things that a plan amendment that results in a change in the extent to which benefit promises are affected by future salary increases is a curtailment, while an amendment that changes benefits attributable to past service gives rise to a negative past service cost if it results in a reduction in the present value of the defined benefit obligation. Manage-ment assesses that the amendment will not have a material impact on the financial statements of the group.
IAS 20 (Amendment), ‘Accounting for government grants and •disclosure of government assistance’. The benefit of a below market rate government loan is measured as the difference between the carrying amount in accordance with IAS 39 and the proceeds received with the benefit accounted for in accordance with IAS 20. Management assesses that the amendment will not have a mate-rial impact on the financial statements of the group.
IAS 23 (Amendment), ‘Borrowing costs’. The definition of •borrowing costs has been amended so that interest expense is calculated using the effective interest method defined in IAS 39. Management assesses that the amendment will not have a material impact on the financial statements of the group.
IAS 27 (Amendment), ‘Consolidated and separate finan-•cial statements’. Where an investment in a subsidiary that is accounted for under IAS 39, ‘Financial instruments: recog-nition and measurement’, is classified as held for sale under IFRS 5, ‘Non-current assets held-for-sale and discontinued operations’, IAS 39 would continue to be applied. Manage-ment assesses that the amendment will not have a material impact on the financial statements of the group.
IAS 28 (Amendment), ‘Investments in associates’ (and conse-•quential amendments to IAS 32, ‘Financial Instruments: Pres-entation’ and IFRS 7, ‘Financial instruments: Disclosures’). Where an investment in associate is accounted for in accord-ance with IAS 39, only certain rather than all disclosure require-ments in IAS 28 need to be made in addition to disclosures required by IAS 32 and IFRS 7. The group will not reduce the amount of information presented in the notes to the financial statements of the group in the way allowed by the amendment, but will continue the current presentation.
Consolidated Statements 37
IAS 28 (Amendment), ‘Investments in associates’ (and conse-•quential amendments to IAS 32, ‘Financial Instruments: Pres-entation’, and IFRS 7, ‘Financial instruments: Disclosures’). An investment in an associate is treated as a single asset for the purposes of impairment testing. Any impairment loss is not allocated to specific assets included within the investment, for example, goodwill. Reversals of impairment are recorded as an adjustment to the investment balance to the extent that the recoverable amount of the associate increases. Management assesses that the amendment will not have a material impact on the financial statements of the group.
IAS 31 (Amendment), ‘Interests in joint ventures’ (and conse-•quential amendments to IAS 32 and IFRS 7). Where an invest-ment in joint venture is accounted for in accordance with IAS 39, only certain rather than all disclosure requirements in IAS 31 need to be made in addition to disclosures required by IAS 32 and IFRS 7. The group will not reduce the amount of information presented in the notes to the financial statements of the group in the way allowed by the amendment, but will continue the current presentation.
IAS 36 (Amendment), ‘Impairment of assets’. Where fair value •less costs to sell is calculated on the basis of discounted cash flows, disclosures equivalent to those for value-in-use calcula-tion should be made. The change to the standard will increase the amount of information presented on impairment testing in the notes to the financial statements of the group.
IAS 38 (Amendment), ‘Intangible assets’. A prepayment may •only be recognised in the event that payment has been made in advance of obtaining right of access to goods or receipt of services. This means that an expense will be recognised for mail order catalogues when the group has access to the catalogues and not when the catalogues are distributed to customers. Management assesses that the amendment will not have a material impact on the financial statements of the group.
IAS 38 (Amendment), ‘Intangible assets’. The amendment •deletes the wording that states that there is ‘rarely, if ever’ support for use of a method that results in a lower rate of amor-tisation than the straight-line method. Management assesses that the amendment will not have a material impact on the financial statements of the group.
IAS 39 (Amendment), ‘Financial instruments: Recognition and •measurement’. The amendment clarifies among other things the classification of derivative instruments where there is a change in the hedge accounting, the definition of financial asset or financial liability at fair value through profit or loss and requires use of a revised effective interest rate to remeasure the carrying amount of a debt instrument on cessation of fair value hedge accounting. Management assesses that the amendment will not have a material impact on the financial statements of the group.
IAS 40 (Amendment), ‘Investment property’ (and consequential •amendments to IAS 16). Property that is under construction or development for future use as investment property is within the scope of IAS 40. Where the fair value model is applied, such property is, therefore, measured at fair value. However, where fair value of investment property under construction is not reliably measurable, the property is measured at cost until the earlier of the date construction is completed and the date at which fair value becomes reliably measurable. The amendment will increase the number properties classified as investment properties in the group financial statements.
ThE fOLLOwING NEw STANDArDS AND INTErPrETATIONS EffECTIVE IN 2009 ArE NOT rELEVANT TO ThE fINANCIAL STATEMENTS Of ThE GrOuP:
IFRS 1 (Amendment) ‘First time adoption of IFRS’, and IAS •27 ‘Consolidated and separate financial statements’). The amended standard allows first-time adopters to use a deemed cost of either fair value or the carrying amount under previous accounting practice to measure the initial cost of investments in subsidiaries, jointly controlled entities and associates in the separate financial statements. The amendment also removes the definition of the cost method from IAS 27 and replaces it with a requirement to present dividends as income in the separate financial statements of the investor. The amendment does not have an impact on the group’s financial statements, and the group companies are not applying IFRS in their stand alone financial statements.
ThE fOLLOwING STANDArDS AND INTErPrETATIONS PuBLIShED By ThE IASB wILL BE ADOPTED By ThE GrOuP IN 2010:
IFRS 3 (Revised), ‘Business combinations’. The revised standard •continues to apply the acquisition method to business combina-tions, with some significant changes. For example, all payments to purchase a business are to be recorded at fair value at the acquisition date, with some contingent payments subsequently remeasured at fair value through income. Goodwill may be calculated based on the parent’s share of net assets or it may include goodwill related to the minority interest. All transaction costs will be expensed. Management is assessing the impact of this revision on the financial statements of the group.*
IAS 27 (Revised), ‘Consolidated and separate financial state-•ments’. The revised standard requires the effects of all trans-actions with non-controlling interests to be recorded in equity if there is no change in control. They will no longer result in goodwill or gains and losses. The standard also specifies the accounting when control is lost. Any remaining interest in the entity is remeasured to fair value and a gain or loss is recognised in profit or loss. Management is assessing the impact of this revision on the financial statements of the group.
38 Financial Report
IAS 39 (Amendment), ‘Financial instruments: Recognition •and measurement – Eligible Hedged Items’. The amendment prohibits designating inflation as a hedgeable component of a fixed rate debt. It also prohibits including time value in the one-sided hedged risk when designating options as hedges. This amendment does not have an impact on the group’s finan-cial statements. *
IFRS 5 (Amendment), ‘Non-current assets held-for-sale and •discontinued operations’ (and consequential amendment to IFRS 1, ‘First-time adoption’). The amendment is part of the IASB’s annual improvements project published in May 2008. The amendment clarifies that all of a subsidiary’s assets and liabilities are classified as held for sale if a partial disposal sale plan results in loss of control. Relevant disclosure should be made for this subsidiary if the definition of a discontinued operation is met. A consequential amendment to IFRS 1 states that these amendments are applied prospectively from the date of transition to IFRSs. Management is assessing the impact of this revision on the financial statements of the group. *
IFRIC 17, ‘Distributions of non-cash assets to owners’. The •interpretation clarifies how an entity should measure distri-butions of assets other than cash made as a dividend to its owners. Management is assessing the impact of this interpre-tation on the financial statements of the group. *
IFRIC 18, Transfers of Assets from Customers. The interpre-•tation clarifies the requirements of IFRS standards for agree-ments in which an entity receives from a customer an item of property, plant and equipment or cash to be invested in such an item that the entity must then use either to connect the customer to a network or to provide the customer with ongoing access to a supply of goods or services. Management is assessing the impact of this interpretation on the financial statements of the group. *
* The standard/interpretation is still subject to endorsement by the European Union.
A copy of the consolidated financial statements can be obtained at the internet address www. finnair.com/group or from the head office of the Group’s parent company at the address Tietotie 11 A, Vantaa, Finland. The full financial statements containing the financial statements of both the Group and the parent company can be obtained from the head office of the Group’s parent com-pany at the address Tietotie 11 A, Vantaa, Finland.
These financial statements do not contain all of the parent company’s financial statement information under the Finnish Accounting Act.
ThE fOLLOwING NEw STANDArDS AND INTErPrETATIONS EffECTIVE IN 2010 ArE NOT rELEVANT TO ThE fINANCIAL STATEMENTS Of ThE GrOuP:
IFRIC 12, ‘Service Concession Arrangements’. The interpre-•tation applies to contractual arrangements whereby a private sector operator participates in the development, financing, operation and maintenance of infrastructure for public sector services.*
ThE fOLLOwING NEw STANDArDS, ChANGES TO STANDArDS AND ThE APPLICATION Of INTErPrETATIONS whICh ArE PErCEIVED TO BE ESSENTIAL fOr ThE GrOuP hAVE BEEN INTrODuCED frOM ThE BEGINNING Of 2008:
IFRIC 11. IFRS 2 – Group and Treasury Share Transactions. •The interpretation clarifies the treatment of transactions relating to an entity’s own equity instruments or to Group companies in the parent company and in Group companies’ financial statements by providing guidance on their classifi-cation into share-based transactions payable as shareholders’ equity or payable as cash. The interpretation has no impact on the consolidated financial statements.
IAS 39 (Amendment) and IFRS 7 (Amendment). Reclassi-•fication of Financial Assets *. The amendment facilitates the reclassification of financial assets from financial assets held for trading purposes or financial assets available-for-sale under certain conditions and only in special situations. In such cases additional disclosures are required in the finan-cial statements. The amendment has been effective as of 1 July 2008. The interpretation has no impact on the consoli-dated financial statements.
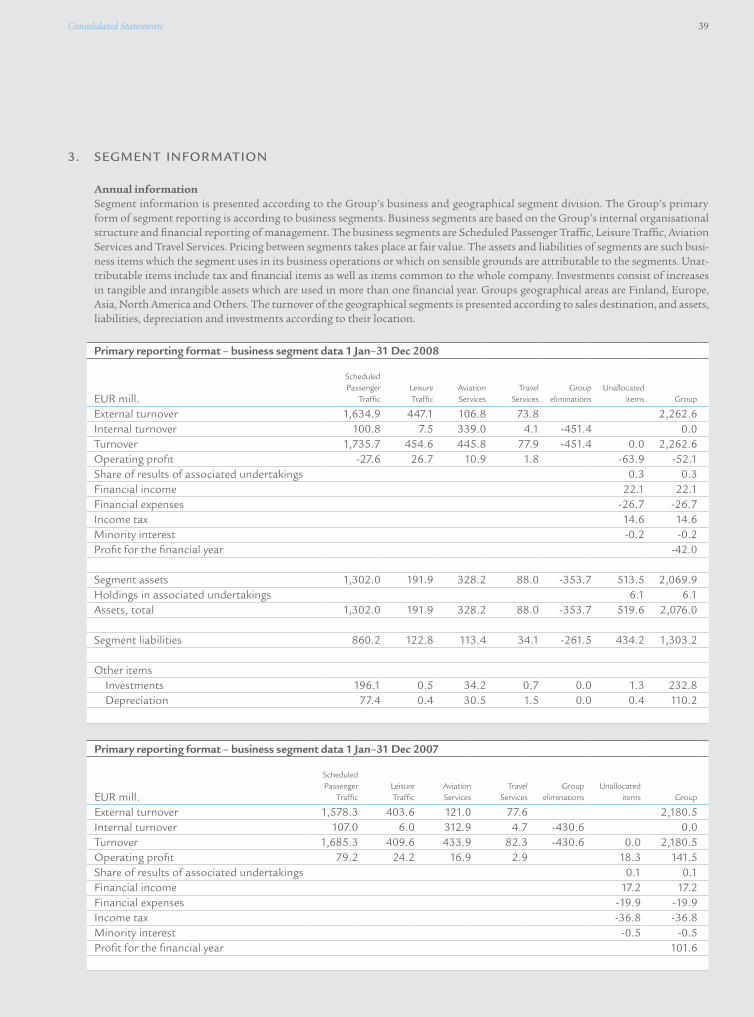
Consolidated Statements 39
primary reporting format – business segment data 1 Jan–31 Dec 2008
EUR mill.
Scheduled Passenger
TrafficLeisure Traffic
Aviation Services
Travel Services
Group eliminations
Unallocated items Group
External turnover 1,634.9 447.1 106.8 73.8 2,262.6Internal turnover 100.8 7.5 339.0 4.1 -451.4 0.0Turnover 1,735.7 454.6 445.8 77.9 -451.4 0.0 2,262.6Operating profit -27.6 26.7 10.9 1.8 -63.9 -52.1Share of results of associated undertakings 0.3 0.3Financial income 22.1 22.1Financial expenses -26.7 -26.7Income tax 14.6 14.6Minority interest -0.2 -0.2Profit for the financial year -42.0
Segment assets 1,302.0 191.9 328.2 88.0 -353.7 513.5 2,069.9Holdings in associated undertakings 6.1 6.1Assets, total 1,302.0 191.9 328.2 88.0 -353.7 519.6 2,076.0
Segment liabilities 860.2 122.8 113.4 34.1 -261.5 434.2 1,303.2
Other itemsInvestments 196.1 0.5 34.2 0.7 0.0 1.3 232.8Depreciation 77.4 0.4 30.5 1.5 0.0 0.4 110.2
primary reporting format – business segment data 1 Jan–31 Dec 2007
EUR mill.
Scheduled Passenger
TrafficLeisure Traffic
Aviation Services
Travel Services
Group eliminations
Unallocated items Group
External turnover 1,578.3 403.6 121.0 77.6 2,180.5Internal turnover 107.0 6.0 312.9 4.7 -430.6 0.0Turnover 1,685.3 409.6 433.9 82.3 -430.6 0.0 2,180.5Operating profit 79.2 24.2 16.9 2.9 18.3 141.5Share of results of associated undertakings 0.1 0.1Financial income 17.2 17.2Financial expenses -19.9 -19.9Income tax -36.8 -36.8Minority interest -0.5 -0.5Profit for the financial year 101.6
Annual informationSegment information is presented according to the Group’s business and geographical segment division. The Group’s primary form of segment reporting is according to business segments. Business segments are based on the Group’s internal organisational structure and financial reporting of management. The business segments are Scheduled Passenger Traffic, Leisure Traffic, Aviation Services and Travel Services. Pricing between segments takes place at fair value. The assets and liabilities of segments are such busi-ness items which the segment uses in its business operations or which on sensible grounds are attributable to the segments. Unat-tributable items include tax and financial items as well as items common to the whole company. Investments consist of increases in tangible and intangible assets which are used in more than one financial year. Groups geographical areas are Finland, Europe, Asia, North America and Others. The turnover of the geographical segments is presented according to sales destination, and assets, liabilities, depreciation and investments according to their location.
3. SEGMENT INfOrMATION
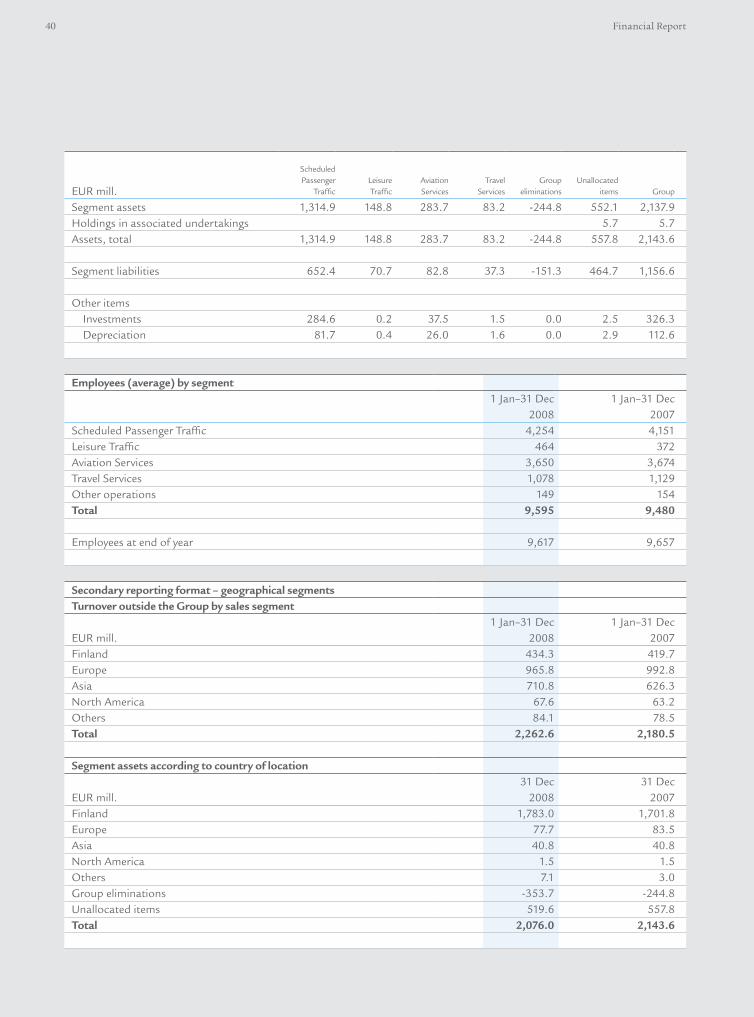
40 Financial Report
EUR mill.
Scheduled Passenger
TrafficLeisure Traffic
Aviation Services
Travel Services
Group eliminations
Unallocated items Group
Segment assets 1,314.9 148.8 283.7 83.2 -244.8 552.1 2,137.9Holdings in associated undertakings 5.7 5.7Assets, total 1,314.9 148.8 283.7 83.2 -244.8 557.8 2,143.6
Segment liabilities 652.4 70.7 82.8 37.3 -151.3 464.7 1,156.6
Other itemsInvestments 284.6 0.2 37.5 1.5 0.0 2.5 326.3Depreciation 81.7 0.4 26.0 1.6 0.0 2.9 112.6
employees (average) by segment1 Jan–31 Dec
20081 Jan–31 Dec
2007Scheduled Passenger Traffic 4,254 4,151Leisure Traffic 464 372Aviation Services 3,650 3,674Travel Services 1,078 1,129Other operations 149 154Total 9,595 9,480 Employees at end of year 9,617 9,657 secondary reporting format – geographical segmentsTurnover outside the group by sales segment
EUR mill.1 Jan–31 Dec
20081 Jan–31 Dec
2007Finland 434.3 419.7Europe 965.8 992.8Asia 710.8 626.3North America 67.6 63.2Others 84.1 78.5Total 2,262.6 2,180.5
segment assets according to country of location
EUR mill.31 Dec
200831 Dec
2007Finland 1,783.0 1,701.8Europe 77.7 83.5Asia 40.8 40.8North America 1.5 1.5Others 7.1 3.0Group eliminations -353.7 -244.8Unallocated items 519.6 557.8Total 2,076.0 2,143.6
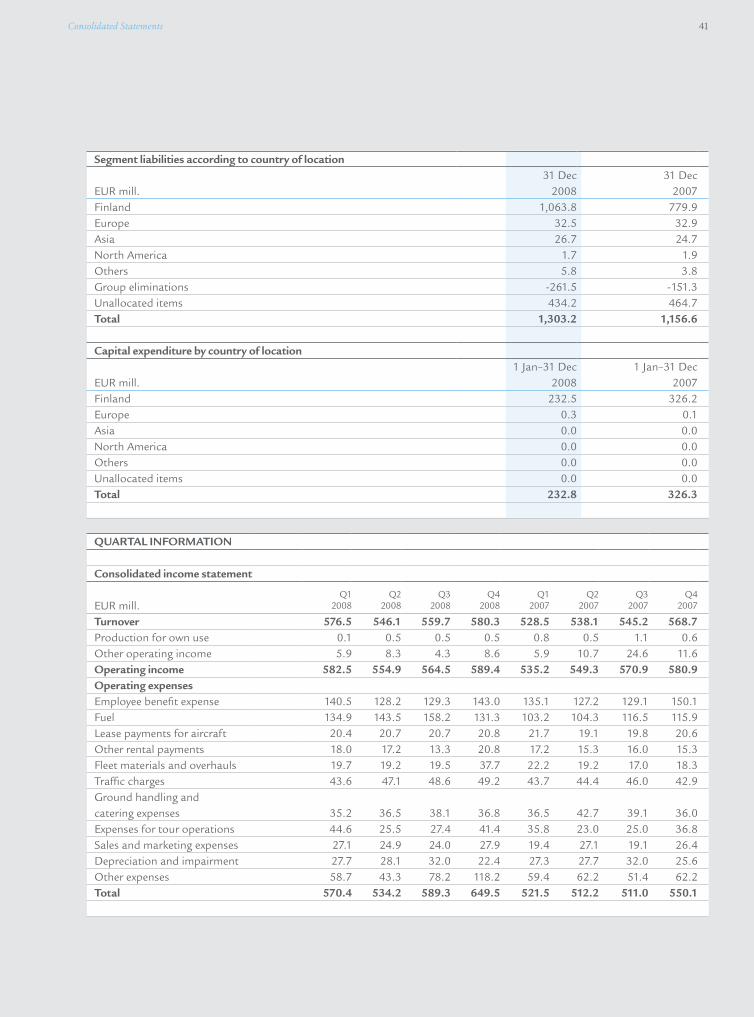
Consolidated Statements 41
segment liabilities according to country of location
EUR mill.31 Dec
200831 Dec
2007Finland 1,063.8 779.9Europe 32.5 32.9Asia 26.7 24.7North America 1.7 1.9Others 5.8 3.8Group eliminations -261.5 -151.3Unallocated items 434.2 464.7Total 1,303.2 1,156.6 capital expenditure by country of location
EUR mill.1 Jan–31 Dec
20081 Jan–31 Dec
2007Finland 232.5 326.2Europe 0.3 0.1Asia 0.0 0.0North America 0.0 0.0Others 0.0 0.0Unallocated items 0.0 0.0Total 232.8 326.3
QuARTAL INFoRmATIoN consolidated income statement
EUR mill.Q1
2008Q2
2008Q3
2008Q4
2008Q1
2007Q2
2007Q3
2007Q4
2007
Turnover 576.5 546.1 559.7 580.3 528.5 538.1 545.2 568.7Production for own use 0.1 0.5 0.5 0.5 0.8 0.5 1.1 0.6Other operating income 5.9 8.3 4.3 8.6 5.9 10.7 24.6 11.6operating income 582.5 554.9 564.5 589.4 535.2 549.3 570.9 580.9operating expensesEmployee benefit expense 140.5 128.2 129.3 143.0 135.1 127.2 129.1 150.1Fuel 134.9 143.5 158.2 131.3 103.2 104.3 116.5 115.9Lease payments for aircraft 20.4 20.7 20.7 20.8 21.7 19.1 19.8 20.6Other rental payments 18.0 17.2 13.3 20.8 17.2 15.3 16.0 15.3Fleet materials and overhauls 19.7 19.2 19.5 37.7 22.2 19.2 17.0 18.3Traffic charges 43.6 47.1 48.6 49.2 43.7 44.4 46.0 42.9Ground handling and catering expenses 35.2 36.5 38.1 36.8 36.5 42.7 39.1 36.0Expenses for tour operations 44.6 25.5 27.4 41.4 35.8 23.0 25.0 36.8Sales and marketing expenses 27.1 24.9 24.0 27.9 19.4 27.1 19.1 26.4Depreciation and impairment 27.7 28.1 32.0 22.4 27.3 27.7 32.0 25.6Other expenses 58.7 43.3 78.2 118.2 59.4 62.2 51.4 62.2Total 570.4 534.2 589.3 649.5 521.5 512.2 511.0 550.1
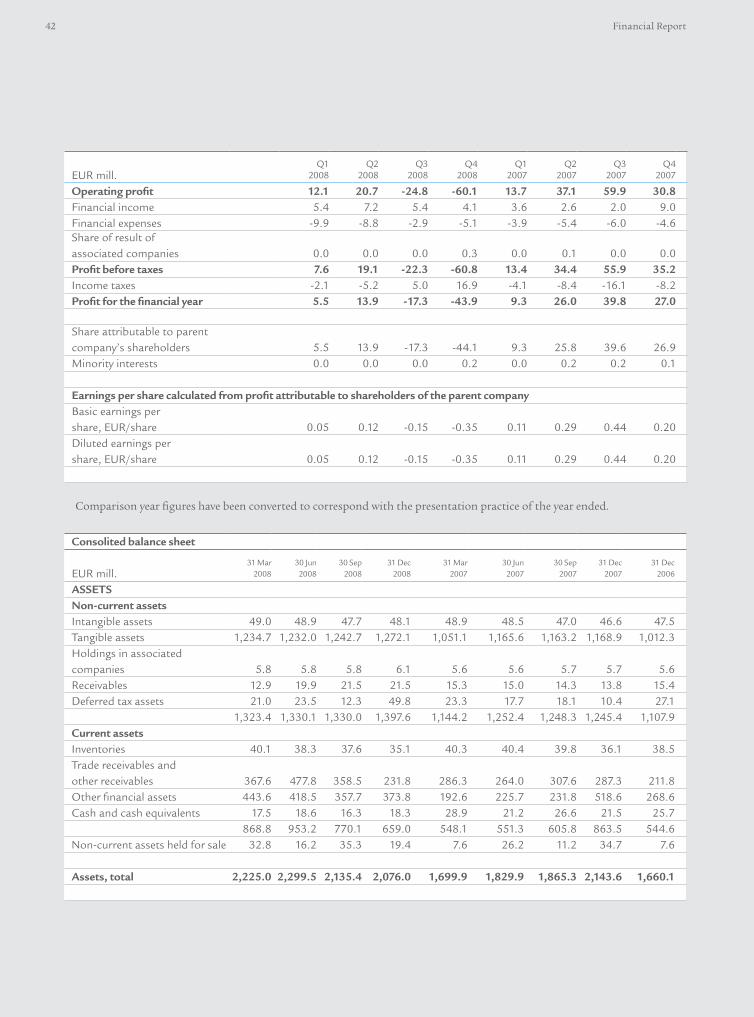
42 Financial Report
EUR mill.Q1
2008Q2
2008Q3
2008Q4
2008Q1
2007Q2
2007Q3
2007Q4
2007
operating profit 12.1 20.7 -24.8 -60.1 13.7 37.1 59.9 30.8Financial income 5.4 7.2 5.4 4.1 3.6 2.6 2.0 9.0Financial expenses -9.9 -8.8 -2.9 -5.1 -3.9 -5.4 -6.0 -4.6Share of result of associated companies 0.0 0.0 0.0 0.3 0.0 0.1 0.0 0.0profit before taxes 7.6 19.1 -22.3 -60.8 13.4 34.4 55.9 35.2Income taxes -2.1 -5.2 5.0 16.9 -4.1 -8.4 -16.1 -8.2profit for the financial year 5.5 13.9 -17.3 -43.9 9.3 26.0 39.8 27.0 Share attributable to parent company’s shareholders 5.5 13.9 -17.3 -44.1 9.3 25.8 39.6 26.9Minority interests 0.0 0.0 0.0 0.2 0.0 0.2 0.2 0.1 earnings per share calculated from profit attributable to shareholders of the parent companyBasic earnings per share, EUR/share 0.05 0.12 -0.15 -0.35 0.11 0.29 0.44 0.20Diluted earnings per share, EUR/share 0.05 0.12 -0.15 -0.35 0.11 0.29 0.44 0.20
consolited balance sheet EUR mill.
31 Mar 2008
30 Jun 2008
30 Sep 2008
31 Dec 2008
31 Mar 2007
30 Jun 2007
30 Sep 2007
31 Dec 2007
31 Dec 2006
AsseTsNon-current assetsIntangible assets 49.0 48.9 47.7 48.1 48.9 48.5 47.0 46.6 47.5Tangible assets 1,234.7 1,232.0 1,242.7 1,272.1 1,051.1 1,165.6 1,163.2 1,168.9 1,012.3Holdings in associated companies 5.8 5.8 5.8 6.1 5.6 5.6 5.7 5.7 5.6Receivables 12.9 19.9 21.5 21.5 15.3 15.0 14.3 13.8 15.4Deferred tax assets 21.0 23.5 12.3 49.8 23.3 17.7 18.1 10.4 27.1
1,323.4 1,330.1 1,330.0 1,397.6 1,144.2 1,252.4 1,248.3 1,245.4 1,107.9current assetsInventories 40.1 38.3 37.6 35.1 40.3 40.4 39.8 36.1 38.5Trade receivables and other receivables 367.6 477.8 358.5 231.8 286.3 264.0 307.6 287.3 211.8Other financial assets 443.6 418.5 357.7 373.8 192.6 225.7 231.8 518.6 268.6Cash and cash equivalents 17.5 18.6 16.3 18.3 28.9 21.2 26.6 21.5 25.7
868.8 953.2 770.1 659.0 548.1 551.3 605.8 863.5 544.6Non-current assets held for sale 32.8 16.2 35.3 19.4 7.6 26.2 11.2 34.7 7.6
Assets, total 2,225.0 2,299.5 2,135.4 2,076.0 1,699.9 1,829.9 1,865.3 2,143.6 1,660.1
Comparison year figures have been converted to correspond with the presentation practice of the year ended.

Consolidated Statements 43
consolited balance sheet EUR mill.
31 Mar 2008
30 Jun 2008
30 Sep 2008
31 Dec 2008
31 Mar 2007
30 Jun 2007
30 Sep 2007
31 Dec 2007
31 Dec 2006
sHAReHoLDeRs’ eQuITy AND LIAbILITIesEquity attributable to shareholders of parent companyShare capital 75.4 75.4 75.4 75.4 75.4 75.4 75.4 75.4 75.4Other equity 890.3 978.0 887.6 696.3 538.4 569.0 605.1 909.9 524.5 965.7 1,053.4 963.0 771.7 613.8 644.4 680.5 985.3 599.9Minority interest 1.1 0.8 0.8 1.1 1.2 1.4 1.6 1.7 1.6shareholders’ equity, total 966.8 1,054.2 963.8 772.8 615.0 645.8 682.1 987.0 601.5 Non-current liabilitiesDeferred tax liabilities 150.1 176.3 149.1 120.6 116.2 117.5 118.7 144.5 115.7Financial liabilities 258.9 226.9 242.8 261.1 280.0 317.7 313.6 269.6 286.9Pension obligations 14.0 12.2 2.2 6.1 8.4 6.8 11.8 15.8 7.0 423.0 415.4 394.1 387.8 404.6 442.0 444.1 429.9 409.6current liabilities
Current income tax liability 7.5 13.3 0.0 1.5 4.6 12.0 23.1 8.2 3.0Provisions 53.8 54.3 53.3 61.5 57.1 59.1 56.5 53.6 55.7Financial liabilities 55.2 53.2 51.9 48.5 50.0 78.3 70.3 54.5 56.6Trade payables and other liabilities 718.7 709.1 672.3 803.9 568.6 566.0 579.2 610.4 533.7Liabilities related to long-term asset items held for sale 0.0 0.0 0.0 0.0 0.0 26.7 10.0 0.0 0.0 835.2 829.9 777.5 915.4 680.3 742.1 739.1 726.7 649.0Liabilities, total 1,258.2 1,245.3 1,171.6 1,303.2 1,084.9 1,184.1 1,183.2 1,156.6 1,058.6 shareholders’ equity and liabilities, total 2,225.0 2,299.5 2,135.4 2,076.0 1,699.9 1,829.9 1,865.3 2,143.6 1,660.1
segment informationTurnover by quarter
EUR mill.Q1
2008Q2
2008Q3
2008Q4
2008Q1
2007Q2
2007Q3
2007Q4
2007
Scheduled Passenger Traffic 423.2 438.9 447.4 426.2 391.2 434.0 432.6 427.5Leisure Traffic 139.3 84.8 93.7 136.8 116.6 83.1 90.1 119.8Aviation Services 109.9 111.5 108.6 115.8 110.8 99.8 109.9 113.4Travel Services 21.1 20.6 18.3 17.9 20.7 22.4 19.0 20.2Group eliminations -117.0 -109.7 -108.3 -116.4 -110.8 -101.2 -106.4 -112.2Total 576.5 546.1 559.7 580.3 528.5 538.1 545.2 568.7

44 Financial Report
operating profit excluding the disposal of the capital assets fair value changes of derivatives and arragement expenses by quater
EUR mill.Q1
2008Q2
2008Q3
2008Q4
2008Q1
2007Q2
2007Q3
2007Q4
2007
Scheduled Passenger Traffic -0.4 1.9 -4.0 -27.6 -0.3 27.7 28.8 20.0Leisure Traffic 11.1 -2.5 6.0 12.1 5.6 1.1 7.8 9.7Aviation Services 2.5 4.4 1.9 5.0 3.3 1.3 2.7 3.0Travel Services 0.4 1.4 1.3 -1.0 1.3 1.2 1.3 -0.9Unallocated items -2.5 0.0 -2.4 -1.0 -4.1 -4.1 -1.4 -7.4Total 11.1 5.2 2.8 -12.5 5.8 27.2 39.2 24.4
Values of liabilities and acquired assets at the acquisition date:
EUR mill.Recognised
fair values
Book values before
consolidationTrade and other receivables 0.1 0.1Cash and cash equivalents 0.3 0.3Total 0.4 0.4
Other financial liabilities -0.3 -0.3Net assets 0.1 0.1Minority interest (20%) 0.0Bought net assets 0.1
Acquisition cost 2.9Goodwill (Note 16) 2.9
Acquisition price paid in cash 2.9Cash and cash equivalents of acquired subsidiary -0.3Cash flow effect 2.6
4. ACQuIrED BuSINESSES
The Finnair Group’s Oy Aurinkomatkat - Suntours Ltd Ab signed an agreement on 23 October 2007 to acquire 80% of the share stock of Russian Calypso company. The acquisition price was 2.5 million euros and it was paid in cash. The goodwill of 2.5 million euros that arose is based on the management’s view that through the acquisition Aurinkomatkat will obtain a solid foothold in the growing package tour market in Russia. The transaction is also strengthened by synergy benefits on both sides of the Gulf of Finland. The company’s year 2008 loss, 2.0 million euros, is included in the consolidated income statement for 2008. The company’s turno-ver 2008, 5.3 million euros, is included in full in the Group’s turnover. During the fiscal year 2008 the additional purchase price of 0.4 million euroa has been paid as agreed for A/S Horizon Travel, which was acquired in the previous financial period. The purchase price of 0.4 million euros has been entered as a goodwill.
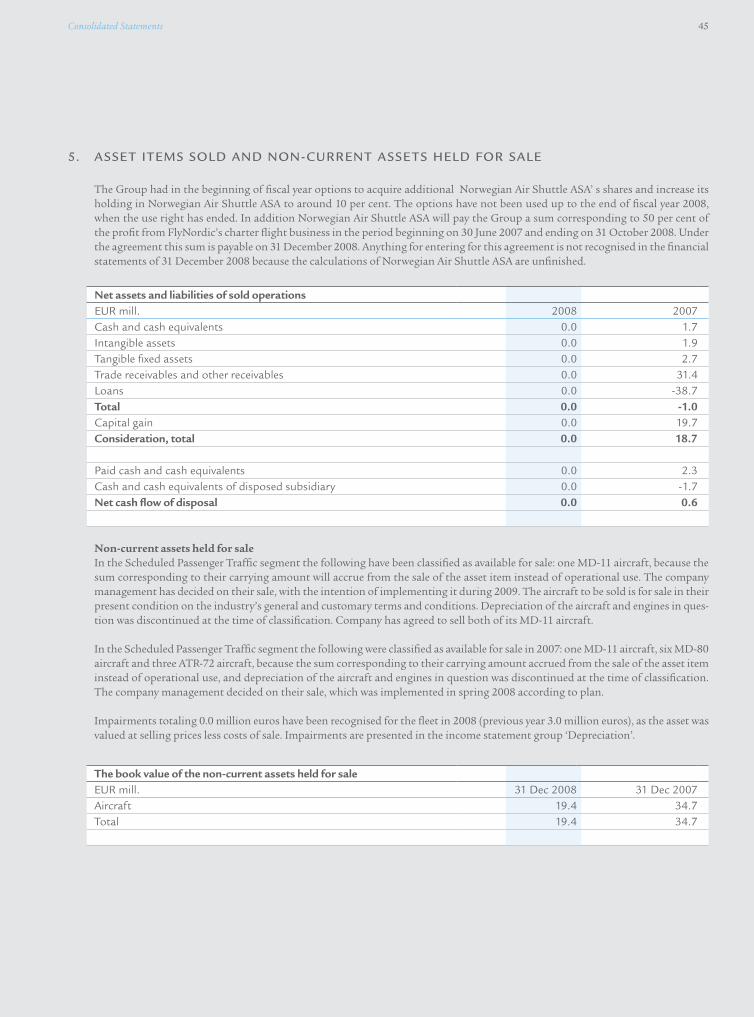
Consolidated Statements 45
Net assets and liabilities of sold operationsEUR mill. 2008 2007Cash and cash equivalents 0.0 1.7Intangible assets 0.0 1.9Tangible fixed assets 0.0 2.7Trade receivables and other receivables 0.0 31.4Loans 0.0 -38.7Total 0.0 -1.0Capital gain 0.0 19.7consideration, total 0.0 18.7
Paid cash and cash equivalents 0.0 2.3Cash and cash equivalents of disposed subsidiary 0.0 -1.7Net cash flow of disposal 0.0 0.6
Non-current assets held for saleIn the Scheduled Passenger Traffic segment the following have been classified as available for sale: one MD-11 aircraft, because the sum corresponding to their carrying amount will accrue from the sale of the asset item instead of operational use. The company management has decided on their sale, with the intention of implementing it during 2009. The aircraft to be sold is for sale in their present condition on the industry’s general and customary terms and conditions. Depreciation of the aircraft and engines in ques-tion was discontinued at the time of classification. Company has agreed to sell both of its MD-11 aircraft.
In the Scheduled Passenger Traffic segment the following were classified as available for sale in 2007: one MD-11 aircraft, six MD-80 aircraft and three ATR-72 aircraft, because the sum corresponding to their carrying amount accrued from the sale of the asset item instead of operational use, and depreciation of the aircraft and engines in question was discontinued at the time of classification. The company management decided on their sale, which was implemented in spring 2008 according to plan.
Impairments totaling 0.0 million euros have been recognised for the fleet in 2008 (previous year 3.0 million euros), as the asset was valued at selling prices less costs of sale. Impairments are presented in the income statement group ‘Depreciation’.
The book value of the non-current assets held for saleEUR mill. 31 Dec 2008 31 Dec 2007Aircraft 19.4 34.7Total 19.4 34.7
The Group had in the beginning of fiscal year options to acquire additional Norwegian Air Shuttle ASA’ s shares and increase its holding in Norwegian Air Shuttle ASA to around 10 per cent. The options have not been used up to the end of fiscal year 2008, when the use right has ended. In addition Norwegian Air Shuttle ASA will pay the Group a sum corresponding to 50 per cent of the profit from FlyNordic’s charter flight business in the period beginning on 30 June 2007 and ending on 31 October 2008. Under the agreement this sum is payable on 31 December 2008. Anything for entering for this agreement is not recognised in the financial statements of 31 December 2008 because the calculations of Norwegian Air Shuttle ASA are unfinished.
5. ASSET ITEMS SOLD AND NON-CurrENT ASSETS hELD fOr SALE

46 Financial Report
EUR mill.1 Jan–31 Dec
2008 1 Jan–31 Dec
2007Component production 0.9 1.2Heavy maintenance 0.7 1.8Total 1.6 3.0
EUR mill.1 Jan–31 Dec
2008 1 Jan–31 Dec
2007Capital gains on sales of tangible fixed assets 6.1 10.7Capital gain from shares 0.1 0.0Sell of subsidiaries 0.0 22.7Rental income 4.0 4.4Others 16.9 15.0Total 27.1 52.8
EUR mill.1 Jan–31 Dec
2008 1 Jan–31 Dec
2007materials and servicesMaterials and supplies for aircraft maintenance 39.7 32.5Ground handling and catering charges 146.6 154.3Fuels for flight operations 567.9 439.9Expenses for tour operations 138.9 120.6Aircraft maintenance and servicing 56.4 44.2Data administration services 49.5 52.3Other items 1) 55.8 53.1Total 1,054.8 896.9
6. PrODuCTION fOr OwN uSE
7. OThEr OPErATING INCOME
8. MATErIAL AND SErVICES
Other operating income includes frequent-flyer income of 7,0 million euros (6.0) and during the financial year, grants amounting to 1.7 million euros (1.6). The rest consists of several items, none of which are individually significant.
Other operating expenses do not include research and development expenses.
1) Consists of several items, none of which are individually significant.
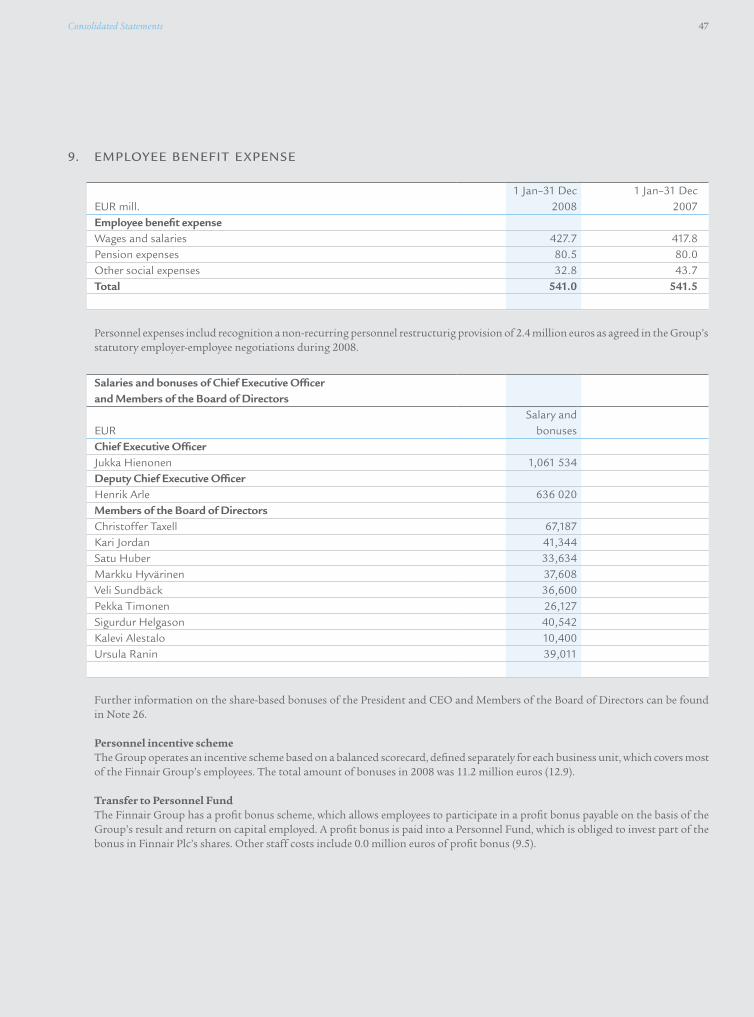
Consolidated Statements 47
EUR mill.1 Jan–31 Dec
2008 1 Jan–31 Dec
2007employee benefit expenseWages and salaries 427.7 417.8Pension expenses 80.5 80.0Other social expenses 32.8 43.7Total 541.0 541.5
salaries and bonuses of chief executive officer and members of the board of Directors EUR
Salary and bonuses
chief executive officerJukka Hienonen 1,061 534Deputy chief executive officerHenrik Arle 636 020members of the board of DirectorsChristoffer Taxell 67,187Kari Jordan 41,344Satu Huber 33,634Markku Hyvärinen 37,608Veli Sundbäck 36,600Pekka Timonen 26,127Sigurdur Helgason 40,542Kalevi Alestalo 10,400Ursula Ranin 39,011
Personnel expenses includ recognition a non-recurring personnel restructurig provision of 2.4 million euros as agreed in the Group’s statutory employer-employee negotiations during 2008.
Further information on the share-based bonuses of the President and CEO and Members of the Board of Directors can be found in Note 26.
Personnel incentive schemeThe Group operates an incentive scheme based on a balanced scorecard, defined separately for each business unit, which covers most of the Finnair Group’s employees. The total amount of bonuses in 2008 was 11.2 million euros (12.9). Transfer to Personnel FundThe Finnair Group has a profit bonus scheme, which allows employees to participate in a profit bonus payable on the basis of the Group’s result and return on capital employed. A profit bonus is paid into a Personnel Fund, which is obliged to invest part of the bonus in Finnair Plc’s shares. Other staff costs include 0.0 million euros of profit bonus (9.5).
9. EMPLOyEE BENEfIT E XPENSE

48 Financial Report
EUR mill.1 Jan–31 Dec
2008 1 Jan–31 Dec
2007social expensesPension expenses – defined contribution schemes 74.7 73.8Pension expenses – defined-benefit schemes, voluntary 5.3 5.7Other defined-benefit expenses 0.5 0.5Other social expenses 32.8 43.7Total 113.3 123.7
EUR mill.1 Jan–31 Dec
2008 1 Jan–31 Dec
2007other operating expensesLease payments for aircraft 82.6 81.2Rental of cargo capacity 8.4 13.1Other rental of flight capacity 29.5 14.3Office and other rents 31.4 36.4Traffic charges 188.5 154.3Sales and marketing expenses 103.9 92.0IT expenses and booking fees 33.0 35.7Other items1) 160.1 116.8Total 637.4 543.8
EUR mill.1 Jan–31 Dec
2008 1 Jan–31 Dec
2007Depreciation of tangible fixed assetsBuildings 5.3 4.9Aircraft 84.1 89.9Other equipment 10.5 8.9
99.9 103.7Depreciation of intangible assetsOther intangible assets 10.3 8.9
10.3 8.9Total 110.2 112.6
Management pension benefitsThe pension schemes of the parent company’s President & CEO and members of the Board of Management as well as those of the managing directors of subsidiaries are individual schemes, and the retirement age under these agreements varies from 60 to 65 years. All of the management pension schemes are defined-contribution schemes.
10. DEPrECIATION AND IMPAIrMENT
11. OThEr OPErATING E XPENSES
1) Consists of several items, none of which are individually significant.
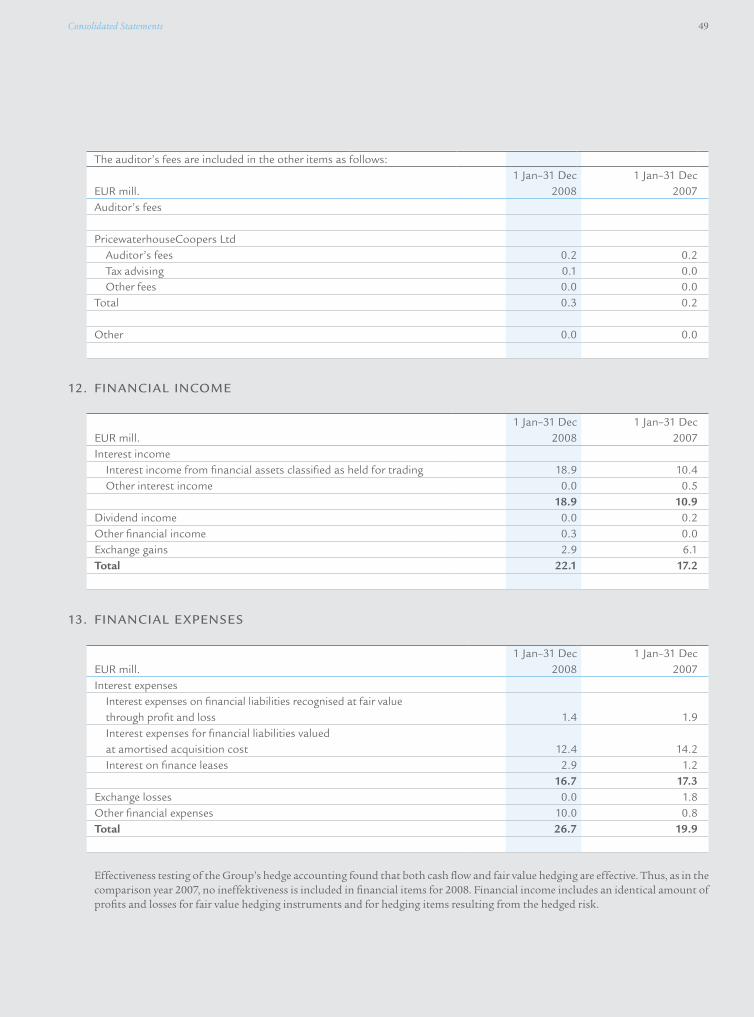
Consolidated Statements 49
EUR mill.1 Jan–31 Dec
2008 1 Jan–31 Dec
2007Interest expenses
Interest expenses on financial liabilities recognised at fair value through profit and loss 1.4 1.9Interest expenses for financial liabilities valued at amortised acquisition cost 12.4 14.2Interest on finance leases 2.9 1.2
16.7 17.3Exchange losses 0.0 1.8Other financial expenses 10.0 0.8Total 26.7 19.9
EUR mill.1 Jan–31 Dec
2008 1 Jan–31 Dec
2007Interest income
Interest income from financial assets classified as held for trading 18.9 10.4Other interest income 0.0 0.5
18.9 10.9Dividend income 0.0 0.2Other financial income 0.3 0.0Exchange gains 2.9 6.1Total 22.1 17.2
12. fINANCIAL INCOME
13. fINANCIAL E XPENSES
Effectiveness testing of the Group’s hedge accounting found that both cash flow and fair value hedging are effective. Thus, as in the comparison year 2007, no ineffektiveness is included in financial items for 2008. Financial income includes an identical amount of profits and losses for fair value hedging instruments and for hedging items resulting from the hedged risk.
The auditor’s fees are included in the other items as follows:
EUR mill.1 Jan–31 Dec
2008 1 Jan–31 Dec
2007Auditor’s fees
PricewaterhouseCoopers LtdAuditor’s fees 0.2 0.2Tax advising 0.1 0.0Other fees 0.0 0.0
Total 0.3 0.2
Other 0.0 0.0
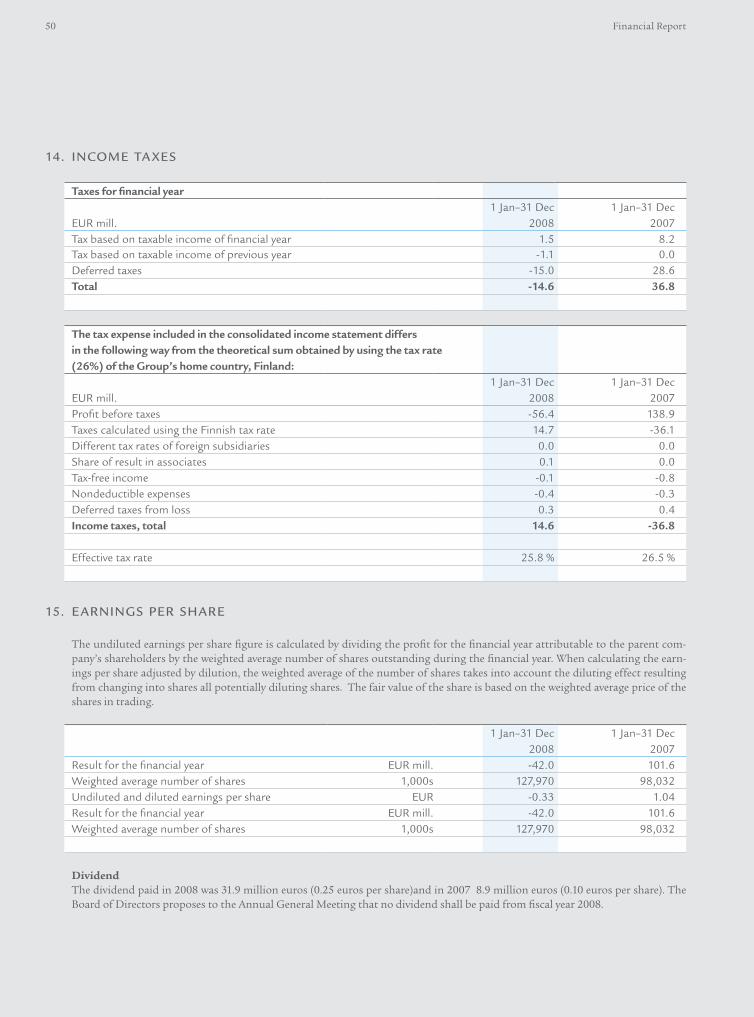
50 Financial Report
Taxes for financial year
EUR mill.1 Jan–31 Dec
2008 1 Jan–31 Dec
2007Tax based on taxable income of financial year 1.5 8.2Tax based on taxable income of previous year -1.1 0.0Deferred taxes -15.0 28.6Total -14.6 36.8
The tax expense included in the consolidated income statement differs in the following way from the theoretical sum obtained by using the tax rate (26%) of the group’s home country, Finland:
EUR mill.1 Jan–31 Dec
2008 1 Jan–31 Dec
2007Profit before taxes -56.4 138.9Taxes calculated using the Finnish tax rate 14.7 -36.1Different tax rates of foreign subsidiaries 0.0 0.0Share of result in associates 0.1 0.0Tax-free income -0.1 -0.8Nondeductible expenses -0.4 -0.3Deferred taxes from loss 0.3 0.4Income taxes, total 14.6 -36.8
Effective tax rate 25.8 % 26.5 %
1 Jan–31 Dec 2008
1 Jan–31 Dec2007
Result for the financial year EUR mill. -42.0 101.6Weighted average number of shares 1,000s 127,970 98,032Undiluted and diluted earnings per share EUR -0.33 1.04Result for the financial year EUR mill. -42.0 101.6Weighted average number of shares 1,000s 127,970 98,032
14. INCOME TA XES
15. EArNINGS PEr ShArE
The undiluted earnings per share figure is calculated by dividing the profit for the financial year attributable to the parent com-pany’s shareholders by the weighted average number of shares outstanding during the financial year. When calculating the earn-ings per share adjusted by dilution, the weighted average of the number of shares takes into account the diluting effect resulting from changing into shares all potentially diluting shares. The fair value of the share is based on the weighted average price of the shares in trading.
DividendThe dividend paid in 2008 was 31.9 million euros (0.25 euros per share)and in 2007 8.9 million euros (0.10 euros per share). The Board of Directors proposes to the Annual General Meeting that no dividend shall be paid from fiscal year 2008.
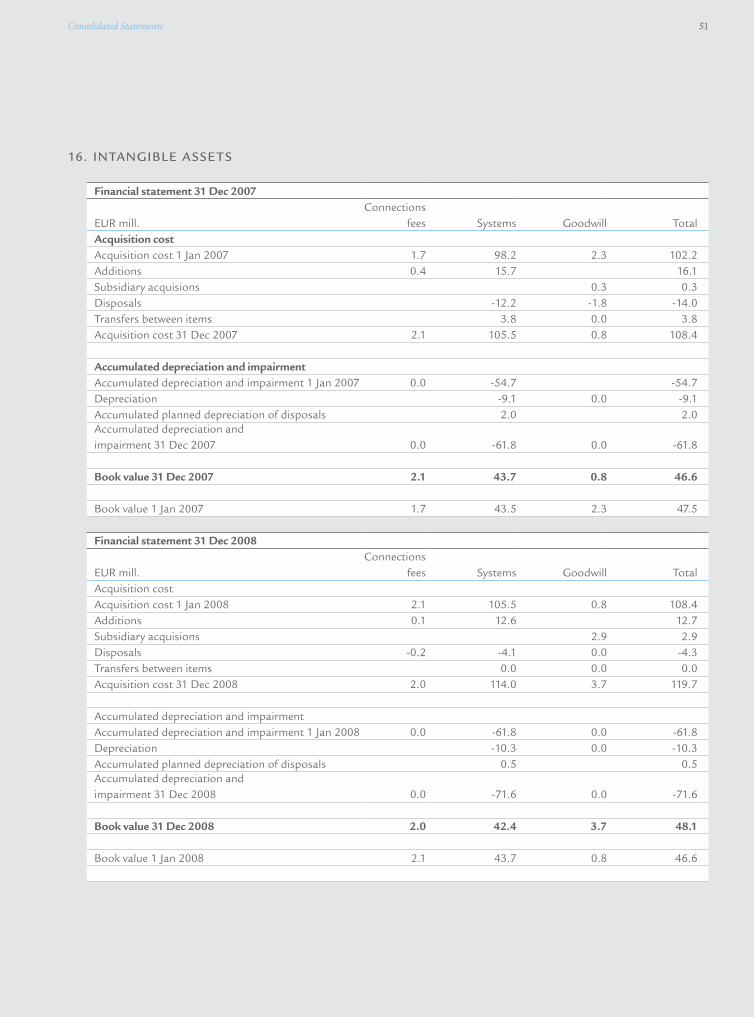
Consolidated Statements 51
Financial statement 31 Dec 2007
EUR mill.Connections
fees Systems Goodwill TotalAcquisition costAcquisition cost 1 Jan 2007 1.7 98.2 2.3 102.2Additions 0.4 15.7 16.1Subsidiary acquisions 0.3 0.3Disposals -12.2 -1.8 -14.0Transfers between items 3.8 0.0 3.8Acquisition cost 31 Dec 2007 2.1 105.5 0.8 108.4
Accumulated depreciation and impairmentAccumulated depreciation and impairment 1 Jan 2007 0.0 -54.7 -54.7Depreciation -9.1 0.0 -9.1Accumulated planned depreciation of disposals 2.0 2.0Accumulated depreciation and impairment 31 Dec 2007 0.0 -61.8 0.0 -61.8
book value 31 Dec 2007 2.1 43.7 0.8 46.6
Book value 1 Jan 2007 1.7 43.5 2.3 47.5
Financial statement 31 Dec 2008
EUR mill.Connections
fees Systems Goodwill TotalAcquisition costAcquisition cost 1 Jan 2008 2.1 105.5 0.8 108.4Additions 0.1 12.6 12.7Subsidiary acquisions 2.9 2.9Disposals -0.2 -4.1 0.0 -4.3Transfers between items 0.0 0.0 0.0Acquisition cost 31 Dec 2008 2.0 114.0 3.7 119.7
Accumulated depreciation and impairmentAccumulated depreciation and impairment 1 Jan 2008 0.0 -61.8 0.0 -61.8Depreciation -10.3 0.0 -10.3Accumulated planned depreciation of disposals 0.5 0.5Accumulated depreciation and impairment 31 Dec 2008 0.0 -71.6 0.0 -71.6
book value 31 Dec 2008 2.0 42.4 3.7 48.1
Book value 1 Jan 2008 2.1 43.7 0.8 46.6
16. INTANGIBLE ASSETS
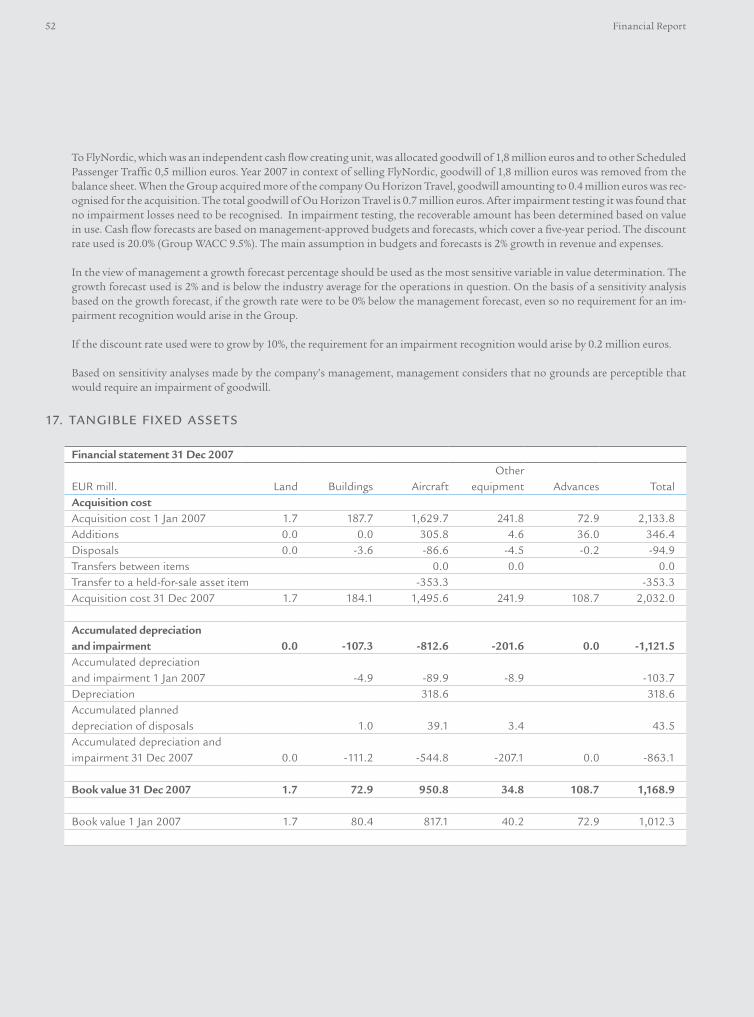
52 Financial Report
To FlyNordic, which was an independent cash flow creating unit, was allocated goodwill of 1,8 million euros and to other Scheduled Passenger Traffic 0,5 million euros. Year 2007 in context of selling FlyNordic, goodwill of 1,8 million euros was removed from the balance sheet. When the Group acquired more of the company Ou Horizon Travel, goodwill amounting to 0.4 million euros was rec-ognised for the acquisition. The total goodwill of Ou Horizon Travel is 0.7 million euros. After impairment testing it was found that no impairment losses need to be recognised. In impairment testing, the recoverable amount has been determined based on value in use. Cash flow forecasts are based on management-approved budgets and forecasts, which cover a five-year period. The discount rate used is 20.0% (Group WACC 9.5%). The main assumption in budgets and forecasts is 2% growth in revenue and expenses.
In the view of management a growth forecast percentage should be used as the most sensitive variable in value determination. The growth forecast used is 2% and is below the industry average for the operations in question. On the basis of a sensitivity analysis based on the growth forecast, if the growth rate were to be 0% below the management forecast, even so no requirement for an im-pairment recognition would arise in the Group.
If the discount rate used were to grow by 10%, the requirement for an impairment recognition would arise by 0.2 million euros.
Based on sensitivity analyses made by the company’s management, management considers that no grounds are perceptible that would require an impairment of goodwill.
Financial statement 31 Dec 2007
EUR mill. Land Buildings AircraftOther
equipment Advances TotalAcquisition costAcquisition cost 1 Jan 2007 1.7 187.7 1,629.7 241.8 72.9 2,133.8Additions 0.0 0.0 305.8 4.6 36.0 346.4Disposals 0.0 -3.6 -86.6 -4.5 -0.2 -94.9Transfers between items 0.0 0.0 0.0Transfer to a held-for-sale asset item -353.3 -353.3Acquisition cost 31 Dec 2007 1.7 184.1 1,495.6 241.9 108.7 2,032.0
Accumulated depreciation and impairment 0.0 -107.3 -812.6 -201.6 0.0 -1,121.5Accumulated depreciation and impairment 1 Jan 2007 -4.9 -89.9 -8.9 -103.7Depreciation 318.6 318.6Accumulated planned depreciation of disposals 1.0 39.1 3.4 43.5Accumulated depreciation and impairment 31 Dec 2007 0.0 -111.2 -544.8 -207.1 0.0 -863.1
book value 31 Dec 2007 1.7 72.9 950.8 34.8 108.7 1,168.9
Book value 1 Jan 2007 1.7 80.4 817.1 40.2 72.9 1,012.3
17. TANGIBLE fIXED ASSETS

Consolidated Statements 53
As surety for liabilities in 2008 is the carrying amount of aircraft pledged, namely 243.8 million euros (324.4).
Other equipment includes office equipment, furnishings, cars and transportation vehicles used at airports.
Changing the depreciation period and residual value in depreciation of buildings in fiscal year 2007 has a positive impact of 0.8 million euros on the result before taxes. The impact on the result is expected to be of similar magnitude in 2009.
Finance lease arrangementsTangible fixed assets include assets acquired under finance leases:
Financial statement 31 Dec 2008
EUR mill. Land Buildings AircraftOther
equipment Advances TotalAcquisition costAcquisition cost 1 Jan 2008 1.7 184.1 1,495.6 241.9 108.7 2,032.0Additions 0.0 31.6 199.1 26.6 2.9 260.2Disposals 0.0 -6.8 -156.5 -0.9 -7.5 -171.7Transfers between items 0.0 0.0 0.0Transfer to a held-for-sale asset item -93.4 -93.4Acquisition cost 31 Dec 2008 1.7 208.9 1,444.8 267.6 104.1 2,027.1
Accumulated depreciation and impairmentAccumulated depreciation and impairment 1 Jan 2008 0.0 -111.2 -544.8 -207.1 0.0 -863.1Depreciation -5.3 -84.1 -10.5 -99.9Accumulated depreciation for a held-for-sale asset item 74.0 74.0Accumulated planned depreciation of disposals 6.8 126.8 0.4 134.0Accumulated depreciation and impairment 31 Dec 2008 0.0 -109.7 -428.1 -217.2 0.0 -755.0
book value 31 Dec 2008 1.7 99.2 1,016.7 50.4 104.1 1,272.1
Book value 1 Jan 2008 1.7 72.9 950.8 34.8 108.7 1,168.9
Financial statement 31 Dec 2007
EUR mill. BuildingsMachinery
and vehicles TotalAcquisition cost 31 Dec 2007 8.2 8.7 16.9Accumulated depreciation -4.2 -7.0 -11.2book value 4.0 1.7 5.7
EUR mill. 2008 2009–2012 2013–Lease payments 4.9 6.7 0.5Discounting 0.7 1.2 0.2Net present value 4.2 5.5 0.3

54 Financial Report
Financial statement 31 Dec 2008
EUR mill. BuildingsMachinery
and vehicles TotalAcquisition cost 1 Jan 2008 8.2 8.7 16.9Additions 15.8 21.5 37.3Acquisition cost 31 Dec 2008 24.0 30.2 54.2Accumulated depreciation and impairment 1 Jan 2008 -4.2 -7.0 -11.2Depreciation -1.5 -4.4 -5.9Accumulated depreciation and impairment 31 Dec 2008 -5.7 -11.4 -17.1book value 18.3 18.8 37.1
EUR mill. 2009 2010–2013 2014–Lease payments 7.4 25.4 31.2Discounting 2.7 9.9 10.4Net present value 4.7 15.5 20.8
EUR mill. 31 Dec 2008 31 Dec 2007At beginning of the financial year 5.7 5.6Shares of results 0.3 0.1Additions 0.1 0.0Disposals 0.0 0.0At end of the financial year 6.1 5.7
Information on the group’s associated undertakingsFinancial statement 31 Dec 2007 Domicile Assets Liabilities Turnover Profit/Loss Holding (%)Suomen Jakelutiet Oy Finland 0.8 0.1 0.3 0.1 47.50Toivelomat Oy Finland 0.3 0.1 0.2 0.0 48.30Amadeus Estonia Estonia 0.7 0.1 0.8 0.2 33.25Kiinteistö Oy Lentäjäntie 1 Finland 35.5 27.4 1.3 0.0 28.33Kiinteistö Oy Lentäjäntie 3 Finland 11.3 9.4 0.6 0.0 39.12Total 48.6 37.1 3.2 0.3
Buildings in finance leasing arrangements are depreciated to plan 6–21 years and other equipment is depreciated according to plan over 5 years. In the financial year and in the comparison period no variable rents from finance leases have been recognised.
The Group’s share of the result, asset items and liabilities of associated companies, none of which are publicly listed, is presented below:
18. hOLDINGS IN ASSOCIATED uNDErTAKINGS
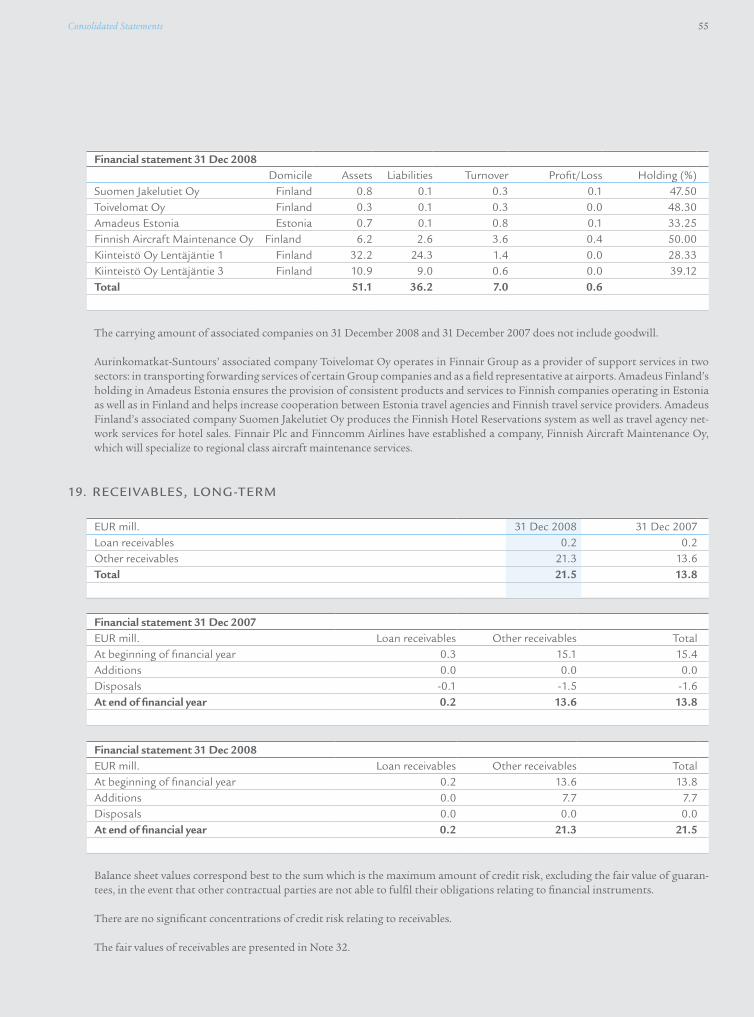
Consolidated Statements 55
EUR mill. 31 Dec 2008 31 Dec 2007Loan receivables 0.2 0.2Other receivables 21.3 13.6Total 21.5 13.8
Financial statement 31 Dec 2007EUR mill. Loan receivables Other receivables TotalAt beginning of financial year 0.3 15.1 15.4Additions 0.0 0.0 0.0Disposals -0.1 -1.5 -1.6At end of financial year 0.2 13.6 13.8
Financial statement 31 Dec 2008EUR mill. Loan receivables Other receivables TotalAt beginning of financial year 0.2 13.6 13.8Additions 0.0 7.7 7.7Disposals 0.0 0.0 0.0At end of financial year 0.2 21.3 21.5
19. rECEIVABLES, LONG-TErM
The carrying amount of associated companies on 31 December 2008 and 31 December 2007 does not include goodwill.
Aurinkomatkat-Suntours’ associated company Toivelomat Oy operates in Finnair Group as a provider of support services in two sectors: in transporting forwarding services of certain Group companies and as a field representative at airports. Amadeus Finland’s holding in Amadeus Estonia ensures the provision of consistent products and services to Finnish companies operating in Estonia as well as in Finland and helps increase cooperation between Estonia travel agencies and Finnish travel service providers. Amadeus Finland’s associated company Suomen Jakelutiet Oy produces the Finnish Hotel Reservations system as well as travel agency net-work services for hotel sales. Finnair Plc and Finncomm Airlines have established a company, Finnish Aircraft Maintenance Oy, which will specialize to regional class aircraft maintenance services.
Balance sheet values correspond best to the sum which is the maximum amount of credit risk, excluding the fair value of guaran-tees, in the event that other contractual parties are not able to fulfil their obligations relating to financial instruments.
There are no significant concentrations of credit risk relating to receivables.
The fair values of receivables are presented in Note 32.
Financial statement 31 Dec 2008 Domicile Assets Liabilities Turnover Profit/Loss Holding (%)Suomen Jakelutiet Oy Finland 0.8 0.1 0.3 0.1 47.50Toivelomat Oy Finland 0.3 0.1 0.3 0.0 48.30Amadeus Estonia Estonia 0.7 0.1 0.8 0.1 33.25Finnish Aircraft Maintenance Oy Finland 6.2 2.6 3.6 0.4 50.00Kiinteistö Oy Lentäjäntie 1 Finland 32.2 24.3 1.4 0.0 28.33Kiinteistö Oy Lentäjäntie 3 Finland 10.9 9.0 0.6 0.0 39.12Total 51.1 36.2 7.0 0.6
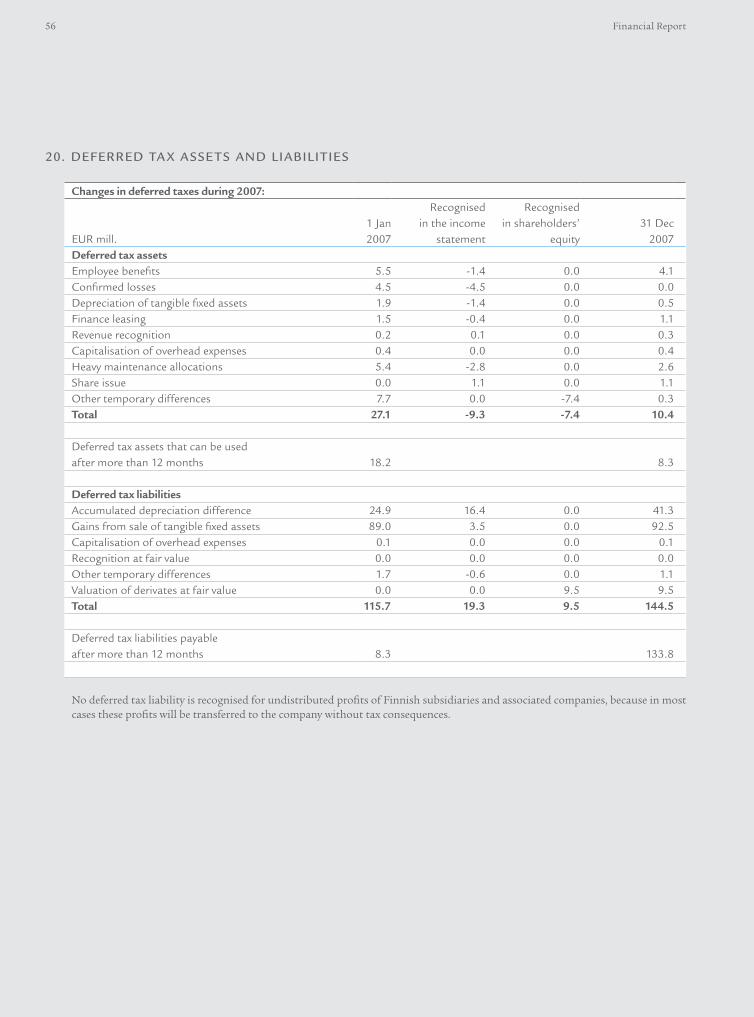
56 Financial Report
changes in deferred taxes during 2007:
EUR mill.1 Jan2007
Recognised in the income
statement
Recognised in shareholders’
equity31 Dec
2007Deferred tax assetsEmployee benefits 5.5 -1.4 0.0 4.1Confirmed losses 4.5 -4.5 0.0 0.0Depreciation of tangible fixed assets 1.9 -1.4 0.0 0.5Finance leasing 1.5 -0.4 0.0 1.1Revenue recognition 0.2 0.1 0.0 0.3Capitalisation of overhead expenses 0.4 0.0 0.0 0.4Heavy maintenance allocations 5.4 -2.8 0.0 2.6Share issue 0.0 1.1 0.0 1.1Other temporary differences 7.7 0.0 -7.4 0.3Total 27.1 -9.3 -7.4 10.4
Deferred tax assets that can be used after more than 12 months 18.2 8.3
Deferred tax liabilitiesAccumulated depreciation difference 24.9 16.4 0.0 41.3Gains from sale of tangible fixed assets 89.0 3.5 0.0 92.5Capitalisation of overhead expenses 0.1 0.0 0.0 0.1Recognition at fair value 0.0 0.0 0.0 0.0Other temporary differences 1.7 -0.6 0.0 1.1Valuation of derivates at fair value 0.0 0.0 9.5 9.5Total 115.7 19.3 9.5 144.5
Deferred tax liabilities payable after more than 12 months 8.3 133.8
No deferred tax liability is recognised for undistributed profits of Finnish subsidiaries and associated companies, because in most cases these profits will be transferred to the company without tax consequences.
20. DEfErrED TA X ASSETS AND LIABILITIES
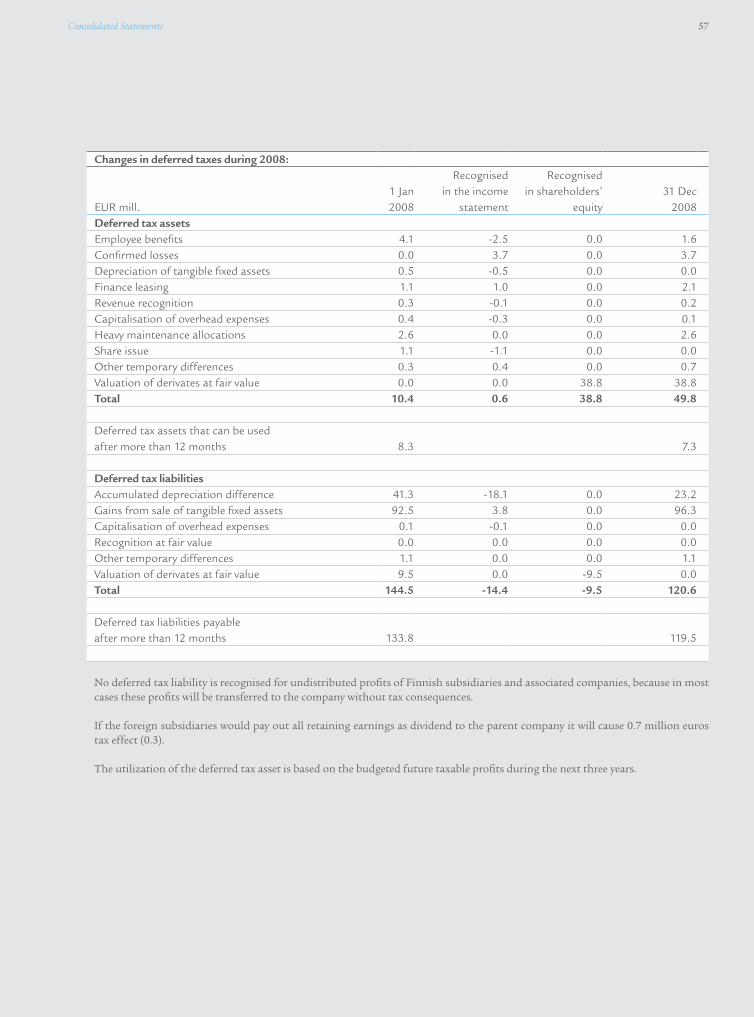
Consolidated Statements 57
changes in deferred taxes during 2008:
EUR mill.1 Jan2008
Recognised in the income
statement
Recognised in shareholders’
equity31 Dec
2008Deferred tax assetsEmployee benefits 4.1 -2.5 0.0 1.6Confirmed losses 0.0 3.7 0.0 3.7Depreciation of tangible fixed assets 0.5 -0.5 0.0 0.0Finance leasing 1.1 1.0 0.0 2.1Revenue recognition 0.3 -0.1 0.0 0.2Capitalisation of overhead expenses 0.4 -0.3 0.0 0.1Heavy maintenance allocations 2.6 0.0 0.0 2.6Share issue 1.1 -1.1 0.0 0.0Other temporary differences 0.3 0.4 0.0 0.7Valuation of derivates at fair value 0.0 0.0 38.8 38.8Total 10.4 0.6 38.8 49.8
Deferred tax assets that can be used after more than 12 months 8.3 7.3
Deferred tax liabilitiesAccumulated depreciation difference 41.3 -18.1 0.0 23.2Gains from sale of tangible fixed assets 92.5 3.8 0.0 96.3Capitalisation of overhead expenses 0.1 -0.1 0.0 0.0Recognition at fair value 0.0 0.0 0.0 0.0Other temporary differences 1.1 0.0 0.0 1.1Valuation of derivates at fair value 9.5 0.0 -9.5 0.0Total 144.5 -14.4 -9.5 120.6
Deferred tax liabilities payable after more than 12 months 133.8 119.5
No deferred tax liability is recognised for undistributed profits of Finnish subsidiaries and associated companies, because in most cases these profits will be transferred to the company without tax consequences.
If the foreign subsidiaries would pay out all retaining earnings as dividend to the parent company it will cause 0.7 million euros tax effect (0.3).
The utilization of the deferred tax asset is based on the budgeted future taxable profits during the next three years.

58 Financial Report
In the financial period 0.2 million euros have been recognized based on the difference between a carrying value and net realisable value. This has been booked in materials and supplies for aircraft maintenance, Note 8.
The carrying amount of inventories recognised at fair value is 5.6 million euros (6.3). Inventories have not been pledged for Group liabilities.
21. INVENTOrIES
EUR mill.31 Dec
200831 Dec
2007Materials and supplies 33.6 33.8Work in progress 1.5 2.3Total 35.1 36.1
22. TrADE rECEIVABLES AND OThEr rECEIVABLES
EUR mill.31 Dec
200831 Dec
2007Trade receivables 89.6 126.6Receivables from associated undertakings 1.7 0.2Prepaid expenses and accrued income 42.7 41.4Receivables based on derivative contracts 57.9 75.6Other receivables 39.9 43.5Total 231.8 287.3
Age distribution of trade receivables31 Dec
200831 Dec
2007Not overdue 83.9 110.7Overdue less than 60 days 5.5 10.5Overdue more than 60 days 0.2 5.4Total 89.6 126.6
Debt losses from trade receivablesThe Group has recognised during the financial year credit losses from trade receivables of 1.9 million euros (0.9).
The receivables not overdue and overdue do not consist any big credit risk, because of good distribution of customer basis.

Consolidated Statements 59
23. OThEr fINANCIAL ASSETS, ShOrT-TErM
EUR mill.31 Dec
200831 Dec
2007Deposits, commercial papers and certificates of deposit, and government bonds 364.7 493.0Listed shares 6.2 22.6Unlisted shares 2.9 3.0Total 373.8 518.6
Ratings of counterparties
EUR mill.31 Dec
200831 Dec
2007Better than A 219.4 410.4A 4.9 0.0BBB 4.9 6.0Unrated 144.6 102.2Total 373.8 518.6
Listed foreign shares are valued to closing quotation and mid-market exchange rates on the closing date.
In Note 31 is information about investing of groups’ short term asset and about group risk management policy.
IFRS classification and fair values of financial assets are presented in Note 32.
Items included in cash and bank deposits are available on demand. Foreign currency cash and bank deposits have been valued at mid-market exchange rates on the closing date.
24. CASh AND CASh EQuIVALENTS
EUR mill.31 Dec
200831 Dec
2007cash and bank deposits 18.3 21.5

60 Financial Report
Number of registered
sharesShare capital,
EUR
Share premium account,
EUR
Unrestricted equity,
EUR1 Jan 2007 88,756,358 75,442,904.30 20,407,351.01Share issue 39,379,757 244,880,581.3431 Dec 2007 128,136,115 75,442,904.30 20,407,351.01 244,880,581.34
Share-based bonus schemes expenses 2,267,230.4931 Dec 2008 128,136,115 75,442,904.30 20,407,351.01 247,147,811.83
Number of own shares
Price, EUR
Average price, EUR
1 Jan 2008 151,903 1,525,660.07 10.04Acquisition of own shares 598,097 4,735,765.56 7.92Disposal of own shares -364,912 -3,196,809.21 8.76Shares returned to company 2,341 0.00 0.0031 Dec 2008 387,429 3,064,616.42 7.91
25. EQuIT y-rEL ATED INfOrMATION
All issued shares are fully paid.
Obligation to redeem clauseThe Articles of Association have no obligation to redeem clause.
ReseRVes INcLuDeD IN sHAReHoLDeRs’ eQuITyShare issueAt the end of the financial year, the nominal value of paid but as yet unregistered shares is recognised in the share issue account.
Share premium accountShare issue gains arising during 1997–2006 have been recognised in the share premium account, less transaction expenses.
General reserveGains from share issues arising before Companies Act of 1997 have been recognised in the general reserve.
Translation differenceThe translation differences include translation differences arising from the translation of foreign units’ financial statements.
Unrestricted equityShare issue November 29–December 17, 2007 gains less transaction expenses have been recognised in the unrestricted equity and expenses of share bonus scheme.
Fair value reserveFair value reserve includes the fair value of derivative instruments used in cash flow hedging and changes in fair values of available for sale financial assets, less deferred tax.
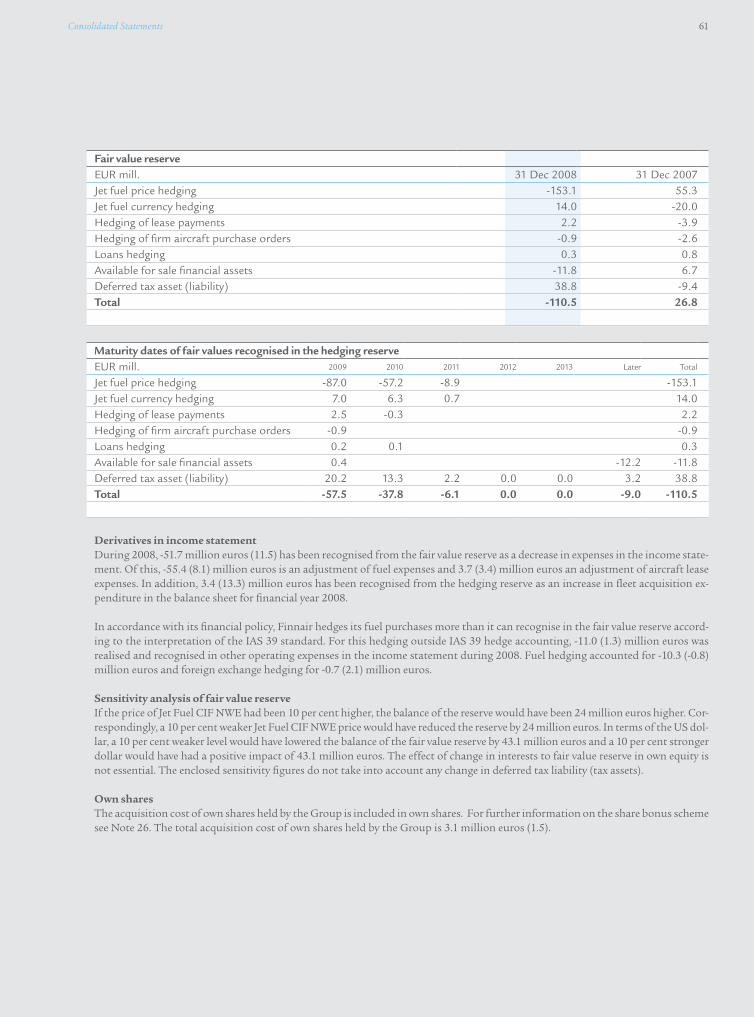
Consolidated Statements 61
Fair value reserveEUR mill. 31 Dec 2008 31 Dec 2007Jet fuel price hedging -153.1 55.3Jet fuel currency hedging 14.0 -20.0Hedging of lease payments 2.2 -3.9Hedging of firm aircraft purchase orders -0.9 -2.6Loans hedging 0.3 0.8Available for sale financial assets -11.8 6.7Deferred tax asset (liability) 38.8 -9.4Total -110.5 26.8
maturity dates of fair values recognised in the hedging reserveEUR mill. 2009 2010 2011 2012 2013 Later Total
Jet fuel price hedging -87.0 -57.2 -8.9 -153.1Jet fuel currency hedging 7.0 6.3 0.7 14.0Hedging of lease payments 2.5 -0.3 2.2Hedging of firm aircraft purchase orders -0.9 -0.9Loans hedging 0.2 0.1 0.3Available for sale financial assets 0.4 -12.2 -11.8Deferred tax asset (liability) 20.2 13.3 2.2 0.0 0.0 3.2 38.8Total -57.5 -37.8 -6.1 0.0 0.0 -9.0 -110.5
Derivatives in income statementDuring 2008, -51.7 million euros (11.5) has been recognised from the fair value reserve as a decrease in expenses in the income state-ment. Of this, -55.4 (8.1) million euros is an adjustment of fuel expenses and 3.7 (3.4) million euros an adjustment of aircraft lease expenses. In addition, 3.4 (13.3) million euros has been recognised from the hedging reserve as an increase in fleet acquisition ex-penditure in the balance sheet for financial year 2008.
In accordance with its financial policy, Finnair hedges its fuel purchases more than it can recognise in the fair value reserve accord-ing to the interpretation of the IAS 39 standard. For this hedging outside IAS 39 hedge accounting, -11.0 (1.3) million euros was realised and recognised in other operating expenses in the income statement during 2008. Fuel hedging accounted for -10.3 (-0.8) million euros and foreign exchange hedging for -0.7 (2.1) million euros.
Sensitivity analysis of fair value reserveIf the price of Jet Fuel CIF NWE had been 10 per cent higher, the balance of the reserve would have been 24 million euros higher. Cor-respondingly, a 10 per cent weaker Jet Fuel CIF NWE price would have reduced the reserve by 24 million euros. In terms of the US dol-lar, a 10 per cent weaker level would have lowered the balance of the fair value reserve by 43.1 million euros and a 10 per cent stronger dollar would have had a positive impact of 43.1 million euros. The effect of change in interests to fair value reserve in own equity is not essential. The enclosed sensitivity figures do not take into account any change in deferred tax liability (tax assets).
Own sharesThe acquisition cost of own shares held by the Group is included in own shares. For further information on the share bonus scheme see Note 26. The total acquisition cost of own shares held by the Group is 3.1 million euros (1.5).
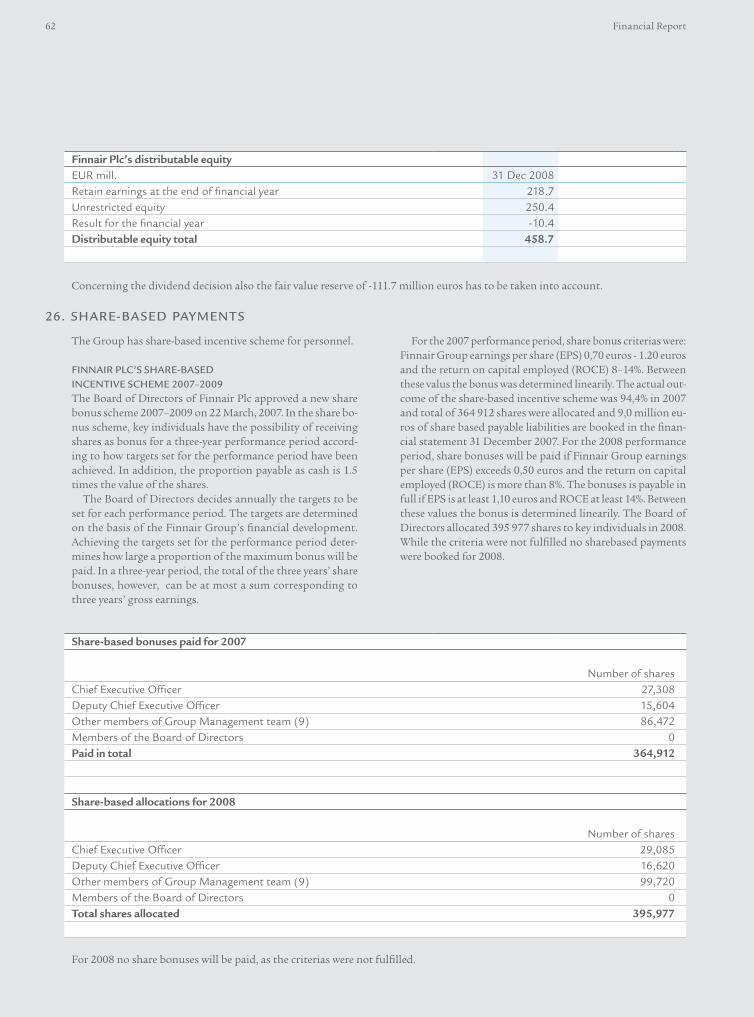
62 Financial Report
26. ShArE-BASED PAyMENTS
The Group has share-based incentive scheme for personnel.
fINNAIr PLC’S ShArE-BASED INCENTIVE SChEME 2007–2009The Board of Directors of Finnair Plc approved a new share bonus scheme 2007–2009 on 22 March, 2007. In the share bo-nus scheme, key individuals have the possibility of receiving shares as bonus for a three-year performance period accord-ing to how targets set for the performance period have been achieved. In addition, the proportion payable as cash is 1.5 times the value of the shares.
The Board of Directors decides annually the targets to be set for each performance period. The targets are determined on the basis of the Finnair Group’s financial development. Achieving the targets set for the performance period deter-mines how large a proportion of the maximum bonus will be paid. In a three-year period, the total of the three years’ share bonuses, however, can be at most a sum corresponding to three years’ gross earnings.
For the 2007 performance period, share bonus criterias were: Finnair Group earnings per share (EPS) 0,70 euros - 1.20 euros and the return on capital employed (ROCE) 8–14%. Between these valus the bonus was determined linearily. The actual out-come of the share-based incentive scheme was 94,4% in 2007 and total of 364 912 shares were allocated and 9,0 million eu-ros of share based payable liabilities are booked in the finan-cial statement 31 December 2007. For the 2008 performance period, share bonuses will be paid if Finnair Group earnings per share (EPS) exceeds 0,50 euros and the return on capital employed (ROCE) is more than 8%. The bonuses is payable in full if EPS is at least 1,10 euros and ROCE at least 14%. Between these values the bonus is determined linearily. The Board of Directors allocated 395 977 shares to key individuals in 2008. While the criteria were not fulfilled no sharebased payments were booked for 2008.
share-based bonuses paid for 2007
Number of sharesChief Executive Officer 27,308Deputy Chief Executive Officer 15,604Other members of Group Management team (9) 86,472Members of the Board of Directors 0paid in total 364,912
share-based allocations for 2008
Number of sharesChief Executive Officer 29,085Deputy Chief Executive Officer 16,620Other members of Group Management team (9) 99,720Members of the Board of Directors 0Total shares allocated 395,977
For 2008 no share bonuses will be paid, as the criterias were not fulfilled.
Concerning the dividend decision also the fair value reserve of -111.7 million euros has to be taken into account.
Finnair plc’s distributable equityEUR mill. 31 Dec 2008Retain earnings at the end of financial year 218.7Unrestricted equity 250.4Result for the financial year -10.4Distributable equity total 458.7

Consolidated Statements 63
Pension schemes are classified as defined-benefit and defined-contribution schemes. Payments made into defined-contribu-tion pension schemes are recognised in the income statement in the period to which the payment applies. In defined-benefit pension schemes, obligations are calculated using the project-ed unit credit method. Pension expenses are recognised as an expense over the employees’ period of service based on cal-culations made by authorised actuaries. Actuarial gains and losses, in terms of the portion exceeding a certain limit, are recognised over the employees’ average term of service. When calculating the present value of pension obligations the in-terest rate on government securities is used as the discount rate. The terms to maturity of government securities approx-imate substantially to the terms to maturity of the related pension liabilities
The Group’s foreign sales offices and subsidiaries have vari-ous pension schemes that comply with the local rules and practices of the countries in question. All of the most sig-
nificant pension schemes are defined-contribution schemes. The statutory pension cover of the employees of the Group’s Finnish companies has been arranged in a Finnish pension insurance company. The pension cover is a defined-contribu-tion scheme. The pension schemes of the parent company’s President & CEO and members of the Board of Management as well as those of the managing directors of subsidiaries are individual schemes, and the retirement age under these agree-ments varies from 60 to 65 years. These pension schemes are also defined-contribution schemes. Other (voluntary) pension cover of the Group’s domestic companies has been arranged as a rule in Finnair Plc’s Pension Fund, in which the pension schemes are defined-benefit schemes. These schemes deter-mine pension cover benefits, disability compensation, post-employment health-care and life insurance benefits as well as employment severance benefits. All of the Group’s post-retire-ment benefits are defined-contribution benefits.
27. PENSION LIABILITIES
Items recognised in the income statement1 Jan–31 Dec
20081 Jan–31 Dec
2007Current service costs for financial year 9.2 10.5Interest costs 18.3 16.8Expected return on plan assets gain -21.3 -21.4Past service cost-vested benefits -0.9 -0.2Total, included in personnel expenses 5.3 5.7
Items recognised in the balance sheet1 Jan–31 Dec
20081 Jan–31 Dec
2007Present value of funded obligations 324.2 352.9Fair value of scheme assets -339.7 -389.5
-15.5 -36.6Present value of unfunded obligations 0.0 0.0Unrecognised net actuarial gains / losses (-) 21.6 52.4Unrecognised costs based on past service 0.0 0.0Net liability 6.1 15.8Presented provisions 0.0 0.0Net liability presented in balance sheet 6.1 15.8
Defined-benefit pension schemes
The actual return of plan assets was -44.7 million euros in year 2008 (15.8).
The balance sheet pension liability for 2008 of 6.1 million euros (15.8) does not includ any liabilities outside the Pension Fund.
Pension scheme assets include Finnair Plc shares with a fair value of 0.7 million euros (1.1) and a buildings used by the Group with a fair value of 36.9 million euros (34.8).
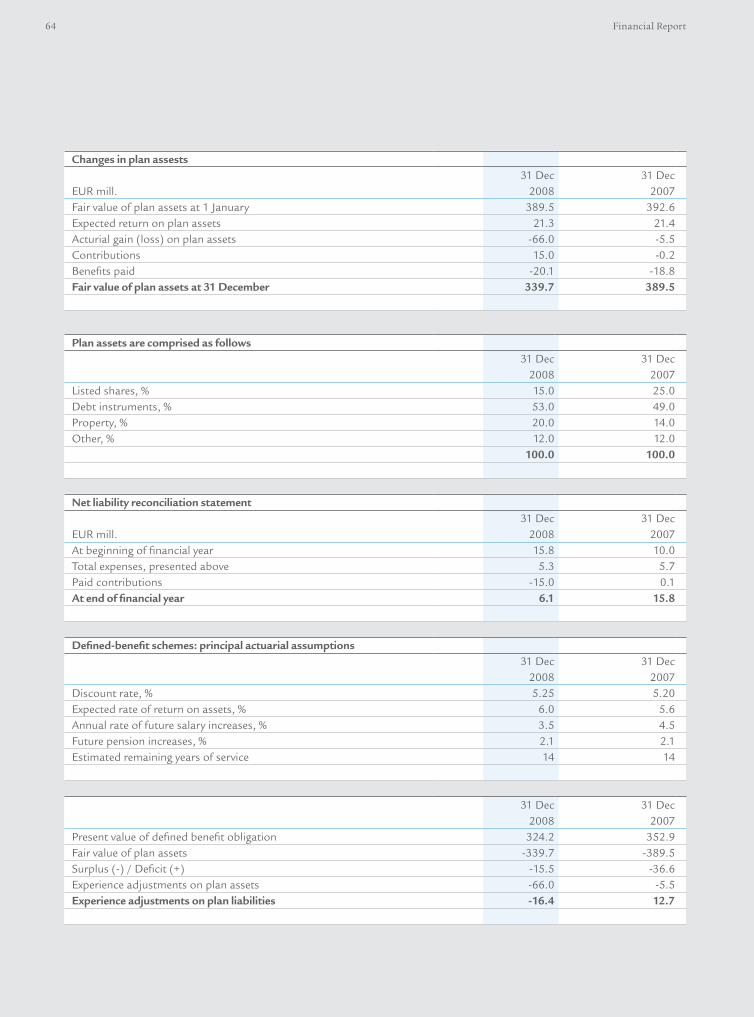
64 Financial Report
changes in plan assests
EUR mill.31 Dec
200831 Dec
2007Fair value of plan assets at 1 January 389.5 392.6Expected return on plan assets 21.3 21.4Acturial gain (loss) on plan assets -66.0 -5.5Contributions 15.0 -0.2Benefits paid -20.1 -18.8Fair value of plan assets at 31 December 339.7 389.5
plan assets are comprised as follows31 Dec
200831 Dec
2007Listed shares, % 15.0 25.0Debt instruments, % 53.0 49.0Property, % 20.0 14.0Other, % 12.0 12.0
100.0 100.0
Net liability reconciliation statement
EUR mill.31 Dec
200831 Dec
2007At beginning of financial year 15.8 10.0Total expenses, presented above 5.3 5.7Paid contributions -15.0 0.1At end of financial year 6.1 15.8
Defined-benefit schemes: principal actuarial assumptions31 Dec
200831 Dec
2007Discount rate, % 5.25 5.20Expected rate of return on assets, % 6.0 5.6Annual rate of future salary increases, % 3.5 4.5Future pension increases, % 2.1 2.1Estimated remaining years of service 14 14
31 Dec 2008
31 Dec 2007
Present value of defined benefit obligation 324.2 352.9Fair value of plan assets -339.7 -389.5Surplus (-) / Deficit (+) -15.5 -36.6Experience adjustments on plan assets -66.0 -5.5experience adjustments on plan liabilities -16.4 12.7

Consolidated Statements 65
28. PrOVISIONS
In financial year 2008, the Group has recognised personnel restructuring provision 2.4 million euros (0.0).
The Group is obliged to surrender leased aircraft at a certain maintenance standard. To fulfil these maintenance obligations the Group has recognised heavy maintenance provisions. The basis for a provision is flight hours flown during the maintenance period.
EUR mill.Restructuring
provisionMaintenance
provisions TotalProvisions at 1 January 2007 0.0 45.7 45.7Increase 0.0 10.6 10.6Decrease 0.0 -2.7 -2.7provisions at 31 Dec 2007 0.0 53.6 53.6
EUR mill.Restructuring
provisionMaintenance
provisions TotalProvisions at 1 January 2008 0.0 53.6 53.6Increase 2.4 5.5 7.9Decrease 0.0 0.0 0.0provisions at 31 Dec 2008 2.4 59.1 61.5
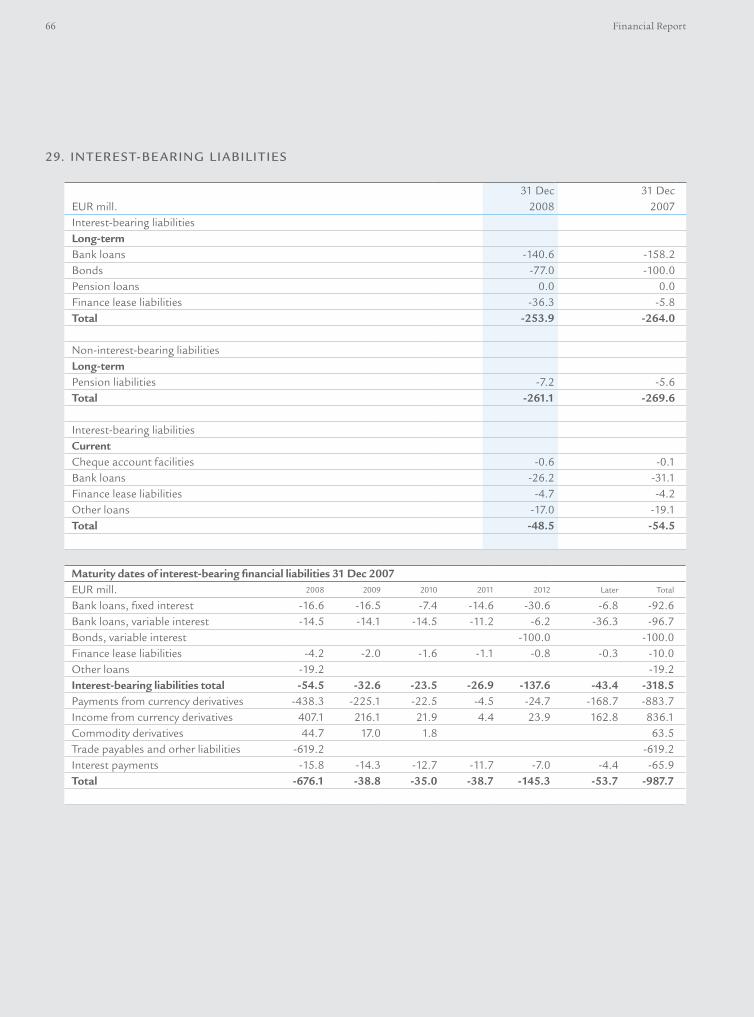
66 Financial Report
29. INTErEST-BEArING LIABILITIES
EUR mill.31 Dec
200831 Dec
2007Interest-bearing liabilitiesLong-termBank loans -140.6 -158.2Bonds -77.0 -100.0Pension loans 0.0 0.0Finance lease liabilities -36.3 -5.8Total -253.9 -264.0
Non-interest-bearing liabilitiesLong-termPension liabilities -7.2 -5.6Total -261.1 -269.6
Interest-bearing liabilitiescurrentCheque account facilities -0.6 -0.1Bank loans -26.2 -31.1Finance lease liabilities -4.7 -4.2Other loans -17.0 -19.1Total -48.5 -54.5
maturity dates of interest-bearing financial liabilities 31 Dec 2007EUR mill. 2008 2009 2010 2011 2012 Later Total
Bank loans, fixed interest -16.6 -16.5 -7.4 -14.6 -30.6 -6.8 -92.6Bank loans, variable interest -14.5 -14.1 -14.5 -11.2 -6.2 -36.3 -96.7Bonds, variable interest -100.0 -100.0Finance lease liabilities -4.2 -2.0 -1.6 -1.1 -0.8 -0.3 -10.0Other loans -19.2 -19.2Interest-bearing liabilities total -54.5 -32.6 -23.5 -26.9 -137.6 -43.4 -318.5Payments from currency derivatives -438.3 -225.1 -22.5 -4.5 -24.7 -168.7 -883.7Income from currency derivatives 407.1 216.1 21.9 4.4 23.9 162.8 836.1Commodity derivatives 44.7 17.0 1.8 63.5Trade payables and orher liabilities -619.2 -619.2Interest payments -15.8 -14.3 -12.7 -11.7 -7.0 -4.4 -65.9Total -676.1 -38.8 -35.0 -38.7 -145.3 -53.7 -987.7
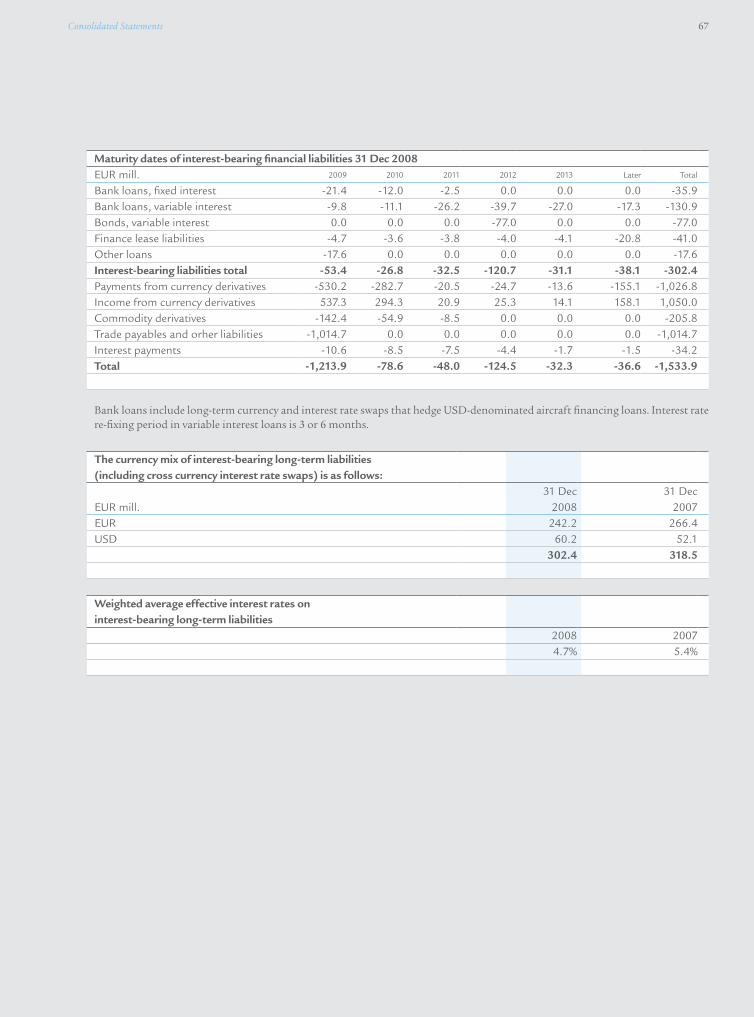
Consolidated Statements 67
maturity dates of interest-bearing financial liabilities 31 Dec 2008EUR mill. 2009 2010 2011 2012 2013 Later Total
Bank loans, fixed interest -21.4 -12.0 -2.5 0.0 0.0 0.0 -35.9Bank loans, variable interest -9.8 -11.1 -26.2 -39.7 -27.0 -17.3 -130.9Bonds, variable interest 0.0 0.0 0.0 -77.0 0.0 0.0 -77.0Finance lease liabilities -4.7 -3.6 -3.8 -4.0 -4.1 -20.8 -41.0Other loans -17.6 0.0 0.0 0.0 0.0 0.0 -17.6Interest-bearing liabilities total -53.4 -26.8 -32.5 -120.7 -31.1 -38.1 -302.4Payments from currency derivatives -530.2 -282.7 -20.5 -24.7 -13.6 -155.1 -1,026.8Income from currency derivatives 537.3 294.3 20.9 25.3 14.1 158.1 1,050.0Commodity derivatives -142.4 -54.9 -8.5 0.0 0.0 0.0 -205.8Trade payables and orher liabilities -1,014.7 0.0 0.0 0.0 0.0 0.0 -1,014.7Interest payments -10.6 -8.5 -7.5 -4.4 -1.7 -1.5 -34.2Total -1,213.9 -78.6 -48.0 -124.5 -32.3 -36.6 -1,533.9
Bank loans include long-term currency and interest rate swaps that hedge USD-denominated aircraft financing loans. Interest rate re-fixing period in variable interest loans is 3 or 6 months.
The currency mix of interest-bearing long-term liabilities (including cross currency interest rate swaps) is as follows:
EUR mill.31 Dec
200831 Dec
2007EUR 242.2 266.4USD 60.2 52.1
302.4 318.5
Weighted average effective interest rates on interest-bearing long-term liabilities
2008 20074.7% 5.4%
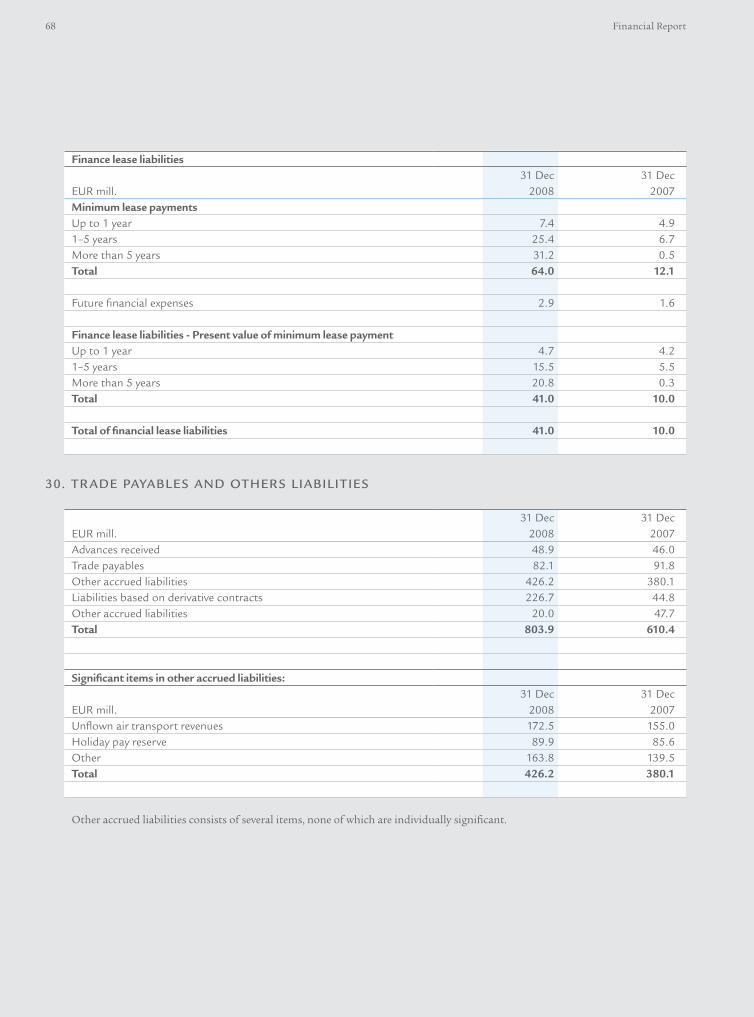
68 Financial Report
Finance lease liabilities
EUR mill.31 Dec
200831 Dec
2007minimum lease paymentsUp to 1 year 7.4 4.91–5 years 25.4 6.7More than 5 years 31.2 0.5Total 64.0 12.1
Future financial expenses 2.9 1.6
Finance lease liabilities - present value of minimum lease paymentUp to 1 year 4.7 4.21–5 years 15.5 5.5More than 5 years 20.8 0.3Total 41.0 10.0
Total of financial lease liabilities 41.0 10.0
Other accrued liabilities consists of several items, none of which are individually significant.
30. TrADE PAyABLES AND OThErS LIABILITIES
EUR mill.31 Dec
200831 Dec
2007Advances received 48.9 46.0Trade payables 82.1 91.8Other accrued liabilities 426.2 380.1Liabilities based on derivative contracts 226.7 44.8Other accrued liabilities 20.0 47.7Total 803.9 610.4
significant items in other accrued liabilities:
EUR mill.31 Dec
200831 Dec
2007Unflown air transport revenues 172.5 155.0Holiday pay reserve 89.9 85.6Other 163.8 139.5Total 426.2 380.1
Consolidated Statements 69
31. MANAGEMENT Of fINANCIAL rISKS
Risk management in Finnair
PrINCIPLES Of fINANCIAL rISK MANAGEMENTThe nature of the Finnair Group’s business operations expos-es the company to foreign exchange, interest rate, credit and liquidity, and fuel price risks. The Group’s policy is to limit the uncertainty caused by such risks on cash flow, financial performance and equity.
The management of financial risks is based on the risk man-agement policy, which specifies the minimum and maximum levels permitted for each type of risk. Financial risk manage-ment is directed and supervised by the Financial Risk Steering Group. Practical implementation of financial policy and risk management have been centralised in the parent company’s finance department.
In its management of foreign exchange, interest rate and jet fuel positions the company uses different derivative instru-ments, such as forward contracts, swaps and options. Deriva-tives are designated at inception as hedges for future cash flows (cash flow hedges), hedges for firm orders (hedges of the fair value of firm commitments) or as financial derivatives not qualifying for hedge accounting (economic hedges). In terms of the hedging of future cash flows (cash flow hedging), the Finnair Group implements, in accordance with IAS 39 hedge accounting principles, hedging of fixed rate foreign exchange loans, foreign exchange hedging of lease payments and aircraft purchases, and hedging of jet fuel price and foreign exchange risks. In addition, hedging of firm commitment is used for aircraft investments.
fuEL PrICE rISK IN fLIGhT OPErATIONSFuel price risk means the cash flow and financial performance uncertainty arising from fuel price fluctuations.
Finnair hedges against jet fuel price fluctuations using gasoil and jet fuel forward contracts and options. As the underlying asset of jet fuel derivatives, the Jet Fuel CIF Cargoes NWE in-dex is used, because around 65% of Finnair’s fuel purchase contracts are based on the benchmark price index for North and West Europe jet fuel deliveries.
Finnair applies the principle of time-diversification in its fuel hedging. The hedging horizon according to the finan-cial policy is three years. Under the financial policy, hedging must be increased in each quarter of the year so that the hedge ratio for Finnair’s Scheduled Passenger Traffic for the first six months is more than 60% and so that thereafter a lower hedge ratio applies for each period. By allocating the hedg-ing, the fuel cost per period is not as low as the spot-based price when prices fall, but when spot prices rise the fuel cost rises more slowly.
In accounting fuel hedges are recognised in Finnair in two different ways. In terms of the fuel consumption of Finnair, the first approximately 40 percentage points per perioid are treated in accounting as cash flow hedging in accordance with IAS 39 hedge accounting principles. Changes in the fair value
of derivatives defined as cash-flow hedging in accordance with IAS 39 are posted directly to the fair value reserve included in equity. The change in fair value recognised in the equity hedging reserve is posted to income statement at the perioid time as the hedged transaction. Changes in the fair value of hedges outside hedge accounting – which do not fulfil IAS 39 hedge accounting criteria – are recognised in other operating expenses over the time of the derivative.
At the end of financial year, Scheduled Passenger Traffic had hedged 75% of its fuel purchases for the first six months of 2009 and 54% for the second half of the year. Leisure Traffic has hedged 60% of its fuel purchases for the remaining win-ter season and 40% of its purchases for the coming summer season. At the end of the financial year Leisure Traffic has no price clauses with tour operators similar to those agreed in previous years.
In the financial year 2008, fuel used in flight operations ac-counted for 24,6% compared to the Group’s turnover. At the end of the financial year, the forecast for 2009 is over 22%. On the closing date, a ten per cent rise in the market price of jet fuel – excluding hedging activity calculated using Scheduled Passenger Traffic’s forecasted flights for 2009 – increases an-nual fuel costs by an estimated 33 million euros. On the closing date – taking hedging into account – a ten per cent rise in fuel lowers operating profit by around 14 million euros. Situation as at 31 December represents well mean of calendar year.
fOrEIGN EXChANGE rISKForeign exchange risk means the cash flow and financial per-formance uncertainty arising from exchange rate fluctuations. The Finnair Group’s foreign exchange risk arises mainly from fuel and aircraft purchases, aircraft leasing payments and for-eign currency incomes.
The financial policy divides the foreign exchange position into two parts, a profit and loss position and an investment position. The profit and loss position consists of dollar-de-nominated fuel purchases and leasing payments, sales reve-nue in a number of different currencies, and also foreign ex-change-denominated money market investments and loans. The investment position includes dollar-denominated aircraft investments.
Finnair applies the principle of time-diversification in its foreign exchange hedging. The hedging horizon according to the financial policy is two years. The hedge ratio of the foreign exchange position is determined as the reduction of the over-all risk of the position using the value-at-risk method. Under the financial policy, hedges must be added to the profit and loss position in each half of the year so that the hedge ratio for the first six months is more than 60% and so that there-after the hedge ratio declines for each period. In addition, Finnair hedges foreign exhange risk exceeding two years as far as hedging the currency risk of fuel is concerned (IAS 39 cash flow hedging).
The investment position includes all foreign exchange-de-

70 Financial Report
nominated aircraft investments for which a binding procure-ment contract has been signed. According to the financial policy, at least half of the investments recognised in the bal-ance sheet must be hedged after the signing of a firm order. New hedges in investment position will be made as IAS 39 fair value hedge of a firm commitment.
Around 68% of Group turnover is denominated in euros. The most important other foreign sales currencies are the Swedish crown, the Japanese yen, the Chinese yuan, the US dollar and the British pound.
Approximately one third of the Group’s operating costs are denominated in foreign currencies. The most important pur-chasing currency is the US dollar, which accounts for approxi-mately 27% of all operating costs. Significant dollar-denominat-ed expense items are aircraft leasing payments and fuel costs. The largest investments, the acquisition of aircraft and their spare parts, also take place mainly in US dollars.
At the end of financial year, Scheduled Passenger Traffic had hedged 80% of its profit and loss items for the first six months of 2009 and 62% for the second half of the year. On the closing date a 10% strengthening of the dollar against the euro – without hedging – has a negative impact on the annual result of around 47 million euros. On the closing date – tak-ing hedging into account – a 10% strengthening of the dollar weakens the result by around 12 million euros. In the above sensitivity estimates, the dollar risk includes also the Chinese yuan and the Hong Kong dollar, whose historical correlation with the dollar is high. Situation as at 31 December represents well mean of calendar year.
INTErEST rATE rISKInterest rate risk means the cash flow and financial perform-ance uncertainty arising from interest rate fluctuations.
In Finnair Group the interest rate risk is measured using the interest rate re-fixing period. If necessary, interest rate de-rivatives are used to adjust the interest rate re-fixing period. According to the financial policy, the mandate for the invest-ment portfolio’s interest rate re-fixing period is 0–12 months and for interest-bearing liabilities 0–24 months. On the closing date the investment portfolio’s interest rate re-fixing period was 2 months and for interest-bearing liabilities 5 months. On the closing date a one percentage point rise in interest rates increases the annual interest income of the investment port-folio about 3 million euros and the interest expenses of the loan portfolio by less than 2 million euros. Situation as at 31 December represents well mean of calendar year.
CrEDIT rISKThe Group is exposed to counterparty risk when investing its cash reserves and in using derivative instruments. The credit risk is managed by making contracts, within the framework of risk management policy of counterparty risk limits, only with financially sound domestic and foreign banks, financial institu-tions and brokers. Liquid assets are also invested in bonds and commercial paper issued by conservatively selected company-specific within limits. This way risk towards single counterpar-
ties are not significant. Change in fair value of groups loans rise from changes in FX and interest, not from credit risk. Groups’ maximum exposure to credit risk is other financial assets pre-sented at Note 23, cash and cash equivalent presented in Note 24, and trade receivables presented in Note 22.
LIQuIDITy rISKThe goal of the Finnair Group is to maintain good liquidity. Liquidity is ensured by cash reserves, bank account limits, liquid money market investments and committed credit fa-cilities. With respect to aircraft acquisitions, the company’s policy is to secure financing, for example through committed loans, at a minimum of 6 months before delivery. Counterpar-ties of groups’ long term loans are solid financial institutions with good reputation.
The Group’s liquid assets were 392 million euros at the end of financial year 2008. Finnair Plc has a domestic commercial paper programme of 100 million euros, which wasn’t used on the closing date. In addition, Finnair has a 200 million euro committed credit facility, committed unused 50 million euros aircraft financing limit and a 60 million dollar credit facility. The 200 million euros credit facility includes a finance covenant based on adjusted gearing. The covenant level of adjusted gear-ing is 175%, while at the closing date the figure was 63.2%. The maximum level set by the Board of Directors is 140%.
CAPITAL MANAGEMENTThe aim of the Group’s capital management is, with the aid of an optimum capital structure, to support business opera-tions by ensuring normal operating conditions and to increase shareholder value with the best possible return being the goal. An optimum capital structure also ensures lower capital costs. The capital structure is influenced e.g. via dividend distribu-tion and share issues. The Group can vary and adjust the lev-el of dividends paid to shareholders or the amount of capi-tal returned to them or the number of new shares issued, or can decide on sales of asset items in order to reduce debt. It is the aim the Finnair’s dividend policy to pay on average at least one third of the earnings per share as dividend during an economic cycle.
The development of the Group’s capital structure is moni-tored continuously using adjusted gearing. When calculating adjusted gearing, interest-bearing net debt is divided by the amount of shareholders’ equity. Net debt includes interest-bearing debt less interest-bearing receivables and cash and cash equivalents.The Group’s adjusted gearing at the end of 2008 was 63.2% (35.1).
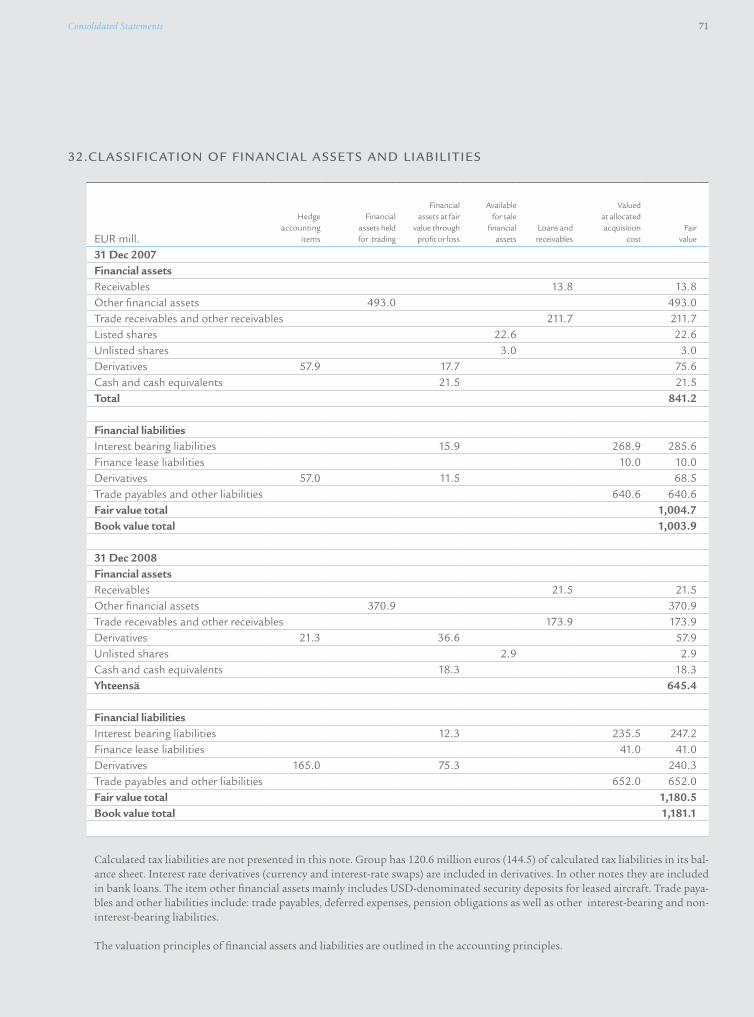
Consolidated Statements 71
EUR mill.
Hedge accounting
items
Financial assets held for trading
Financial assets at fair
value through profit or loss
Available for sale
financial assets
Loans and receivables
Valued at allocated acquisition
costFair
value
31 Dec 2007Financial assetsReceivables 13.8 13.8Other financial assets 493.0 493.0Trade receivables and other receivables 211.7 211.7Listed shares 22.6 22.6Unlisted shares 3.0 3.0Derivatives 57.9 17.7 75.6Cash and cash equivalents 21.5 21.5Total 841.2
Financial liabilitiesInterest bearing liabilities 15.9 268.9 285.6Finance lease liabilities 10.0 10.0Derivatives 57.0 11.5 68.5Trade payables and other liabilities 640.6 640.6Fair value total 1,004.7book value total 1,003.9
31 Dec 2008Financial assetsReceivables 21.5 21.5Other financial assets 370.9 370.9Trade receivables and other receivables 173.9 173.9Derivatives 21.3 36.6 57.9Unlisted shares 2.9 2.9Cash and cash equivalents 18.3 18.3yhteensä 645.4
Financial liabilitiesInterest bearing liabilities 12.3 235.5 247.2Finance lease liabilities 41.0 41.0Derivatives 165.0 75.3 240.3Trade payables and other liabilities 652.0 652.0Fair value total 1,180.5book value total 1,181.1
Calculated tax liabilities are not presented in this note. Group has 120.6 million euros (144.5) of calculated tax liabilities in its bal-ance sheet. Interest rate derivatives (currency and interest-rate swaps) are included in derivatives. In other notes they are included in bank loans. The item other financial assets mainly includes USD-denominated security deposits for leased aircraft. Trade paya-bles and other liabilities include: trade payables, deferred expenses, pension obligations as well as other interest-bearing and non-interest-bearing liabilities.
The valuation principles of financial assets and liabilities are outlined in the accounting principles.
32.CL ASSIfICATION Of fINANCIAL ASSETS AND LIABILITIES

72 Financial Report
33. SuBSIDIArIES
34. OThEr LEASE AGrEEMENTS
EUR mill. Group ownership % Finnair Cargo Oy, Helsinki 100.00 Finnair Cargo Terminal Operations Oy, Helsinki 100.00Amadeus Finland Oy, Helsinki 95.00Matkatoimisto Oy Area, Helsinki 100.00A/S Estravel Ltd, Estonia 72.02Oy Aurinkomatkat - Suntours Ltd Ab, Helsinki 100.00OOO Aurinkomatkat, Russia 100.00Calypso, Russia 80.00Matkayhtymä Oy, Helsinki 100.00Horizon Travel, Estonia 95.00FTS Financial Services Oy, Helsinki 100.00 Finnair Catering Oy, Helsinki 100.00 Finnair Facilities Management Oy, Helsinki 100.00 Finnair Aircraft Finance Oy, Helsinki 100.00Finncatering Oy, Vantaa 100.00Northport Oy, Helsinki 100.00Finland Travel Bureau Ltd., Helsinki 100.00
The group is the lesseeminimum rental payments for irrevocable lease agreements are as follows:
Aircrafts Buildings Machinery and vehicles
EUR mill.31 Dec
200831 Dec
200731 Dec
200831 Dec
200731 Dec
200831 Dec
2007less than a year 76.1 75.3 11.7 12.9 7.5 6.51–2 years 54.8 68.5 10.8 11.1 5.9 5.52–3 years 49.0 49.9 10.4 10.9 19.9 22.63–4 years 40.5 45.2 9.4 9.5 0.1 0.14–5 years 24.4 37.0 8.7 8.7 0.0 0.0more than 5 years 41.1 48.9 82.8 89.9 0.0 0.0Total 285.9 324.8 133.8 143.0 33.4 34.7
The Group has leased premises as well as aircraft and other fixed assets with irrevocable lease agreements. These agreements have differ-ent levels of renewal and other index-linked terms and conditions. The Group has leased 32 aircraft on leases of different lengths.
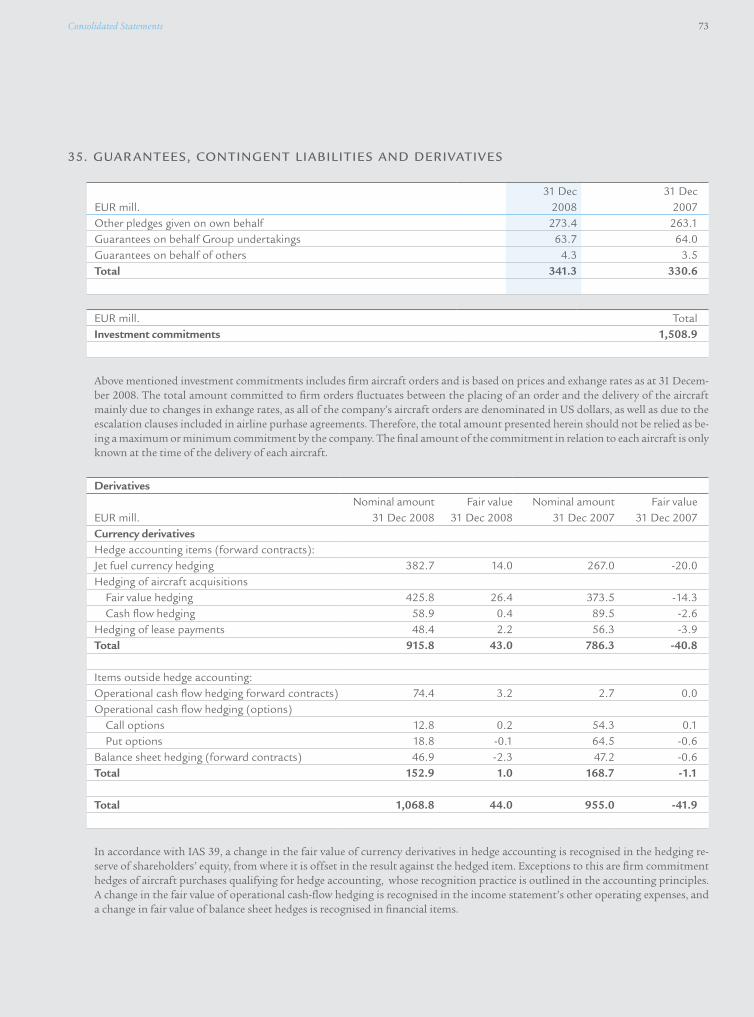
Consolidated Statements 73
35. GuArANTEES, CONTINGENT LIABILITIES AND DErIVATIVES
EUR mill.31 Dec
200831 Dec
2007Other pledges given on own behalf 273.4 263.1Guarantees on behalf Group undertakings 63.7 64.0Guarantees on behalf of others 4.3 3.5Total 341.3 330.6
EUR mill. TotalInvestment commitments 1,508.9
Above mentioned investment commitments includes firm aircraft orders and is based on prices and exhange rates as at 31 Decem-ber 2008. The total amount committed to firm orders fluctuates between the placing of an order and the delivery of the aircraft mainly due to changes in exhange rates, as all of the company’s aircraft orders are denominated in US dollars, as well as due to the escalation clauses included in airline purhase agreements. Therefore, the total amount presented herein should not be relied as be-ing a maximum or minimum commitment by the company. The final amount of the commitment in relation to each aircraft is only known at the time of the delivery of each aircraft.
Derivatives
EUR mill.Nominal amount
31 Dec 2008Fair value
31 Dec 2008Nominal amount
31 Dec 2007Fair value
31 Dec 2007currency derivativesHedge accounting items (forward contracts):Jet fuel currency hedging 382.7 14.0 267.0 -20.0Hedging of aircraft acquisitions
Fair value hedging 425.8 26.4 373.5 -14.3Cash flow hedging 58.9 0.4 89.5 -2.6
Hedging of lease payments 48.4 2.2 56.3 -3.9Total 915.8 43.0 786.3 -40.8
Items outside hedge accounting:Operational cash flow hedging forward contracts) 74.4 3.2 2.7 0.0Operational cash flow hedging (options)
Call options 12.8 0.2 54.3 0.1Put options 18.8 -0.1 64.5 -0.6
Balance sheet hedging (forward contracts) 46.9 -2.3 47.2 -0.6Total 152.9 1.0 168.7 -1.1
Total 1,068.8 44.0 955.0 -41.9
In accordance with IAS 39, a change in the fair value of currency derivatives in hedge accounting is recognised in the hedging re-serve of shareholders’ equity, from where it is offset in the result against the hedged item. Exceptions to this are firm commitment hedges of aircraft purchases qualifying for hedge accounting, whose recognition practice is outlined in the accounting principles. A change in the fair value of operational cash-flow hedging is recognised in the income statement’s other operating expenses, and a change in fair value of balance sheet hedges is recognised in financial items.
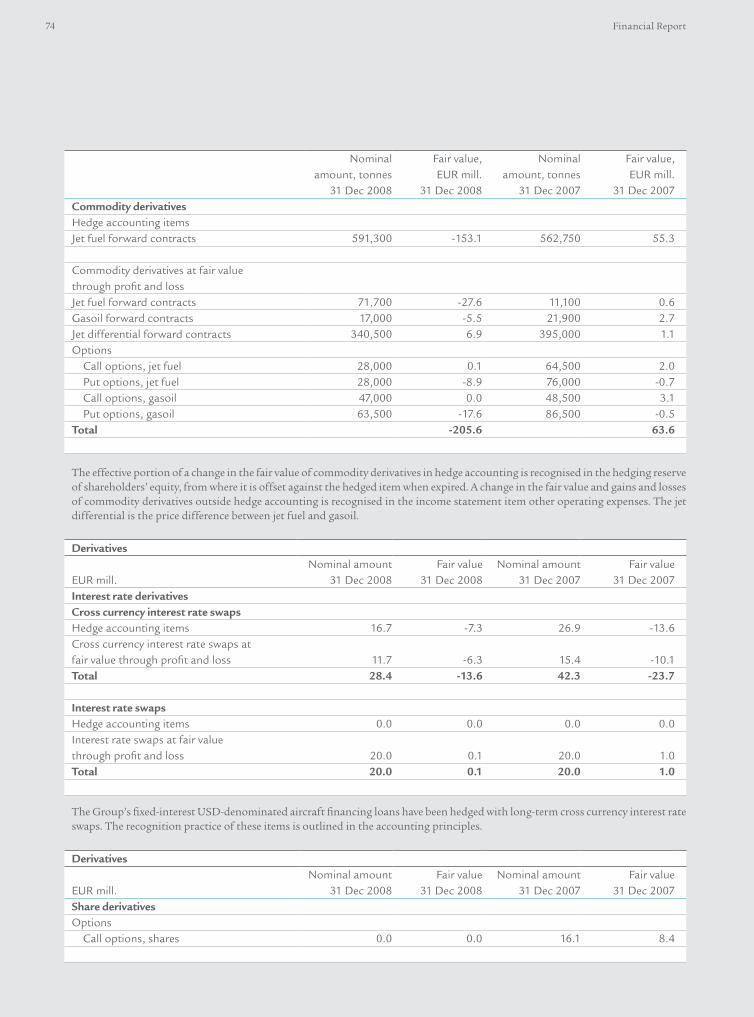
74 Financial Report
Nominal amount, tonnes
31 Dec 2008
Fair value, EUR mill.
31 Dec 2008
Nominal amount, tonnes
31 Dec 2007
Fair value, EUR mill.
31 Dec 2007commodity derivativesHedge accounting itemsJet fuel forward contracts 591,300 -153.1 562,750 55.3
Commodity derivatives at fair value through profit and lossJet fuel forward contracts 71‚700 -27.6 11,100 0.6Gasoil forward contracts 17,000 -5.5 21,900 2.7Jet differential forward contracts 340,500 6.9 395,000 1.1Options
Call options, jet fuel 28,000 0.1 64,500 2.0Put options, jet fuel 28,000 -8.9 76,000 -0.7Call options, gasoil 47,000 0.0 48,500 3.1Put options, gasoil 63,500 -17.6 86,500 -0.5
Total -205.6 63.6
The effective portion of a change in the fair value of commodity derivatives in hedge accounting is recognised in the hedging reserve of shareholders’ equity, from where it is offset against the hedged item when expired. A change in the fair value and gains and losses of commodity derivatives outside hedge accounting is recognised in the income statement item other operating expenses. The jet differential is the price difference between jet fuel and gasoil.
The Group’s fixed-interest USD-denominated aircraft financing loans have been hedged with long-term cross currency interest rate swaps. The recognition practice of these items is outlined in the accounting principles.
Derivatives
EUR mill.Nominal amount
31 Dec 2008Fair value
31 Dec 2008Nominal amount
31 Dec 2007Fair value
31 Dec 2007Interest rate derivativescross currency interest rate swapsHedge accounting items 16.7 -7.3 26.9 -13.6Cross currency interest rate swaps at fair value through profit and loss 11.7 -6.3 15.4 -10.1Total 28.4 -13.6 42.3 -23.7
Interest rate swapsHedge accounting items 0.0 0.0 0.0 0.0Interest rate swaps at fair value through profit and loss 20.0 0.1 20.0 1.0Total 20.0 0.1 20.0 1.0
Derivatives
EUR mill.Nominal amount
31 Dec 2008Fair value
31 Dec 2008Nominal amount
31 Dec 2007Fair value
31 Dec 2007share derivativesOptions
Call options, shares 0.0 0.0 16.1 8.4

Consolidated Statements 75
36. rEL ATED PArT y TrANSACTIONS
The following transactions have taken place with related parties:EUR mill. 2008 2007sales of goods and servicesAssociated undertakings 0.0 0.0Management - -
purchases of goods and servicesAssociated undertakings 2.2 0.6Management - -Receivables and liabilitiesReceivables from associated undertakings 1.5 0.0Liabilities to associated undertakings 0.0 0.0
Sales of goods and services executed with related parties correspond in nature to transactions carried out with independent parties.
The consolidated financial statements do not contain any open receivable or liability balances with management.
No credit losses from related party transactions have been recognised in the final year or the comparison year.
Guarantees and other commitments made on behalf of related parties are presented in Note 35.
The employee benefits of management are presented in Note 9. No loans have been granted to management personnel.
37. DISPuTES AND LITIGATION
38. EVENTS Af TEr ThE CLOSING DATE
Only cases of which the interest is 500,000 euros or more and that are not insured, are reported. Accordingly, the previously report-ed claim of approximately 1 million euros against Finnair Plc and Finnair Cargo Oy for lost cargo will not be reported in the future as the potential liability is insured.
On 31 December 2008 the following disputes were pending:
Transpert Oy has presented to Finnair approximately 600,000 euros damage compensation claim following the termination of a subcontracting agreement. Finnair has disputed the claim. The case is pending in the Helsinki District Court.
North Ground Handling Oy has presented to Northport Oy appr. 940,000 euros damage compensation claim for a dispute regard-ing a groundhandling agreement. Northport has disputed the claim. The case is pending in an arbitartion court.
No provisions have been made for disputes or litigation.
Group has concluded the statutory employer-employee negotiations under the act on Co-Determination within Undertakings (YT negotiations), that began in June 2008. The goal of the negotitations was to achieve 25 million euros of savings in personnel ex-penses, corresponding to around five per cent of total personnel costs.
The collective agreement for pilots ended at the end of November 2008 and the negotiations are ongoing. The Finnish Airline Pilots’ Association (SLL) representing Finnair’s pilots has decided to initiate a labour dispute to attain its collective agreement on terms of employment negotiation aims. The action of the dispute started 24th of January in form of overtime ban. In addition, the pilots have given notification of their intention ro carry out strikes that will halt Finnair flights a daily basis starting from 25th of February.
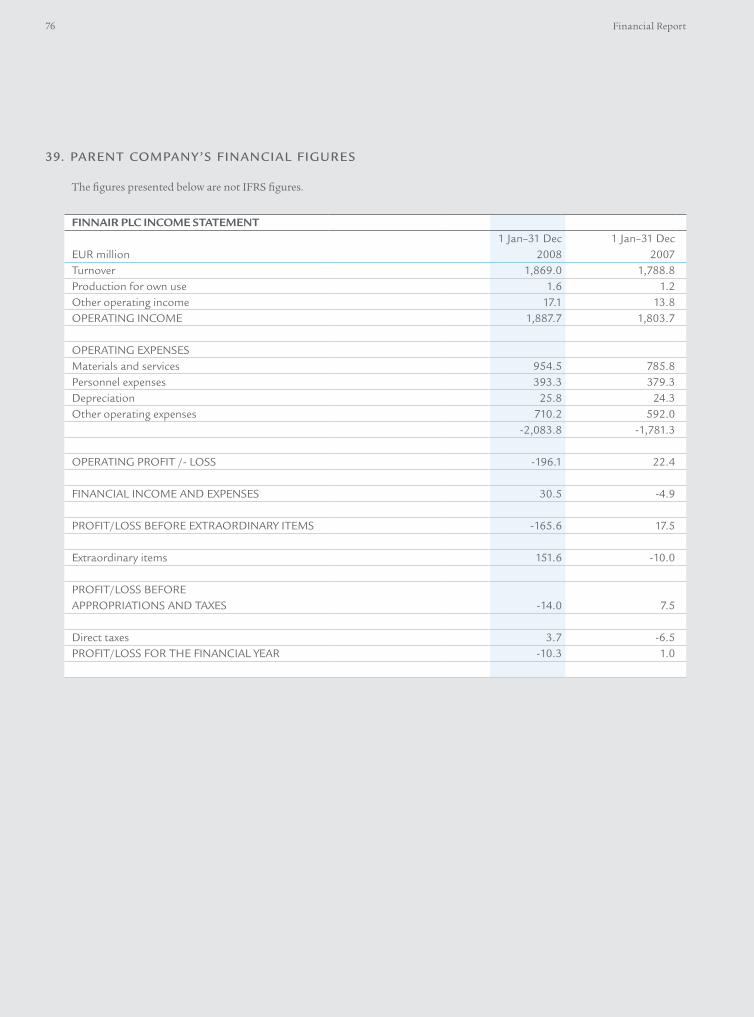
76 Financial Report
39. PArENT COMPANy’S fINANCIAL fIGurES
FINNAIR pLc INcome sTATemeNT
EUR million1 Jan–31 Dec
20081 Jan–31 Dec
2007Turnover 1,869.0 1,788.8Production for own use 1.6 1.2Other operating income 17.1 13.8OPERATING INCOME 1,887.7 1,803.7
OPERATING EXPENSESMaterials and services 954.5 785.8Personnel expenses 393.3 379.3Depreciation 25.8 24.3Other operating expenses 710.2 592.0
-2,083.8 -1,781.3
OPERATING PROFIT /- LOSS -196.1 22.4
FINANCIAL INCOME AND EXPENSES 30.5 -4.9
PROFIT/LOSS BEFORE EXTRAORDINARY ITEMS -165.6 17.5
Extraordinary items 151.6 -10.0
PROFIT/LOSS BEFORE APPROPRIATIONS AND TAXES -14.0 7.5
Direct taxes 3.7 -6.5PROFIT/LOSS FOR THE FINANCIAL YEAR -10.3 1.0
The figures presented below are not IFRS figures.
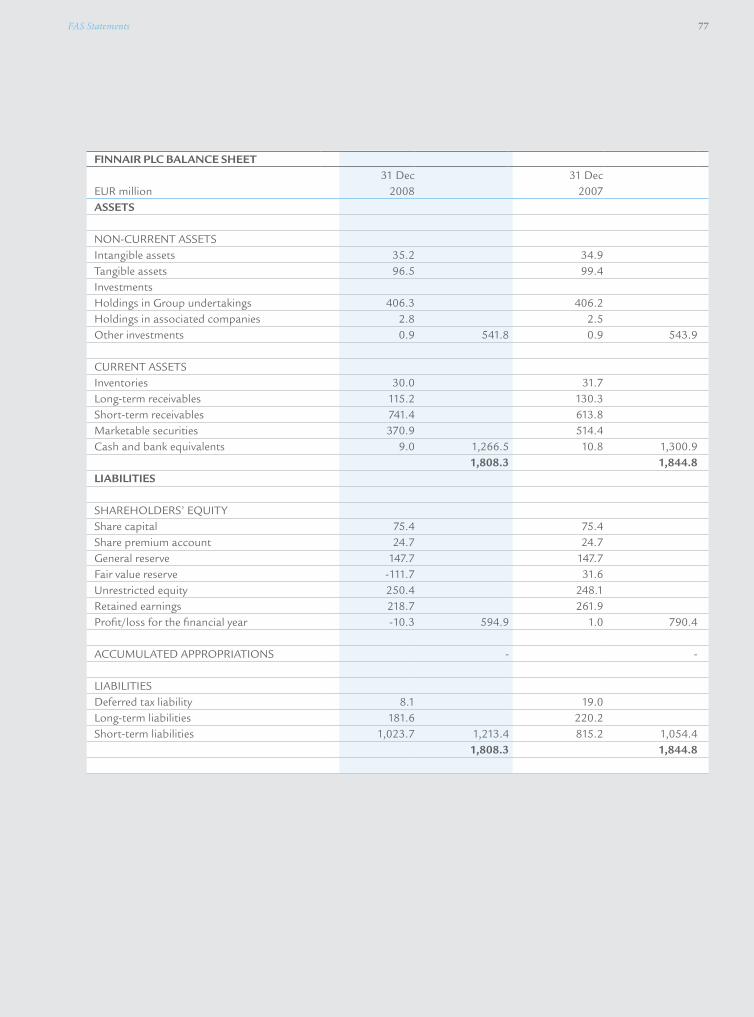
FINNAIR pLc bALANce sHeeT
EUR million31 Dec
200831 Dec
2007AsseTs
NON-CURRENT ASSETSIntangible assets 35.2 34.9Tangible assets 96.5 99.4InvestmentsHoldings in Group undertakings 406.3 406.2Holdings in associated companies 2.8 2.5Other investments 0.9 541.8 0.9 543.9
CURRENT ASSETSInventories 30.0 31.7Long-term receivables 115.2 130.3Short-term receivables 741.4 613.8Marketable securities 370.9 514.4Cash and bank equivalents 9.0 1,266.5 10.8 1,300.9
1,808.3 1,844.8LIAbILITIes
SHAREHOLDERS’ EQUITY Share capital 75.4 75.4Share premium account 24.7 24.7General reserve 147.7 147.7Fair value reserve -111.7 31.6Unrestricted equity 250.4 248.1Retained earnings 218.7 261.9Profit/loss for the financial year -10.3 594.9 1.0 790.4
ACCUMULATED APPROPRIATIONS - -
LIABILITIESDeferred tax liability 8.1 19.0Long-term liabilities 181.6 220.2Short-term liabilities 1,023.7 1,213.4 815.2 1,054.4
1,808.3 1,844.8
FAS Statements 77
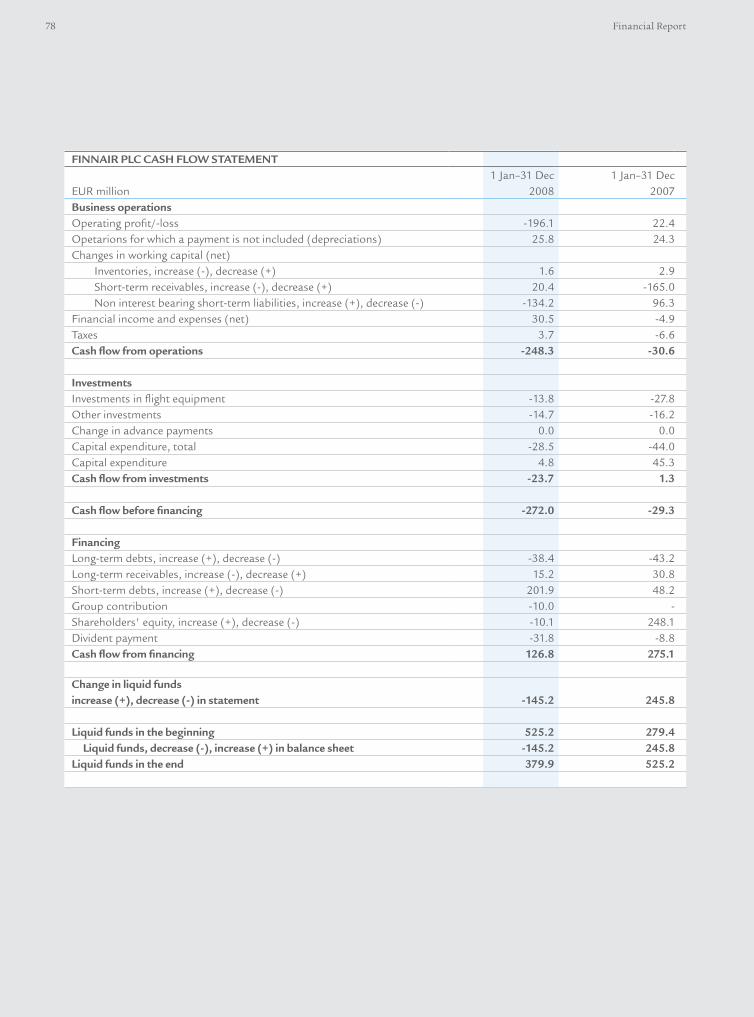
78 Financial Report
FINNAIR pLc cAsH FLoW sTATemeNT
EUR million1 Jan–31 Dec
20081 Jan–31 Dec
2007business operationsOperating profit/-loss -196.1 22.4Opetarions for which a payment is not included (depreciations) 25.8 24.3Changes in working capital (net)
Inventories, increase (-), decrease (+) 1.6 2.9 Short-term receivables, increase (-), decrease (+) 20.4 -165.0 Non interest bearing short-term liabilities, increase (+), decrease (-) -134.2 96.3
Financial income and expenses (net) 30.5 -4.9Taxes 3.7 -6.6cash flow from operations -248.3 -30.6
Investments Investments in flight equipment -13.8 -27.8Other investments -14.7 -16.2Change in advance payments 0.0 0.0Capital expenditure, total -28.5 -44.0Capital expenditure 4.8 45.3cash flow from investments -23.7 1.3
cash flow before financing -272.0 -29.3
FinancingLong-term debts, increase (+), decrease (-) -38.4 -43.2Long-term receivables, increase (-), decrease (+) 15.2 30.8Short-term debts, increase (+), decrease (-) 201.9 48.2Group contribution -10.0 -Shareholders' equity, increase (+), decrease (-) -10.1 248.1Divident payment -31.8 -8.8cash flow from financing 126.8 275.1
change in liquid fundsincrease (+), decrease (-) in statement -145.2 245.8
Liquid funds in the beginning 525.2 279.4Liquid funds, decrease (-), increase (+) in balance sheet -145.2 245.8
Liquid funds in the end 379.9 525.2
Board of Directors’ Proposal on the Dividend 79
Finnair Plc’s distributable equity according to the financial statements on 31 December 2008 amounts to 458,707,539.14 euros.
The Board of Directors proposes to the Annual General Meeting that no dividend shall be paid and the loss for the fiscal year to be transfer against retained earnings.
Board of Directors’ Proposal on the Dividend
Christoffer Taxell
Satu Huber
Veli Sundbäck
Sigurdur Helgason
Ursula Ranin
Signing of the Report of the Board of Directors and the Financial Statements
Helsinki, 4 February 2009
The Board of Directors of Finnair Plc
Kari Jordan
Markku Hyvärinen
Pekka Timonen
Jukka Hienonen President & CEO of Finnair Plc

80 Financial Report
Auditor’s Report
To the Annual General Meeting of Finnair Oyj
We have audited the accounting records, the financial statements, the report of the Board of Directors and the administration of Finnair Oyj for the year ended on 31 December, 2008. The financial statements comprise the consolidated balance sheet, income statement, cash flow statement, statement of changes in equity and notes to the consolidated financial statements, as well as the parent company’s bal-ance sheet, income statement, cash flow statement and notes to the financial statements.
Responsibility of the Board of Directors and the Managing Director The Board of Directors and the Managing Director are responsible for the preparation of the financial statements and the report of the Board of Directors and for the fair presentation of the consolidated financial statements in accordance with International Financial Reporting Standards (IFRS) as adopted by the EU, as well as for the fair presentation of the parent company’s financial statements and the report of the Board of Directors in accordance with laws and regulations governing the preparation of the financial statements and the report of the Board of Directors in Finland. The Board of Directors is responsible for the appropriate arrangement of the control of the company’s accounts and finances, and the Managing Director shall see to it that the accounts of the company are in compliance with the law and that its financial affairs have been arranged in a reliable manner.
Auditor’s ResponsibilityOur responsibility is to perform an audit in accordance with good auditing practice in Finland, and to express an opinion on the parent company’s financial statements, on the consolidated financial statements and on the report of the Board of Directors based on our audit. Good auditing practice requires that we comply with ethical requirements and plan and perform the audit to obtain reasonable assurance whether the financial statements and the report of the Board of Directors are free from material misstatement and whether the members of the Board of Directors of the parent company and the Managing Director have complied with the Limited Liability Companies Act.
An audit involves performing procedures to obtain audit evidence about the amounts and disclosures in the financial statements and the report of the Board of Directors. The procedures selected depend on the auditor’s judgment, including the assessment of the risks of material mis-statement of the financial statements, whether due to fraud or error. In making those risk assessments, the auditor considers internal control relevant to the entity’s preparation and fair presentation of the financial statements in order to design audit procedures that are appropriate in the circumstances. An audit also includes evaluating the appropriateness of accounting policies used and the reasonableness of accounting esti-mates made by management, as well as evaluating the overall presen-tation of the financial statements and the report of the Board of Directors.
The audit was performed in accordance with good auditing practice in Finland. We believe that the audit evidence we have obtained is sufficient and appropriate to provide a basis for our audit opinion.
Opinion on the Consolidated Financial StatementsIn our opinion, the consolidated financial statements give a true and fair view of the financial position, financial performance, and cash flows of the group in accordance with International Financial Reporting Standards (IFRS) as adopted by the EU.
Opinion on the Company’s Financial Statements and the Report of the Board of DirectorsIn our opinion, the financial statements and the report of the Board of Directors give a true and fair view of both the con-solidated and the parent company’s financial performance and financial position in accordance with the laws and reg-ulations governing the preparation of the financial statements and the report of the Board of Directors in Finland. The information in the report of the Board of Directors is consistent with the information in the financial statements.
The Members of the Board of Directors and the Managing Director of the parent company can be discharged from liability for the pe-riod audited by us.
Eero Suomela Authotised Public Accountant
Helsinki, 13 February 2009
Jyri HeikkinenAuthorised Public Accountant
PricewaterhouseCoopers Oy Authorised Public Accountants
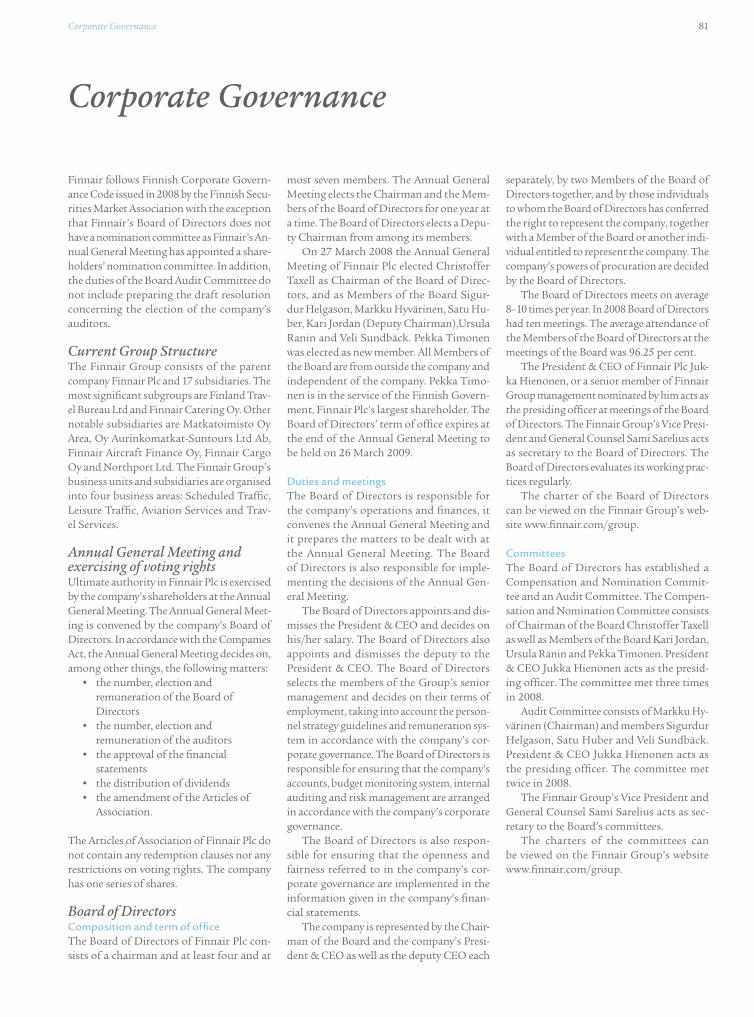
Corporate Governance 81
Corporate Governance
Finnair follows Finnish Corporate Govern-ance Code issued in 2008 by the Finnish Secu-rities Market Association with the exception that Finnair’s Board of Directors does not have a nomination committee as Finnair’s An-nual General Meeting has appointed a share-holders’ nomination committee. In addition, the duties of the Board Audit Committee do not include preparing the draft resolution concerning the election of the company’s auditors.
Current Group StructureThe Finnair Group consists of the parent company Finnair Plc and 17 subsidiaries. The most significant subgroups are Finland Trav-el Bureau Ltd and Finnair Catering Oy. Other notable subsidiaries are Matkatoimisto Oy Area, Oy Aurinkomatkat-Suntours Ltd Ab, Finnair Aircraft Finance Oy, Finnair Cargo Oy and Northport Ltd. The Finnair Group’s business units and subsidiaries are organised into four business areas: Scheduled Traffic, Leisure Traffic, Aviation Services and Trav-el Services.
Annual General Meeting and exercising of voting rightsUltimate authority in Finnair Plc is exercised by the company’s shareholders at the Annual General Meeting. The Annual General Meet-ing is convened by the company’s Board of Directors. In accordance with the Companies Act, the Annual General Meeting decides on, among other things, the following matters:
• thenumber,electionand remuneration of the Board of Directors • thenumber,electionand remuneration of the auditors • theapprovalofthefinancial statements • thedistributionofdividends• theamendmentoftheArticlesof Association.
The Articles of Association of Finnair Plc do not contain any redemption clauses nor any restrictions on voting rights. The company has one series of shares.
Board of DirectorsComposition and term of office The Board of Directors of Finnair Plc con-sists of a chairman and at least four and at
most seven members. The Annual General Meeting elects the Chairman and the Mem-bers of the Board of Directors for one year at a time. The Board of Directors elects a Depu-ty Chairman from among its members.
On 27 March 2008 the Annual General Meeting of Finnair Plc elected Christoffer Taxell as Chairman of the Board of Direc-tors, and as Members of the Board Sigur-dur Helgason, Markku Hyvärinen, Satu Hu-ber, Kari Jordan (Deputy Chairman),Ursula Ranin and Veli Sundbäck. Pekka Timonen was elected as new member. All Members of the Board are from outside the company and independent of the company. Pekka Timo-nen is in the service of the Finnish Govern-ment, Finnair Plc’s largest shareholder. The Board of Directors’ term of office expires at the end of the Annual General Meeting to be held on 26 March 2009.
Duties and meetings The Board of Directors is responsible for the company’s operations and finances, it convenes the Annual General Meeting and it prepares the matters to be dealt with at the Annual General Meeting. The Board of Directors is also responsible for imple-menting the decisions of the Annual Gen-eral Meeting.
The Board of Directors appoints and dis-misses the President & CEO and decides on his/her salary. The Board of Directors also appoints and dismisses the deputy to the President & CEO. The Board of Directors selects the members of the Group’s senior management and decides on their terms of employment, taking into account the person-nel strategy guidelines and remuneration sys-tem in accordance with the company’s cor-porate governance. The Board of Directors is responsible for ensuring that the company’s accounts, budget monitoring system, internal auditing and risk management are arranged in accordance with the company’s corporate governance.
The Board of Directors is also respon-sible for ensuring that the openness and fairness referred to in the company’s cor-porate governance are implemented in the information given in the company’s finan-cial statements.
The company is represented by the Chair-man of the Board and the company’s Presi-dent & CEO as well as the deputy CEO each
separately, by two Members of the Board of Directors together, and by those individuals to whom the Board of Directors has conferred the right to represent the company, together with a Member of the Board or another indi-vidual entitled to represent the company. The company’s powers of procuration are decided by the Board of Directors.
The Board of Directors meets on average 8–10 times per year. In 2008 Board of Directors had ten meetings. The average attendance of the Members of the Board of Directors at the meetings of the Board was 96.25 per cent.
The President & CEO of Finnair Plc Juk-ka Hienonen, or a senior member of Finnair Group management nominated by him acts as the presiding officer at meetings of the Board of Directors. The Finnair Group’s Vice Presi-dent and General Counsel Sami Sarelius acts as secretary to the Board of Directors. The Board of Directors evaluates its working prac-tices regularly.
The charter of the Board of Directors can be viewed on the Finnair Group’s web-site www. finnair.com/group.
Committees The Board of Directors has established a Compensation and Nomination Commit-tee and an Audit Committee. The Compen-sation and Nomination Committee consists of Chairman of the Board Christoffer Taxell as well as Members of the Board Kari Jordan, Ursula Ranin and Pekka Timonen. President & CEO Jukka Hienonen acts as the presid-ing officer. The committee met three times in 2008.
Audit Committee consists of Markku Hy-värinen (Chairman) and members Sigurdur Helgason, Satu Huber and Veli Sundbäck. President & CEO Jukka Hienonen acts as the presiding officer. The committee met twice in 2008.
The Finnair Group’s Vice President and General Counsel Sami Sarelius acts as sec-retary to the Board’s committees.
The charters of the committees can be viewed on the Finnair Group’s website www. finnair.com/group.
82 Financial Report
remuneration and other benefits The monthly remuneration and attendance allowances decided by the Annual General Meeting for Members of the Board of Direc-tors in 2008 were:
• Chairman’sannual remuneration 61,200 euros • DeputyChairman’sannual remuneration 32,400 euros• MemberoftheBoard’sannual remuneration 30,000 euros • Meetingcompensationtoamember
residing in Finland 600 euros and to a member residing abroad 1200 euros per meeting of the Board of Directors or its committee.
The Members of the Board of Directors are entitled to a daily allowance and compensa-tion for travel expenses in accordance with Finnair Plc’s general travel rules. In addition, Members of the Board of Directors have a limited right to use ID tickets in accordance with Finnair Plc’s ID ticket rules.
In 2008, the members of Finnair Plc’s Board of Directors were paid monthly re-muneration and attendance allowances to-talling 335,452,79 euros in 2008.
President & CEO and Deputy CEO Finnair Plc has a President & CEO, whose task is to manage the company’s operations according to guidelines and instructions issued by the Board of Directors. In 2008 Finnair Plc’s President & CEO was Jukka Hienonen and the Deputy CEO was Hen-rik Arle.
Henrik Arle retired 31 December 2008. Lasse Heinonen, the CFO of Finnair Group, was appointed Deputy CEO as of 13 Janu-ary 2009.
In 2008, President & CEO Jukka Hienon-en was paid a salary of 581,843.04 euros and fringe benefits of 38,598.51 euros as well as shares and a payment of 441,092.47 euros based on the share-based incentive scheme in 2007. Deputy CEO Henrik Arle was paid a salary of 373,101.68 euros and fringe ben-efits of 10,875.00 euros as well as shares and a payment of 252,043.61 euros based on the share-based incentive scheme in 2007.
The President & CEO and the Deputy CEO have the right to retire at the 60 years of age on a full pension of 60 per cent of pensionable salary. The President & CEO’s and the Deputy CEO’s service contracts may be terminated with a period of notice of six months. In addition to salary for the period of notice, they are entitled to severance com-pensation equivalent to 12 months’ salary if
their employment is terminated for reasons independent of them.
Changes in the company’s management in 2008Deputy CEO and EVP Scheduled Traffic Henrik Arle retired 31 December 2008. In conjunction with the retirement some re-visions were made in management respon-sibilities and the organisation of Finnair Group.
Lasse Heinonen, the CFO of Finnair Group, was appointed Deputy CEO as of 13 January 2009. Heinonen continues as the CFO of the Group. In addition to economics and finance, the ground handling company Northport Ltd, Finnair Catering Oy and Finnair Technical Services, which all belong to Aviation Services business area, report to Lasse Heinonen. Also Finnair Aircraft Finance Ltd and Finnair Facilities Manage-ment Oy report to Heinonen.
As of 1 January 2009 Finnair’s Presi-dent & CEO Jukka Hienonen leads the Scheduled Passenger Traffic organisation together with the business unit’s manage-ment group. SVP Flight Operations Veikko Sievänen serves as the Accountable Manager referred to in the Airline Operators Certifi-cate (AOC). Sievänen will also be a member of the Group’s Executive Board. Operation-al risk management, which was previously under the authority of Henrik Arle, will now be under the President & CEO.
SVP for Public Affairs and Corporate Communications Christer Haglund was ap-pointed member of Finnair Plc’s Executive Board as of 1 March 2008.
Finnair Plc’s Executive Board Finnair Plc’s Executive Board meets approxi-mately 20 times a year and its tasks include the handling of Group-wide development projects as well as Group-level principles and procedures. In addition, the Execu-tive Board is informed about, among oth-er things, the business plans of the Group and sector companies, financial perform-ance, and matters to be dealt with by Finnair Plc’s Board of Directors, in the preparation of which it participates. Finnair Plc’s Ex-ecutive Board acts as a risk management steering group.
The Executive Board comprises Presi-dent & CEO Jukka Hienonen (Chairman) and members SVP for Public Affairs and Corporate Communications Christer Haglund, Chief Financial Officer and Dep-uty CEO Lasse Heinonen, SVP Human Re-sources Anssi Komulainen, SVP Commer-cial Division Mika Perho, SVP Flight Opera-
tions Veikko Sievänen, SVP Finnair Techni-cal Services Kimmo Soini, and SVP Leisure Traffic and Travel Services Kaisa Vikkula.
Finnair Group’s Board of ManagementThe Finnair Group’s Board of Management comprises, in addition to members of the Executive Board, Northport Ltd’s Manag-ing Director Jukka Hämäläinen, Finnair Catering Oy’s Managing Director Kristi-na Inkiläinen and Managing Director of Finnair cargo companies Antero Lahtinen as well as personnel representatives, name-ly Purser Mauri Koskenniemi, Chairman of the Finnish Flight Attendants’ Association SLSY, Purser Tiina Sillankorva, Chairman of the Finnair Senior White Collar Workers As-sociation, Systems Analyst Timo Kettunen, Chairman of the Finnish Flight Workers As-sociation, and Juhani Sinisalo, Representa-tive of Finnair Personnel Fund.
The Board of Management is informed about, among other things, the business plans and financial performance of the Group and sector companies. The Board of Management prepares, among other things, matters to be decided by the Board of Di-rectors affecting personnel as well as fleet and other fix asset related investments and projects. The Board of Management decides within the limits set out by the Board of Di-rectors also on investments and projects. The Board of Management meets approximately ten times per year.
Corporate Governance of SubsidiariesThe Members of the Boards of Directors of the significant subsidiaries are selected from individuals belonging to Finnair Group management and from representatives pro-posed by personnel groups. The key tasks of the Boards of Directors of subsidiaries are strategy preparation, approving the op-erational plan and budget, and deciding on investments and commitments within the limits of instructions issued by the Board of Directors of Finnair Plc. Share-Based Incentive for Key IndividualsMatters relating to the remuneration scheme of key individuals are prepared in the Board of Directors’ Compensation and Nomina-tion Committee. Decisions are made by the company’s Board of Directors. Manage-ment incentive bonuses are determined an-nually based on the company’s earnings per share, return on capital employed, business-unit quality and process indicators as well

Corporate Governance 83
as personal performance appraisals. The maximum bonus can be equivalent to four months’ basic salary.
Around 70 key individuals of the Group belonged to the 2007–2009 share-based in-sentive scheme. The rewards of the scheme are based on return on capital employed and earnings per share, whose target levels are de-cided annually by the Board of Directors. The shares are subject to sale restrictions.
Auditors and MonitoringAuditors The company has two auditors elected by the Annual General Meeting. The auditors’ term of office ends at the conclusion of the Annual General Meeting following the meeting of their election. At least one of the auditors must be an authorised public ac-countant or an authorised public account-ing firm approved by the Central Chamber of Commerce.
Finnair Plc’s Annual General Meeting in 2008 elected two auditors for the company: Authorised Public Accountants Pricewater-houseCoopers Oy, Principal Auditor APA Eero Suomela and APA Jyri Heikkinen. APA Tuomas Honkamäki and APA Timo Takalo of PricewaterhouseCoopers Oy were elect-ed deputy auditors. The auditors of Finnair Group subsidiaries are mainly Pricewater-houseCoopers auditing firms or auditors employed by them.
Auditing fees paid to auditors in Finland and abroad totalled 188,000 euros in 2008. Finnair Plc also paid auditors 120,000 euros for services (e.g. tax advice) unrelated to the statutory audit of the accounts.
Monitoring and reporting system The principal task of the statutory audit is to verify that the financial statements give ac-curate and sufficient information about the Group’s result and financial position for the financial year. The auditors report their find-ings to the Board of Directors at least once per year and submit an auditors’ report to company’s shareholders in connection with the annual financial statements.
Finnair Plc’s Executive Board, which acts as a risk management steering group, assess-es and safeguards the sufficiency, appropri-ateness and effectiveness of the Group’s risk management, monitoring and management processes. Financial Risk Steering Group assesses and anticipates financial risks and steers implementation of financing policy of the Group.
The Board of Directors of Finnair Plc has approved principles of internal moni-toring, which are applied within the Group.
Internal Auditing is responsible for fulfilling the monitoring and auditing obligation laid down in the Companies Act.
Internal auditing work is employed to ver-ify the integrity of transactions and the accu-racy of information in internal and external accounting, and to confirm that controls are exercised effectively, property is maintained, and operations are conducted appropriately in accordance with the Group’s objectives. Internal Auditing also participates in the au-diting of Finnair Plc subsidiaries’ accounts in collaboration with External Auditing. The Internal Auditing priorities are determined in accordance with the Group’s risk manage-ment strategy.
The fulfilment of financial targets is mon-itored by a system of Group-wide reporting. The reporting encompasses realised data and up-to-date forecasts for a rolling 12-month period. The accumulation of financial added value is monitored monthly in an internal reporting process. The Group’s traffic per-formance is published in a monthly Stock Exchange Bulletin.
Risks arising from operations in relation to property, interruption, accident and lia-bility have been covered by appropriate in-surances.
Governing provisions Finnair Plc adheres to applicable legisla-tion, to the regulations, issued under such legislation and to the company’s Articles of Association. Furthermore, in its activities Finnair Plc complies with Corporate Gover- nance Code of listed companies, issued in 2008, as well as insider rules.
Company insidersThe Finnair Group’s insiders are divided into permanent insiders and temporary insiders in accordance with the Securities Market Act.
Permanent insiders are further divided into those entered in a public insider register and those entered in a non-public company-specific insider register.
Temporary insiders are individuals who receive insider information during the per-formance of some assignment (project). These individuals are entered into a non-public company-specific insider register, namely a project-specific register.
Finnair Plc’s permanent insiders include members of the Finnair Plc’s Board of Direc-tors, the President & CEO and his Deputy, the direct subordinates of the President & CEO, as well as the auditors, including the auditing firm’s auditor with chief responsi-bility for the company.
Permanent company-specific insiders in-clude the personnel representatives partic-ipating in the work of Finnair’s Executive Board; the managing directors of Amadeus Finland Oy, Matkatoimisto Oy Area, Fin-land Travel Bureau Ltd, Oy Aurinkomatkat - Suntours Ltd Ab, FTS Financial Services Oy, Finnair Facilities Management Oy and Finnair Aircraft Finance Ltd; the secretaries of Finnair’s CEO and CFO; Finnair’s law-yers and internal auditors; Finnair’s financial communications staff as well as the Econom-ics and Finance Department’s vice presidents, assistant vice presidents, finance managers, economics managers, and the financial man-agement and supervision planning manag-er; the vice presidents of Finnair’s Commer-cial Division and the Vice President Leisure Flights; the department managers dealing with employment affairs and HR services; and other individuals separately designated by Finnair’s CEO for entry in the register.
The Board of Directors of Finnair Plc has approved Finnair Plc’s insider guidelines, which contain guidelines for permanent and project-work insiders and specify the organi-sation and procedures of the company’s insid-er controls. The company’s insider guidelines have been distributed to all insiders.
The Legal Affairs Department is responsi-ble for the content of the insider guidelines. Compliance with the insider guidelines is monitored by the Economics and Finance De-partment. The company operates a restriction on trading, which applies to insiders’ trading in the company shares or in securities grant-ing entitlement to shares for 30 days before the declaration of financial results.
Finnair Plc’s insider register is maintained by Euroclear Finland Ltd. The up-to-date details of public insiders’ share and option holdings can be viewed at Euroclear Finland premises in Helsinki, Finland at the address Urho Kekkosen katu 5C and on Finnair’s web-site at the address www. finnair.com/group.
Corporate Governance updateThe Finnair Corporate Governance sec-tion is updated regularly and can be viewed on the company’s website at the address www. finnair.com/group. Finnair Plc’s web-site is published in Finnish and English, and partly in Swedish. The printed and electronic Annual Review 2008 are published in Finn-ish, Swedish and English, and the Financial Report in Finnish and English. Interim re-ports are published in Finnish, Swedish and English.
84 Financial Report
Risk Management in Finnair
Risk management in Finnair is part of the Group’s management activity and is direct-ed primarily at risks that threaten the fulfil-ment of the Group’s short- and long-term business objectives. To exploit business op-portunities, Finnair is prepared to assume managed and considered risks, taking the company’s risk-bearing capacity into ac-count. In flight safety matters, Finnair’s objective is to minimise risks.
In Finnair, risk management means a sys-tematic and predictive way of recognising, analysing and managing the opportunities and threats associated with operations. Con-tinuity plans have been prepared in case of the realisation of risks, particularly as far as strategic and significant financial risks are concerned.
The Board of Directors and the President & CEO are responsible for the Group’s risk management strategy and principles as well as for the management of risks that threat-en the fulfilment of strategic objectives. The President & CEO is responsible for ensuring that risk management is in other respects ap-propriately organised. The Senior Vice Presi-dents of the business units and the Manag-ing Directors of subsidiaries are responsible for risk management in their own areas of responsibility.
Organisation of risk management Finnair Plc’s Executive Board, which acts as a risk management steering group, assess-es and directs risk management in Finnair Group. The company’s internal auditing coordinates the reporting of risk manage-ment as well as adherence to a specified op-erating model.
The Operational Risk Management De-partment, which operates under Finnair Plc’s Quality Manager, as specified in the Airline Operator’s Licence, regularly audits and as-sesses the company’s own and subcontrac-tors’ actions that impact on flight safety.
Finnair’s quality system is IOSA certi-fied*. The IOSA programme is an evaluation method, required by IATA, for airlines’ op-erational management and monitoring sys-tems. Auditing based on IOSA certification assesses whether the airline’s quality control systems fulfil both IOSA and international avation regulation standards.
Management of risks relating to loss or
damage is divided into two main areas: flight safety and corporate security. Development work in these areas is coordinated by the flight safety department and the corporate security unit.
Operating environment risks Demand and the price level of passenger and cargo traffic have been influenced most by market-area economic development, eco-nomic cycles, competition in the industry as well as various unexpected events, such as terrorism, environmental accidents and epidemics. The company has plans of action to minimise the operational impacts arising to air transport from various external dis-ruptive factors.
The current trend clearly indicates that competitiveness in the air transport sector depends on how flexibly the company can react and adapt to surprising events, changes in demand and a constantly changing com-petitive environment.
A critical factor for operational flexibility is the adjustment of fixed costs to fluctua-tions in demand. The company’s ability to re-act quickly in adjusting capacity, routes and costs to correspond to changing demand and economic and security conditions is also an essential factor in maintaining the compa-ny’s profitability. In recent years Finnair has implemented, and has under way, a number of projects that have increased structural flexibility.
Finnair manages the residual value risk related to aircraft capacity and ownership by acquiring nearly half of the aircraft be-longing to its fleet through operating lease agreements of different durations. The leas-ing of aircraft provides an opportunity for the flexible dimensioning of capacity in the short and long term.
Market riskThe air transport business is sensitive to both cyclical and seasonal changes. Competition in the sector is intense and the market situ-ation is continually changing, which has re-duced average ticket prices over an extended period. Airlines are cutting their prices in order to increase volumes, achieve sufficient cash flow and maintain market share.
Finnair constantly makes market situa-tion analyses and actively monitors its own
reservation intake as well as competitors’ changes in pricing and capacity. Finnair is able to react quickly to pricing changes that take place in the market by utilising its ad-vanced optimisation systems.
Finnair is growing in markets where it is not as well-known a brand as in its traditional domestic market. This presents challenges for marketing communications in highlight-ing Finnair’s competitive assets.
A change of one percentage point in the average price level of scheduled passenger traffic services affects the Group’s operating profit by more than 15 million euros. Corre-spondingly a change of one percentage point in the load factor of scheduled passenger traffic services also affects the Group’s oper-ating profit by more than 15 million euros.
Operational risk Finnair’s operations are based on a rigor-ous flight safety culture, which is maintained through continuous and long-term flight safety work. The company has prepared an operational safety policy, for which the com-pany’s Vice President, Flight Permits and Operating Licences is responsible for im-plementing. Every subcontractor working directly or indirectly with the Group’s em-ployees or flight operations must undertake to comply with the policy.
When operational decisions are made, flight safety always has the highest priority in relation to other factors that influence decision-making. Flight safety is an inte-gral mechanism of all activities as well as a required way of operating not only for the company’s own personnel, but also for sub-contractors.
The main principle of flight safety work is non-punitive reporting of deviations in the way intended by the Aviation Act and the company’s guidelines. The purpose of reporting is to find reasons, not to assign blame, as well as to identify predictively the risks of the future. The company, howev-er, does not tolerate wilful acts contrary to guidelines, methods or prescribed working practices. Decision-making not directly re-lated to operations must also support the company’s objective of achieving and main-taining a high level of flight safety.
Risk Management 85
Reliability of flight operationsReliability is an essential prerequisite for op-erating successfully in the airline industry. The air transport business, however, is ex-posed to various disruptive factors, such as delays, exceptional weather conditions and strikes. As well as their impact on operation-al and service quality, air traffic delays also increase costs.
Finnair invests continually in the over-all quality and punctuality of its operation-al activities. The Network Control Centre (NCC) brings together all the critical parties for flight operations, thus enabling the most effective overall solutions to be implement-ed. Finnair Technical’s service punctuality and diverse expertise as well as its detailed specification of technical functions ensure the reliability of flight operations.
Furthermore, in operational activities the contribution of partners and interest groups is essential. Finnair monitors the quali-ty of external suppliers within the frame-work of standards specified in advance and through regulations prescribed for flight operations.
Finnair is one of the most punctual air-line in Europe.
In relation to Asian traffic, the transfer of passengers and goods from one flight to an-other at Helsinki-Vantaa Airport is increas-ing, in the short term, the risk of delays, ow-ing to the airport’s space restrictions. The completion of a new terminal extension in autumn 2009 will help the situation con-siderably.
Authorities and the environment An airline registered in the European Union can operate freely within the entire area of the Union. To date Finland, like other European countries, has been accustomed to negotiat-ing bilateral operating agreements with coun-tries outside the European Union.
In future, regulation at the European Un-ion level will bring the negotiation of avia-tion agreements between countries inside and outside the European Union under the European Commission. Existing bilateral operating agreements will remain in force in the new situation.
As a negotiating party the Union is stronger than an individual country and thus can strengthen the position of Euro-
pean airlines when negotiating operating rights. In some cases this may have an ad-verse impact on Finnair and may weaken the company’s competitive position in relation to other European airlines. Finnair will ac-tively strive to influence the parties who ne-gotiate operating rights in order to safeguard its interests.
European Union has decided to include air transport within carbon dioxide emis-sions trading from 2012. Aircraft transport within the EU will be subject to emissions trading as will flights departing from and arriving in the EU. This will have a particu-lar impact on the intercontinental competi-tive situation. If other non-EU countries do not become part of the emissions trading scheme, this will give a competitive advan-tage to airlines whose hubs are outside the EU. Companies will be able to offer market routing changes such that emissions trad-ing will burden them less than the EU air-lines or not at all. A trade war may also be possible if non-EU countries do not accept the EU emissions trading rules.
Finnair has been investing in environ-mental matters for a long time. Finnair ac-tively monitors the effects of the company’s operations on energy consumption, emis-sions, amounts of waste and noise values. Finnair publishes annually a separate En-vironmental Report, which includes meas-ures and key figures for the assessment of environmental efficiency.
The company has a VP, Sustainable De-velopment whose task is to promote the re-alisation of Finnair’s environmental goals in the Group’s business operations, such that Finnair can be among the leading airlines in environmental activities.Official and interest group cooperation is important in order to be fully aware of future legislation and in-terest group requirements.
Risk of loss or damage Risk management in this area includes, for example, risks to flights, people, informa-tion, property and the environment as well as liability and loss-of-business risks, and insurance cover. The priority in the man-agement of risks relating to loss or damage is on risk prevention, but the company pre-pares for any possible emergence of risks with plans, effective situation-management pre-
86 Financial Report
paredness and insurance. Aircraft and other significant fixed assets are comprehensively insured at fair value. The amount of insur-ance cover for aviation liability risks exceeds the minimum levels required by law.
Accident riskThe management of occupational health and safety is diverse and challenging, because the Finnair Group’s operations are spread across many fields of business. Occupational safety risks are known to be high in precisely those areas – services, food industry, heavy aircraft maintenance, warehousing and transport – of which Finnair’s operations principally consist.
The development of occupational safety is long-term work, and Finnair’s goal is to minimise the number of accidents. Devel-oping occupational safety is part of the eve-ryday activity of line organisation and the responsibility of every employee.
Means of improving occupational safety include identifying and evaluating occupa-tional health and safety hazards in the work-place and preventing accidents and hazard-ous situations. All reported risk situations and accidents are investigated and lessons learned in order to develop safer working methods.
Telecommunications and information technology riskThe diverse use of information technology in support of operations has increased and there is greater emphasis on importance the availability of information. Systems vulner-ability and the development of new global threats represent a risk factor in a networked operating environment. Finnair is continu-ally developing its information security and situation-management preparedness for seri-ous disruptions to information systems and telecommunications. Such preparations have a direct impact on information technology and data security costs.
Developing information system solutions and the IT environment requires continu-ous investment. Careful selection of exter-nal partners in IT solutions also reduces the technology risk.
The coordination of the Group’s infor-mation system architecture as well as its IT purchases and strategies has been centralised
in the Group’s information management de-partment. This brings synergy benefits and improves cost-efficiency.
Principles of financial risk managementThe nature of the Finnair Group’s business operations exposes the company to foreign exchange, interest rate, credit and liquid-ity, and fuel price risks. The policy of the Group is to minimise the negative effect of such risks on cash flow, financial perform-ance and equity.
The management of financial risks is based on the risk management policy ap-proved by the Board of Directors, which spec-ifies the minimum and maximum levels per-mitted for each type of risk. Financial risk management is directed and supervised by the Financial Risk Steering Group. The im-plementation of financial risk management practice has been centralised in the Finnair Group’s Finance Department.
In its management of foreign exchange, interest rate and jet fuel positions the compa-ny uses different derivative instruments, such as forward contracts, swaps and options.
Financial risks have been described in more detail in Note 31 of the Notes to the Financial Statements.
*IOSA = IATA Operational Safety Audit IATA = The International Air Transport Association

Stock Exchange Releases 87
Stock Exchange Releases in 2008
2 JAN 2008 A significant maintenance contract for Finnair Technical Services from Aeroflot Cargo
4 JAN 2008 Finnair Group’s last ATR turboprop aircraft sold
4 JAN 2008 Finnair Plc decides share buy-back
8 JAN 2008 Finnair traffic grew 16.2 percent last year
4 FEB 2008 Finnair’s long-haul fleet continues to grow
5 FEB 2008 Finnair Group Financial Statement 1 January–31 December 2007, Strong cash flow and solid balance sheet facilitate future investments
7 FEB 2008 The year is off with growth in Asian traffic
21 FEB 2008 Finnair plans flights to Yekaterinburg – more flights to Moscow and St. Petersburg
22 FEB 2008 Finnair Leisure Flights leases an Airbus A330-200 aircraft for Thailand Leisure Flights in winter season 2008/2009
25 FEB 2008 Notice of the Annual Shareholders’ Meeting 2008
28 FEB 2008 Jaana Tammisto appointed Managing Director of Finland Travel Bureau
29 FEB 2008 Finnair to acquire three additional Embraer aircraft
7 MAR 2008 Appointments in Finnair Corporate Communications
10 MAR 2008 Finnair’s Annual Report 2007 has been published
10 MAR 2008 India engine for Finnair growth
27 MAR 2008 Guidance at Finnair Annual General Meeting: Operational result for first half of year expected to remain at last year’s level
27 MAR 2008 Decisions of Finnair Plc’s Annual General Meeting 2008
31 MAR 2008 Announcement pursuant to securities markets act chapter 2, section 10
9 APR 2008 Mexicana to join oneworld alliance
10 APR 2008 India drives Finnair traffic growth
11 APR 2008 Finnair sells six Boeing MD-80 aircraft
25 APR 2008 Finnair does not accept Alitalia subsidies
29 APR 2008 Finnair group interim report 1 January–31 March 2008, Financial condition strong, challenging terrain ahead
30 APR 2008 Finnair sold and leased back two Embraer jet aircraft
8 MAY 2008 Finnair’s load factors decreased, average prices improved
9 MAY 2008 Disposal of own shares
26 MAY 2008 Expensive oil and slower growth in demand will weaken Finnair’s result
27 MAY 2008 Announcement pursuant to securities act chapter 2, section 9
3 JUNE 2008 Finnair pilots’ collective labour agreement negotiations end without results
10 JUNE 2008 Finnair’s Scheduled Traffic grows, but at clearly lower load factors

88 Financial Report
12 JUNE 2008 Finnair to begin negotiations with personnel brought on by fuel crisis and drop in demand
19 JUNE 2008 Temporary agreement for Finnair Pilots
1 JULY 2008 Finnair Increases long-haul connections for winter
8 JULY 2008 Finnair’s load factors down
7 AUG 2008 Finnair traffic grew 6.5 per cent
8 AUG 2008 Finnair Group Interim Report 1 January–30 June 2008, Operational result weakened, second-half may be loss-making
9 SEPT 2008 Finnair’s passenger load factors up
12 SEPT 2008 Finnair to open route to Istanbul
16 SEPT 2008 Finnair’s statutory employer-employee negotiations did not reach an agreement on savings
26 SEPT 2008 Finnair daily to Tokyo in 2010
6 OCT 2008 Finnish Competition Authority approved Aircraft Maintenance joint venture
9 OCT 2008 Finnair’s load factors were up, average ticket prices down
9 OCT 2008 Finnair Leisure Flights directly to Thailand ensured
31 OCT 2008 Finnair Group Interim Report 1 January–30 September 2008, Weak third-quarter result
10 NOV 2008 Finnair’s Asian traffic continues to grow
20 NOV 2008 Finnair Plc shareholders’ nomination committee
25 NOV 2008 Finnair updates cost-cutting programme in Cargo Operations
3 DEC 2008 Finnair assumes special responsibility for its Thailand passengers
9 DEC 2008 Finnair’s traffic statistics will be released today at 2 p.m.
9 DEC 2008 Finnair’s Scheduled Traffic load factors rose, price levels continued to fall
9 DEC 2008 Finnair’s financial reporting schedule for 2009
17 DEC 2008 Finnair renews Scheduled Traffic organization
All Stock Exchange Releases can be found on the Finnair Group website www. finnair.com/group.Stock Exchange Releases relating to the purchase of own shares can be found at the same address.
Analysts 89
ABN Amro, LondonAndrew Lobbenberg
Carnegie Investment Bank AB, StockholmErik Gustafsson
Danske Markets/Danske Bank, helsinkiPanu Laitinmäki
eQ Bank Ltd., helsinkiBengt Dahlström
Evli Bank, helsinkiTuomo Kangasaho
Exane/BNP Paribas, LondonGeoff van Klaveren
fIM, helsinkiJaakko Tyrväinen
Goldman Sachs, LondonJulia Winarso
handelsbanken, helsinkiPekka Mikkonen
Pohjola Bank, helsinkiJari Räisänen
SEB Enskilda, helsinkiJutta Rahikainen
Standard & Poor’s, LondonVirginie Vacca
uBS, LondonTim Marshall
The brokerage firms analysing Finnair equity
90 Financial Report
Annual general meetingThe Annual General Meeting of Finnair Plc will be held on 26 March 2009 at 3 pm at the Helsinki Fair Centre, Messuaukio 1, Congress Wing Entrance, Hall C1. Notice of attendance at the Annual General Meeting (AGM) must be given at the latest by 4pm on 24 March 2009. Notice of attendance can be given through Finnair’s website at www. finnair.com/agm, by post to the address Finnair Plc, Registry of Shareholders, HEL-AAC/5, FI-01053 Finnair, by fax to +358 9 818 1662, by telephone from Monday to Friday between 9am-4pm GMT to +358 9 818 7637 or by e-mail to agm@ finnair.com. Letters, faxes or e-mails re-garding notice of attendance must have arrived before the pe-riod of notice of attendance ends.
Each shareholder who is registered on 16 March 2009 in the Company’s register of shareholders maintained by the Euroclear Finland Ltd or who on 16 March 2009 is temporarily entered in the register of shareholders has the right to participate in the AGM. Shareholders whose shares have not been transferred to the book-entry system are not entitled to attend the AGM.
AGM 2009 – Important dates16 March 2009 Record date 24 March 2009 Last day to give notice of attendance26 March 2009 AGM date
Board of directors’ proposal on the dividendAccording to the financial statements on 31 December 2008, the distributable equity of Finnair Plc amounts to 458.7 million euros. The Board of Directors proposes to the Annual General Meeting that no dividend shall be distributed for 2008.
Information for shareholders
financial informationIn 2009, interim reports will be published in Finnish, Swedish and English:28 April 2009 at 9 am Q1-2009, 1 Jan–31 March 20097 August 2009 at 9 am Q2-2009, 1 Jan–30 June 200929 October 2009 at 9 am Q3-2009, 1 Jan–30 Sept 2009
Ordering the annual reportThe Annual Review 2009 will be published in print in Finnish, Swedish and English and the Financial Report 2009 in Finnish and in English.
To order: tel: +358 9 818 4904, fax: +358 9 818 4401, e-mail: post@ finnair.com
Electronic Annual report and Electronic financial reportThe Electronic Annual Report will be published on the inter-net in Finnish, Swedish and English and Electronic Financial Report will be published in Finnish and English at the address www. finnair.com/group.
Change of addressShareholders are kindly requested to report changes of address to the custodian of their book-entry account.

92 Financial Report
Contact Information
Finnair OyjHelsinki-Vantaa AirportTietotie 11 AFI-01053 FinnairTel. +358 9 81 881www. f innair.comwww. f innair.com/group
Senior Vice President Corporate CommunicationsChrister HaglundTel. +358 9 818 4007christer.haglund@ f innair.f i
Investor RelationsTel. +358 9 818 4951Fax +358 9 818 4092investor.relations@ f innair.f i
Executive Vice President and CFOLasse HeinonenTel. +358 9 818 4950lasse.heinonen@ f innair.f i
Vice President Financial Communi-cations and Investor Relations Taneli HassinenTel. +358 9 818 4976taneli.hassinen@ f innair.f i