2011 Financial Report
72
SOLID RESULTS. WE DELIVER 2011 FINANCIAL REPORT
-
Upload
port-metro-vancouver -
Category
Documents
-
view
216 -
download
0
description
Port Metro Vancouver's 2011 Financial Report.
Transcript of 2011 Financial Report

solidResults.
WE DELIVER
2011 financial REPORT

capability to deliveR Results
10 Our approach to reporting
11 Organizational overview
12 Strategic planning
14 Capital planning
15 Borrowing and liquidity plan
Results and outlook
18 Consolidated summary
19 Unconsolidated results
24 Outlook and risks
consolidated financial statements
30 Independent auditor’s report
31 Consolidated financial statements
35 Notes to consolidated financial statements
ouR RepoRt
04 Financial messages
06 Business overview
We plan foR tHe lonG teRm, investinG in ouR sHaRed futuRe.
WE Plan anD inVEST TO SUPPORT SUSTainaBlE GROWTH fOR fUTURE GEnERaTiOnS WHilE EnSURinG OUR financial TaRGETS aRE MET TODaY.The Port is canada’s largest and north america’s most diversified, trading $75 billion in goods with more than 160 trading economies annually. as a port authority, we are committed to leading the continued growth of canada’s Pacific Gateway. as such, we pursue a forward-looking business strategy to seize opportunities as they arise, and reinvest profits: to continuously improve port facilities, infrastructure and services for users; to enhance our environmental programs; and to benefit our communities.
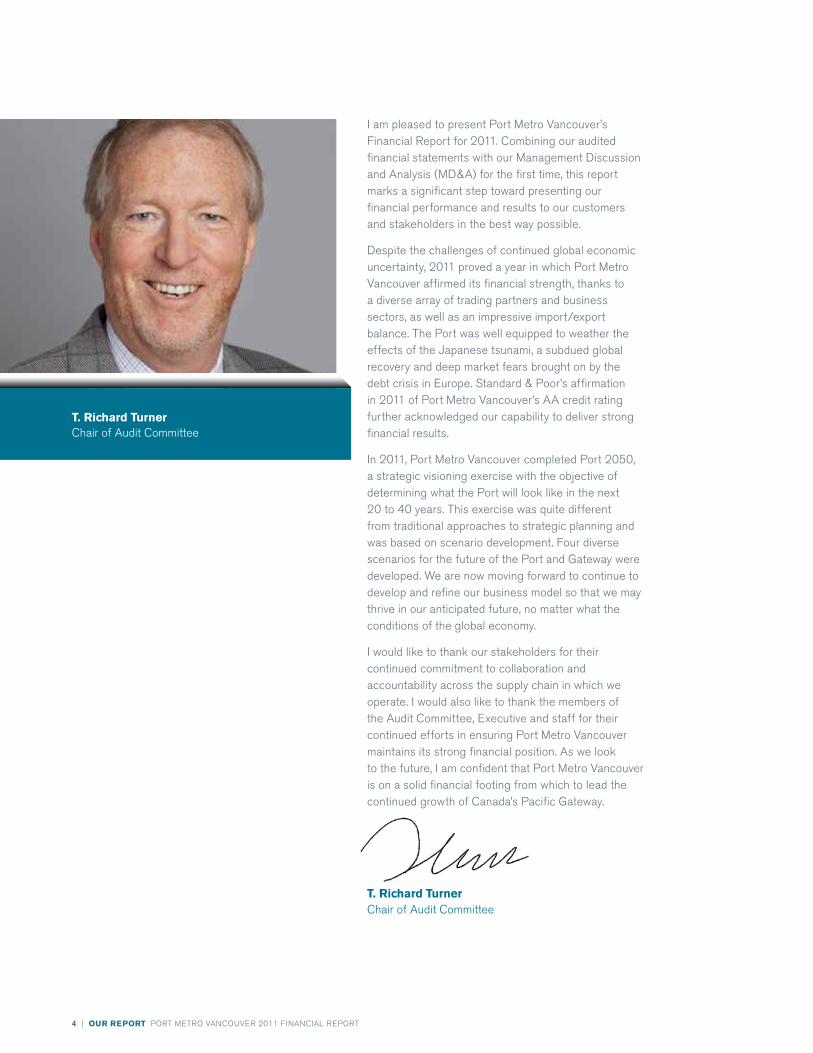
t. Richard turner chair of audit committee
4 | ouR RepoRt PORT METRO VancOUVER 2011 financial REPORT
i am pleased to present Port Metro Vancouver’s financial Report for 2011. combining our audited financial statements with our Management Discussion and analysis (MD&a) for the first time, this report marks a significant step toward presenting our financial performance and results to our customers and stakeholders in the best way possible.
Despite the challenges of continued global economic uncertainty, 2011 proved a year in which Port Metro Vancouver affirmed its financial strength, thanks to a diverse array of trading partners and business sectors, as well as an impressive import/export balance. The Port was well equipped to weather the effects of the Japanese tsunami, a subdued global recovery and deep market fears brought on by the debt crisis in Europe. Standard & Poor’s affirmation in 2011 of Port Metro Vancouver’s aa credit rating further acknowledged our capability to deliver strong financial results.
in 2011, Port Metro Vancouver completed Port 2050, a strategic visioning exercise with the objective of determining what the Port will look like in the next 20 to 40 years. This exercise was quite different from traditional approaches to strategic planning and was based on scenario development. four diverse scenarios for the future of the Port and Gateway were developed. We are now moving forward to continue to develop and refine our business model so that we may thrive in our anticipated future, no matter what the conditions of the global economy.
i would like to thank our stakeholders for their continued commitment to collaboration and accountability across the supply chain in which we operate. i would also like to thank the members of the audit committee, Executive and staff for their continued efforts in ensuring Port Metro Vancouver maintains its strong financial position. as we look to the future, i am confident that Port Metro Vancouver is on a solid financial footing from which to lead the continued growth of canada’s Pacific Gateway.
t. Richard turnerchair of audit committee
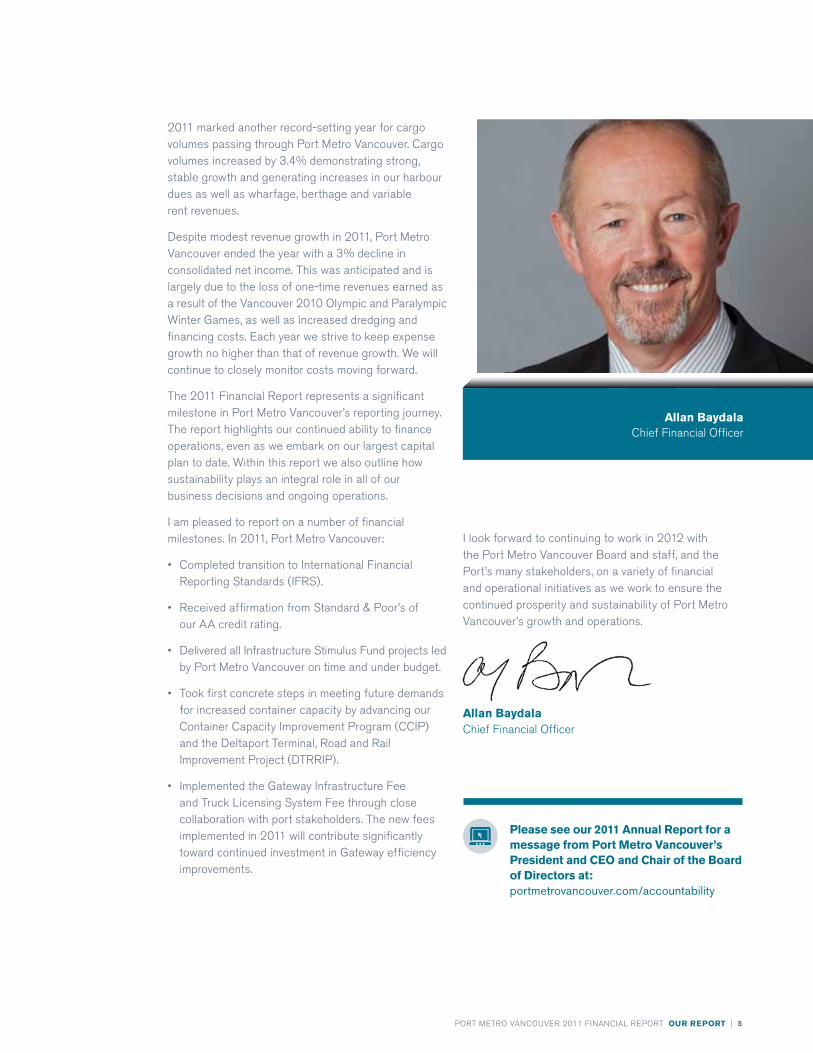
allan baydala chief financial Officer
PORT METRO VancOUVER 2011 financial REPORT ouR RepoRt | 5
i look forward to continuing to work in 2012 with the Port Metro Vancouver Board and staff, and the Port’s many stakeholders, on a variety of financial and operational initiatives as we work to ensure the continued prosperity and sustainability of Port Metro Vancouver’s growth and operations.
allan baydalachief financial Officer
2011 marked another record-setting year for cargo volumes passing through Port Metro Vancouver. cargo volumes increased by 3.4% demonstrating strong, stable growth and generating increases in our harbour dues as well as wharfage, berthage and variable rent revenues.
Despite modest revenue growth in 2011, Port Metro Vancouver ended the year with a 3% decline in consolidated net income. This was anticipated and is largely due to the loss of one-time revenues earned as a result of the Vancouver 2010 Olympic and Paralympic Winter Games, as well as increased dredging and financing costs. Each year we strive to keep expense growth no higher than that of revenue growth. We will continue to closely monitor costs moving forward.
The 2011 financial Report represents a significant milestone in Port Metro Vancouver’s reporting journey. The report highlights our continued ability to finance operations, even as we embark on our largest capital plan to date. Within this report we also outline how sustainability plays an integral role in all of our business decisions and ongoing operations.
i am pleased to report on a number of financial milestones. in 2011, Port Metro Vancouver:
• completed transition to international financial Reporting Standards (ifRS).
• Received affirmation from Standard & Poor’s of our aa credit rating.
• Delivered all infrastructure Stimulus fund projects led by Port Metro Vancouver on time and under budget.
• Took first concrete steps in meeting future demands for increased container capacity by advancing our container capacity improvement Program (cciP) and the Deltaport Terminal, Road and Rail improvement Project (DTRRiP).
• implemented the Gateway infrastructure fee and Truck licensing System fee through close collaboration with port stakeholders. The new fees implemented in 2011 will contribute significantly toward continued investment in Gateway efficiency improvements.
please see our 2011 annual Report for a message from port metro vancouver’s president and ceo and chair of the board of directors at:portmetrovancouver.com/accountability

ROBERTS BANKRAIL CORRIDOR
RICHMOND
SURREY
DELTA
Tsawwassen First Nation
VANCOUVER
NORTHVANCOUVER
NEWWESTMINSTER
BURNABY
PORTMOODY
COQUITLAM
Kingsway
Knig
ht
Str
eet
Kin
g G
eorg
e H
ighw
ay
Lougheed Hwy
South FraserPerimeter Road
99
99
91
91
99
99
99
99
10
10
15
15
1
1
1
7
7B
1A
10
17
17
NORTH SHORETRADE AREA
SOUTH SHORETRADE AREA
6 Port Metro Vancouver
6 Port Metro Vancouver
6 Port Metro Vancouver
6 Port Metro Vancouver
6 Port Metro Vancouver
ou
R c
oR
e b
us
ine
ss
bReakbulkPrinciple cargo includes steel, pulp and lumber
bulkPrinciple cargo includes coal, grain, sulphur and potash
containeR Commodities include household goods, produce, machinery, wood pulp, lumber and metals
cRuiseHomeport for the Vancouver–Alaska cruise
automobilePort receives 100% of all Asian imports destined for Canada
NA
VIg
At
ION
Al
j
Ur
ISd
ICt
ION
B
OU
Nd
Ar
y
6 | ouR RepoRt PORT METRO VancOUVER 2011 financial REPORT
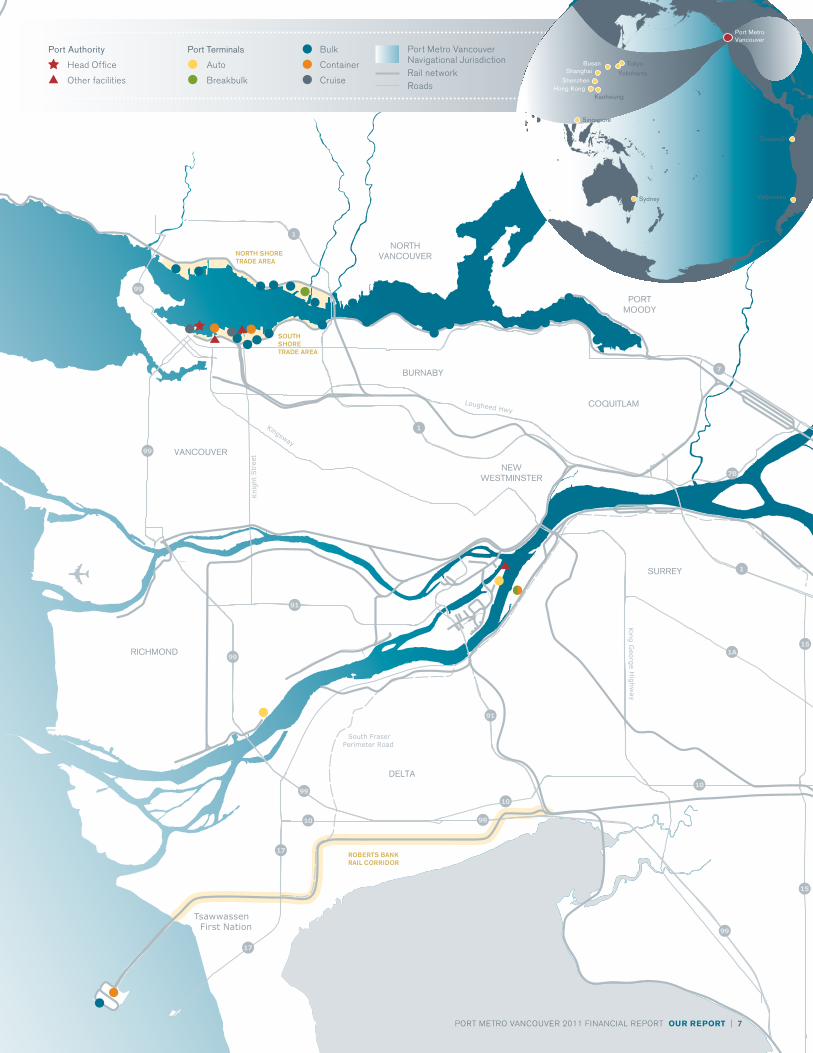
Port Metro Vancouver is canada’s largest and busiest port, a dynamic gateway for domestic and international trade and tourism, and a major economic force that strengthens our economy.
The Port handled 122 million tonnes of cargo in 2011, supporting trade with more than 160 economies. The Port includes 28 terminals servicing deep sea vessels: 19 bulk, 3 container, 1 breakbulk, 2 cruise, 2 auto carrier and 1 multi-purpose (container and breakbulk). Most of these terminals are privately owned and operate on land and/or water lots leased from Port Metro Vancouver. in addition, the Port also has a number of smaller marinas and facilities capable of handling domestic and regional cargo.
Port Metro Vancouver competes with other major ports on the West coast, each of which caters to similar sectors and markets to varying degrees. East coast ports including Montreal and Halifax also compete with the Port, but to a lesser extent. To the north, the Port of Prince Rupert competes with Port Metro Vancouver primarily in the coal, grain and container sectors.
The Port has excellent resources that reinforce its competitive position. These resources include significant land and water assets, well-established facilities, and a full range of marine services, including shipyards, chandlers, freight forwarders and shipping agents. after Prince Rupert, Port Metro Vancouver is the closest port on the West coast of north america serving northern asia and Japan; it is also the closest homeport serving the alaska cruise market.
ROBERTS BANKRAIL CORRIDOR
RICHMOND
SURREY
DELTA
Tsawwassen First Nation
VANCOUVER
NORTHVANCOUVER
NEWWESTMINSTER
BURNABY
PORTMOODY
COQUITLAM
Kingsway
Knig
ht
Str
eet
Kin
g G
eorg
e H
ighw
ay
Lougheed Hwy
South FraserPerimeter Road
99
99
91
91
99
99
99
99
10
10
15
15
1
1
1
7
7B
1A
10
17
17
NORTH SHORETRADE AREA
SOUTH SHORETRADE AREA
PORT METRO VancOUVER 2011 financial REPORT ouR RepoRt | 7
V
Port Metro Vancouver navigational JurisdictionRail networkRoads
Port terminals
auto
Breakbulk
Bulk
container
cruise
Port Authority
Head Office
Other facilities
Valparaiso
Guayaquil
Port MetroVancouver
Busan TokyoShanghai Yokohama
ShenzhenHong Kong
Kaohsiung
Singapore
Sydney

8 | Results and outlook PORT METRO VancOUVER 2011 financial REPORT
60% Operating surpluses
40%Debt
Funding sources for 2012–2016Capital Plan
credit rating from Standard & Poor’saa

PORT METRO VancOUVER 2011 financial REPORT Results and outlook | 9
capability to deliveR Results
PORT METRO VancOUVER iS a nOn-SHaREHOlDER, financiallY SElf-SUfficiEnT cORPORaTiOn. GUiDED BY a lOnG-TERM ViSiOn fOR GROWTH anD cOMPETiTiVEnESS, WE aRE aBlE TO MaKE inDEPEnDEnT anD TiMElY financial DEciSiOnS TO THE OPERaTiOnal BEnEfiT Of PORT USERS.
10 | capability to deliveR Results PORT METRO VancOUVER 2011 financial REPORT
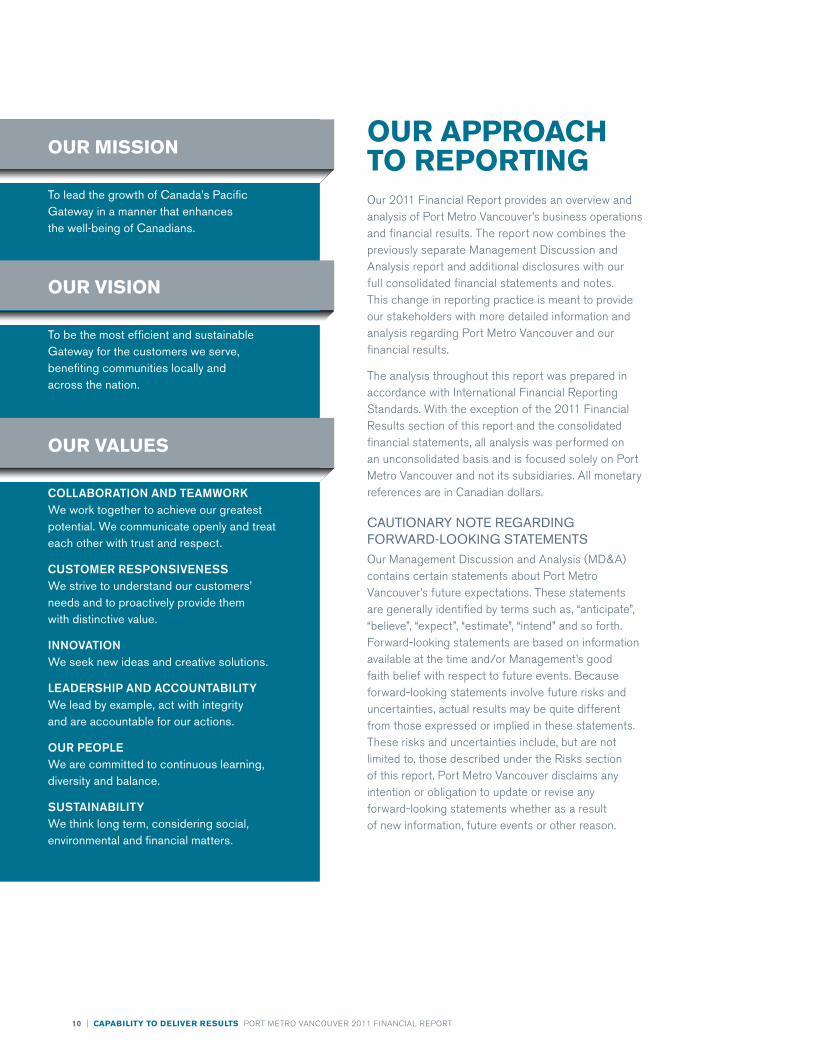
Our 2011 financial Report provides an overview and analysis of Port Metro Vancouver’s business operations and financial results. The report now combines the previously separate Management Discussion and analysis report and additional disclosures with our full consolidated financial statements and notes. This change in reporting practice is meant to provide our stakeholders with more detailed information and analysis regarding Port Metro Vancouver and our financial results.
The analysis throughout this report was prepared in accordance with international financial Reporting Standards. With the exception of the 2011 financial Results section of this report and the consolidated financial statements, all analysis was performed on an unconsolidated basis and is focused solely on Port Metro Vancouver and not its subsidiaries. all monetary references are in canadian dollars.
CAUtIONAry NOte regArdINg FOrwArd-lOOkINg StAtemeNtSOur Management Discussion and analysis (MD&a) contains certain statements about Port Metro Vancouver’s future expectations. These statements are generally identified by terms such as, “anticipate”, “believe”, “expect”, “estimate”, “intend” and so forth. forward-looking statements are based on information available at the time and/or Management’s good faith belief with respect to future events. Because forward-looking statements involve future risks and uncertainties, actual results may be quite different from those expressed or implied in these statements. These risks and uncertainties include, but are not limited to, those described under the Risks section of this report. Port Metro Vancouver disclaims any intention or obligation to update or revise any forward-looking statements whether as a result of new information, future events or other reason.
ouR appRoacH to RepoRtinGouR mission
to lead the growth of Canada’s Pacific gateway in a manner that enhances the well-being of Canadians.
ouR vision
to be the most efficient and sustainable gateway for the customers we serve, benefiting communities locally and across the nation.
ouR values
COLLABORATION AND TEAMWORK we work together to achieve our greatest potential. we communicate openly and treat each other with trust and respect.
CUSTOMER RESPONSIVENESS we strive to understand our customers’ needs and to proactively provide them with distinctive value.
INNOVATIONwe seek new ideas and creative solutions.
LEADERSHIP AND ACCOUNTABILITYwe lead by example, act with integrity and are accountable for our actions.
OUR PEOPLEwe are committed to continuous learning, diversity and balance.
SUSTAINABILITYwe think long term, considering social, environmental and financial matters.

PORT METRO VancOUVER 2011 financial REPORT capability to deliveR Results | 11
social, and economic objectives and will promote and safeguard canada’s competitiveness and trade objectives”. it is our statutory mandate to ensure these objectives are accomplished within our jurisdiction.
We provide services and facilities to a broad range of companies and organizations. Major customer groups include marine carriers, major shippers, terminal operators and tenants.
Governance and corporate structurePort Metro Vancouver is governed by an 11-member Board of Directors, recommended and appointed by port users and different levels of government. To assist with its work, the Board has established several standing committees that Management report to on a regular basis.
We employ 226 people with a widely divergent set of skills. Employees are organized into six divisions, as shown in the chart below:
tHe POrt AUtHOrItyVancouver fraser Port authority, doing business as Port Metro Vancouver, is a non-shareholder, financially self-sufficient corporation. We are able to make independent and timely commercial-orientated decisions on business plans and capital spending, clearly focused on the operational needs of port users, and guided by a vision for long-term efficient growth and competitiveness.
Established by the Government of canada in January 2008, pursuant to the Canada Marine Act (cMa), we are accountable to the federal Minister of Transport, infrastructure and communities. The cMa legislation is “an act for making the system of canadian ports competitive, efficient, and commercially oriented”. cMa objectives also include implementing “a national marine policy that provides canada with the marine infrastructure it needs and that offers effective support for the achievement of national, regional and local,
oRGanizational oveRvieW
in addition, Port Metro Vancouver has five subsidiaries that were formed for different purposes as outlined in the table below.
subsidiaRy oveRvieW
Canada Place Corporation (CPC) Financially self-sufficient Crown agent responsible for the stewardship of Canada Place in Vancouver.
Property manager for businesses at Canada Place.
Port metro Vancouver Ventures Inc. (PmVV) Incorporated to provide a vehicle to invest in business ventures necessary to support the Port’s operations, for example, the modalink Vancouver gateway distribution Hub (modalink).
Port metro Vancouver enterprises Inc. (PmVe) these are property-holding companies that undertake strategic real property acquisitions.
Port metro Vancouver Holdings Inc. (PmVH)
North Fraser terminals Inc. (NFtI)
pResident and cHief executive officeR
chief financial Officer
Vice President Real Estate
Vice President Human Resources and Organizational
Excellence
Vice President infrastructure
Delivery
Vice President corporate Social
Responsibility
Vice President Planning and Operations
12 | capability to deliveR Results PORT METRO VancOUVER 2011 financial REPORT
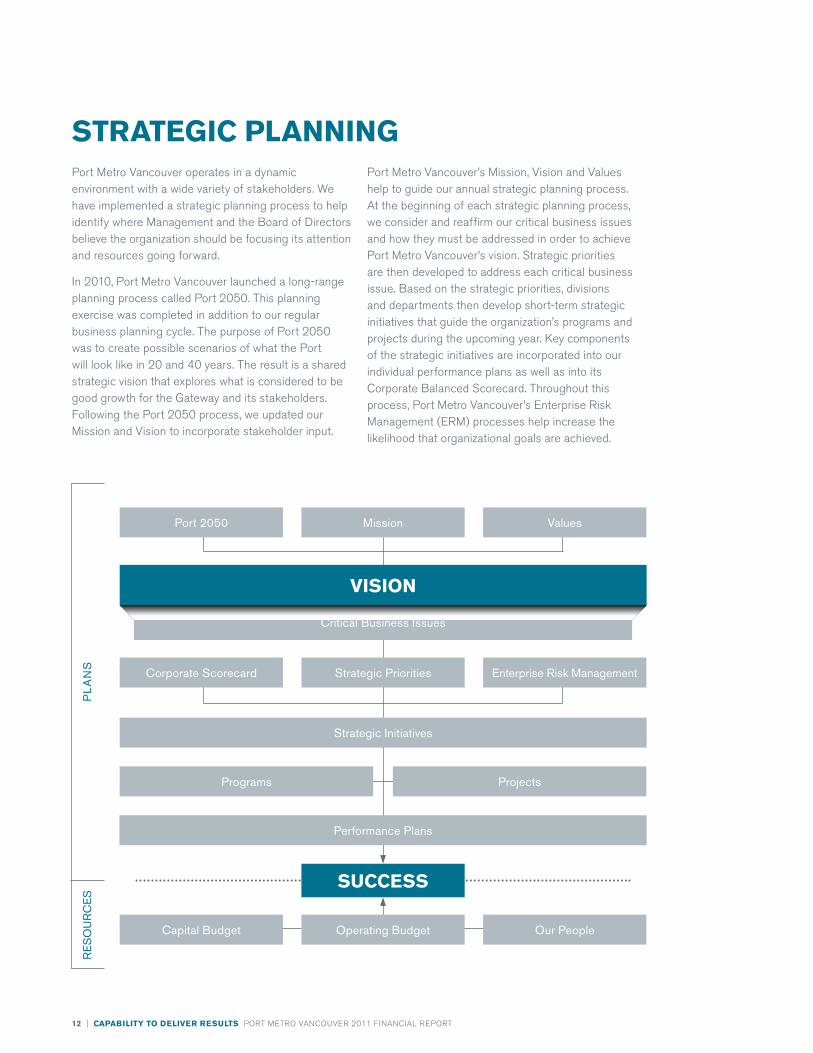
Port Metro Vancouver’s Mission, Vision and Values help to guide our annual strategic planning process. at the beginning of each strategic planning process, we consider and reaffirm our critical business issues and how they must be addressed in order to achieve Port Metro Vancouver’s vision. Strategic priorities are then developed to address each critical business issue. Based on the strategic priorities, divisions and departments then develop short-term strategic initiatives that guide the organization’s programs and projects during the upcoming year. Key components of the strategic initiatives are incorporated into our individual performance plans as well as into its corporate Balanced Scorecard. Throughout this process, Port Metro Vancouver’s Enterprise Risk Management (ERM) processes help increase the likelihood that organizational goals are achieved.
Port Metro Vancouver operates in a dynamic environment with a wide variety of stakeholders. We have implemented a strategic planning process to help identify where Management and the Board of Directors believe the organization should be focusing its attention and resources going forward.
in 2010, Port Metro Vancouver launched a long-range planning process called Port 2050. This planning exercise was completed in addition to our regular business planning cycle. The purpose of Port 2050 was to create possible scenarios of what the Port will look like in 20 and 40 years. The result is a shared strategic vision that explores what is considered to be good growth for the Gateway and its stakeholders. following the Port 2050 process, we updated our Mission and Vision to incorporate stakeholder input.
Capital Budget Operating Budget Our People
Critical Business Issues
vision
Strategic Initiatives
Performance Plans
Programs Projects
success
Corporate Scorecard Strategic Priorities enterprise risk management
re
SO
Ur
Ce
SP
lA
NS
Port 2050 mission Values
stRateGic planninG

PORT METRO VancOUVER 2011 financial REPORT capability to deliveR Results | 13
The table below presents Port Metro Vancouver’s 2011 critical business issues and their corresponding strategic priority. We update this information annually to reflect the changes affecting the overall business environment.
Port metro Vancouver’s strategic plan identifies priorities to guide decision-making. In 2011, we spent $16.6 million to explore container terminal capacity expansion to capture future growth. more than half a billion dollars in additional capital spending is anticipated over the next five years, including the deltaport terminal, road and rail Improvement Project and an environmental Assessment for the proposed roberts Bank terminal 2 project.
cRitical business issue stRateGic pRioRity
efficient multi-modal logistics chain Operational Efficiency, Capacity and Customer Value Enhancement: Improve supply chain reliability and throughput capacity to meet customer needs and enhance value to our customers.
Industrial land shortage Land Asset Strategy: ensure there is sufficient land, appropriately utilized, to meet long-term requirements of the Port.
Changing government legislation and increasing need for engagement
Community and Government Engagement: engage communities and government to build relationships and awareness of the Port.
Organizational competencies Organizational Excellence: engage employees, create effective processes and implement appropriate technologies.
Socially and environmentally sustainable behaviour
Corporate Social Responsibility (CSR): deliver material progress on relevant CSr initiatives to improve long-term sustainability of the Port.
Planning process as a basis for stakeholder engagement and long-term decision-making
Strategy and Long-Range Planning: engage stakeholders to inform the creation of Port metro Vancouver’s strategy and long-term plans.

14 | capability to deliveR Results PORT METRO VancOUVER 2011 financial REPORT
2011 capital spending decreased to $36.2 million from $55 million in 2010. This decline was primarily due to completion ahead of schedule of the federal infrastructure stimulus-supported projects, completion of the Deltaport Third Berth Project, and delayed spending in the north Shore Trade area, South Shore Trade area and Roberts Bank Rail corridor.
We continually revise our planned capital spending to better align with the needs of customers, stakeholders and port users. as a result, some projects are delayed, while others are given greater priority.
Port Metro Vancouver’s 2012–2016 capital Plan identifies $1.2 billion in total spending. The main additions to this capital Plan are the Environmental assessment for the proposed Roberts Bank Terminal 2 ($406 million) project and the Tsawwassen first nation industrial lands Joint Venture ($54 million).
Port Metro Vancouver’s 2012—2016 capital Plans and 2012 capital Budget make commitments in the following areas:
• increasing port capacity; • increasing land available for expansion;• improving the productivity of port backup lands; • engaging with local first nations; and • providing capital maintenance/replacement
of existing assets.
Whether seizing opportunities to improve the reliability of the supply chain through investments in the Gateway, or expanding throughput capacity by investing in terminal expansions, the capital plan and budget both strongly support the strategic priorities of our organization.
stRateGic pRioRity capital pRojects 2011 actual spendinG3
2012-2016 capital plan
expand Container terminal Capacity1
Container Capacity Improvement Program
deltaport terminal, road and rail Improvement Project
environmental Assessment for the proposed roberts Bank terminal 2 project
$16.6 million $36 million
$115 million
$406 million
Operational efficiency, Capacity and Customer Value enhancement
richmond logistics Hub
Second Narrows dredging and Secondary Channel Improvements
tsawwassen First Nation Industrial lands joint Venture
road infrastructure
deltaport third Berth Project
$2 million
$5.5 million
$2 million
$36 million
$26 million
$54 million
government Support North Shore trade Area Agreement
South Shore trade Area Agreement
roberts Bank rail Corridor
$3 million
$1 million
$2.6 million
$52 million
$58 million
$50 million
land land/Property Acquisitions $0.5 million $212 million
Organizational excellence Information Services
design/Build 10k Office Space
$1 million $8 million
$3 million
Other2 $2 million $144 million
tOtAl $36.2 million $1.2 billion
1 A strategic priority to “expand Container Capacity to Capture Future growth” was approved by Port metro Vancouver’s Board in december 2011.2 Includes capitalized interest, capital repair and maintenance programs and other smaller capital plan items from 2012 to 2016.3 Port metro Vancouver’s other strategic priorities for 2011 did not require significant capital funding to advance.
capital planninG

Port metro Vancouver contributed $17.6 million toward improvements to the lynn Creek rail Bridge and Brooksbank Underpass. Part of the North Shore trade Area, the project is part of an overall $225 million in public and private sector investments toward infrastructure improvements on the North Shore.
PORT METRO VancOUVER 2011 financial REPORT capability to deliveR Results | 15
new financing Requirements Port Metro Vancouver will need new credit facilities to fund future capital requirements. Our current financing strategy is to raise funds using a combination of additional rated private placement bond issues and floating rate bank debt. This approach will reduce refinancing risk in the future, minimize interest rate and renewal risk, and diversify Port Metro Vancouver’s funding sources. This strategy will also ensure Port Metro Vancouver maintains sufficient liquidity as outlined in its liquidity Management Policy.
Port Metro Vancouver’s borrowing is now expected to peak at $411 million in 2015, should all projects in its new capital Plan receive Board approval and occur when anticipated. This debt level is below Port Metro Vancouver’s borrowing limit of $510 million as specified in its letters Patent.
Given Port Metro Vancouver’s strong cash flow position, approximately 60% of total capital spending over the planning period is expected to be funded with operating surpluses and 40% with debt. carrying costs for the forecasted debt are expected to grow to roughly $18 million in 2015. Given these carrying costs and current Earnings Before interest, Taxes, Depreciation and amortization (EBiTDa) projections, Port Metro Vancouver expects to maintain a strong credit profile. Based on its current capital and financing plan, Port Metro Vancouver’s Debt Service coverage Ratio is not expected to fall below 7:1 and the Debt/EBiTDa ratio is not expected to exceed 3.2 times over its five-year plan horizon.
Port Metro Vancouver is an agent of the crown, though may not borrow as an agent of the crown. The Canada Marine Act promotes infrastructure development, increased operating efficiencies, and fosters a commercially based financial environment. Port Metro Vancouver’s letters Patent restricts our ability to raise more than $510 million of debt financing. We can, however, access contribution funding for projects related to the implementation of security measures, environmental sustainability, infrastructure, or responding to emergencies.
existing credit facilities • Private placement bond: On april 19, 2010, Port
Metro Vancouver successfully issued a $100 million private placement bond, the first of its kind for a canadian Port authority. The bonds were supported by a aa credit rating provided by Standard & Poor’s and were issued as senior unsecured Debentures for a 10-year term at 4.63%, incorporating a 0.85% spread over Government of canada bonds. This bond is non-amortizing and requires interest to be paid semi-annually with principal repaid in full at maturity in 2020.
• National Bank of Canada: in December 2007, Port Metro Vancouver signed a five-year $175 million financing agreement with national Bank of canada (nBc). The Port can also issue letters of credit (lcs) from its national Bank facility. This credit facility expires December 2012.
boRRoWinG & liquidity plan

$180munconsolidated 2011 operating revenue
3.4%increase in cargo moving through the Port in 2011
$18mnet proceeds from sale of Modalink
Results and outlook
PORT METRO VancOUVER EnJOYED a 2% incREaSE in OPERaTinG REVEnUES in 2011 aS THE GlOBal EcOnOMY cOnTinUED iTS REcOVERY. WE aRE WEll POSiTiOnED TO TaKE aDVanTaGE Of EMERGinG TRaDE OPPORTUniTiES GlOBallY.
18 | Results and outlook PORT METRO VancOUVER 2011 financial REPORT
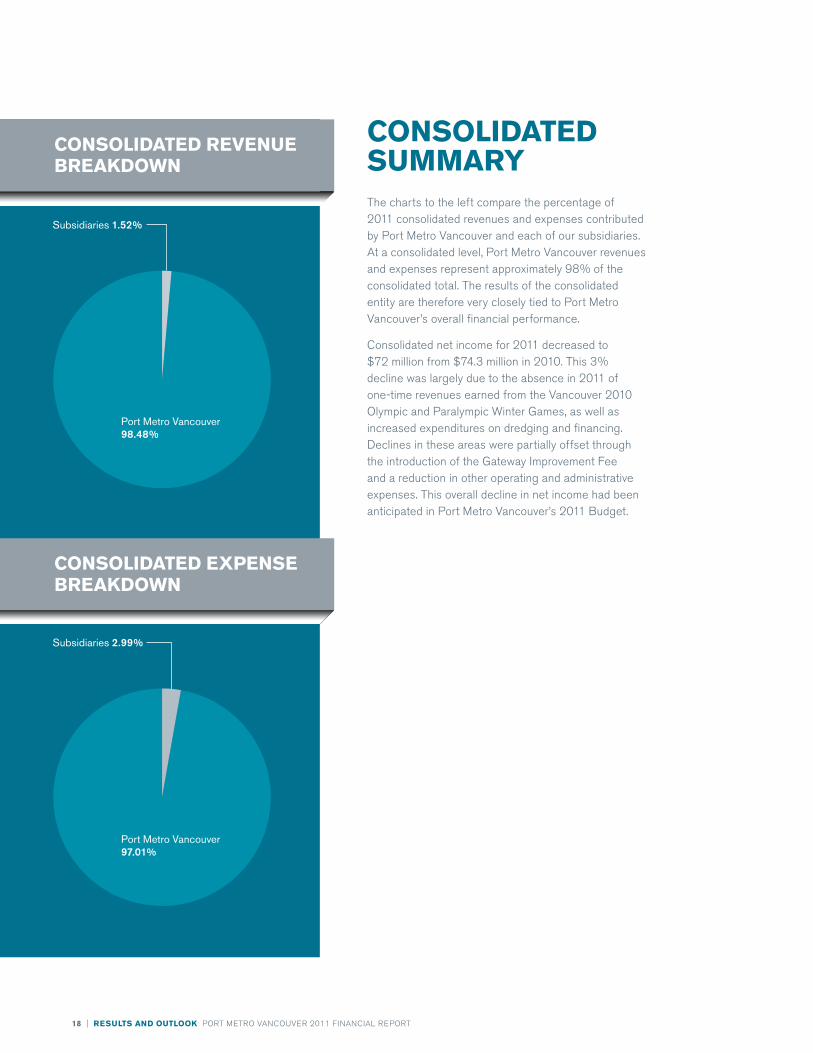
The charts to the left compare the percentage of 2011 consolidated revenues and expenses contributed by Port Metro Vancouver and each of our subsidiaries. at a consolidated level, Port Metro Vancouver revenues and expenses represent approximately 98% of the consolidated total. The results of the consolidated entity are therefore very closely tied to Port Metro Vancouver’s overall financial performance.
consolidated net income for 2011 decreased to $72 million from $74.3 million in 2010. This 3% decline was largely due to the absence in 2011 of one-time revenues earned from the Vancouver 2010 Olympic and Paralympic Winter Games, as well as increased expenditures on dredging and financing. Declines in these areas were partially offset through the introduction of the Gateway improvement fee and a reduction in other operating and administrative expenses. This overall decline in net income had been anticipated in Port Metro Vancouver’s 2011 Budget.
consolidated summaRy
Subsidiaries 1.52%
Port Metro Vancouver98.48%
consolidated Revenue bReakdoWn
Subsidiaries 2.99%
Port Metro Vancouver97.01%
consolidated expense bReakdoWn

PORT METRO VancOUVER 2011 financial REPORT Results and outlook | 19
dec 31, 2011 dec 31, 2010 vaRiance $ vaRiance %
Operating revenues
Harbour dues $9,308,952 $9,012,146 $296,806 3%
Berthage $6,394,225 $5,953,897 $440,328 7%
wharfage $32,661,485 $32,163,662 $497,823 2%
Cruise $8,554,713 $10,212,040 $(1,657,327) (16%)
Fixed rent $88,605,568 $90,074,728 $(1,469,160) (2%)
Variable rent $25,526,914 $24,136,483 $1,390,431 5%
Net Provincial lease revenue $1,789,577 $2,014,255 $(224,678) (11%)
gateway Improvement Fee $3,426,422 $0 $3,426,422 0
Utilities $1,405,990 $1,431,625 $(25,635) (2%)
Other revenue $2,083,980 $813,304 $1,270,676 156%
tOtAl $179,757,826 $175,812,140 $3,945,686 2%
unconsolidated Results
Harbour Dues 5%
Other Revenue 1%
Utilities 1%
Gateway Improvement Fee 2%
Net Provincial Lease Revenue 1%
Fixed Rental49%
VariableRental14%
Wharfage18%
Cruise 5%
Berthage 4%
opeRatinG Revenue composition
Given the material impact that Port Metro Vancouver has on the consolidated results, this section restricts its comparison to Port Metro Vancouver’s unconsolidated 2011 revenues and expense results to performance in 2010.
reVeNUeS Rental revenue remained constant between 2010 and 2011, following a year of significant growth in 2010. The increase in 2010 was largely due to revenue generated by the opening of a new berth at Deltaport in early 2010, new leases at our Richmond Properties coming into effect, and additional rent from new properties purchased as part of Port Metro Vancouver’s land acquisition Program. no significant new leases commenced in 2011; therefore, overall 2011 rental revenues remained consistent with the prior year. also consistent with prior years was the overall split of rental revenue between fixed and variable.
The pie chart to the right depicts Port Metro Vancouver’s operating revenue for 2011. fixed rent accounts for approximately half of total revenues, which means that a sizable proportion of revenue is protected against fluctuations in commodity volumes.
The table below is an excerpt from Port Metro Vancouver’s Unconsolidated Statement of comprehensive income.

20 | Results and outlook PORT METRO VancOUVER 2011 financial REPORT
We collect several fees to recover investments and costs made to support the Port in a variety of ways. Primary fees collected include wharfage, harbour dues, cruise, berthage, the Gateway infrastructure fee (Gif) and the Truck licensing System fee (TlS). The table below summarizes the key drivers for each of these fees and how the fees are calculated, as well as the value Port Metro Vancouver adds by reinvesting these fees.
no rate changes were made to any of Port Metro Vancouver’s wharfage, harbour dues, berthage or cruise rates in 2011, and as a result, revenue increases were mainly attributed to increased volumes on which these fees are calculated. Overall revenue collected in 2011 for harbour dues, berthage and wharfage was $48.4 million compared with $47.1 million in 2010, representing a 3% increase overall.
Two new fees were introduced in 2011: the Gateway infrastructure fee (Gif) and the Truck licensing System (TlS) fee. The Gif enables Port Metro Vancouver to recover approximately 90% of investments and costs associated with the Gateway infrastructure Program (GiP) from users who will benefit from infrastructure improvements. These improvements include projects in three trade areas: the Roberts Bank Rail corridor, the north Shore Trade area and
Revenue type details on calculation puRpose of fee
wharfage RATE x UNIT Unit rate applied is per mFBm, tonne or teU
to recover investments and costs associated with the provision of port infrastructure and services to handle cargo.
Harbour dues RATE x GROSS REGISTERED TONNE (GRT) discounts for air emission standards achievedCharged on first 5 calls only
to recover investments and costs associated with harbour operations, as well as harbour safety, security and cleanliness.
Cruise PASSENGER FEE = RATE x NUMBER OF PASSENGERS SERVICE & FACILITIES FEE = RATE x OVERALL SHIP LENGTH rates vary for days of the week and time of stayPassenger fee rebates based on tiered system
to recover investments and costs associated with provision of cruise terminal facilities, berths and infrastructure.
Berthage RATE x OVERALL SHIP LENGTH x TIME AT BERTH Unit rate applied is based on location and time of stay
to recover investments and costs associated with the wharf apron, berth dredging and maintenance.
gIF RATE x UNIT Unit rate applied is per mFBm, tonne or teU
to recover investments and costs related to trade area infrastructure improvements in three trade areas.
tlS Fee $300/TRUCK Annual fee of $300 per tlS Approved truck
to recover investments and costs related to operation of the truck licensing System.
the South Shore Trade area. Revenues from this new fee in 2011 totalled $3.4 million. The TlS fee of $300 per truck was implemented to help recover costs associated with the administration of the TlS and the sustainability of the container drayage sector (the transport of goods over a short distance). The TlS fee applies to all container drayage trucks identified and approved pursuant to a licence or permit to haul into, within, or out of port lands under the Truck licensing System. Revenues from this fee in 2011 were approximately $500,000.
cruise revenues decreased 16% in 2011 to $8.6 million, versus $10.2 million in 2010. This decrease is primarily due to the absence in 2011 of one-time revenues generated during the Vancouver 2010 Olympic and Paralympic Winter Games, when Port Metro Vancouver welcomed cruise ships that provided accommodation for security forces. This decline was partially offset by an increase in alaska cruise revenue passengers in 2011. The majority of Port Metro Vancouver’s cruise revenue comes from passenger fees charged on a per passenger basis. The number of Port Metro Vancouver cruise revenue passengers increased by 10% to 664,000 in 2011, from 579,000 in 2010, as a result of a stronger alaska cruise market and the addition of the Disney Wonder to the 2011 schedule.
PORT METRO VancOUVER 2011 financial REPORT Results and outlook | 21
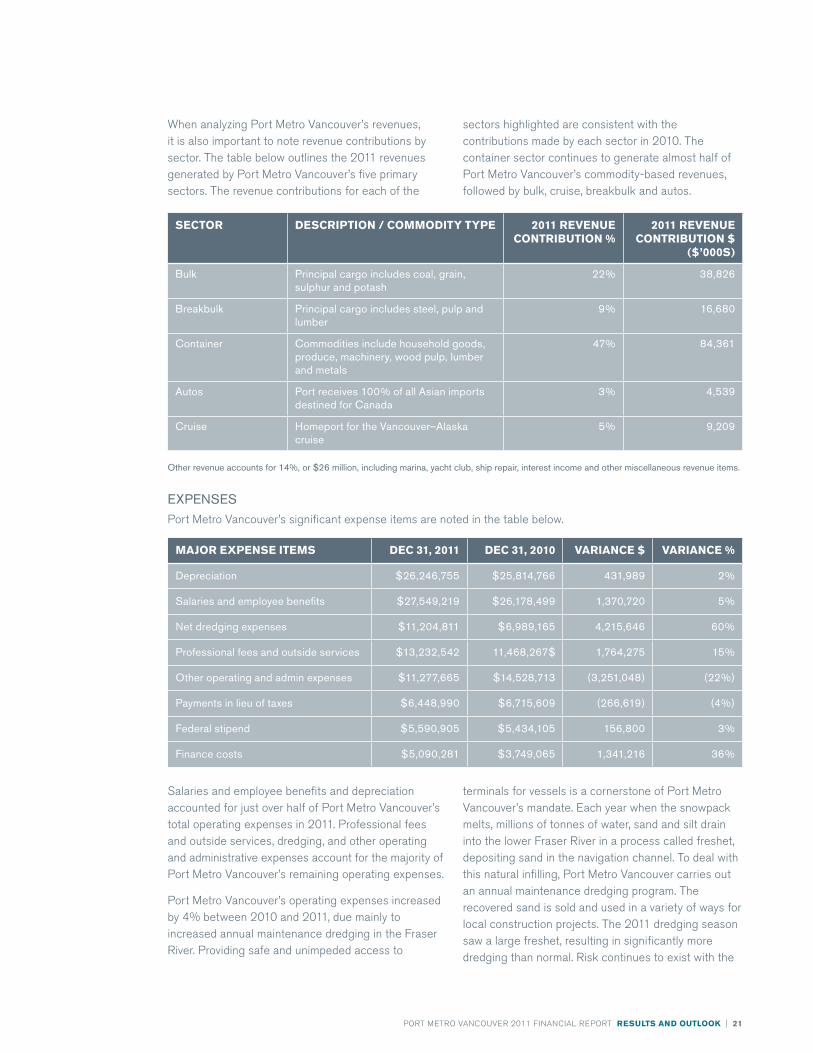
exPeNSeSPort Metro Vancouver’s significant expense items are noted in the table below.
When analyzing Port Metro Vancouver’s revenues, it is also important to note revenue contributions by sector. The table below outlines the 2011 revenues generated by Port Metro Vancouver’s five primary sectors. The revenue contributions for each of the
majoR expense items dec 31, 2011 dec 31, 2010 vaRiance $ vaRiance %
depreciation $26,246,755 $25,814,766 431,989 2%
Salaries and employee benefits $27,549,219 $26,178,499 1,370,720 5%
Net dredging expenses $11,204,811 $6,989,165 4,215,646 60%
Professional fees and outside services $13,232,542 11,468,267$ 1,764,275 15%
Other operating and admin expenses $11,277,665 $14,528,713 (3,251,048) (22%)
Payments in lieu of taxes $6,448,990 $6,715,609 (266,619) (4%)
Federal stipend $5,590,905 $5,434,105 156,800 3%
Finance costs $5,090,281 $3,749,065 1,341,216 36%
sectors highlighted are consistent with the contributions made by each sector in 2010. The container sector continues to generate almost half of Port Metro Vancouver’s commodity-based revenues, followed by bulk, cruise, breakbulk and autos.
Salaries and employee benefits and depreciation accounted for just over half of Port Metro Vancouver’s total operating expenses in 2011. Professional fees and outside services, dredging, and other operating and administrative expenses account for the majority of Port Metro Vancouver’s remaining operating expenses.
Port Metro Vancouver’s operating expenses increased by 4% between 2010 and 2011, due mainly to increased annual maintenance dredging in the fraser River. Providing safe and unimpeded access to
sectoR descRiption / commodity type 2011 Revenue contRibution %
2011 Revenue contRibution $
($’000s)
Bulk Principal cargo includes coal, grain, sulphur and potash
22% 38,826
Breakbulk Principal cargo includes steel, pulp and lumber
9% 16,680
Container Commodities include household goods, produce, machinery, wood pulp, lumber and metals
47% 84,361
Autos Port receives 100% of all Asian imports destined for Canada
3% 4,539
Cruise Homeport for the Vancouver–Alaska cruise
5% 9,209
Other revenue accounts for 14%, or $26 million, including marina, yacht club, ship repair, interest income and other miscellaneous revenue items.
terminals for vessels is a cornerstone of Port Metro Vancouver’s mandate. Each year when the snowpack melts, millions of tonnes of water, sand and silt drain into the lower fraser River in a process called freshet, depositing sand in the navigation channel. To deal with this natural infilling, Port Metro Vancouver carries out an annual maintenance dredging program. The recovered sand is sold and used in a variety of ways for local construction projects. The 2011 dredging season saw a large freshet, resulting in significantly more dredging than normal. Risk continues to exist with the

22 | Results and outlook PORT METRO VancOUVER 2011 financial REPORT
net cost of dredging, as the volume to remove can vary and as volumes of offsetting dredge sand sales can vary year to year.
a full year’s worth of interest was paid to Port Metro Vancouver’s bondholders in 2011 for the first time. interest is payable semi-annually at 4.63% for a total annual payment of $4.63 million. These payments make up the majority of total financing costs, and the full year payment paid in 2011 explains the significant increase over 2010 when less than nine months’ worth of interest was paid.
Throughout 2011, Port Metro Vancouver worked with the Bc assessment authority to ensure the accuracy of property inventory and resolve issues pertaining to valuation. This effort has led to a 4%, or $0.27 million decrease in Payments in lieu of Taxes (PilT) expense in 2011 and is based on the valuation principles developed by the Bc assessment authority as outlined in its position paper. a Dispute advisory Panel (DaP) has also been formed as a result of an application by a number of municipalities over the PilT payments received. The DaP has required the applicants to provide it with details of the issues and properties they claim are in dispute no later than March 30, 2012. a Hearing date has not yet been set. a number of local communities have recently lodged an appeal with the provincial Property assessment appeal Board over the 2012 property assessments completed by Bc assessment. This process is independent of DaP and will be settled through a separate hearing if Bc assessment and the municipalities do not otherwise agree on the disputed assessments.
Port Metro Vancouver is exempt from income taxes. However, under the Canada Marine Act, it is obligated to pay an annual federal Stipend to the Minister of Transport, infrastructure and communities to keep its letters Patent in good standing. The charge is calculated by reference to gross revenues at rates varying between 2% and 6%, depending on the gross amount determined. federal stipend payments increase annually as Port Metro Vancouver’s gross revenues grow, rising from $5.4 million in 2010 to $5.6 million 2011.
a decrease in other operating and administrative expenses was primarily offset by an increase in professional fees and outside services. in addition, a slight decrease in PilT was offset by an increase in federal Stipend payable. all remaining expense items stayed relatively flat in 2011.
opeRatinG expenses
Professional fees and outside services 14%
Net dredging expenses 11%
Payments in lieu of taxes 7%
Maintenance and repairs 1%
Other operating and administrative expenses 12%
Salaries and employee benefits 28%
Depreciation27%

PORT METRO VancOUVER 2011 financial REPORT Results and outlook | 23
SUBSIdIArIeSThe Canada Marine Act and Port Metro Vancouver’s letters Patent allow the use of subsidiaries to undertake certain indirect activities that are deemed necessary to support port operations or strategic priorities. We are unable to enter directly into joint ventures with third parties but can do so by utilizing wholly-owned subsidiary corporations. The following table summarizes the 2011 results for each of Port Metro Vancouver’s subsidiaries.
In the first quarter of 2012, PmVV completed the sale of the assets of modalink. modalink is 50% owned by Port metro Vancouver Ventures Inc. Since 2002, modalink has undertaken a phased development in the richmond Properties area with subleases to Coast 2000, westran Intermodal, western Canada express and Simard westlink. Net proceeds to PmVV from the sale are expected to be approximately $18 million and will remain within PmVV for future opportunities.
2011 subsidiaRy Results ($’000s)
Subsidiaries Operating revenue Operating expense Net Income*
Canada Place Corporation 2,585 2,344 (73)
Port metro Vancouver Ventures Inc. 164 110 270
Port metro Vancouver enterprises Inc. 0 0 0
North Fraser terminals Inc. 233 33 117
Port metro Vancouver Holdings Inc. 244 43 43
* Operating revenues less operating expenses do not equal net income. Variances are due to non-operating items including investment income/expenses, gain/loss on disposal of fixed assets, and write-down/impairment provisions.

outlook and Risks
24 | Results and outlook PORT METRO VancOUVER 2011 financial REPORT
containeR the long-term prospects for container growth remain positive and stable based on the projected gdP growth for Canada and for many of the Port’s overseas trading partners. this economic growth will provide opportunities for importers and the Port’s export container customers.
6 Port Metro Vancouver
cRuiseCruise passenger volumes are expected to be relatively constant in 2012 as lost calls from the Disney Wonder will be offset by additional calls from other cruise lines. the travel and tourism markets are expected to continue improving and the Alaska cruise market is experiencing a rebound.
6 Port Metro Vancouver
bulkCoal provided to the steel industry and overseas utilities is Port metro Vancouver’s largest bulk commodity by volume. worldwide steel production continues to increase following the 2009 economic downturn. metallurgical coal export volumes are expected to fall slightly in 2012, but should be offset by increasing thermal coal shipments.
6 Port Metro Vancouver
bReakbulklogs are the largest breakbulk commodity handled at Port metro Vancouver. China is now the number one importer of BC’s forest product exports. demand for BC logs is projected to grow by 9% to 10% over the next five years. Volume growth is also projected on other breakbulk commodities including lumber, wood pulp and metals.
6 Port Metro Vancouver
automobilesSteady demand for Asian-manufactured, fuel-efficient and alternate-fuel vehicles in Canada is expected to continue. moderate growth of sales volumes is predicted based on key economic variables, including gdP, unemployment, and disposable income, that drive auto industry sales.
6 Port Metro Vancouver
se
ct
oR
ou
tlo
ok
PORT METRO VancOUVER 2011 financial REPORT Results and outlook | 25
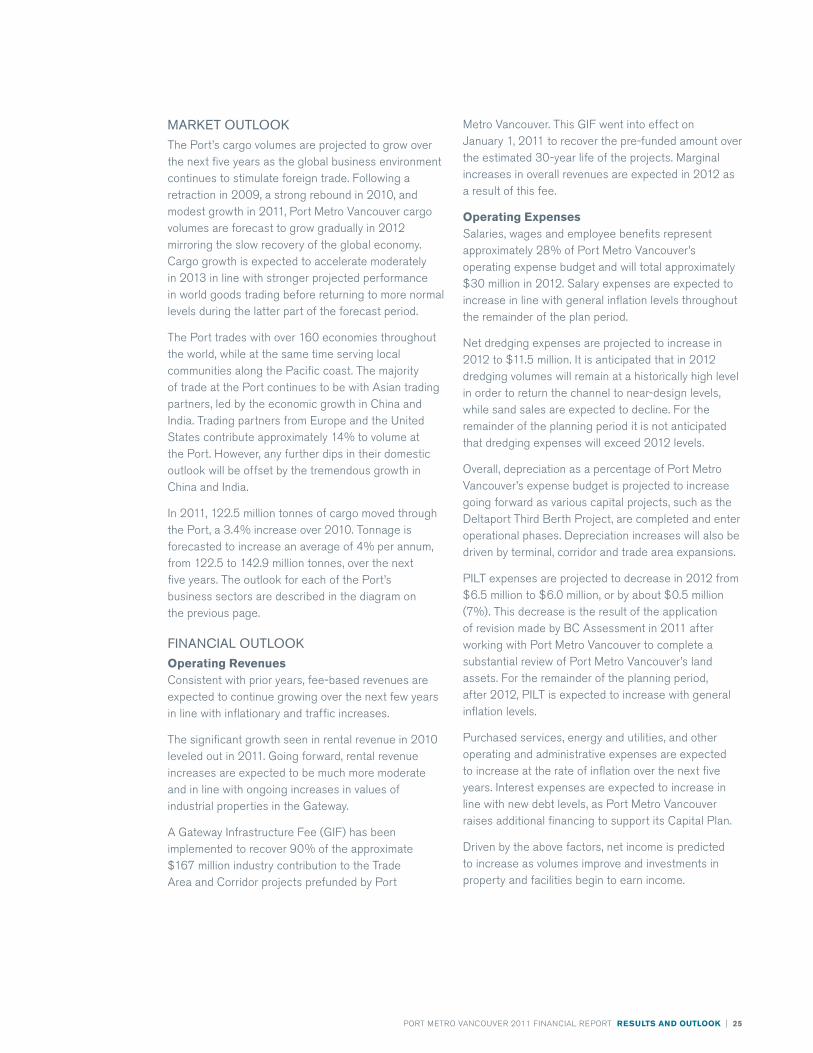
Metro Vancouver. This Gif went into effect on January 1, 2011 to recover the pre-funded amount over the estimated 30-year life of the projects. Marginal increases in overall revenues are expected in 2012 as a result of this fee.
operating expensesSalaries, wages and employee benefits represent approximately 28% of Port Metro Vancouver’s operating expense budget and will total approximately $30 million in 2012. Salary expenses are expected to increase in line with general inflation levels throughout the remainder of the plan period.
net dredging expenses are projected to increase in 2012 to $11.5 million. it is anticipated that in 2012 dredging volumes will remain at a historically high level in order to return the channel to near-design levels, while sand sales are expected to decline. for the remainder of the planning period it is not anticipated that dredging expenses will exceed 2012 levels.
Overall, depreciation as a percentage of Port Metro Vancouver’s expense budget is projected to increase going forward as various capital projects, such as the Deltaport Third Berth Project, are completed and enter operational phases. Depreciation increases will also be driven by terminal, corridor and trade area expansions.
PilT expenses are projected to decrease in 2012 from $6.5 million to $6.0 million, or by about $0.5 million (7%). This decrease is the result of the application of revision made by Bc assessment in 2011 after working with Port Metro Vancouver to complete a substantial review of Port Metro Vancouver’s land assets. for the remainder of the planning period, after 2012, PilT is expected to increase with general inflation levels.
Purchased services, energy and utilities, and other operating and administrative expenses are expected to increase at the rate of inflation over the next five years. interest expenses are expected to increase in line with new debt levels, as Port Metro Vancouver raises additional financing to support its capital Plan.
Driven by the above factors, net income is predicted to increase as volumes improve and investments in property and facilities begin to earn income.
mArket OUtlOOkThe Port’s cargo volumes are projected to grow over the next five years as the global business environment continues to stimulate foreign trade. following a retraction in 2009, a strong rebound in 2010, and modest growth in 2011, Port Metro Vancouver cargo volumes are forecast to grow gradually in 2012 mirroring the slow recovery of the global economy. cargo growth is expected to accelerate moderately in 2013 in line with stronger projected performance in world goods trading before returning to more normal levels during the latter part of the forecast period.
The Port trades with over 160 economies throughout the world, while at the same time serving local communities along the Pacific coast. The majority of trade at the Port continues to be with asian trading partners, led by the economic growth in china and india. Trading partners from Europe and the United States contribute approximately 14% to volume at the Port. However, any further dips in their domestic outlook will be offset by the tremendous growth in china and india.
in 2011, 122.5 million tonnes of cargo moved through the Port, a 3.4% increase over 2010. Tonnage is forecasted to increase an average of 4% per annum, from 122.5 to 142.9 million tonnes, over the next five years. The outlook for each of the Port’s business sectors are described in the diagram on the previous page.
FINANCIAl OUtlOOkoperating Revenuesconsistent with prior years, fee-based revenues are expected to continue growing over the next few years in line with inflationary and traffic increases.
The significant growth seen in rental revenue in 2010 leveled out in 2011. Going forward, rental revenue increases are expected to be much more moderate and in line with ongoing increases in values of industrial properties in the Gateway.
a Gateway infrastructure fee (Gif) has been implemented to recover 90% of the approximate $167 million industry contribution to the Trade area and corridor projects prefunded by Port

Port Metro Vancouver is strategically positioned to take advantage of emerging opportunities as trade volumes surpass pre-recessionary levels. We continue to maintain our strong financial position.
26 | Results and outlook PORT METRO VancOUVER 2011 financial REPORT
rISk mANAgemeNtas with any organization, without regular monitoring and mitigation of enterprise risks, Port Metro Vancouver would likely be unable to achieve its objectives. We assess enterprise risks and associated controls internally on a regular basis throughout the year. This assessment is led by Port Metro Vancouver’s Enterprise Risk Management (ERM) committee. Sponsored by the chief financial Officer, the committee is made up of representatives from across the organization and meets on a monthly basis. at these meetings the committee reviews the top corporate risks and any events or activities arising since the prior meeting that could impact the risk register or mitigation strategies. The committee also discusses the status of, and next steps for, any ERM committee projects or activities in progress.
in 2011, Port Metro Vancouver underwent an internal audit of its enterprise risk management practice. The results of the audit found Port Metro Vancouver’s risk management practice to be well established and formalized, with an appropriate policy, framework and supporting tools in place.
no significant deficiencies were found as a result of this audit. However, Management was provided with some recommendations to improve Port Metro Vancouver’s ERM and incorporate more best practices.
Port Metro Vancouver’s external risk review system is mandated pursuant to our Management Regulations. The most recent of these risk assessments was completed in May 2008, with the next to take place five years later in 2013.
top risksPort Metro Vancouver’s active risks are documented in a corporate risk register. as of December 31, 2011, Management had identified 14 of these risks as the most important ones facing the organization. all fourteen have an inherent rating of Severe but after mitigation are estimated to be High, Moderate or low risks. as set out in the Port Metro Vancouver Risk Management Policy, risks are assessed on their expected likelihood and consequences to determine an overall risk rating. The risks identified as the most important risks facing Port Metro Vancouver at the end of 2011, along with each of their respective mitigation plans, appear in the following table.

PORT METRO VancOUVER 2011 financial REPORT Results and outlook | 27
top Risks mitiGation factoRs
Supply Chain Capacity Imbalances • Port Metro Vancouver’s Monitor and Measure program that tracks productivity of stakeholders across the supply chain
• Stakeholder advocacy to encourage parties to act in the interest of the overall gateway
• Rail, truck traffic and taxi (related to cruise) studies• Stakeholder conflict mediation as required
Inadequate Project Cost estimates • Major Capital Projects Committee of the Board • Port Metro Vancouver’s project management framework
that includes monthly status reporting for large projects• Third-party costing consultants that are hired to assist with
large projects
Strike or Similar disruptive Action leading to a shutdown of the Port
• Public, industry and government advocacy • Support of collaborative and constructive working relationships
between labour and employer, for example, the unprecedented eight-year agreement between the BCmeA and the IlwU local 514 (Foremen) and Canada (longshore)
terrorist Attack • Close working relationship with regulatory agencies and other key stakeholders to ensure the secure passage of goods and passengers
• Dedicated security personnel with security plans and procedures• Insurance• Vulnerability analyses that are regularly reviewed and updated
loss of Community Acceptance • Consultation processes• Investments in local community initiatives• Community Liaison Committees
environmental Impact on Neighbours • Leases with environmental requirements• Shore power at Canada Place• Noise Committee• Collaboration with Metro Vancouver
land not Available to Purchase • Land acquisition strategy • Plans for land reclamation projects
Climate Change • Property insurance• Construction design• Scientific research monitoring program
Inheritance of environmental Issues • Site risk assessments and contamination risk management based on prioritization of issues
• Leading environmental stewardship through remediation and ongoing monitoring
Changes to Policy, regulations and regulatory targets
• Regular monitoring program and supported by communications with various levels of government
• Memorandums of Understanding where appropriate
Internal Fraud • Various internal controls• Employee background checks• Insurance
environmental Spill in Harbour or river • Developed and tested emergency plans• Coordination with stakeholders• 24/7 Operations Centre• Best practices for transportation of liquid bulk
Public liability – death/Injury to members of the Public
• Safety and security assessments• Signs and security devices• Liability, terrorism and property damage insurance
Ineffective Business Planning • Business planning/budgeting process• Submission process for approval of spending• Project management framework
consolidated financial statements prepared in accordance with IFRS
$72m consolidated net income
$1.1bn in total assets

consolidated financialstatements
OUR financial STaTEMEnTS aRE THE fiRST inTERnaTiOnal financial REPORTinG STanDaRDS (ifRS) cOMPlianT STaTEMEnTS fOR PORT METRO VancOUVER — THE cUlMinaTiOn Of YEaRS Of PREPaRaTiOn BY OUR TEaM.

30 | consolidated financial statements PORT METRO VancOUVER 2011 financial REPORT
an audit involves performing procedures to obtain audit evidence about the amounts and disclosures in the consolidated financial statements. The procedures selected depend on our judgment, including the assessment of the risks of material misstatement of the consolidated financial statements, whether due to fraud or error. in making those risk assessments, we consider internal control relevant to the entity’s preparation and fair presentation of the consolidated financial statements in order to design audit procedures that are appropriate in the circumstances, but not for the purpose of expressing an opinion on the effectiveness of the entity’s internal control. an audit also includes evaluating the appropriateness of accounting policies used and the reasonableness of accounting estimates made by Management, as well as evaluating the overall presentation of the consolidated financial statements.
We believe that the audit evidence we have obtained in our audits is sufficient and appropriate to provide a basis for our audit opinion.
OPINIONin our opinion, the consolidated financial statements present fairly, in all material respects, the consolidated financial position of VfPa as at December 31, 2011, December 31, 2010 and January 1, 2010, and its consolidated financial performance and its consolidated cash flows for the years ended December 31, 2011 and December 31, 2010 in accordance with international financial Reporting Standards.
March 27, 2012 Vancouver, canada
To the Honourable Denis lebel, M.P. Minister of Transport, infrastructure and communities
We have audited the accompanying consolidated financial statements of Vancouver fraser Port authority (“VfPa”), which comprise the consolidated statements of financial position as at December 31, 2011, December 31, 2010 and January 1, 2010, the consolidated statements of comprehensive income, changes in equity and cash flows for the years ended December 31, 2011 and December 31, 2010, and notes, comprising a summary of significant accounting policies and other explanatory information.
mANAgemeNt’S reSPONSIBIlIty FOr tHe CONSOlIdAted FINANCIAl StAtemeNtSManagement is responsible for the preparation and fair presentation of these consolidated financial statements in accordance with international financial Reporting Standards, and for such internal control as Management determines is necessary to enable the preparation of consolidated financial statements that are free from material misstatement, whether due to fraud or error.
AUdItOrS’ reSPONSIBIlItyOur responsibility is to express an opinion on these consolidated financial statements based on our audits. We conducted our audits in accordance with canadian generally accepted auditing standards. Those standards require that we comply with ethical requirements and plan and perform the audit to obtain reasonable assurance about whether the consolidated financial statements are free from material misstatement.
independent auditoRs’ RepoRt

PORT METRO VancOUVER 2011 financial REPORT consolidated financial statements | 31
december 31, december 31, january 1, 2011 2010 2010
assetsCurrent assets: Cash and cash equivalents (notes 8 and 11) $ 107,544 $ 64,003 $ 5,995 Short-term investments (note 9) 1,350 - - Accounts receivable and other assets (notes 8 and 10) 39,904 32,935 26,395
148,798 96,938 32,390
Investments in securities (note 9) 2,508 2,232 2,692long-term receivables (note 10) 690 769 1,035Accrued benefit asset (note 14) - 1 355deferred charges 1,338 1,395 1,468Intangible assets (note 16) 1,322 1,834 1,557Investment property (note 15) 29 39 57Property and equipment (note 6) 984,324 974,594 946,327
$ 1,139,009 $ 1,077,802 $ 985,881
liabilities and equity of canada
Current liabilities: Accounts payable and accrued liabilities (note12) $ 39,576 $ 45,023 $ 26,097 Provisions (note 20) 10,466 11,235 7,480 Provision for investment in jV held for sale (note 7) 2,318 - - Short-term borrowing (note 13) 1,800 4,395 122,404 Payments in lieu of taxes 1,882 1,370 3,690 deferred revenue 8,783 10,348 8,268 Current portion of long-term obligations (note 13) 41 41 43
64,866 72,412 167,982
Other employee benefits 1,112 1,282 1,758Accrued benefit liability (note 14) 10,551 7,864 6,783deferred revenue 29,027 29,742 11,172Provisions (note 20) 4,018 3,979 6,468Other deferred amounts 2,964 2,979 2,988long-term obligations (note 13) 99,638 99,608 448
212,176 217,866 197,599
equity of Canada: Contributed capital 150,259 150,259 150,259 retained earnings 776,574 709,677 638,023
926,833 859,936 788,282
$ 1,139,009 $ 1,077,802 $ 985,881
Commitments (note 18)Contingent liabilities (note 19)
the accompanying notes are an integral part of these consolidated financial statements.
Approved on behalf of the Board: robin Silvester, Chief executive Officer richard turner, director
vancouveR fRaseR poRt autHoRityConsolidated Statements of Financial Position(expressed in thousands of dollars)
32 | consolidated financial statements PORT METRO VancOUVER 2011 financial REPORT
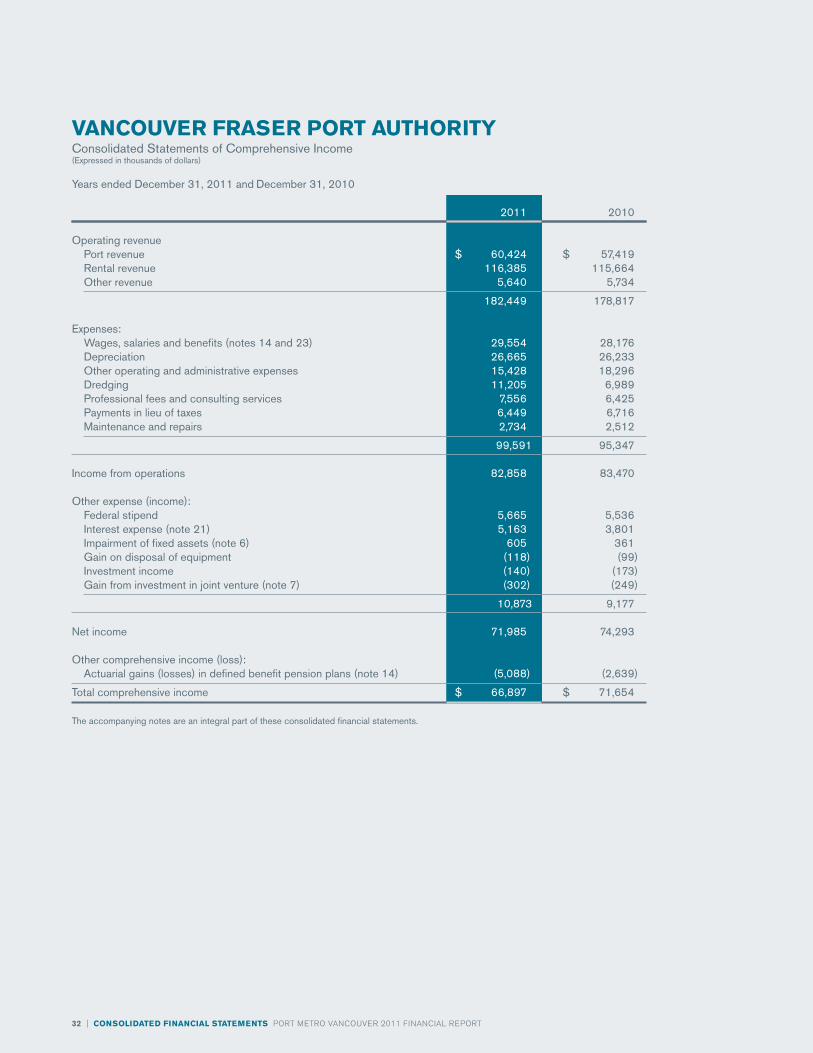
2011 2010
Operating revenue Port revenue $ 60,424 $ 57,419 rental revenue 116,385 115,664 Other revenue 5,640 5,734
182,449 178,817
expenses: wages, salaries and benefits (notes 14 and 23) 29,554 28,176 depreciation 26,665 26,233 Other operating and administrative expenses 15,428 18,296 dredging 11,205 6,989 Professional fees and consulting services 7,556 6,425 Payments in lieu of taxes 6,449 6,716 maintenance and repairs 2,734 2,512
99,591 95,347
Income from operations 82,858 83,470
Other expense (income): Federal stipend 5,665 5,536 Interest expense (note 21) 5,163 3,801 Impairment of fixed assets (note 6) 605 361 gain on disposal of equipment (118) (99) Investment income (140) (173) gain from investment in joint venture (note 7) (302) (249)
10,873 9,177
Net income 71,985 74,293
Other comprehensive income (loss): Actuarial gains (losses) in defined benefit pension plans (note 14) (5,088) (2,639)
total comprehensive income $ 66,897 $ 71,654
the accompanying notes are an integral part of these consolidated financial statements.
vancouveR fRaseR poRt autHoRityConsolidated Statements of Comprehensive Income(expressed in thousands of dollars)
years ended december 31, 2011 and december 31, 2010
PORT METRO VancOUVER 2011 financial REPORT consolidated financial statements | 33
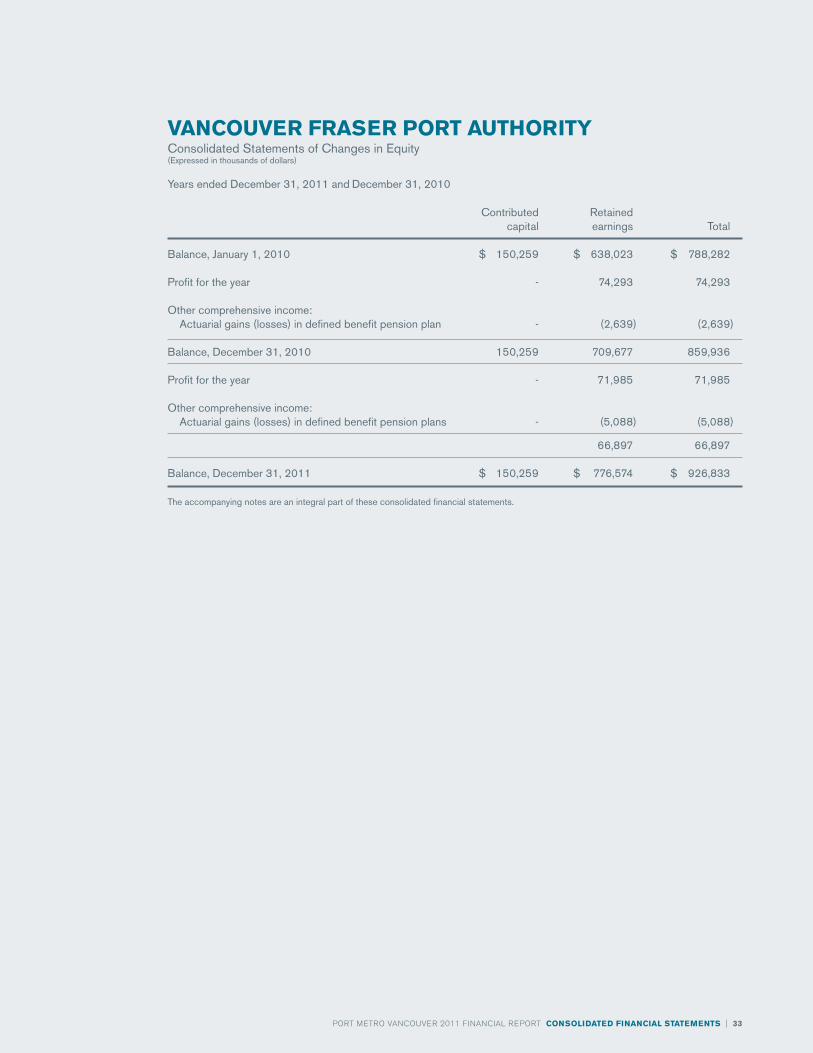
vancouveR fRaseR poRt autHoRityConsolidated Statements of Changes in equity(expressed in thousands of dollars)
years ended december 31, 2011 and december 31, 2010
Contributed retained capital earnings total
Balance, january 1, 2010 $ 150,259 $ 638,023 $ 788,282
Profit for the year - 74,293 74,293
Other comprehensive income: Actuarial gains (losses) in defined benefit pension plan - (2,639) (2,639)
Balance, december 31, 2010 150,259 709,677 859,936
Profit for the year - 71,985 71,985
Other comprehensive income: Actuarial gains (losses) in defined benefit pension plans - (5,088) (5,088)
66,897 66,897
Balance, december 31, 2011 $ 150,259 $ 776,574 $ 926,833
the accompanying notes are an integral part of these consolidated financial statements.

34 | consolidated financial statements PORT METRO VancOUVER 2011 financial REPORT
2011 2010
Cash provided by (used for):
Operating activities: Net income $ 71,985 $ 74,293 Items not involving cash: depreciation 26,665 26,233 Impairment of fixed assets (note 6) 605 361 Impairment of works under construction (note 6) 152 276 loss (gain) on disposal of structures and equipment (118) (99) Other (2,460) (1,267)
96,829 99,797 Changes in non-cash operating working capital: Accounts receivables and other assets (7,146) (6,942) Accounts payables and accrued liabilities (5,446) 18,925 Provisions 1,587 1,266 Payment in lieu of taxes 512 (2,320) deferred revenue (2,279) 20,651
84,057 131,377
Financing activities: Net change in short-term borrowing (2,595) (118,009) Net change in short-term investments (1,350) - Proceeds from investments in long-term securities 1,296 459 Purchases of investments in long-term securities (1,571) - Principal payments on long-term obligations (40) (41) Proceeds from bond issue 70 99,199 long-term receivables 133 175 Principal repayment on lease financing assets 11 61
(4,046) (18,156)
Investing activities: Purchase of property and equipment (36,630) (55,500) Other 160 147 Proceeds on disposal of equipment - 140
(36,470) (55,213)
Increase in cash and cash equivalents 43,541 58,008Cash and cash equivalents, beginning of year 64,003 5,995
Cash and cash equivalents, end of year $ 107,544 $ 64,003
Supplementary information: Interest paid $ 5,238 $ 2,625 Interest received 343 126
the accompanying notes are an integral part of these consolidated financial statements.
vancouveR fRaseR poRt autHoRityConsolidated Statements of Cash Flows(expressed in thousands of dollars)
years ended december 31, 2011 and december 31, 2010

PORT METRO VancOUVER 2011 financial REPORT consolidated financial statements | 35
vancouveR fRaseR poRt autHoRityNotes to Consolidated Financial Statements(tabular amounts expressed in thousands of dollars)
years ended december 31, 2011 and december 31, 2010
1. General information:
Effective January 1, 2008, the three ports: the Vancouver Port authority, the fraser River Port authority, and the north fraser Port authority here after referred to as the legacy Vancouver Port authority (lVPa), legacy fraser River Port authority (lfRPa), and the legacy north fraser Port authority (lnfPa) amalgamated to continue as one port authority, Vancouver fraser Port authority (VfPa).
The VfPa is a non-share capital, financially self-sufficient authority established by the Government of canada pursuant to the Canada Marine Act (cMa). The VfPa’s mission is to lead the growth of canada’s Pacific Gateway in a manner that enhances the well-being of canadians. The VfPa’s jurisdiction covers nearly 600 kilometres of shoreline and extends from Point Roberts at the canada/US border through Burrard inlet to Port Moody and indian arm, and from the mouth of the fraser River, eastward to the fraser Valley, north along the Pitt River to Pitt lake, and includes the north and middle arms of the fraser River.
The VfPa and its wholly owned subsidiaries: canada Place corporation (cPc), Port Metro Vancouver Ventures ltd. (PMVV), Port Metro Vancouver Holdings ltd. (PMVH), Port Metro Vancouver Enterprises ltd. (PMVE), and north fraser Terminals inc. (nfTi) are exempt from income taxes. PMVV has a 50% interest in a joint venture, which is subject to income tax.
2. basis of presentation and significant accounting policies:
(a) Basis of presentation:
These consolidated financial statements have been prepared in accordance with and using accounting policies in compliance with international financial Reporting Standards (ifRS) issued by the international accounting Standards Board (iaSB) and interpretations of the international financial Reporting interpretations committee (ifRic), effective for entities reporting for the years ended December 31, 2011 and 2010.
Previously, the entity prepared its consolidated financial statement in accordance with canadian generally accepted accounting principles (canadian GaaP).
These financial statements have been prepared in accordance with ifRS applicable to the preparation of year-end financial statements, including ifRS 1. Subject to certain transition elections disclosed in note 25, the VfPa has consistently applied the same accounting policies in its opening ifRS statement of financial position at January 1, 2010 (the transition date) and throughout all periods presented, as if these policies had always been in effect. note 25 discloses the impact of the transition to ifRS on the VfPa’s reported financial position, financial performance and cash flows, including the nature and effect of significant changes in accounting policies from those used in the VfPa’s consolidated financial statements for the year ended December 31, 2011 (comparative figures for 2010 in these financial statement have been restated to give effect to these changes).
The policies applied in these consolidated financial statements are based on ifRS issued and effective as at December 31, 2011.
(b) consolidation:
These consolidated financial statements consolidate the accounts of the VfPa and its subsidiaries. all intercompany transactions, balances and unrealized gains and losses from intercompany transactions are eliminated on consolidation.
Subsidiaries are all entities over which the VfPa has the power to govern the financial and operating policies.
(c) Property and equipment:
Property and equipment are stated at cost less accumulated depreciation and impairment losses. The cost of property and equipment includes expenditure that is directly attributable to the acquisition of the asset. The cost of self-constructed assets includes land survey costs, materials and internal engineering costs as well as contractor expenses, any other costs directly attributable to bringing the asset to a working condition for its intended use, and the costs of dismantling and removing the items and restoring the site on which they are located. costs are capitalized until such time as the asset is ready for use in the manner intended by Management.
36 | consolidated financial statements PORT METRO VancOUVER 2011 financial REPORT
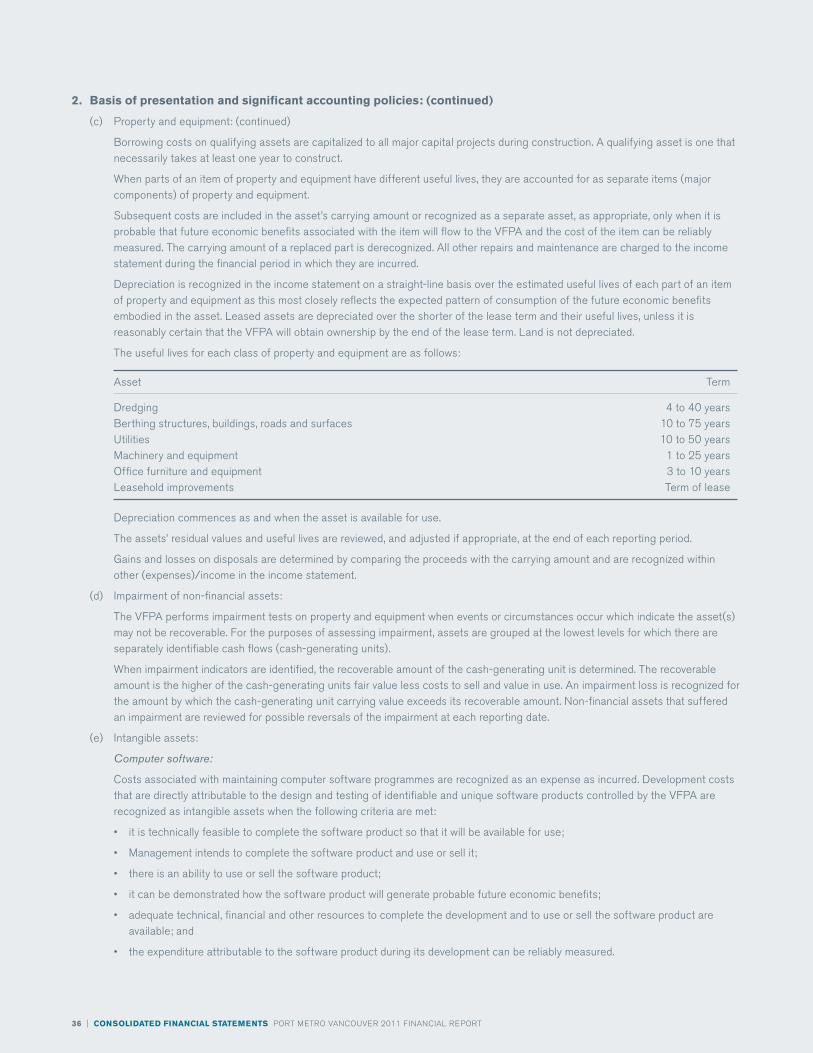
2. basis of presentation and significant accounting policies: (continued)
(c) Property and equipment: (continued)
Borrowing costs on qualifying assets are capitalized to all major capital projects during construction. a qualifying asset is one that necessarily takes at least one year to construct.
When parts of an item of property and equipment have different useful lives, they are accounted for as separate items (major components) of property and equipment.
Subsequent costs are included in the asset’s carrying amount or recognized as a separate asset, as appropriate, only when it is probable that future economic benefits associated with the item will flow to the VfPa and the cost of the item can be reliably measured. The carrying amount of a replaced part is derecognized. all other repairs and maintenance are charged to the income statement during the financial period in which they are incurred.
Depreciation is recognized in the income statement on a straight-line basis over the estimated useful lives of each part of an item of property and equipment as this most closely reflects the expected pattern of consumption of the future economic benefits embodied in the asset. leased assets are depreciated over the shorter of the lease term and their useful lives, unless it is reasonably certain that the VfPa will obtain ownership by the end of the lease term. land is not depreciated.
The useful lives for each class of property and equipment are as follows:
asset Term
Dredging 4 to 40 yearsBerthing structures, buildings, roads and surfaces 10 to 75 yearsUtilities 10 to 50 yearsMachinery and equipment 1 to 25 yearsOffice furniture and equipment 3 to 10 yearsleasehold improvements Term of lease
Depreciation commences as and when the asset is available for use.
The assets’ residual values and useful lives are reviewed, and adjusted if appropriate, at the end of each reporting period.
Gains and losses on disposals are determined by comparing the proceeds with the carrying amount and are recognized within other (expenses)/income in the income statement.
(d) impairment of non-financial assets:
The VfPa performs impairment tests on property and equipment when events or circumstances occur which indicate the asset(s) may not be recoverable. for the purposes of assessing impairment, assets are grouped at the lowest levels for which there are separately identifiable cash flows (cash-generating units).
When impairment indicators are identified, the recoverable amount of the cash-generating unit is determined. The recoverable amount is the higher of the cash-generating units fair value less costs to sell and value in use. an impairment loss is recognized for the amount by which the cash-generating unit carrying value exceeds its recoverable amount. non-financial assets that suffered an impairment are reviewed for possible reversals of the impairment at each reporting date.
(e) intangible assets:
Computer software:
costs associated with maintaining computer software programmes are recognized as an expense as incurred. Development costs that are directly attributable to the design and testing of identifiable and unique software products controlled by the VfPa are recognized as intangible assets when the following criteria are met:
• itistechnicallyfeasibletocompletethesoftwareproductsothatitwillbeavailableforuse;
• Managementintendstocompletethesoftwareproductanduseorsellit;
• thereisanabilitytouseorsellthesoftwareproduct;
• itcanbedemonstratedhowthesoftwareproductwillgenerateprobablefutureeconomicbenefits;
• adequatetechnical,financialandotherresourcestocompletethedevelopmentandtouseorsellthesoftwareproductareavailable; and
• theexpenditureattributabletothesoftwareproductduringitsdevelopmentcanbereliablymeasured.

PORT METRO VancOUVER 2011 financial REPORT consolidated financial statements | 37
Directly attributable costs that are capitalized as part of the software product include the software development employee costs.
Other development expenditures that do not meet these criteria are recognized as an expense as incurred. Development costs previously recognized as an expense are not recognized as an asset in a subsequent period.
computer software development costs recognized as assets are amortized over their estimated useful lives, not exceeding five years.
(f) cash and cash equivalents:
cash and cash equivalents include cash on deposit with banks and short-term deposits with maturities of ninety days or less when acquired.
(g) Trade and other receivables:
Trade and other receivables are recognized initially at fair value and subsequently measured at amortized cost using the effective interest method, less provision for impairment. a provision for impairment of trade receivables is established when there is objective evidence that the VfPa will not be able to collect all amounts due according to the original terms of the receivables. Significant financial difficulties of the debtor, probability that the debtor will enter bankruptcy or financial reorganization, and default or delinquency in payments (more than 120 days overdue) are considered indicators that the trade receivable is impaired. The amount of the provision is the difference between the asset’s carrying amount and the present value of estimated future cash flows, discounted at the original effective interest rate. The carrying amount of the asset is reduced through the use of an allowance account, and the amount of the loss is recognized in the income statement. When a trade receivable is uncollectible, it is written off against the allowance account for trade receivables. Subsequent recoveries of amounts previously written off are credited against the income statement.
(h) Trade payables:
accounts payable and accrued liabilities are recognized initially at fair value and subsequently measured at amortized. accounts payable are classified as current liabilities if payment is due within one year or less. if not, they are presented as non-current liabilities.
(i) Borrowings:
Borrowings are classified as other financial liabilities and are recognized initially at fair value, net of transaction costs incurred. Borrowings are subsequently stated at amortized cost; any difference between the proceeds (net of transaction costs) and the redemption value is recognized in the income statement over the period of the borrowings using the effective interest rate method.
Short-term debt and current portions of long-term bonds are classified as current liabilities while non-current portion of long-term bonds are classified as long-term liabilities.
(j) Payments in lieu of taxes (PilT):
Payments are estimated by the VfPa in accordance with the Payments in Lieu of Taxes Act. accruals are re-evaluated each year and changes, if any, are made in the current period’s financial statements based on the best available information, including the results of audits by an independent consulting firm. in 2010, the VfPa maintained three different PilT practices for the legacy port authorities. lVPa paid PilT on both land and submerged land, lfRPa paid PilT on land and lnfPa did not pay PilT.
Effective in 2011, the VfPa consolidated the legacy PilT practices. in 2011, PilT took into consideration the value of all unoccupied (dry) land and certain submerged lands in the Burrard inlet, fraser River, and Roberts Bank (with the most notable exceptions being indian arm and the navigation channels).
(k) financial assets:
(i) classification:
The VfPa’s classification of financial assets depends on the purpose for which the financial assets were acquired. Management determines the classification of its financial assets at initial recognition.
(a) Held to maturity investments:
Held to maturity investments are non-derivative financial assets with fixed or determinable payments and fixed maturity that the entity has the positive intention and ability to hold to maturity. The VfPa’s held to maturity financial assets comprise its investment in securities (Government of canada treasury bills, debentures, bonds and bankers’ acceptances).

38 | consolidated financial statements PORT METRO VancOUVER 2011 financial REPORT
2. basis of presentation and significant accounting policies: (continued)
(k) financial assets: (continued)
(i) classification: (continued)
(b) loans and receivables:
loans and receivables are non-derivative financial assets with fixed or determinable payments that are not quoted in an active market. They are included in current assets, except for maturities greater than 12 months after the balance sheet date. These are classified as non-current assets.
The VfPa’s cash and cash equivalents, accounts receivable and other assets and long-term receivables are classified as loans and receivables. loans and receivables are carried at amortized cost.
The VfPa assesses at each balance sheet date whether there is objective evidence that a financial asset or a group of financial assets is impaired.
(ii) impairment of financial assets at amortized cost (excluding accounts receivable):
The VfPa assesses at the end of each reporting period whether there is objective evidence that a financial asset or a group of financial assets is impaired. a financial asset or a group of financial assets is impaired and impairment losses are incurred only if there is objective evidence of impairment as a result of one or more events that occurred after the initial recognition of the asset (a ‘loss event’) and that loss event (or events) has an impact on the estimated future cash flows of the financial asset or a group of financial assets that can be reliably estimated.
The criteria that the VfPa uses to determine that there is objective evidence of an impairment loss include:
• Significantfinancialdifficultyoftheissuerorobligor;
• Abreachofcontract,suchasadefaultordelinquencyininterestorprincipalpayments;
• Itbecomesprobablethattheborrowerwillenterbankruptcyorotherfinancialreorganization;
• Thedisappearanceofanactivemarketforthatfinancialassetbecauseoffinancialdifficulties;or
• Observabledataindicatingthatthereisameasurabledecreaseintheestimatedfuturecashflowsfromaportfoliooffinancial assets since the initial recognition of those assets, although the decrease cannot yet be identified with the individual financial assets in the portfolio, including:
(a) adverse changes in the payment status of borrowers in the portfolio; and
(b) national or local economic conditions that correlate with defaults on the assets in the portfolio.
The amount of the loss is measured as the difference between the asset’s carrying amount and the present value of estimated future cash flows (excluding future credit losses that have not been incurred) discounted at the financial asset’s original effective interest rate. The asset’s carrying amount of the asset is reduced and the amount of the loss is recognized in the income statement. if a loan or held-to-maturity investment has a variable interest rate, the discount rate for measuring any impairment loss is the current effective interest rate determined under the contract. as a practical expedient, the VfPa may measure impairment on the basis of an instrument’s fair value using an observable market price.
if, in a subsequent period, the amount of the impairment loss decreases and the decrease can be related objectively to an event occurring after the impairment was recognized (such as an improvement in the debtor’s credit rating), the reversal of the previously recognized impairment loss is recognized in the income statement.
(l) Revenue recognition:
The VfPa recognizes lease revenue on a straight-line basis over the term of the lease where collection is reasonably assured. Revenue from wharfage and berthage are recognized when services are substantially rendered and collection is reasonably assured. Deferred revenue represents cash received in advance of the due date.
(m) Employee future benefits:
The VfPa has three benefit plans (lVPa, lfRPa, lnfPa), where employees from the legacy ports have remained in their respective benefit plans upon amalgamation. Employees hired after January 1, 2008 are eligible for the lVPa plan. The three benefit plans are described in detail in note 14.
The VfPa has both defined benefit and defined contribution plans. Under the defined contribution plan, employees may contribute certain amounts annually with the authority providing matching contributions.
a defined benefit plan is a pension plan that is not a defined contribution plan.

PORT METRO VancOUVER 2011 financial REPORT consolidated financial statements | 39
The liability recognized in the balance sheet in respect of defined benefit pension plans is the present value of the defined benefit obligation at the end of the reporting period less the fair value of plan assets. The defined benefit obligation is calculated annually by independent actuaries using the projected unit credit method. The present value of the defined benefit obligation is determined by discounting the estimated future cash outflows using interest rates of high-quality corporate bonds that are denominated in the currency in which the benefits will be paid, and that have terms to maturity approximating to the terms of the related pension liability.
The measurement date for the defined benefit plans is December 31.
actuarial gains and losses arising from experience adjustments and changes in actuarial assumptions are charged or credited to equity in other comprehensive income in the period in which they arise.
Past-service costs are recognized immediately, unless the changes to the pension plan are conditional on the employees remaining in service for a specified period of time (the vesting period). in this case, the past service costs are amortized on a straight-line basis over the vesting period.
all employees who retire from the authority and who receive a Public Service Superannuation pension are eligible for extended health care coverage. This coverage is provided at no additional cost to the authority.
The authority also maintains other non-funded benefits for eligible employees. The authority accrues in its accounts annually the estimated liabilities for severance pay, annual leave and overtime compensatory leave, which are payable to its employees in subsequent years.
(n) Provisions:
Provisions for environmental restoration, restructuring costs and legal claims are recognized when the VfPa has a legal or constructive obligation as a result of past events, it is probable that an outflow of resources will be required to settle the obligation, and the amount can be reliably estimated. Provisions are not recognized for future operating losses.
Provisions are measured at the present value of the expenditures expected to be required to settle the obligation using a rate that reflects current market assessments of the time value of money. The increase in the provision due to passage of time is recognized as interest expense.
(o) leases:
a lease is an arrangement whereby the lessor conveys to the lessee in return for a payment, or series of payments, the right to use an asset for an agreed period of time. leases in which a significant portion of the risks and rewards of ownership are retained by the VfPa are classified as operating leases.
The VfPa leases certain property and equipment. leases of property and equipment are classified as operating leases where the VfPa does not have substantially all the risks and rewards of ownership. Operating lease rentals are recognized on a straight-line basis over the period of the lease.
Payments made under operating leases (net of any incentives received from the lessor) are charged to the income statement on a straight-line basis over the period of the lease.
(p) non-monetary transactions:
all non-monetary transactions are measured at the fair value of the asset surrendered or the asset received, whichever is more reliable, unless the transaction lacks commercial substance or the fair value cannot be reliably established. The commercial substance requirement is met when the future cash flows are expected to change significantly as a result of the transaction. When the fair value of a non-monetary transaction cannot be accurately measured or the transaction lacks commercial substance, it is recorded at the carrying value of the asset given up adjusted by the fair value of any monetary consideration received or given.
(q) River dredgeate and dredging:
costs of removing river dredgeate that is in the nature of maintenance of navigable waterways into a standard of depth are expensed. However, costs of river dredgeate removed from the waterway for maintenance, placed on the VfPa property and which betters that property are capitalized.
Dredging costs that deepen navigable waterways to establish a new standard of depth for future economic benefit are capitalized. Proceeds from the sale of river dredgeate derived from maintenance, and government funding for maintenance of the navigable waterway, are recorded as a reduction of the expense. if proceeds are derived from dredgeate originally placed on the VfPa property as a betterment, the proceeds are recorded as a reduction of property and equipment.
(r) Deferred charges:
Deferred charges relate to lease transaction costs which are amortized over the term of the agreement.

40 | consolidated financial statements PORT METRO VancOUVER 2011 financial REPORT
2. basis of presentation and significant accounting policies: (continued)
(s) investment properties:
investment properties are stated at depreciated cost reduced by accumulated impairment losses. Transaction costs are included on initial measurement. The fair values of investment properties are described in note 15. These are assessed using internationally accepted valuation methods, such as taking comparable properties as a guide to the current market prices. like property and equipment, investment properties are depreciated using the straight-line method.
(t) Joint ventures:
a joint venture is a joint arrangement that is jointly controlled by the venturers whereby the venturers do not have rights to individual assets or obligations for expenses of the venture. Rather, each venturer is entitled to a share of the outcome (e.g., profit or loss) of the activities of the joint venture.
investments in joint ventures are accounted for using the equity method of accounting and are initially recognized at cost. The VfPa’s share of its joint ventures’ post-acquisition profits or losses are recognized in the income statement and its share of post-acquisition movements in reserves is recognized in reserves. The cumulative post-acquisition movements are adjusted against the carrying amount of the investment. When the VfPa’s share of losses in a joint venture equals or exceeds its interest in the joint venture, including any other unsecured receivables, the VfPa does not recognize further losses, unless it has incurred obligations or made payments on behalf of the joint venture.
Unrealized gains on transactions between the VfPa and its joint ventures are eliminated to the extent of the VfPa’s interest in the joint venture. Unrealized losses are also eliminated unless the transaction provides evidence of an impairment of the asset transferred. The accounting policies of joint ventures have been changed where necessary to ensure consistency with the policies adopted by the VfPa.
(u) federal stipend:
Under the Canada Marine Act, the VfPa is obligated to pay annually to the Minister of Transport, infrastructure and communities a charge to maintain its letter patent in good standing. The charge is calculated by reference to gross revenues at rates varying between 2% and 6% depending on the gross amount determined.
(v) income taxes:
The VfPa, through PMVV, its wholly owned subsidiary, has an interest in a taxable joint venture. The joint venture uses the asset and liability method of accounting for income taxes.
(w) Government grants:
Government grants, including non-monetary grants at fair value, are not recognized until there is reasonable assurance that the VfPa will comply with the conditions attaching to them and the grants will be received. Government grants related to assets are presented in the statement of financial position by deducting the grant in arriving at the carrying amount of the asset.
3. adoption of new accounting policies:
ifRS 9 Financial instruments (“ifRS 9”) was issued in november 2009 and replaced the guidance in iaS 39 Financial Instruments: Recognition and Measurement, on the classification and measurement of financial assets and in October 2010 the iaSB published amendments to ifRS 9. Under ifRS 9, financial assets are measured at amortized cost or fair value, which will replace the multiple rules under iaS 39. along with simplifying the categories, ifRS 9 aims to ensure changes in the credit risk of liabilities that an entity chooses to measure at fair value will not cause volatility in net income. in December 2011, the iaSB issued an amendment to ifRS 9 to defer the mandatory effective date to annual periods beginning on or after January 1, 2015.
VfPa intends to adopt ifRS 9 in its financial statements for the annual period beginning on January 1, 2015. The extent of the impact of adoption of ifRS 9 has not yet been determined.
ifRS 10 Consolidated Financial Statements (“ifRS 10”) replaces the guidance in iaS27 Consolidated and Separate financial Statements (“iaS 27”) and Sic-12 Consolidation – Special Purpose Entities (“Sic-12”). iaS 27(2008) survives as iaS 27(2011) Separate Financial Statements, only to carry forward the existing accounting requirements for separate financial statements. ifRS 10 provides a single model to be applied in the control analysis for all investees, including entities that currently are Special Purpose Entities in the scope of Sic-12.
VfPa intends to adopt ifRS 10 in its financial statements for the annual period beginning on January 1, 2013. VfPa does not expect ifRS 10 to have a material impact on the financial statements.

PORT METRO VancOUVER 2011 financial REPORT consolidated financial statements | 41
ifRS 11 Joint Arrangements (“ifRS 11”) replaces the guidance in iaS 31 Interests in Joint Ventures (“iaS 31”).
Under ifRS 11, joint arrangements are classified as either joint operations or joint ventures. ifRS 11 essentially carves out of previous jointly controlled entities, those arrangements which although structured through a separate vehicle, such separation is ineffective and the parties to the arrangement have rights to the assets and obligations for the liabilities and are accounted for as joint operations in a fashion consistent with jointly controlled assets/operations under iaS 31. in addition, under ifRS 11 joint ventures are stripped of the free choice of equity accounting or proportionate consolidation; these entities must now use the equity method.
in anticipation of this change in the accounting standard VfPa has elected to use the equity method to account for its joint venture as permitted under iaS 31 and therefore does not require early adoption of ifRS 11.
ifRS 12 Disclosure of Interests in Other Entities (“ifRS 12”) contains the disclosure requirements for entities that have interests in subsidiaries, joint arrangements (i.e., joint operations or joint ventures), associates and/or unconsolidated structured entities. interests are widely defined as contractual and non-contractual involvement that exposes an entity to variability of returns from the performance of the other entity. The required disclosures aim to provide information in order to enable users to evaluate the nature of, and the risks associated with, an entity’s interest in other entities, and the effects of those interests on the entity’s financial position, financial performance and cash flows.
VfPa intends to adopt ifRS 12 in its financial statements for the annual period beginning on January 1, 2013. VfPa does not expect the amendments to have a material impact on the financial statements, because of the nature of the company’s interests in other entities.
ifRS 13 Fair value Measurement (“ifRS 13”) replaces the fair value measurement guidance contained in individual ifRSs with a single source of fair value measurement guidance. it defines fair value as the price that would be received to sell an asset or paid to transfer a liability in an orderly transaction between market participants at the measurement date, i.e., an exit price. The standard also establishes a framework for measuring fair value and sets out disclosure requirements for fair value measurements to provide information that enables financial statement users to assess the methods and inputs used to develop fair value measurements and, for recurring fair value measurements that use significant unobservable inputs (level 3), the effect of the measurements on profit or loss or other comprehensive income. ifRS 13 explains ‘how’ to measure fair value when it is required or permitted by other ifRSs. ifRS 13 does not introduce new requirements to measure assets or liabilities at fair value, nor does it eliminate the practicability exceptions to fair value measurements that currently exist in certain standards.
VfPa intends to adopt ifRS 13 in its financial statements for the annual period beginning on January 1, 2013. VfPa does not expect the amendments to have a significant impact on the financial statements.
iaS 19 Employee benefits (“iaS 19”) modified accounting for pensions and other post-retirement and post-employment benefits and impact corporate financial reporting, including reported net profit. in June 2011 the iaSB published an amended version of iaS 19 Employee Benefits. The amendment is generally applied retrospectively with certain exceptions. The amendments require the following:
• Recognitionofactuarialgainsandlossesimmediatelyinothercomprehensiveincome
• Fullrecognitionofpastservicecostsimmediatelyinprofitorloss
• Recognitionofexpectedreturnonplanassetsinprofitorlosstobecalculatedbasedontherateusedtodiscountthedefinedbenefit obligation
• Additionaldisclosuresthatexplainthecharacteristicsoftheentity’sdefinedbenefitplansandrisksassociatedwiththeplans,aswellas disclosures that describe how defined benefit plans may affect the amount, timing and uncertainty of future cash flows, and details of any asset-liability match strategies used to manage risks.
The amendments also impact termination benefits, which would now be recognized at the earlier of when the entity recognizes costs for a restructuring within the scope of iaS 37 Provisions, and when the entity can no longer withdraw the offer of the termination benefits.
in anticipation of this change in accounting standard VfPa has early adopted the standard and has recognized the actuarial gains and losses immediately in other comprehensive income.
iaS 28 Investments in Associates and joint Ventures (“iaS 28”) modified the existing standard as issue in 2008 and then in May 2011, the iaSB issued amendments to iaS 28 as follows:
• Associates and joint ventures held for sale. ifRS 5 Non-current Assets Held for Sale and Discontinued Operations applies to an investment, or a portion of an investment, in an associate or a joint venture that meets the criteria to be classified as held for sale. for any retained portion of the investment that has not been classified as held for sale, the equity method is applied until disposal of the portion held for sale. after disposal, any retained interest is accounted for using the equity method if the retained interest continues to be an associate or a joint venture.

42 | consolidated financial statements PORT METRO VancOUVER 2011 financial REPORT
3. adoption of new accounting policies: (continued)
• Changes in interests held in associates and joint ventures. Previously, iaS 28 and iaS 31 specified that the cessation of significant influence or joint control triggered re-measurement of any retained stake in all cases with gain recognition in profit or loss, even if significant influence was succeeded by joint control. iaS 28 now requires that in such scenarios the retained interest in the investment is not re-measured.
VfPa intends to adopt the amendments in its financial statements for the annual period beginning on January 1, 2013. VfPa does not expect the amendments to iaS 28 to have a material impact on the financial statements.
4. financial risk management:
financial risk factors:
The VfPa utilizes financial instruments in the normal course of business and takes action to mitigate the associated risks. The use of financial instruments exposes the VfPa to market risk, credit risk and liquidity risk. Management reviews these risks on an ongoing basis to ensure that the risks are appropriately managed. Other than as described below, Management does not consider any other risks to be significant to the VfPa.
(a) fair value:
The carrying values of accounts receivable and other assets, accounts payable and accrued liabilities, short-term investments, investments in securities, and payments in lieu of tax approximate their fair values due to the short term to maturity of these instruments.
The carrying values of drawings on available credit facilities approximate their fair values, as they bear floating interest rates that approximate market rates and have short-term maturity.
The long-term receivables and the mortgages included in long-term obligations are recorded at amortized cost which approximates their fair values.
as of December 31, 2011, the market value of the Series a Debentures was $111.5 million based on a 10-year Government of canada bond and a market interest rate of 3.19%.
(b) interest risk:
The VfPa’s interest bearing financial assets are made up of term deposits, bonds, debentures, bankers’ acceptance and long-term receivables which bear interest at fixed rates. The VfPa’s debt portfolio comprises both fixed (mortgages) and variable rate (bankers’ acceptance) debt instruments. The VfPa minimizes its interest rate risk by monitoring the movements of the interest rate, the credit worthiness of its customers and the cash flows.
The VfPa has arranged a $175 million credit facility. The funds are available to the VfPa by way of adjusted prime rate-based loans. The VfPa normally enters into Bankers’ acceptance for periods ranging from one to six months and could, therefore, be exposed to fluctuations in interest rates at the Bankers’ acceptance expiration.
The Series a Debentures of $100 million has a fixed interest rate of 4.63%. With the fixed rate these interest payments are known with certainty for the 10-year bond period and are incorporated into the VfPa’s monthly cash flow forecasts.
for the year ended December 31, 2011, with other variables unchanged, there is no material effect on the net cash flows for an interest rate change of 1% per annum related to credit facilities.
(c) Market risk:
leasing activities encompass market risk for lease cost escalation and possible business failures and leasing disruptions of tenants due to specific and general economic conditions, business interruption and other operating and financial conditions related to tenants.
The VfPa’s participation rental revenue (approximately 14% of total operating revenue) can be indirectly affected by fluctuations in demands for various commodities and finished products, as a portion of the revenue is based on volume throughput.
(d) credit risk:
credit risk is the risk of financial loss to the VfPa if a customer or counterparty defaults on their contractual obligations. credit risk is managed on the VfPa basis, except for credit risk relating to accounts receivable balances. credit risk arises from cash and cash equivalents, deposits with banks and financial institutions, as well as credit exposures to customers, including outstanding receivables. The VfPa limits its exposure to credit loss by regularly monitoring the credit worthiness of customers and debtors. The VfPa believes it has adequately provided for any exposure to potential credit loss.
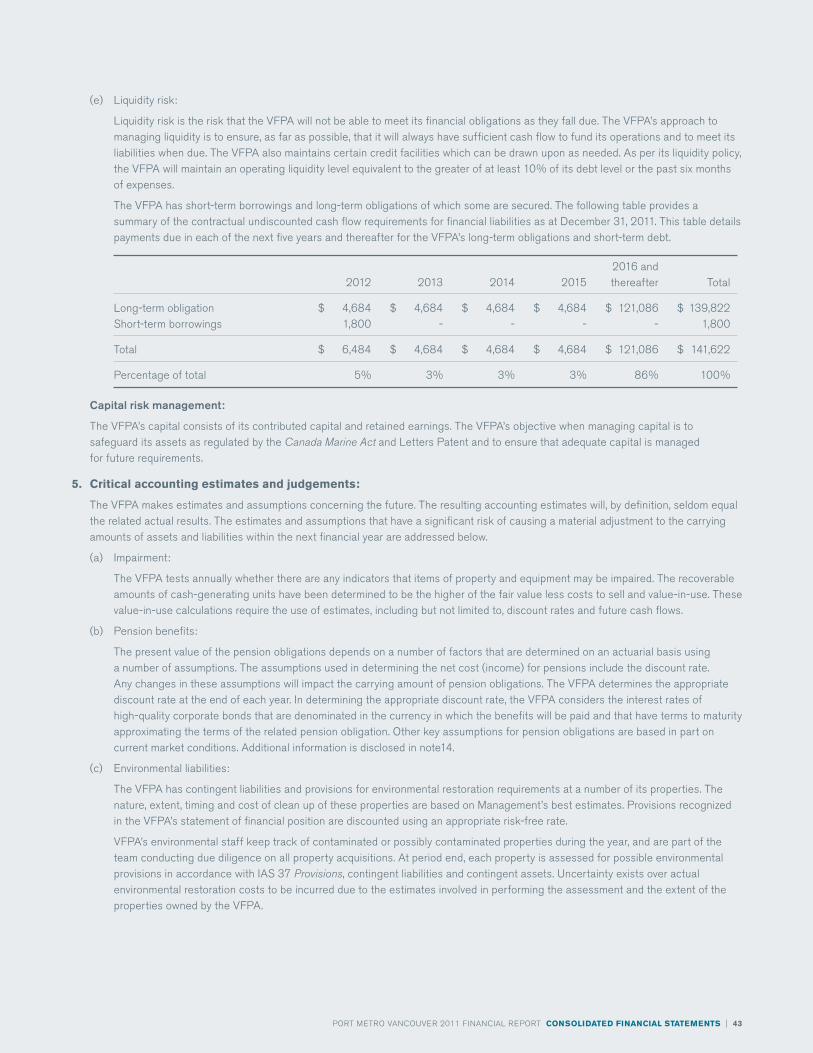
PORT METRO VancOUVER 2011 financial REPORT consolidated financial statements | 43
(e) liquidity risk:
liquidity risk is the risk that the VfPa will not be able to meet its financial obligations as they fall due. The VfPa’s approach to managing liquidity is to ensure, as far as possible, that it will always have sufficient cash flow to fund its operations and to meet its liabilities when due. The VfPa also maintains certain credit facilities which can be drawn upon as needed. as per its liquidity policy, the VfPa will maintain an operating liquidity level equivalent to the greater of at least 10% of its debt level or the past six months of expenses.
The VfPa has short-term borrowings and long-term obligations of which some are secured. The following table provides a summary of the contractual undiscounted cash flow requirements for financial liabilities as at December 31, 2011. This table details payments due in each of the next five years and thereafter for the VfPa’s long-term obligations and short-term debt.
2016 and 2012 2013 2014 2015 thereafter Total
long-term obligation $ 4,684 $ 4,684 $ 4,684 $ 4,684 $ 121,086 $ 139,822Short-term borrowings 1,800 - - - - 1,800
Total $ 6,484 $ 4,684 $ 4,684 $ 4,684 $ 121,086 $ 141,622
Percentage of total 5% 3% 3% 3% 86% 100%
Capital risk management:
The VfPa’s capital consists of its contributed capital and retained earnings. The VfPa’s objective when managing capital is to safeguard its assets as regulated by the Canada Marine Act and letters Patent and to ensure that adequate capital is managed for future requirements.
5. critical accounting estimates and judgements:
The VfPa makes estimates and assumptions concerning the future. The resulting accounting estimates will, by definition, seldom equal the related actual results. The estimates and assumptions that have a significant risk of causing a material adjustment to the carrying amounts of assets and liabilities within the next financial year are addressed below.
(a) impairment:
The VfPa tests annually whether there are any indicators that items of property and equipment may be impaired. The recoverable amounts of cash-generating units have been determined to be the higher of the fair value less costs to sell and value-in-use. These value-in-use calculations require the use of estimates, including but not limited to, discount rates and future cash flows.
(b) Pension benefits:
The present value of the pension obligations depends on a number of factors that are determined on an actuarial basis using a number of assumptions. The assumptions used in determining the net cost (income) for pensions include the discount rate. any changes in these assumptions will impact the carrying amount of pension obligations. The VfPa determines the appropriate discount rate at the end of each year. in determining the appropriate discount rate, the VfPa considers the interest rates of high-quality corporate bonds that are denominated in the currency in which the benefits will be paid and that have terms to maturity approximating the terms of the related pension obligation. Other key assumptions for pension obligations are based in part on current market conditions. additional information is disclosed in note14.
(c) Environmental liabilities:
The VfPa has contingent liabilities and provisions for environmental restoration requirements at a number of its properties. The nature, extent, timing and cost of clean up of these properties are based on Management’s best estimates. Provisions recognized in the VfPa’s statement of financial position are discounted using an appropriate risk-free rate.
VfPa’s environmental staff keep track of contaminated or possibly contaminated properties during the year, and are part of the team conducting due diligence on all property acquisitions. at period end, each property is assessed for possible environmental provisions in accordance with iaS 37 Provisions, contingent liabilities and contingent assets. Uncertainty exists over actual environmental restoration costs to be incurred due to the estimates involved in performing the assessment and the extent of the properties owned by the VfPa.

44 | consolidated financial statements PORT METRO VancOUVER 2011 financial REPORT
6. property and equipment:
Other property:
land building Office and Dredging Machinery furniture berthing roads and and construction and structures surfaces equipment in progress Utilities equipment Total
January 1, 2010cost $ 152,407 $ 14,739 $ 61,523 $ 3,039 $ 573 $ 17,248 $ 249,529accumulated depreciation and impairment (5,874) (5,269) (42,386) - (167) (14,379) (68,075)
net book value $ 146,533 $ 9,470 $ 19,137 $ 3,039 $ 406 $ 2,869 $ 181,454
Year ended December 31, 2010additions 375 - 1,344 5,711 - 1,097 8,527Transferred to intangible assets - - - (923) - - (923)Disposals - - (28) (10) - - (38)impairment - - (49) - - (273) (322)Depreciation (322) (1,403) (3,043) - (17) (681) (5,466)
53 (1,403) (1,776) 4,778 (17) 143 1,778
closing net book value 146,586 8,067 17,361 7,817 389 3,012 183,232
December 31, 2010cost $ 152,782 $ 14,739 $ 62,806 $ 7,817 $ 573 $ 17,868 $ 256,585accumulated depreciation and impairment (6,196) (6,672) (45,445) - (184) (14,856) (73,353)
net book value $ 146,586 $ 8,067 $ 17,361 $ 7,817 $ 389 $ 3,012 $ 183,232
Year ended December 31, 2011additions 1,671 8,251 806 (6) - 1,384 12,106Transferred to intangible assets - - - (141) - - (141)Disposals cost - - (14,374) - - - (14,374) accumulated depreciation - - 14,374 - - - 14,374impairment - - (1) - - (458) (459)Depreciation (330) (1,514) (2,993) - (17) (699) (5,553)
1,341 6,737 (2,188) (147) (17) 227 5,953
closing net book value $ 147,927 $ 14,804 $ 15,173 $ 7,670 $ 372 $ 3,239 $ 189,185
December 31, 2011cost $ 154,453 $ 22,990 $ 49,238 $ 7,670 $ 573 $ 19,252 $ 254,176accumulated depreciation and impairment (6,526) (8,186) (34,065) - (201) (16,013) (64,991)
net book value $ 147,927 $ 14,804 $ 15,173 $ 7,670 $ 372 $ 3,239 $ 189,185

PORT METRO VancOUVER 2011 financial REPORT consolidated financial statements | 45
federal property:
land building and Dredging Machinery berthing roads and and construction structures surfaces equipment in progress Utilities Other Total
January 1, 2010
cost $ 594,046 $ 182,531 $ - $ 243,530 $ 92,844 $ 1,261 $ 1,114,212accumulated depreciation and impairment (198,590) (104,144) - - (46,122) (483) (349,339)
net book value $ 395,456 $ 78,387 $ - $ 243,530 $ 46,722 $ 778 $ 764,873
Year ended December 31, 2010additions 238,985 7,762 - (202,691) 2,918 - 46,974Disposals - (77) - (266) - - (343)impairment (40) - - - - - (40)Depreciation (11,041) (5,658) - - (3,349) (54) (20,102)
227,904 2,027 - (202,957) (431) (54) 26,489
closing net book value $ 623,360 $ 80,414 $ $ 40,573 $ 46,291 $ 724 $ 791,362
December 31, 2010cost $ 833,031 $ 190,180 $ - $ 40,573 $ 95,762 $ 1,261 $ 1,160,807accumulated depreciation and impairment (209,671) (109,766) - - (49,471) (537) (369,445)
net book value $ 623,360 $ 80,414 $ - $ 40,573 $ 46,291 $ 724 $ 791,362Year ended December 31, 2011additions 6,902 8,801 - 3,400 5,421 - 24,524Disposals - - - (153) - - (153)impairment (145) - - - - - (145)Depreciation (11,232) (5,783) - - (3,382) (52) (20,449)
(4,475) 3,018 - 3,247 2,039 (52) 3,777
closing net book value $ 618,885 $ 83,432 $ - $ 43,820 $ 48,330 $ 672 $ 795,139
December 31, 2011cost $ 839,933 $ 198,981 $ - $ 43,820 $ 101,183 $ 1,261 $ 1,185,178accumulated depreciation and impairment (221,048) (115,549) - - (52,853) (589) (390,039)
net book value $ 618,885 $ 83,432 $ - $ 43,820 $ 48,330 $ 672 $ 795,139

46 | consolidated financial statements PORT METRO VancOUVER 2011 financial REPORT
6. property and equipment: (continued)
federal property and other property belong to canada. federal property is registered to Her Majesty The Queen while other property is registered to the VfPa. The properties are managed by the VfPa as an agent of the crown. The VfPa is responsible for performing necessary maintenance, restoration and replacement of federal property it manages. federal property cannot be pledged as collateral while other property can be pledged as collateral.
The VfPa receives funding from the Government of canada, Transport canada and the Province of Bc to be used to reimburse the VfPa for the purchase and construction of infrastructure, shore power and security assets. During 2011, the VfPa received $19,454,811 in funding (2010 - $1,782,818).
interest capitalized in the year amounted to nil (2010 - nil).
completion of an asset impairment analysis performed in 2011 indicated assets were impaired. accordingly, $605,000 was recognized as an impairment expense during 2011 (2010 - $361,000).
it is VfPa’s policy to review work under construction annually to assess the potential of the capital expenditures to provide future benefits. in 2011, several studies totalling $152,000 (2010 - $276,000) relating to potential capital projects were written off.
Leased property and equipment:
The category of land, buildings and berthing structures includes property leased by the VfPa to third parties under operating leases with the following carrying amounts:
2011 2010
cost $ 966,971 $ 983,580accumulated depreciation (290,434) (295,712)
$ 676,483 $ 687,868
The VfPa’s leases were entered into as combined leases of land, berthing structures and infrastructure. When the VfPa adopted ifRS effective January 1, 2011, it was not possible to obtain a reliable estimate of the split of the fair values of certain of the leases between land, berthing structures and infrastructure at the inception of the leases. Therefore, in determining lease classification, the VfPa evaluated whether both parts were clearly operating leases or finance leases. as the passing of land title has no bearing on the classification of the land leases, the VfPa reviewed other factors including:
• theeconomiclifeoftheland;and
• thepresentvalueofminimumleasepayments.
Because the rent paid to the VfPa for the buildings is increased to market rent at regular intervals and the VfPa does not participate in the residual value of the buildings, it was judged that substantially all the risks and rewards of the buildings are with the VfPa. Based on these qualitative factors, it was considered that the leases are operating leases.
7. investment in joint venture:
PMVV, a wholly owned subsidiary of the VfPa, participates in a joint venture that conducts business in support of port operations. PMVV has a 50% interest in the joint venture at December 31, 2011.
Provision for net liabilities of joint venture 2011 2010
at January 1 $ (1,870) $ (1,037)Share of net income 302 248Shareholder loans and/or dividends paid to shareholder (750) (1,082)
at December 31 $ (2,318) $ (1,870)
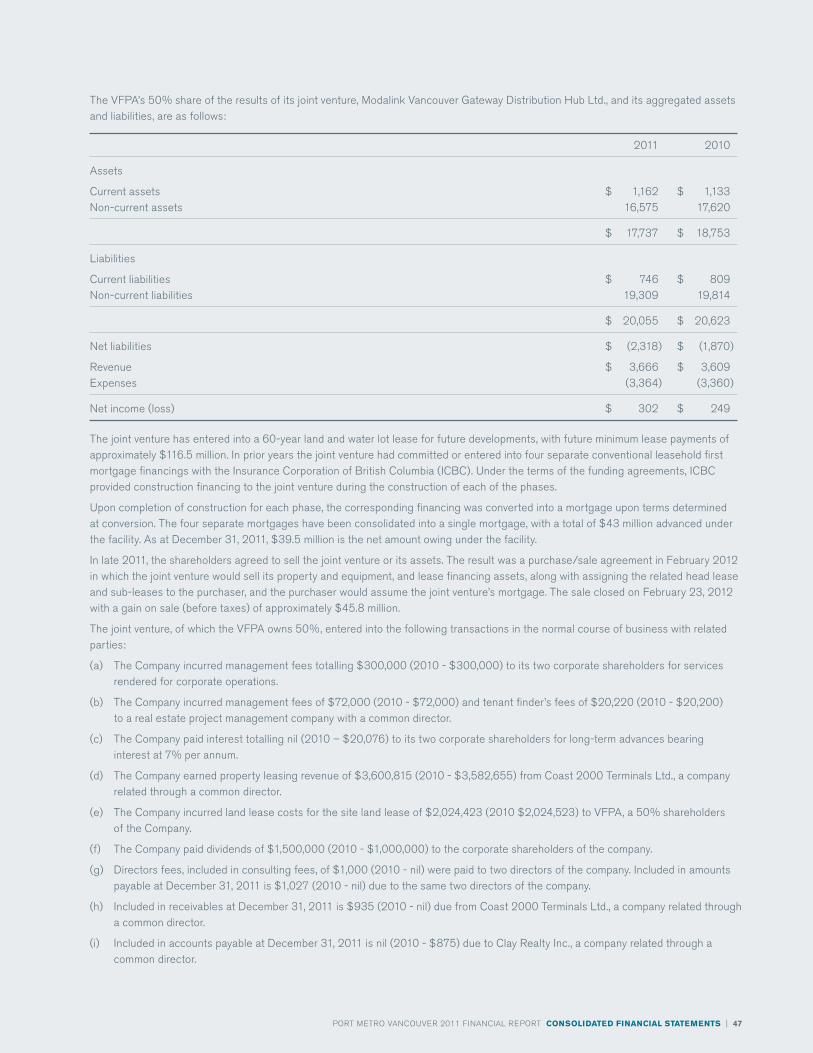
PORT METRO VancOUVER 2011 financial REPORT consolidated financial statements | 47
The VfPa’s 50% share of the results of its joint venture, Modalink Vancouver Gateway Distribution Hub ltd., and its aggregated assets and liabilities, are as follows:
2011 2010
assets
current assets $ 1,162 $ 1,133non-current assets 16,575 17,620
$ 17,737 $ 18,753
liabilities
current liabilities $ 746 $ 809non-current liabilities 19,309 19,814
$ 20,055 $ 20,623
net liabilities $ (2,318) $ (1,870)
Revenue $ 3,666 $ 3,609Expenses (3,364) (3,360)
net income (loss) $ 302 $ 249
The joint venture has entered into a 60-year land and water lot lease for future developments, with future minimum lease payments of approximately $116.5 million. in prior years the joint venture had committed or entered into four separate conventional leasehold first mortgage financings with the insurance corporation of British columbia (icBc). Under the terms of the funding agreements, icBc provided construction financing to the joint venture during the construction of each of the phases.
Upon completion of construction for each phase, the corresponding financing was converted into a mortgage upon terms determined at conversion. The four separate mortgages have been consolidated into a single mortgage, with a total of $43 million advanced under the facility. as at December 31, 2011, $39.5 million is the net amount owing under the facility.
in late 2011, the shareholders agreed to sell the joint venture or its assets. The result was a purchase/sale agreement in february 2012 in which the joint venture would sell its property and equipment, and lease financing assets, along with assigning the related head lease and sub-leases to the purchaser, and the purchaser would assume the joint venture’s mortgage. The sale closed on february 23, 2012 with a gain on sale (before taxes) of approximately $45.8 million.
The joint venture, of which the VfPa owns 50%, entered into the following transactions in the normal course of business with related parties:
(a) The company incurred management fees totalling $300,000 (2010 - $300,000) to its two corporate shareholders for services rendered for corporate operations.
(b) The company incurred management fees of $72,000 (2010 - $72,000) and tenant finder’s fees of $20,220 (2010 - $20,200) to a real estate project management company with a common director.
(c) The company paid interest totalling nil (2010 – $20,076) to its two corporate shareholders for long-term advances bearing interest at 7% per annum.
(d) The company earned property leasing revenue of $3,600,815 (2010 - $3,582,655) from coast 2000 Terminals ltd., a company related through a common director.
(e) The company incurred land lease costs for the site land lease of $2,024,423 (2010 $2,024,523) to VfPa, a 50% shareholders of the company.
(f) The company paid dividends of $1,500,000 (2010 - $1,000,000) to the corporate shareholders of the company.
(g) Directors fees, included in consulting fees, of $1,000 (2010 - nil) were paid to two directors of the company. included in amounts payable at December 31, 2011 is $1,027 (2010 - nil) due to the same two directors of the company.
(h) included in receivables at December 31, 2011 is $935 (2010 - nil) due from coast 2000 Terminals ltd., a company related through a common director.
(i) included in accounts payable at December 31, 2011 is nil (2010 - $875) due to clay Realty inc., a company related through a common director.

48 | consolidated financial statements PORT METRO VancOUVER 2011 financial REPORT
8. financial instruments:
(a) financial instruments by category:
loans and Held to receivables maturity Total
assets as per balance sheet:December 31, 2011: cash and cash equivalents $ 107,544 $ - $ 107,544 Short-term investments - 1,350 1,350 investments in securities - 2,508 2,508 accounts receivable and other assets 39,904 - 39,904 long-term receivables 690 - 690
$ 148,138 $ 3,858 $ 151,966
December 31, 2010: cash and cash equivalents $ 64,003 $ - $ 64,003 investments in securities - 2,232 2,232 accounts receivable and other assets 32,935 - 32,935 long-term receivables 769 - 769
Total $ 97,707 $ 2,232 $ 99,939
Other financial liabilities at amortized cost Total
assets as per balance sheet:
December 31, 2011:Payment in lieu of taxes $ 1,882 $ 1,882accounts payable and accrued liabilities 39,576 39,576long-term obligations (including current portion) 99,679 99,679Short-term borrowing 1,800 1,800
$ 142,937 $ 142,937
December 31, 2010: Payment in lieu of taxes $ 1,370 $ 1,370 accounts payable and accrued liabilities 45,023 45,023 long-term obligations (including current portion) 99,649 99,649 Short-term borrowing 4,395 4,395
Total $ 150,437 $ 150,437
b) credit quality and financial assets:
cash at bank and short-term bank deposits:
VfPa has the objective of ensuring the safety of its cash balances and maintaining the liquidity necessary to pay obligations as they become due. in order to do so, VfPa holds its cash balances in conservative, highly liquid facilities. The cash portfolio is diversified to minimize the risk of loss resulting from overconcentration of holdings in any one specific financial institution. cash balances are only invested in top tier financial institutions in canada. cash position is monitored on a daily basis and rebalanced as necessary. VfPa’s cash management and investing activities are constrained by the Canada Marine Act.

PORT METRO VancOUVER 2011 financial REPORT consolidated financial statements | 49
9. investments in securities:
2011 2010
at January 1 $ 2,232 $ 2,692additions 2,921 105Disposals (1,295) (565)
at December 31 3,858 2,232less: non-current portion 2,508 2,232
current portion $ 1,350 $ -
Held to maturity assets include the following:
2011 2010
Gic $ 2,946 $ 620Bonds 912 1,612
10. accounts receivable and other assets:
(a) accounts receivable and other assets:
2011 2010
Trade receivables $ 6,649 $ 8,205Provision for impairment (3,358) (3,013)Restricted funds 3,205 3,226Other assets 33,408 24,517
$ 39,904 $ 32,935
at December 31, 2011, accounts receivable and other assets includes $3,204,939 in restricted funds (2010 - $3,226,000). Restricted funds are project related deposits, provincial share of lease revenues, and foreshore property owner deposits. Once information has been submitted to the VfPa’s satisfaction, project-related deposits are refunded in full plus interest. Provincial share of lease revenues are paid semi annually. The foreshore property owner deposits are held to guarantee that the dikes on such properties will be maintained by the Owners.
The single largest amount of the restricted funds is $749,568 (2010 - $741,437) held for the replacement of a pile wall and a protection system at a terminal.
as of December 31, 2011, accounts receivables of $2,069,671 (2010 - $3,892,142) were past due but not impaired. These relate to a number of customers for whom there is no recent history of default. The aging analysis of these trade receivables is as follows:
2011 2010
Up to 90 days $ 834 $ 3,81491 to 120 days 97 19Over 120 days 1,139 59
Total $ 2,070 $ 3,892
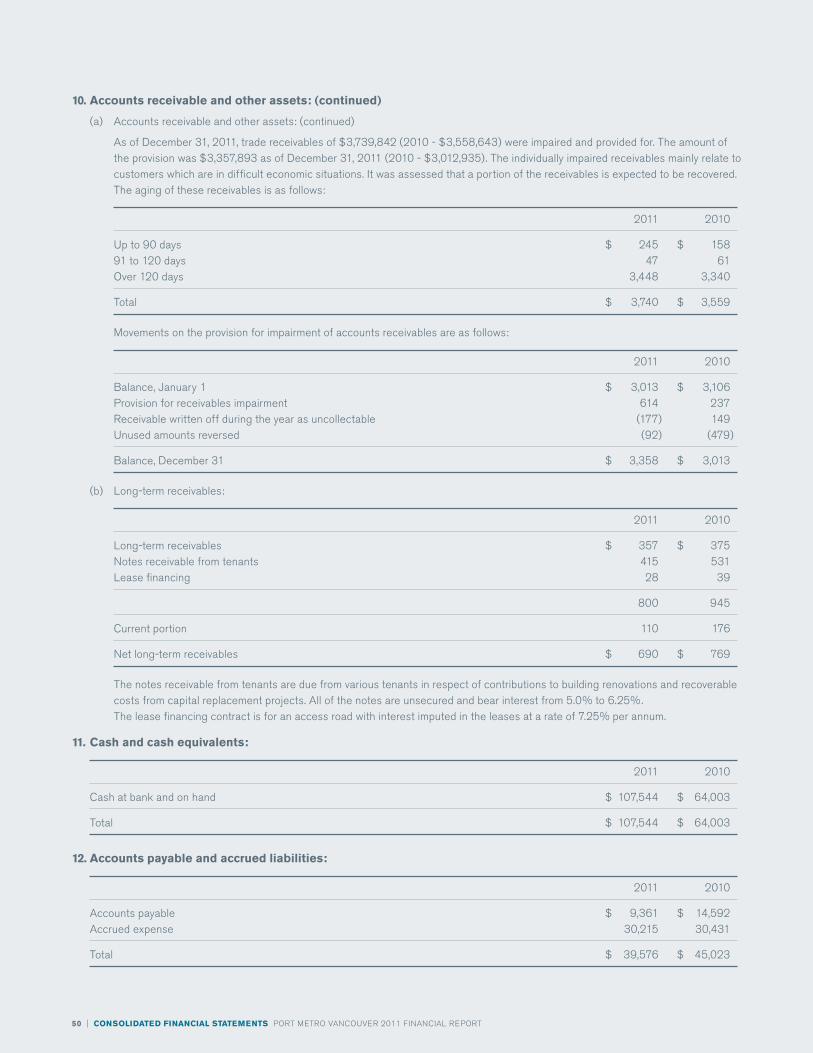
50 | consolidated financial statements PORT METRO VancOUVER 2011 financial REPORT
10. accounts receivable and other assets: (continued)
(a) accounts receivable and other assets: (continued)
as of December 31, 2011, trade receivables of $3,739,842 (2010 - $3,558,643) were impaired and provided for. The amount of the provision was $3,357,893 as of December 31, 2011 (2010 - $3,012,935). The individually impaired receivables mainly relate to customers which are in difficult economic situations. it was assessed that a portion of the receivables is expected to be recovered. The aging of these receivables is as follows:
2011 2010
Up to 90 days $ 245 $ 15891 to 120 days 47 61Over 120 days 3,448 3,340
Total $ 3,740 $ 3,559
Movements on the provision for impairment of accounts receivables are as follows:
2011 2010
Balance, January 1 $ 3,013 $ 3,106Provision for receivables impairment 614 237Receivable written off during the year as uncollectable (177) 149Unused amounts reversed (92) (479)
Balance, December 31 $ 3,358 $ 3,013
(b) long-term receivables:
2011 2010
long-term receivables $ 357 $ 375notes receivable from tenants 415 531lease financing 28 39
800 945
current portion 110 176
net long-term receivables $ 690 $ 769
The notes receivable from tenants are due from various tenants in respect of contributions to building renovations and recoverable costs from capital replacement projects. all of the notes are unsecured and bear interest from 5.0% to 6.25%. The lease financing contract is for an access road with interest imputed in the leases at a rate of 7.25% per annum.
11. cash and cash equivalents:
2011 2010
cash at bank and on hand $ 107,544 $ 64,003
Total $ 107,544 $ 64,003
12. accounts payable and accrued liabilities:
2011 2010
accounts payable $ 9,361 $ 14,592accrued expense 30,215 30,431
Total $ 39,576 $ 45,023

PORT METRO VancOUVER 2011 financial REPORT consolidated financial statements | 51
13. borrowings:
(a) long-term obligations:
2011 2010
Series a debentures with interest at 4.63% semi-annually, maturing april 20, 2020 $ 99,270 $ 99,199Secured non-revolving demand loan bearing interest at prime plus 0.125% interest, payable monthly, amortized over 20 years 409 450
99,679 99,649current portion 41 41
$ 99,638 $ 99,608
The demand loan is secured by specific and general security agreements covering all assets of the subsidiary holding the mortgage, a first charge on properties and facilities, an assignment of insurance proceeds, subordination of amounts due to related parties and letters of credit from the VfPa and another related party.
in 2010, the VfPa raised $100 million of funds via a 10-year rated private placement bond issue. These Series a Senior Unsecured Debentures bear interest payable of 4.63% semi-annually and will come due april 20, 2020. interest is payable in arrears on april 20 and October 20 of each year, with the first payment having been made on October 20, 2010. The proceeds from the issuance of Series a Debentures were used first to repay the authority’s operating credit facility with the remaining balance being used for general corporate purposes.
Principal repayment requirements are as follows:
2012 $ 412013 412014 422015 442016 and thereafter 99,511
$ 99,679
(b) Short-term borrowing:
2011 2010
loan facility - short-term borrowing:VfPa - bankers’ acceptance $ - $ 2,495nfTi (subsidiary) - bankers’ acceptance 1,800 1,900
$ 1,800 $ 4,395
The VfPa has arranged a $175 million loan facility. This loan facility was used in 2011, with no Bankers’ acceptance amount outstanding at December 31, 2011 (2010 - $2.5 million). The facility is unsecured and bears interest at the canadian prime rate of the bank minus 0.85% per annum. The VfPa pays a stamping fee of 0.19% per annum on the Bankers’ acceptance issued and standby fees at an annual rate of 0.03% calculated on the unused, authorized portion of the facility. amounts outstanding may be repaid at any time without penalty and must be repaid by December 12, 2012.
as of December 31, 2011, the VfPa has a total of $9.67 million in letter of credit facilities (2010 - $15.1 million). Two irrevocable standby letters of credit were issued to two separate federal government agencies for a total of $6.4 million.
The fair values of the short-term borrowings equals their carrying amounts.
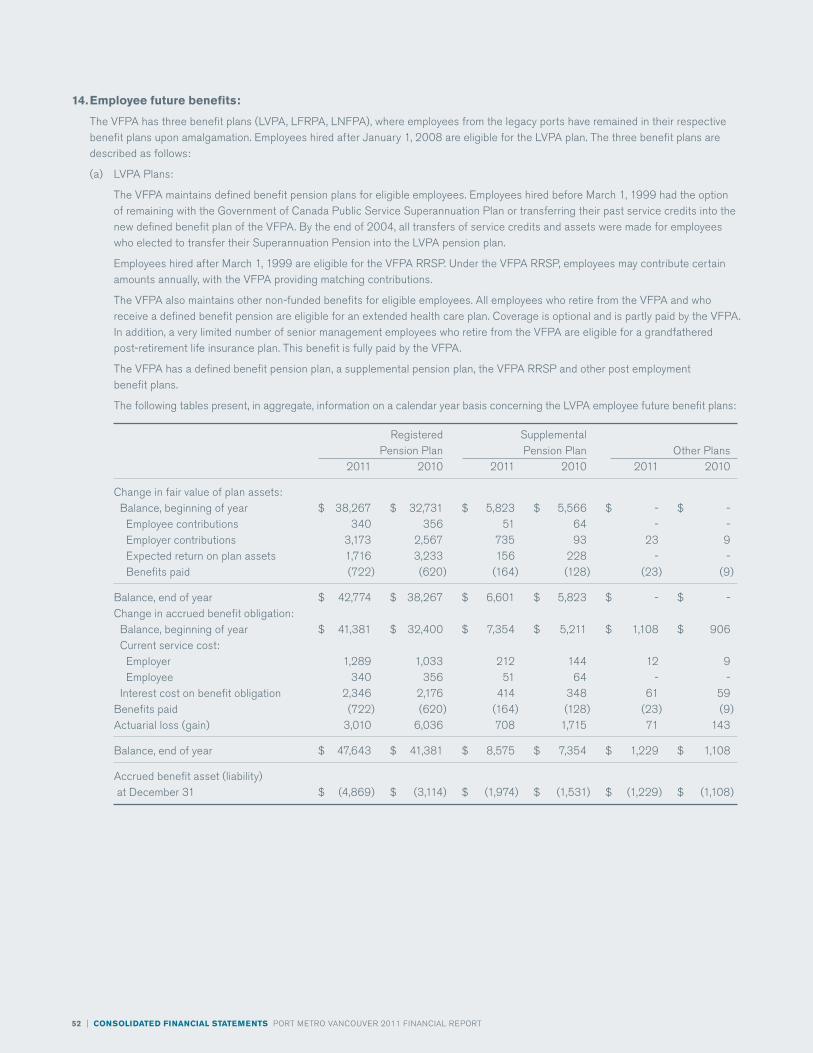
52 | consolidated financial statements PORT METRO VancOUVER 2011 financial REPORT
14. employee future benefits:
The VfPa has three benefit plans (lVPa, lfRPa, lnfPa), where employees from the legacy ports have remained in their respective benefit plans upon amalgamation. Employees hired after January 1, 2008 are eligible for the lVPa plan. The three benefit plans are described as follows:
(a) lVPa Plans:
The VfPa maintains defined benefit pension plans for eligible employees. Employees hired before March 1, 1999 had the option of remaining with the Government of canada Public Service Superannuation Plan or transferring their past service credits into the new defined benefit plan of the VfPa. By the end of 2004, all transfers of service credits and assets were made for employees who elected to transfer their Superannuation Pension into the lVPa pension plan.
Employees hired after March 1, 1999 are eligible for the VfPa RRSP. Under the VfPa RRSP, employees may contribute certain amounts annually, with the VfPa providing matching contributions.
The VfPa also maintains other non-funded benefits for eligible employees. all employees who retire from the VfPa and who receive a defined benefit pension are eligible for an extended health care plan. coverage is optional and is partly paid by the VfPa. in addition, a very limited number of senior management employees who retire from the VfPa are eligible for a grandfathered post-retirement life insurance plan. This benefit is fully paid by the VfPa.
The VfPa has a defined benefit pension plan, a supplemental pension plan, the VfPa RRSP and other post employment benefit plans.
The following tables present, in aggregate, information on a calendar year basis concerning the lVPa employee future benefit plans:
Registered Supplemental Pension Plan Pension Plan Other Plans 2011 2010 2011 2010 2011 2010
change in fair value of plan assets: Balance, beginning of year $ 38,267 $ 32,731 $ 5,823 $ 5,566 $ - $ - Employee contributions 340 356 51 64 - - Employer contributions 3,173 2,567 735 93 23 9 Expected return on plan assets 1,716 3,233 156 228 - - Benefits paid (722) (620) (164) (128) (23) (9)
Balance, end of year $ 42,774 $ 38,267 $ 6,601 $ 5,823 $ - $ -change in accrued benefit obligation: Balance, beginning of year $ 41,381 $ 32,400 $ 7,354 $ 5,211 $ 1,108 $ 906 current service cost: Employer 1,289 1,033 212 144 12 9 Employee 340 356 51 64 - - interest cost on benefit obligation 2,346 2,176 414 348 61 59Benefits paid (722) (620) (164) (128) (23) (9)actuarial loss (gain) 3,010 6,036 708 1,715 71 143
Balance, end of year $ 47,643 $ 41,381 $ 8,575 $ 7,354 $ 1,229 $ 1,108
accrued benefit asset (liability) at December 31 $ (4,869) $ (3,114) $ (1,974) $ (1,531) $ (1,229) $ (1,108)

PORT METRO VancOUVER 2011 financial REPORT consolidated financial statements | 53
change in Other comprehensive income (Oci) gain/(loss) balances:
Registered Supplemental Pension Plan Pension Plan Other Plans 2011 2010 2011 2010 2011 2010
Balance, beginning of year $ (327) $ - $ (1,669) $ - $ (153) $ - Gains (losses recognized in year) (3,872) (5,005) (751) (1,669) (71) (153)change in ifRic 14 recognized - 4,678 - - - -
Balance, end of year $ (4,199) $ (327) $ (2,420) $ (1,669) $ (224) $ (153)
Pension and other post-retirement expense is included in salaries and benefits and is as follows:
Registered Supplemental Pension Plan Pension Plan Other Plans 2011 2010 2011 2010 2011 2010
Plan expense:current service cost $ 1,289 $ 1,033 $ 212 $ 144 $ 12 $ 9interest cost on benefit obligation 2,346 2,176 414 348 61 59Expected return on plan assets (2,578) (2,202) (199) (181) - -
Expense for the year ended December 31 $ 1,057 $ 1,007 $ 427 $ 311 $ 73 $ 68
The actual return on plan assets was $1,873,200 (2010 - $3,460,800).
The VfPa RRSP employer contribution:
2011 2010
Employer contributions $ 856 $ 632
The invested assets of the pension plan and the supplemental pension plan are held in pooled funds. The following is a distribution of the invested assets by fund type:
2011 2010 Registered Supplemental Registered Supplemental Pension Plan Pension Plan Pension Plan Pension Plan
Equity funds 43.4% 22.0% 44.4% 43.8fixed income funds 43.5% 22.3% 45.8% 46.3%Real estate funds 13.1% 6.9% 9.8% 9.9%Refundable tax account - 48.8% - -
Total 100.0% 100.0% 100.0% 100.0%

54 | consolidated financial statements PORT METRO VancOUVER 2011 financial REPORT
14. employee future benefits: (continued)
(b) lfRPa Plans:
The VfPa has a defined contribution registered pension plan where employees contribute certain amounts annually and the VfPa providing matching contributions, with the exception of three employees where the VfPa’S match is higher than the employees’ contribution up to a maximum percentage. There are also two unfunded supplemental defined benefit pension plans for designated employees that are in addition to the retirement income provided for under the registered defined contribution plan. The two supplemental plans are: the Executive individual Supplemental Pension Benefit (EiSPB) and the Supplemental Pension arrangement for Selected Employees (SPaSE).
The following tables present, in aggregate, information on a calendar year basis concerning the lfRPa employee future benefit plans:
EiSPB SPaSE 2011 2010 2011 2010
change in fair value of plan assets: Balance, beginning of year $ - $ - $ - $ - Employee contributions - - - - Employer contributions 54 22 84 4 Benefits paid (54) (22) (84) (4) actual return on plan assets - - - -
Balance, end of year $ - $ - $ - $ -
EiSPB SPaSE 2011 2010 2011 2010
change in accrued benefit Obligation: Balance, beginning of year $ 815 $ 671 $ 1,297 $ 769 current service cost: Employer - 84 16 29 interest cost on benefit obligation 43 48 70 52 Benefit paid (54) (22) (84) (3) actuarial loss (gain) 83 34 213 450
Balance, end of year 887 815 1,512 1,297
accrued benefit (liability) at December 31 $ (887) $ (815) $ (1,512) $ (1,297)
change in Other comprehensive income (Oci) gain/(loss) balances:
EiSPB SPaSE 2011 2010 2011 2010
Balance, beginning of year $ (34) $ - $ (453) $ -Gains (losses) recognized in year (84) (34) (213) (453)
Balance, end of year $ (118) $ (34) $ (666) $ (453)
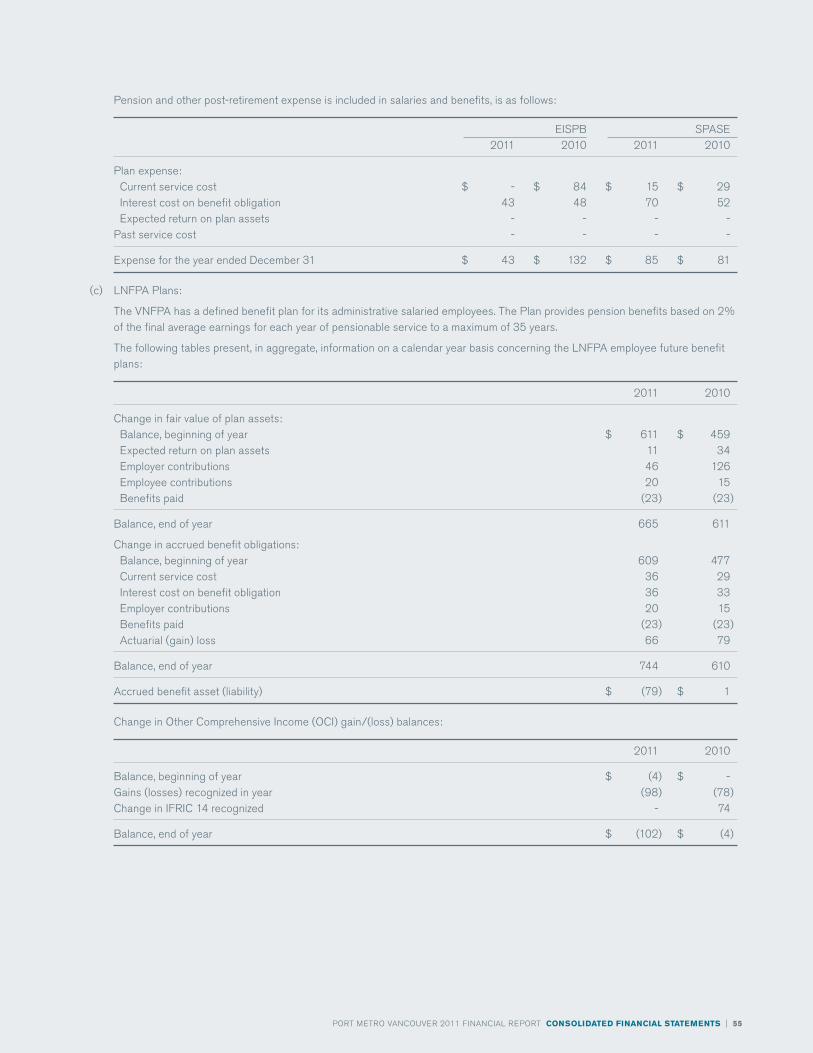
PORT METRO VancOUVER 2011 financial REPORT consolidated financial statements | 55
Pension and other post-retirement expense is included in salaries and benefits, is as follows:
EiSPB SPaSE 2011 2010 2011 2010
Plan expense: current service cost $ - $ 84 $ 15 $ 29 interest cost on benefit obligation 43 48 70 52 Expected return on plan assets - - - -Past service cost - - - -
Expense for the year ended December 31 $ 43 $ 132 $ 85 $ 81
(c) lnfPa Plans:
The VnfPa has a defined benefit plan for its administrative salaried employees. The Plan provides pension benefits based on 2% of the final average earnings for each year of pensionable service to a maximum of 35 years.
The following tables present, in aggregate, information on a calendar year basis concerning the lnfPa employee future benefit plans:
2011 2010
change in fair value of plan assets: Balance, beginning of year $ 611 $ 459 Expected return on plan assets 11 34 Employer contributions 46 126 Employee contributions 20 15 Benefits paid (23) (23)
Balance, end of year 665 611
change in accrued benefit obligations: Balance, beginning of year 609 477 current service cost 36 29 interest cost on benefit obligation 36 33 Employer contributions 20 15 Benefits paid (23) (23) actuarial (gain) loss 66 79
Balance, end of year 744 610
accrued benefit asset (liability) $ (79) $ 1
change in Other comprehensive income (Oci) gain/(loss) balances:
2011 2010
Balance, beginning of year $ (4) $ -Gains (losses) recognized in year (98) (78)change in ifRic 14 recognized - 74
Balance, end of year $ (102) $ (4)

56 | consolidated financial statements PORT METRO VancOUVER 2011 financial REPORT
14. employee future benefits: (continued)
(c) lnfPa Plans: (continued)
Pension and other post-retirement expense is included in the salaries and benefits, is as follows:
2011 2010
Plan expense: current service cost $ 35 $ 29 interest cost on benefit obligation 36 33 Expected return on plan assets (41) (34)
Expense for the year ended December 31 $ 30 $ 28
The weighted average asset allocation by asset category of the lnfPa’s defined benefit pension plan is as follows:
2011 2010
Equity 44.7% 43.2%fixed income securities 42.3% 46.7%Real estate funds 12.9% 10.1%
Total assets 100.0% 100.0%
(d) The significant actuarial assumptions adopted in measuring the pension plans’ accrued benefit obligation are as follows:
Registered Supplemental Pension Plan Pension Plan Other Plans 2011 2010 2011 2010 2011 2010
Discount rate at beginning of year 5.5% 6.5% 5.5% 6.5% 5.5% 6.5%Discount rate at end of year 5.0% 5.5% 5.0% 5.5% 5.0% 5.5%Expected long-term rate of return of Plan assets 6.5% 6.5% 3.25% 3.25% na n/ainflation rate (future salary increases) 2.25% 2.25% 2.25% 2.25% 2.25% 2.25%Medical cost trend rate 8% 9% 8% 9% 8% 9%
(e) The sensitivity of the overall pension liability to changes in the weighted principal assumptions is:
change in assumption impact on overall liability
Discount rate increase/decrease by 1% Decrease/increase by 14.0%/17.7%inflation rate increase/decrease by 1% increase/decrease by 11.8/11.5%Salary growth rate increase/decrease by 1% increase/decrease by 2.4/2.2%Rate of mortality increase by 1 year increase by 0.14%
The effect of a 1% movement in the assumed medical cost trend rate is as follows:
increase Decrease
Effect on the aggregate of the current service cost and interest cost 6.1% 5.4%Effect on the defined benefit obligation 6.4% 5.7%

PORT METRO VancOUVER 2011 financial REPORT consolidated financial statements | 57
15. investment properties:
investment properties are depreciated straight-line over 10 to 25 years.
2011 2010
Opening:
cost $ 1,667 $ 1,667accumulated depreciation (1,628) (1,610)
net book value 39 57
Movements in the year:
additions - -Disposal - -Depreciation (10) (18)
closing net book value $ 29 $ 39
The fair value of the investment properties held as at December 31, 2011 is $1,850,000 (2010 - $1,850,000). The fair value of the investments properties have been determined by an independent appraiser at December 31, 2010, who holds a recognized professional qualification and has recent experience in the Vancouver region.
The assessed value of the property has increased 5% in the last year, therefore the fair value at December 31, 2011 is likely to be no less than the $1,850,000 appraised value at December 31, 2010.
16. intangible assets:
intangible assets are solely composed of internally generated software development costs. They are depreciated straight-line over 5 years.
2011 2010
Opening:
cost $ 7,292 $ 6,369accumulated depreciation (5,458) (4,812)
net book value 1,834 1,557
Movements in the year:
additions 141 923Depreciation (653) (646)
closing net book value $ 1,322 $ 1,834
17. leases:
The VfPa leases various properties, offices, equipment and vehicles under non-cancellable operating lease agreements. The leases have varying terms escalation clauses and renewal rights. The leases typically run for 2 to 10 years.
The lease expenditure charged and sublease payments received that are recognized in the statement of comprehensive income during the year are ($1,203,903) and $327,926, respectively.
The future aggregate minimum lease payments under non-cancellable operating leases are as follows:
2011 2010
not later than 1 year $ 1,075 $ 1,084later than 1 year and not later than 5 years 3,028 3,227later than 5 years 894 1,446
Total $ 4,997 $ 5,757

58 | consolidated financial statements PORT METRO VancOUVER 2011 financial REPORT
17. leases: (continued)
One of the leased properties has been sublet by the VfPa. The lease and sublease expire in 2016. Sublease payments of $1,748,897 are expected to be received during the future sublease years.
The VfPa currently leases land, berthing structures and buildings to terminal operators under non-cancellable operating lease agreements. These leases have varying terms, escalation clauses and renewal rights.
The future minimum lease rentals under non-cancellable operating leases in the aggregate and for each of the following periods are as follows:
2011 2010
not later than 1 year $ 94,208 $ 93,471later than 1 year and not later than 5 years 355,745 376,326later than 5 years 2,169,067 2,213,306
Total $ 2,619,020 $ 2,683,103
contingent-based rents recognized in the income statement were $18,472,362 (2010 - $17,086,705).
18. commitments:
capital projects for which the combined capital expenditures are estimated to exceed $1.0 million as at December 31, 2011 are as follows:
Total Spending commitments authorized to date at year-end cost
container expansion $ 265,831 $ 24,523 $ 332,123land 112,636 207 127,482Other infrastructure improvement 47,613 9,061 250,232Building 100 73 4,017
The VfPa is committed under a lease agreement with fraser Surrey Docks to use reasonable commercial efforts to maintain the main channel of the fraser River, within its jurisdiction, to a navigable depth.
Under two 30-year lease agreements expiring on December 31, 2014, the VfPa administers the provincial crown lands within its jurisdiction, consisting of foreshore and land covered by water. Gross lease rentals and sand royalties derived from that agreement are shared between the province of British columbia and the VfPa with all costs of administration borne by the VfPa. Renegotiation of the two leases is ongoing.
19. contingent liabilities:
(a) Roberts Bank expansion:
in november 2004 lVPa entered into agreements with the Tsawwassen first nation (Tfn) and other parties. These agreements are referred to in these financial statements as the Expansion agreements.
By the end of December, 2007, lVPa has expensed a total of $2,000,000 to Tfn as payments to settle litigation and compensation for infringements of Tfn aboriginal interests.
Under the terms of the Expansion agreements, the VfPa is obligated to advance the Tfn up to $5,000,000 on an interest free basis for its 50% participation in a joint venture with the VfPa. The VfPa will contribute an additional, matching amount of up to $5,000,000 on its own account. The joint venture is to be controlled by both venturers. it is intended that the joint venture will search for and identify port related activities in which to invest. Such investments will be approved only after due diligence has established a reasonable expectation of generating profits in accordance with industry standards, with a minimum target rate of return of 10% a year. if all or part of the monies are not invested, interest is to be paid by the VfPa to the Tfn at prescribed rates. in 2011, the VfPa and Tfn continued working towards establishing the joint venture.
as of november 2008, the VfPa is obligated to pay interest at a rate equivalent to the yield earned on a 10-year Government of canada bond effective on the first anniversary of the settlement date plus 1.5% per annum on the portion of the funds not yet advanced to the JV on behalf of Tfn. for the fiscal year of 2011, $263,000 interest expense was disbursed.

PORT METRO VancOUVER 2011 financial REPORT consolidated financial statements | 59
The Expansion agreements obligate the VfPa to provide construction contracts, construction employment and operations employment to Tfn enterprises and its members in connection with the anticipated Roberts Bank Expansion. Should the VfPa fail to meet this obligation, liquidated damages will be required. The obligation amount is $2,585,592 and if the obligation is not met, liquidated damages up to $957,573 would be required.
(b) Payments in lieu of taxes:
The Payment in lieu of Tax (PilT) act prescribes how the federal government and its agents should determine what PilT to pay, based on the value of federal lands, if the federal entity decides to pay PilT. The PilT act also creates a Dispute advisory Panel, (DaP) to which taxing authorities may seek redress, if they disagree with the PilT payments they receive. There were different PilT practices followed among the three ports that amalgamated (see note 2(j)). The VfPa maintained the three different practices to December 31, 2010 while continuing to develop PilT practice and policy. certain municipalities have submitted invoices for PilT payments for past years; however, the VfPa does not believe they have a legal obligation to pay. in 2011, interim payments were made on all land under the jurisdiction of the VfPa under a new, consolidated PilT practice and policy.
Several municipalities believe they are entitled to additional PilT payments and have requested the DaP review the 2009 payments received from the VfPa. The outcome of this request is uncertain. The VfPa continues to work with Bc assessment authority to resolve outstanding issues.
20. provisions:
Environmental Sand Onerous Other Provisions restoration royalties contracts claims contributions Total
Balance atJanuary 1, 2011 $ 6,872 $ 5,461 $ 460 $ 225 $ 326 $ 13,344
Provision made during the year 509 627 97 175 - 1,408Provision used during the year (287) - (100) - - (387)Unwinding of discount 119 - - - - 119
Balance at December 31, 2011 $ 7,213 $ 6,088 $ 457 $ 400 $ 326 $ 14,484
Total – current $ 3,455 $ 6,088 $ 197 $ 400 $ 326 $ 10,466Total – non-current 3,758 - 260 - - 4,018
(a) Environmental restoration:
The VfPa incurs various environmental liabilities relating to its activities. a provision is recognized for the present value of costs to be incurred for the restoration thereof.
(b) Sand royalties:
Pursuant to a lease with the Government of British columbia (the Province) for a portion of the fraser River that is under Provincial jurisdiction, lfRPa agreed to pay the Province a royalty for sand dredged from that area of the riverbed. as no agreement has been reached with the Province on any settlement, the VfPa recognizes a provision for the royalties.
(c) Onerous contracts:
The VfPa has a lease and sub-lease arrangement for office space previously used by the VfPa. a provision is recognized for the net expenses to be incurred over the remainder of this lease.
(d) claims:
The amount represents a provision for certain claims brought against the VfPa. The provision charge is recognized in the statement of comprehensive income within other operating and administrative expenses. The outcome of these claims is not expected to give rise to any significant loss beyond the amounts provided for.
(e) Other contributions:
The amount represents a provision where the VfPa has committed to contribute to a number of community projects.

60 | consolidated financial statements PORT METRO VancOUVER 2011 financial REPORT
21. finance costs:
2011 2010
interest expense:Series a debentures $ 4,701 $ 3,271Secured mortgage 13 12loan facility 67 256Other obligation 382 262
Total finance cost $ 5,163 $ 3,801
22. Gateway infrastructure program:
The VfPa and its partners are leveraging provincial and federal funding for a generational investment in supply-chain infrastructure improvements. The Gateway infrastructure Program (GiP) is a $717 million investment in supply chain improvements beyond traditional port activities and lands. The industry funded portion of the GiP is $167 million, under a series of improvements in three locations:
Total industry industry funded PMV portion contribution portion (90%) (10%)
north shore trade area $ 59,000 $ 53,100 $ 5,900South shore trade area 58,000 52,200 5,800Roberts Bank rail corridor 50,000 45,000 5,000
Total $ 167,000 $ 150,300 $ 16,700
in order to recover 90% of the industry funded portion, the VfPa Board approved the Gateway infrastructure fee effective January 1, 2011. Below are the fees collected and expenditures made in 2011 and to date.
current Year Total to date
north Shore
trade area
South Shore
trade area
Roberts Bank
rail corridor
Total
north Shore
trade area
South Shore
trade area
Roberts Bank
rail corridor
Total
Gateway infrastructure fee (revenues)
$ 1,338 $ 852 $ 1,236 $ 3,426 $ 1,338 $ 852 $ 1,236 $ 3,426
Gateway infrastructure program (expenditures)
3,170 1,247 2,665 7,082 10,934 1,426 2,665 15,025
industry funded portion (90%)
2,853 1,122 2,399 6,374 9,841 1,283 2,399 13,523
VfPa portion (10%) 317 125 267 708 1,093 143 267 1,503

PORT METRO VancOUVER 2011 financial REPORT consolidated financial statements | 61
23. key management personnel:
compensation in respect of key management personnel is disclosed below. in addition, the total remuneration is disclosed for all Board of Directors, the chief Executive Officers and the four top earning officers or employees in terms of the Port authority Management Regulators.
Post- Salaries Other employment Year ending December 31, 2011 and fees benefits benefits Total
Board of DirectorsBancroft-Jones, anne Director, VfPa $ 40 $ - $ - $ 40Braun, Henry Director, cPc 6 - - 6carwell, Robert Driector, VfPa 48 - - 48chapman, Tim Director, VfPa (from September 29, 2011) 8 - - 8Dhir, Robin Director, cPc 12 - - 12Giraud, Byng Director, cPc 3 - - 3Hochstein, Philip Director, VfPa (from March 1, 2011) 28 - - 28Jacobsen, Pat Director, VfPa (to September 28, 2011) 33 - - 33Kwan, Eugene Director, VfPa 40 - - 40landry, Paul Director, VfPa (from September 29, 2011) 8 - - 8lebel, Pierre Director, cPc 11 - - 11longworth, Tom Director, VfPa 36 - 36Mcnair, Jonathan Director, cPc 18 - - 18Morgan-Silvester, Sarah chair, VfPa (to february 28, 2011) 29 - - 29neeser, craig Director, VfPa, chair, VfPa (from March 1, 2011) 97 - - 97Priddy, Penny Director, VfPa (from June 1, 2011) 20 - - 20Sparkes, Helen Director, VfPa (to May 31, 2011) 19 - - 19Szel, Marcella Director, VfPa (from June 19, 2010) 47 - - 47Timm, Tom Director, cPc 19 - - 19Turner, Rick Director, VfPa 43 - - 43Wilds, Robert Vice chair, VfPa (to September 28, 2011) 40 - - 40Wilson, Robin chair, cPc 33 - - 33
Total $ 638 $ - $ - $ 638
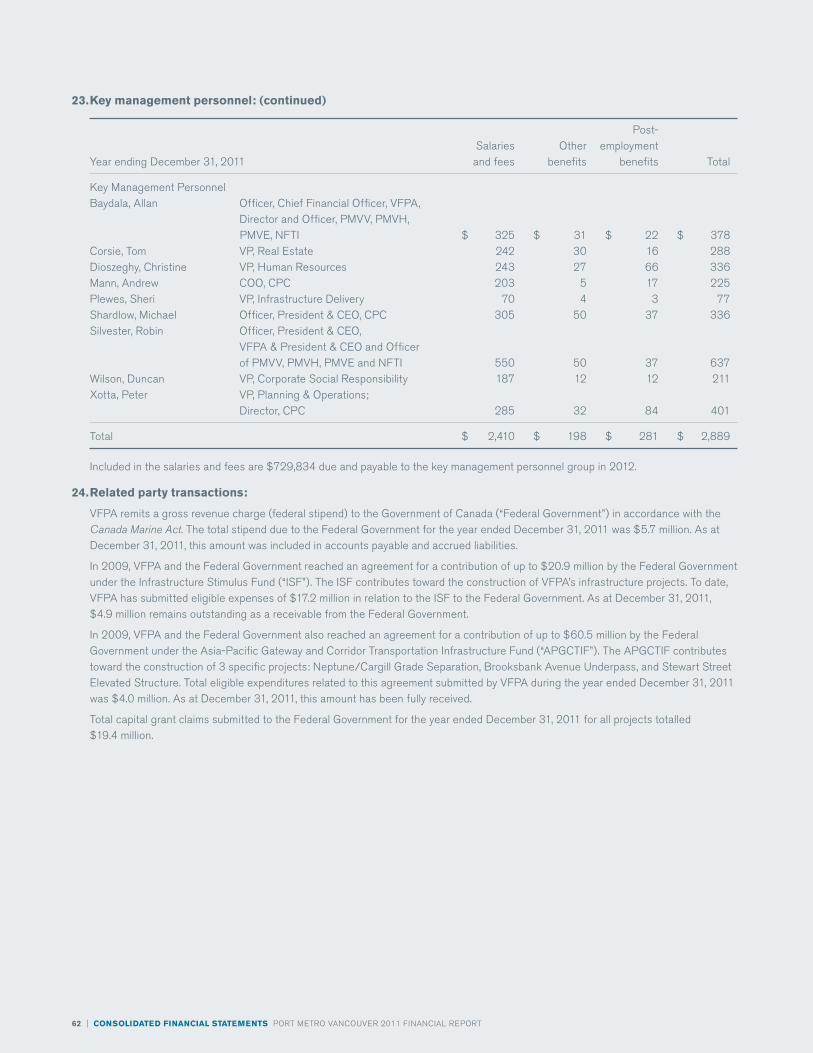
62 | consolidated financial statements PORT METRO VancOUVER 2011 financial REPORT
23. key management personnel: (continued)
Post- Salaries Other employment Year ending December 31, 2011 and fees benefits benefits Total
Key Management PersonnelBaydala, allan Officer, chief financial Officer, VfPa, Director and Officer, PMVV, PMVH, PMVE, nfTi $ 325 $ 31 $ 22 $ 378corsie, Tom VP, Real Estate 242 30 16 288Dioszeghy, christine VP, Human Resources 243 27 66 336Mann, andrew cOO, cPc 203 5 17 225Plewes, Sheri VP, infrastructure Delivery 70 4 3 77Shardlow, Michael Officer, President & cEO, cPc 305 50 37 336Silvester, Robin Officer, President & cEO, VfPa & President & cEO and Officer of PMVV, PMVH, PMVE and nfTi 550 50 37 637Wilson, Duncan VP, corporate Social Responsibility 187 12 12 211Xotta, Peter VP, Planning & Operations; Director, cPc 285 32 84 401
Total $ 2,410 $ 198 $ 281 $ 2,889
included in the salaries and fees are $729,834 due and payable to the key management personnel group in 2012.
24. Related party transactions:
VfPa remits a gross revenue charge (federal stipend) to the Government of canada (“federal Government”) in accordance with the Canada Marine Act. The total stipend due to the federal Government for the year ended December 31, 2011 was $5.7 million. as at December 31, 2011, this amount was included in accounts payable and accrued liabilities.
in 2009, VfPa and the federal Government reached an agreement for a contribution of up to $20.9 million by the federal Government under the infrastructure Stimulus fund (“iSf”). The iSf contributes toward the construction of VfPa’s infrastructure projects. To date, VfPa has submitted eligible expenses of $17.2 million in relation to the iSf to the federal Government. as at December 31, 2011, $4.9 million remains outstanding as a receivable from the federal Government.
in 2009, VfPa and the federal Government also reached an agreement for a contribution of up to $60.5 million by the federal Government under the asia-Pacific Gateway and corridor Transportation infrastructure fund (“aPGcTif”). The aPGcTif contributes toward the construction of 3 specific projects: neptune/cargill Grade Separation, Brooksbank avenue Underpass, and Stewart Street Elevated Structure. Total eligible expenditures related to this agreement submitted by VfPa during the year ended December 31, 2011 was $4.0 million. as at December 31, 2011, this amount has been fully received.
Total capital grant claims submitted to the federal Government for the year ended December 31, 2011 for all projects totalled $19.4 million.

PORT METRO VancOUVER 2011 financial REPORT consolidated financial statements | 63
25. explanation of transition to ifRs:
These are the VfPa’s first consolidated financial statements prepared in accordance with ifRS.
The accounting policies set out in note 2 have been applied in preparing the consolidated financial statements for the year ended December 31, 2011, the comparative information presented in these financial statements for the year ended December 31, 2010 and in the preparation of an opening balance sheet as at January 1, 2010.
in preparing its opening ifRS balance sheet, the VfPa has adjusted amounts reported previously in financial statements prepared with canadian GaaP. an explanation of how the transition from canadian GaaP to ifRS has affected the VfPa’s financial position, financial performance and cash flows is set out in the following tables and notes that accompany the tables.
Initial elections upon adoption:
Set out below are the applicable ifRS 1 exemptions, applied in the conversion from canadian GaaP to ifRS.
IFRS 1 exemption options:
Employee benefits:
ifRS 1 provides retrospective relief from applying iaS 19, Employee Benefits for the recognition of actuarial gains and losses. in line with the exemption, the VfPa elected to recognize all cumulative actuarial gains and losses and vested past service costs that existed at the transition date in opening retained earnings for all of its employee benefits plans.
Borrowing costs:
ifRS 1 allows a first-time adoptee to apply the transitional provisions set out in iaS 23, Borrowing Costs. The transitional provision permit the VfPa to apply the requirements of iaS 23 to borrowing costs relating to qualifying assets from the date of transition to ifRS.
Fair value as deemed cost of property and equipment:
ifRS 1 allows a first-time adoptee to elect the fair value of property and equipment as the deemed cost. This election can be applied to individual items of property and equipment, and is done as of the date of transition to ifRS.

64 | consolidated financial statements PORT METRO VancOUVER 2011 financial REPORT
25. explanation of transition to ifRs: (continued)
IFRS reconciliations:
ifRS 1 requires an entity to reconcile equity, comprehensive income and cash flows for prior periods. The following tables represent the reconciliations from canadian GaaP to ifRS for the respective periods noted for equity, comprehensive income and cash flows.
(a) at the date of transition to ifRS: January 1, 2010:
Previous, Effect of canadian transition to note GaaP ifRS ifRS
assets
current assets: cash and cash equivalents 1 $ 6,787 $ (792) $ 5,995 accounts receivable and other assets 1 27,104 (709) 26,395
33,891 (1,501) 32,390non-current assets: investment in securities 2,692 - 2,692 long-term receivables 1 2,956 (1,921) 1,035 accrued benefit asset 2 4,753 (4,398) 355 Deferred charges 1 1,616 (148) 1,468 future income taxes 1 228 (228) - intangible assets 3 - 1,557 1,557 investment property 4 - 57 57 Property and equipment 1, 3, 4, 6, 7 972,824 (26,497) 946,327
Total assets $ 1,018,960 $ (33,079) $ 985,881
liabilities and Equity of canada
current liabilities: accounts payable and accrued liabilities 1, 5 $ 36,203 $ (10,106) $ 26,097 Provisions 1, 5 - 7,480 7,480 Short-term borrowing 122,404 - 122,404 Payment in lieu of taxes 3,690 - 3,690 Deferred revenue 8,268 - 8,268 current portion of long-term obligations 1 491 (448) 43
171,056 (3,074) 167,982
non-current liabilities: Other employee benefits 1,758 - 1,758 accrued benefit liability 2 2,139 4,644 6,783 Deferred revenue 11,172 - 11,172 Provisions 5 - 6,468 6,468 Other deferred amounts 5 3,073 (85) 2,988 long-term obligations 1 20,655 (20,207) 448
209,853 (12,254) 197,599Equity of canada: contributed capital 150,259 - 150,259 Retained earnings 8 658,848 (20,825) 638,023
809,107 (20,825) 788,282
Total liabilities and equity of canada $ 1,018,960 $ (33,079) $ 985,881

PORT METRO VancOUVER 2011 financial REPORT consolidated financial statements | 65
notes to the reconciliation of canadian GaaP to ifRS
1 Under canadian GaaP, the VfPa’s joint venture was proportionally consolidated. iaS 31, Interest in Joint Ventures, however permits jointly controlled entitled to be equity accounted. accordingly, assets and liabilities that were previously included in the consolidated financial statements have been removed. Under canadian GaaP, the investment in joint venture was in a net liability position, with the following amounts included in the canadian GaaP financial statements:
assets: cash and cash equivalents $ 792 accounts receivable, current portion of lease financing receivable and accrued interest 709 lease financing receivable 1,921 future income taxes 228 Deferred charges 148 Property and equipment 16,372
Total assets $ 20,170
liabilities: accounts payable and accrued liabilities 468 current portion of long-term obligations 448 Other deferred amount 85 long-term obligations 20,207
Total liabilities $ 20,170
net liabilities $ 1,037
Under ifRS, after the carrying amount of the investor’s interest is reduced to nil, no further losses are recognized unless the investor has incurred legal or constructive obligations in respect of its investment. The VfPa has determined that, through a subsidiary it guarantees 20% of the joint venture’s mortgage and therefore, it does have a constructive obligation in respect of its investment. as a result, a provision of $1,037,316 equalling the net liabilities has been recognized as at January 1, 2010.
2 The VfPa elected to apply the ifRS 1 Employee Benefits Exemption. accordingly, cumulative net actuarial losses and unrecognized vested past service costs totalling $4,621,000 were recognized in retained earnings as at January 1, 2010. in addition, a further $4,421,000 was recognized in retained earnings owing to the application ifRic 14, an interpretation of iaS 19, Employee Benefits. Under ifRic 14, the full present values of the minimum required contributions are recognized on the balance sheet.
3 intangible assets (software) to be recognized separately under ifRS per iaS 38, Intangible Assets.
4 investment property to be recognized separately under ifRS per iaS 40, Investment Property.
5 Provisions, defined under ifRS as liabilities of uncertain timing or amount, are recognized as a separate line item in the statement of financial position. accordingly, $9,637,954 was reclassified to ‘Provisions’, net of a $165,486 adjustment to present value the obligations.
in addition, two additional provisions were recognized per the guidance contained in iaS 37, Provisions, Contingent Liabilities and Contingent Assets.
an environmental provision relating to the VfPa’s Oak Street Property for $2,383,521.
an onerous contract pertaining to the VfPa’s new Westminster sub-lease arrangement for $1,055,278.
6 individual components of property and equipment should be recorded where they have different useful lives and depreciation under ifRS per iaS 16, Property, Plant and Equipment. The VfPa reviewed all significant assets for individual components and retroactively restated the net book value.

66 | consolidated financial statements PORT METRO VancOUVER 2011 financial REPORT
25. explanation of transition to ifRs: (continued)
notes to the reconciliation of canadian GaaP to ifRS (continued)
7 assets are tested for impairment under ifRS per iaS 36, Impairment of Assets. Where indicators of impairment exist, the value in use (net cash flows), or fair value (appraised value) of the assets are determined. if both of these are less than the net book value of the asset, the asset is written down. The impairment test under ifRS resulted in a write-down of canada Place corporation (cPc) assets.
The VfPa elected to apply the ifRS 1 option to use fair value as the deemed cost for selected property and equipment assets. Using this election, the VfPa adjusted the Ballantyne cruise terminal assets with the net result being a reduction to the net book value of those assets.
8 Except for the reclassification items, all the adjustments above were recognized against opening retaining earnings as at January 1, 2010. The impact is summarized below.
Employee benefits $ (9,041,350)Ballantyne fair value adjustment (4,969,564)component depreciation (2,864,970)Oak St. Provision (2,383,521)new West Onerous contract (1,055,278)cPc impairment (676,000)Present value adjustment to provision 165,486
$ (20,825,197)
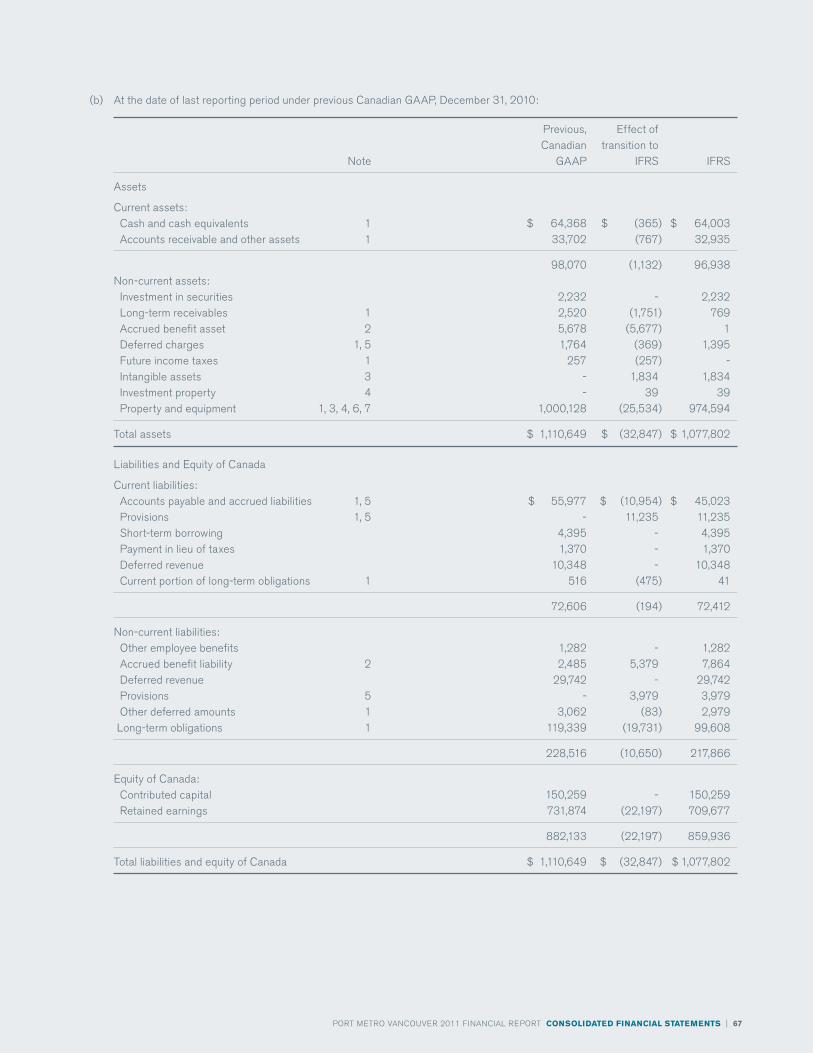
PORT METRO VancOUVER 2011 financial REPORT consolidated financial statements | 67
(b) at the date of last reporting period under previous canadian GaaP, December 31, 2010:
Previous, Effect of canadian transition to note GaaP ifRS ifRS
assets
current assets: cash and cash equivalents 1 $ 64,368 $ (365) $ 64,003 accounts receivable and other assets 1 33,702 (767) 32,935
98,070 (1,132) 96,938non-current assets: investment in securities 2,232 - 2,232 long-term receivables 1 2,520 (1,751) 769 accrued benefit asset 2 5,678 (5,677) 1 Deferred charges 1, 5 1,764 (369) 1,395 future income taxes 1 257 (257) - intangible assets 3 - 1,834 1,834 investment property 4 - 39 39 Property and equipment 1, 3, 4, 6, 7 1,000,128 (25,534) 974,594
Total assets $ 1,110,649 $ (32,847) $ 1,077,802
liabilities and Equity of canada
current liabilities: accounts payable and accrued liabilities 1, 5 $ 55,977 $ (10,954) $ 45,023 Provisions 1, 5 - 11,235 11,235 Short-term borrowing 4,395 - 4,395 Payment in lieu of taxes 1,370 - 1,370 Deferred revenue 10,348 - 10,348 current portion of long-term obligations 1 516 (475) 41
72,606 (194) 72,412
non-current liabilities: Other employee benefits 1,282 - 1,282 accrued benefit liability 2 2,485 5,379 7,864 Deferred revenue 29,742 - 29,742 Provisions 5 - 3,979 3,979 Other deferred amounts 1 3,062 (83) 2,979 long-term obligations 1 119,339 (19,731) 99,608
228,516 (10,650) 217,866
Equity of canada: contributed capital 150,259 - 150,259 Retained earnings 731,874 (22,197) 709,677
882,133 (22,197) 859,936
Total liabilities and equity of canada $ 1,110,649 $ (32,847) $ 1,077,802

68 | consolidated financial statements PORT METRO VancOUVER 2011 financial REPORT
25. explanation of transition to ifRs: (continued)
notes to the reconciliation of canadian GaaP to ifRS
1 Under canadian GaaP, the VfPa’s joint venture was proportionally consolidated. iaS 31, Interest in Joint Ventures, however, permits jointly controlled entities to be equity accounted. accordingly, assets and liabilities that were previously included in the consolidated financial statements have been removed, replaced by a provision for the net liabilities as VfPa has a constructive obligation in that guarantees 20% of the joint venture mortgage.
The following amounts were previously included in the VfPa’s consolidated financial statements:
assets: cash and cash equivalents $ 365 accounts receivable and accrued interest 767 lease financing receivable 1,751 future income taxes 257 Deferred charges 130 Property and equipment 15,483
Total assets $ 18,753
liabilities: accounts payable and accrued liabilities 334 current portion of long-term obligations 475 Other deferred amount 83 long-term obligations 19,731
Total liabilities $ 20,623
net liabilities $ 1,870
2 The VfPa elected to apply the ifRS 1 Employee Benefits Exemption. accordingly, cumulative net actuarial losses and unrecognized vested past service were recognized. in addition, there was recognition of amounts owing to the application ifRic 14, an Interpretation of IAS 19, Employee Benefits. Under ifRic 14, the full present values of the minimum required contributions are recognized on the balance sheet.
3 intangible assets (software) to be recognized separately under ifRS per iaS 38, Intangible Assets.
4 investment property recognized separately under ifRS per iaS 40, Investment property.
5 Provisions, defined under ifRS as liabilities of uncertain timing or amount, are recognized as a separate line item in the Statement of financial Position. as a result, certain amounts were reclassified from ‘accounts payable and accrued liabilities’. accordingly, $10,620,434 was reclassified to ‘Provisions’, net of $141,056 adjustment to present value the obligations. Refer to note 25(a) for a further discussion of the additional provisions recognized on transition to ifRS.
6 The VfPa has componentized its property and equipment per the guidance contained in iaS 16, Property, Plant and Equipment. accordingly, there has been a cumulative decrease in the depreciation expense of $2,489,250.
7 assets are tested for impairment under ifRS per iaS 36, Impairment of Assets. Where indicators of impairment exist, the value in use (net cash flows), or fair value (appraised value) of the assets are determined. if both of these are less than the net book value of the asset, the asset is written down. The impairment test under ifRS resulted in a write-down of canada Place corporation (cPc) assets.
The VfPa elected to apply the ifRS 1 option to use fair value as the deemed cost for selected property and equipment assets. Using this election, the VfPa adjusted the Ballantyne cruise terminal assets with the net result being a reduction to the net book value of those assets.

PORT METRO VancOUVER 2011 financial REPORT consolidated financial statements | 69
(c) Reconciliation of profit for the year ended December 31, 2010:
Previous, Effect of canadian transition to note GaaP ifRS ifRS
Operating revenue: Port revenue $ 57,419 $ - $ 57,419 Rental revenue 1 118,919 (3,255) 115,664 Other revenue 4 4,302 1,432 5,734
180,640 (1,823) 178,817Expenses: Depreciation 1, 2, 6 27,718 (1,485) 26,233 Wages, salaries and benefits 3 28,801 (625) 28,176 Other operating and administrative expenses 1, 4, 5 18,218 78 18,296 Payments in lieu of taxes 6,716 - 6,716 Professional fees and consulting services 1, 5 6,475 (50) 6,425 Dredging 6,989 - 6,989 Maintenance and repairs 1 2,513 (1) 2,512
97,430 (2,083) 95,347
Earnings from operations 83,210 260 83,470
Other expenses (income): federal stipend 5,536 - 5,536 finance cost 1 4,995 (1,194) 3,801 impairment of fixed assets 6 98 263 361 Gain on disposal of equipment (99) - (99) investment income 1 (367) 194 (173) income tax expense 1 21 (21) - (Gain) loss from investment in joint venture 1 - (249) (249)
10,184 (1,007) 9,177
net income $ 73,026 $ 1,267 $ 74,293
Other comprehensive income (loss): actuarial gains (losses) in defined benefit pension plans 3 $ - $ (2,639) $ (2,639)
Total comprehensive income for the year $ 73,026 $ (1,372) $ 71,654

70 | consolidated financial statements PORT METRO VancOUVER 2011 financial REPORT
25. explanation of transition to ifRs: (continued)
notes to the reconciliation of canadian GaaP to ifRS
1 Under canadian GaaP, the VfPa’s joint venture was proportionally consolidated. However, iaS 31 Interest in Joint Ventures permits jointly controlled entitled to be equity accounted. accordingly, income and expenses that were previously included in the consolidated financial statements have been removed, replaced by a single line item Gain/loss from investment in joint venture. The following amounts were previously included in the VfPa’s canadian GaaP financial statements:
Operation revenue $ 3,255Professional fees and outside services 72Maintenance and repairs 1Other operation and administrative expenses 1,021Depreciation 891investment income 194interest expense 1,194income tax expense 21
2 The VfPa has componentized its property and equipment per the guidance contained in iaS 16, Property, Plant and Equipment. accordingly, there has been a decrease in the depreciation expense of $375,720.
3 Under canadian GaaP, the VfPa utilized the corridor method to recognize actuarial gains and losses. Under this method, any amount that exceeded the 10% corridor was amortized over the remaining service period of the VfPa’s active employees. The VfPa has elected the policy option available under ifRS to recognize actuarial gains and losses in full through other comprehensive income. The impact thereof has been a decrease in the wages, salaries and benefits expense of $625,000 and an increase in other comprehensive loss of $2,639,000.
4 Reclassify utility recoveries from expense reduction to other revenues per iaS 18 Revenue.
5 Two additional provisions were recognized per the guidance contained in iaS 37, Provisions, Contingent Liabilities and Contingent Assets ; Oak Street Property, and new Westminster sub-lease.
6 assets are tested for impairment under ifRS per iaS 36, Impairment of Assets. The recognition of impairment and subsequent write-down of canada Place corporation (cPc) assets as of January 1, 2010 resulted in a decrease in depreciation expense for fiscal year 2010. in addition, cPc recognized a further asset impairment write-down in 2010. The adoption of ifRS 1 election to use fair value as the deemed cost of selected assets resulted in a reduction to the net book value of the Ballantyne cruise terminal assets. This in turn, resulted in a decrease in depreciation expense for fiscal year 2010.

PORT METRO VancOUVER 2011 financial REPORT consolidated financial statements | 71
(d) Reconciliation of cash flows for the year ended December 31, 2010:
Previous, Effect of note canadian GaaP transition to ifRS ifRS
cash provided by (used for):
Operating activities: net profit for the year 1 $ 73,026 $ 1,267 $ 74,293 items not involving cash: Depreciation 1 27,718 (1,485) 26,233 impairment of fixed assets 1 98 263 361 impairment of works under construction 276 - 276 loss (gain) on disposal of equipment (99) - (99) Other 1 (893) (347) (1,267)
100,126 (329) 99,797change in non-cash operation working capital:accounts receivable and other assets 2 (7,001) 59 (6,942)accounts payables and accrued liabilities 2, 3 19,773 (848) 18,925Provisions 3 - 1,266 1,266Payment in lieu of taxes (2,320) - (2,320)Deferred revenue 20,651 - 20,651
131,229 148 131,377financing activities: net changes in short-term borrowing (118,009) - (118,009) Proceeds from investing in long-term securities 459 - 459 Principal payments on long-term obligations 2 (490) 449 (41) Proceeds from bond issue 99,199 - 99,199 long-term receivables 2 179 (4) 175 Principal repayment on lease financing assets 2 227 (166) 61
(18,435) 279 (18,156)investing activities: Purchase of property and equipment (55,500) - (55,500) Other 147 - 147 Proceeds on disposal of equipment 140 - 140
net cash used in financing activities (55,213) - (55,213)
increase (decrease) in cash and cash equivalents 57,581 427 58,008
cash and cash equivalent, beginning of year 6,787 (792) 5,995
cash and cash equivalents, end of year $ 64,368 $ (365) $ 64,003
notes to the reconciliation of canadian GaaP to ifRS
1 See comments in 25 c), profit for the year.
2 Under canadian GaaP, the VfPa’s joint venture was proportionally consolidated. However, iaS 31 Interest in Joint Ventures permits jointly controlled entitled to be equity accounted. accordingly, assets, liabilities, and equity and income and expenses that were previously included in the consolidated financial statements have been removed.
3 Provisions, defined under ifRS as liabilities of uncertain timing or amount, are recognized as a separate line item in the Statement of financial Position. as a result, certain amounts were reclassified from accounts payable and accrued liabilities.
26. events after the reporting period:
Sale of assets in joint venture – On february 6, 2012, an agreement was finalized to sell assets of the joint venture for $81.2 million. in the agreement, the purchaser also would assume the joint venture’s mortgage of $39.4 million. The sale closed on february 23, 2012 with net proceeds $41.8 million, before adjustments and disposition costs.

100%
designed by karo group Inc.
PORT METRO VANCOUVER
100 the Pointe, 999 Canada PlaceVancouver, BC, Canada V6C 3t4telephone: 1.604.665.9000Fax: 1.866.284.4271email: [email protected]: @PortmetroVanweb: portmetrovancouver.com