Ⅱ 株式会社メイドー - JUSE · 近年、TQM強化活動で改善活動が活性化し、2010年デミング賞実施賞を受賞した。 規2.1模と沿革 表 規1.1模
2016年度
デミング賞受賞報告講演要旨
Ashok Leyland Limited, Pantnagar Plant
Ⅱ

Summary of Ashok Leyland, Pantnagar Presentation
Contents
1 Organizational Profile
1.1 Background 1.2 Our source of Pride 1.3 The Capabilities 1.4 Customers 1.5 Competitors 1.6 Market size and growth rate 1.7 Ashok Leyland Vision 1.8 Products & Aggregates Manufactured at Pantanagar 1.9 Business Impact 1.10 Rewards & Recognitions 1.11 Corporate Social Contribution
2 Organization structure 3 Business Objectives and Strategies
3.1 Business Environment 3.2 Ashok Leyland’s Vision & AL Pantnagar’s Vision 3.3 Vision Realization > Long term business objectives
4 TQM Promotion 4.1 Need of TQM 4.2 History of TQM initiatives 4.3 TQM education & Promotion 4.4 Stakeholder centric processes.
5 Major management challenges, strategies & progress of TQM initiatives 5.1 Human Resource Management 5.2 Quality Assurance 5.3 Cost Management 5.4 New Model Productionisation 5.5 Delivery Management
6 Effects of TQM, Future Plan & Outstanding activities 6.1 Effects of TQM 6.2 Future Plan 6.3 Outstanding activities
7 Glossary and Abbreviations
― 25 ―

Summary of Ashok Leyland, Pantnagar Presentation
1. Organizational Profile
1.1 Background: Hinduja Group and Ashok Leyland
Hinduja Group is a transnational conglomerate founded in 1919 with turnover of more than USD 25 Billion, presence across 37 countries with more than 70,000 employees. Being a diversified company Hinduja Group have investments in Automotive, Information Technology, Media, Oil & Gas, Power, Real Estate and Healthcare. Ashok Leyland is the flag ship company & belongs to the automotive sector.
Ashok Leyland started in 1948 as Ashok Motors, to assemble cars in collaboration with Austin Motor Company, England. Ashok Motors became Ashok Leyland (AL) in 1954 with the equity participation of Leyland Motors and started manufacturing commercial vehicles. Over the period of time, the company has become one of the key participants in the drivers of India’s economic growth. In 1987 Ashok Leyland was acquired jointly by the Hinduja Group & IVECO. The two companies decided to part ways in 2007, following which Ashok Leyland has become an independent manufacturer of commercial vehicles.
1.2 Our Source of Pride Ashok Leyland today is the second largest manufacturer of medium and heavy commercial vehicles in India and the fourth largest manufacturer of medium and heavy buses worldwide. The company achieved annual revenues of USD 2.5 billion in FY15 (Financial Year 2014-2015). In addition, the company enjoys the distinction of having been continually profitable throughout its 68 years of existence Ashok Leyland vehicles transport almost 70 million people to their destinations every day and move 10.5 million tons of goods every day in India. The company is one of the largest bus OEMs (Origional Equipment Manufacturing) in the Middle East, with over 60% market share in several countries. It also has a rapidly growing presence across African public transport systems. Ashok Leyland has consistently pioneered the introduction of new technologies and innovative products into its markets illustrated in Table1.1
Table 1.1: Technologies pioneered by Ashok Leyland Year India’s First Year India’s First 1967 First Indian made double decker- “Titan Bus” 1997 India’s first CNG Bus launched 1969 Power steering introduction 2002 India’s first hybrid electric vehicle
1976 Viking-First Bus with alternator 2005 India’s first auto company to receive British Standard 7799 certification
1978 Cheetah- India’s first rear engine bus 2010 India’s first Hybrid CNG Plug in Bus 1980 Taurus-India’s first multi-axle truck 2012 U3723- India’s first 37-tonne haulage truck 1981 India’s first articulated bus-“Vestibule Bus
1.3 The Capabilities Ashok Leyland is a fully independent manufacturer with the ability to design, develop, manufacture and market complete vehicle platforms. The company offers several medium duty and heavy duty truck and bus platforms. It also offers light commercial vehicles developed in partnership with Nissan Motors. In addition, the company offers specialty vehicles as well as power solutions.
Trucks Bus Light Vehicles Specialty Vehicles Power Solutions
Long Haul, Mining, Construction and
Distribution trucks
City, suburban, Inter City, School, Staff and Special Buses
Short Distance light Material transfer
Special Logistics Vehicles
Power generator sets, Marine and Harvester
engines Figure 1.2: Ashok Leyland Product Portfolio To develop these platforms, the company has a full-fledged technical center near Chennai – India, which is capable of independent end-to-end platform development. It is equipped with state-of-the-art instrumentation, test tracks, and other simulation facilities.
The products thus developed are produced in 6 manufacturing plants spread across India strategically located (Ennore, Hosur1, Hosur2, Bhandara, Alwar & Pant Nagar), in addition to two facilities abroad - Optare in the UK and Ras-Al-Khaimah in the Middle East. These facilities have a combined assembly capacity of 1,50,000 vehicles, besides capabilities in engine machining and assembly, gearbox machining and assembly, axle and frame manufacture, cabin stamping, welding, painting and trimming.
Guiding Principles
Work to Give Word is a Bond Act Local Think Global Partnership for Growth Advance Fearlessly
Figure 1.3 : Ashok Leyland- Technical Centre
Figure 1.1 : Hinduja Guiding Principle’s
GUIDING PRINCIPLES:
• Work to Give
• Word is a Bond
• Act Local Think Global
• Partnership for Growth
• Advance Fearlessly
― 26 ―

Summary of Ashok Leyland, Pantnagar Presentation
The company reaches out to its customer through 1289 customer touch points covering length and breadth of the Indian Sub-continent & 138 touch points established in international market.
1.4 Customers Ashok Leyland operates in India, Sri Lanka, Bangladesh, the Middle East and, Sub-Saharan Africa, with a small presence in Russia, Latin America, UK and ASEAN. Across these markets, Ashok Leyland’s products are primarily used for commercial activities. Our trucks are used for transportation of goods, mining, construction, special purpose (firefighting, cement mixer etc.) activities whereas buses are used for transportation of passengers within & outside city. Our customers comprise large fleet operators, individual small fleet operators, individual vehicle owners, entrepreneurs, government controlled state transport undertakings, municipal corporations and other government bodies.
1.5 Competitors In the Indian market, our primary competitors are Tata Motors, Volvo Eicher and Bharat-Benz, with additional niche players such as MAN, Mahindra, SML Isuzu and AMW. In the international market that it operates in, Ashok Leyland competes primarily with Japanese (Fuso, Isuzu), Chinese (e.g. FAW) and Korean (e.g. Hyundai) OEMs, besides its Indian rivals. In select sectors, it also competes with European OEMs. In International market, AL has to compete with the product portfolio of the competitors as illustrated in Table 1.3
Table 1.3: Product Portfolio- International Competitors
Engine 180-230 HP for medium tonnage vehicles and 230-360 HP for high tonnage vehicles Cabin Ergonomic Air Conditioner Cabin, Driver Comfort Electronics Flat Torque Curve Reliability 36-48 months warranty on vehicle & drive train, corrosion warranty of 3 years.
1.6 Market size and growth rate The global industry volumes for medium and heavy trucks (>7.5 T GVW - Gross Vehicle Weight) is estimated to grow from ~2.77 million in FY12 to ~3.88 million by 2020, i.e. an annual growth rate of 5%. The market for medium and heavy duty buses was much smaller, at ~0.39 million in FY13. It is estimated to grow to ~0.54 million by 2020. The Indian market for medium and heavy commercial vehicles industry has been recovering from a deep recession. Total industry volumes dropped to a five year low of 198,000 units of vehicles in FY14, from which it recovered to 230,000 units of vehicles in FY15. Total Industry Volumes had further grown to reach 277,339 units in the first three quarters of FY16.
1.6.1 Market Share Ashok Leyland achieved a market share of 28.6% in Medium and Heavy Commercial vehicles in India (its dominant market) in FY15. This further grew to 31.2% in FY16 (YTD Feb’16). It represents the highest ever market share achieved by the company in the last six years. The company also enjoys significant market share in the segments that it competes in and has moved from 17th position to 14th position in trucks globally & from 6th position to 4th position in Bus globally (from CY09 to CY15 respectively).
1.7 Ashok Leyland Vision Ashok Leyland has decided to remain an independent OEM. To do so, Ashok Leyland needs to grow its scale substantially, to achieve economies of scale across development and production. To focus the organization towards the growing scale, Ashok Leyland has defined its vision as follows:
To be in the Global Top 10 in M&HCV trucks (> 7.5T GVW) & Global Top 5 in M&HCV Buses (8m and above) in volume terms.
Although AL has maintained 2nd position in India but to meet the vision it was essential to expand the footprints outside India. It will be achieved primarily through the introduction of world-class truck platforms
Table 1.2: Plant wise Manufacturing capabilities Aggregates Vehicle
Assembly (Assy)
Plant Cab Press, Weld, Paint & Trim
Axle Assy
Gear Box Assy
Engine Assy
FSM MFG
Ennore Hosur-1
Hosur-2 Bhandara Alwar
Pantnagar
Figure 1.4: AL Manufacturing Plants
Ras Al Khaimah
ALP
― 27 ―
Summary of Ashok Leyland, Pantnagar Presentation
that not only compete successfully with new entrants in India, but also enable the company penetrate international markets.
1.7.1 Inception of AL Pantnagar Plant While Ashok Leyland has maintained its 2nd position in Medium and Heavy commercial trucks for several years in the Indian markets, much of this position was due to the company’s dominance of the southern Indian market, where it enjoyed market shares of over 40%. This was due to the fact that the company originated in this region, had deep relationships with dealers and customers, and had located the bulk of its manufacturing facilities in this region, giving it a very competitive cost position in terms of logistics costs.
The Northern and Eastern markets made up nearly 46% of India’s total industry volumes in FY12, and was poised to grow relative to the South and West. Ashok Leyland had shares of just 14.8% and 9.6% in these markets respectively. Ashok Leyland had the product portfolio to address these markets. However, it did not have a network and a competitive manufacturing base. To address network gaps, Ashok Leyland undertook a massive network expansion with new formats (e.g. containerized service centres) as well as new partners such as local entrepreneurs.
To establish a competitive manufacturing base, Ashok Leyland set up the Ashok Leyland Pantnagar plant. The location was chosen because of: a) Proximity to India’s Northern and Eastern markets, and consequently lower logistics costs b) Tax incentives offered to promote this relatively under developed state that could made AL’s product
highly cost competitive. This had the following implications: a. Pantnagar will produce the company’s future flagship platforms that will compete head-to-head with
global products being launched in India, as well as in international markets. The operations of this plant must therefore be world class in terms of quality, delivery and cost.
b. Pantnagar has been provided incentives by the Government with the intention of upgrading the capabilities and lives of the people in this under-developed area. Hence, the plant also needs to fulfill its social obligation of contributing to the development of the state by using the levers at its disposal making the locals employable through skill development and creating more jobs in the state through local sourcing.
1.7.2 AL Pantnagar Vision Given this, the vision for Pantnagar has been set as: “Help to achieve organization’s vision through World-Class Operations and contribute to Uttarakhand’s development by enhancing Localization as well as increasing Employability”
ALP is a latest, largest and youngest plant of Ashok Leyland. The sales revenue of this plant is 0.59 Billion USD/ Rs36.66 Billion (27 % of Ashok Leyland sales revenue) in FY’15 & is 1.18 Billion USD/ Rs 78.63 Billion in FY16 (42% of Ashok Leyland sales revenue)
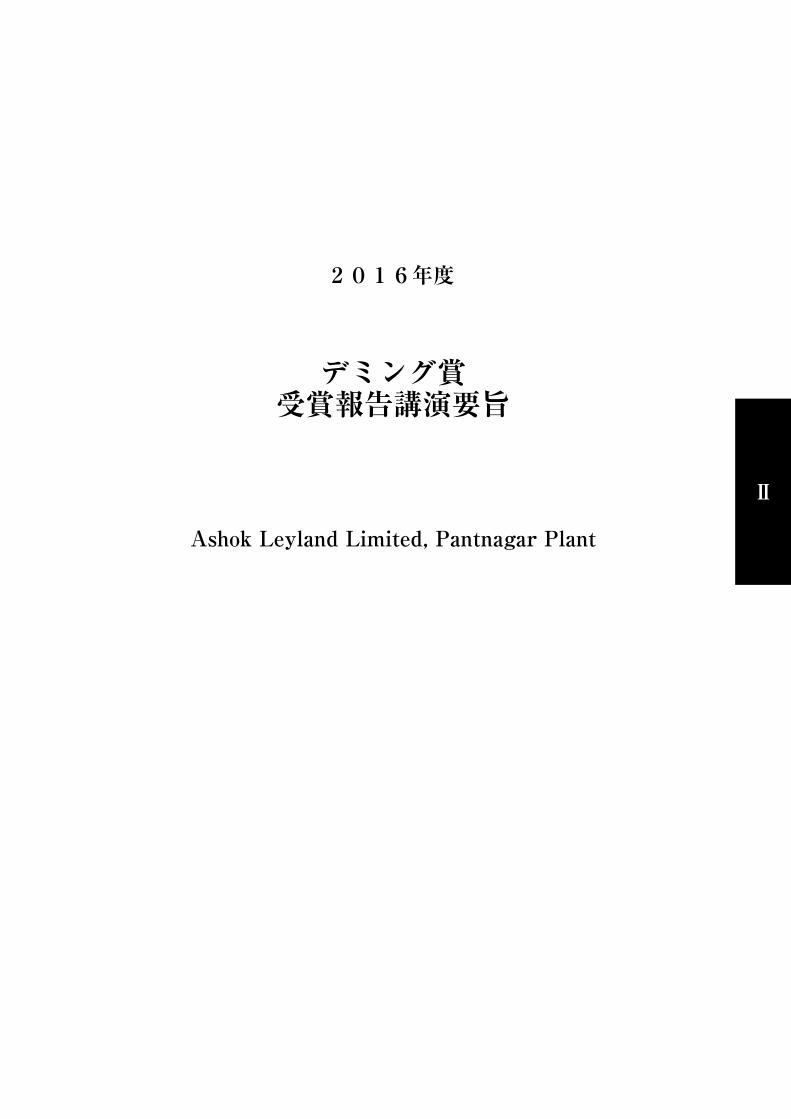
1.8 Products & Aggregates Manufactured at Pantnagar: ALP is an integrated manufacturing plant with the capacity to assemble over 50,000 vehicles annually. It manufactures a full portfolio of trucks with rated load capacities from 10T GVW (Gross vehicle weight) to 49T GVW, engine power from 120 to 230 HP, four kinds of cabins and front end structures, two engine families, three gearbox families, axles and fully built ready to use vehicles. It can also assemble bus chassis. The full list of products and aggregates manufacturable at Pantnagar are shown below (Table 1.4). Currently, ALP is manufacturing 345 variants.
Cabin
Products
Vehicle> Major
Aggregates
Table 1.4 Products & Aggregates
Engine Gearbox Frame Side Member Rear Axle Front Axle
Chassis Trucks (88 Variants)
Chassis Bus (28 Variants)
U Truck (72 Variants)
BOSS (132 Variants) Captain (25
Variants)
Power Train Strength Driver Comfort Requirement
― 28 ―
Summary of Ashok Leyland, Pantnagar Presentation
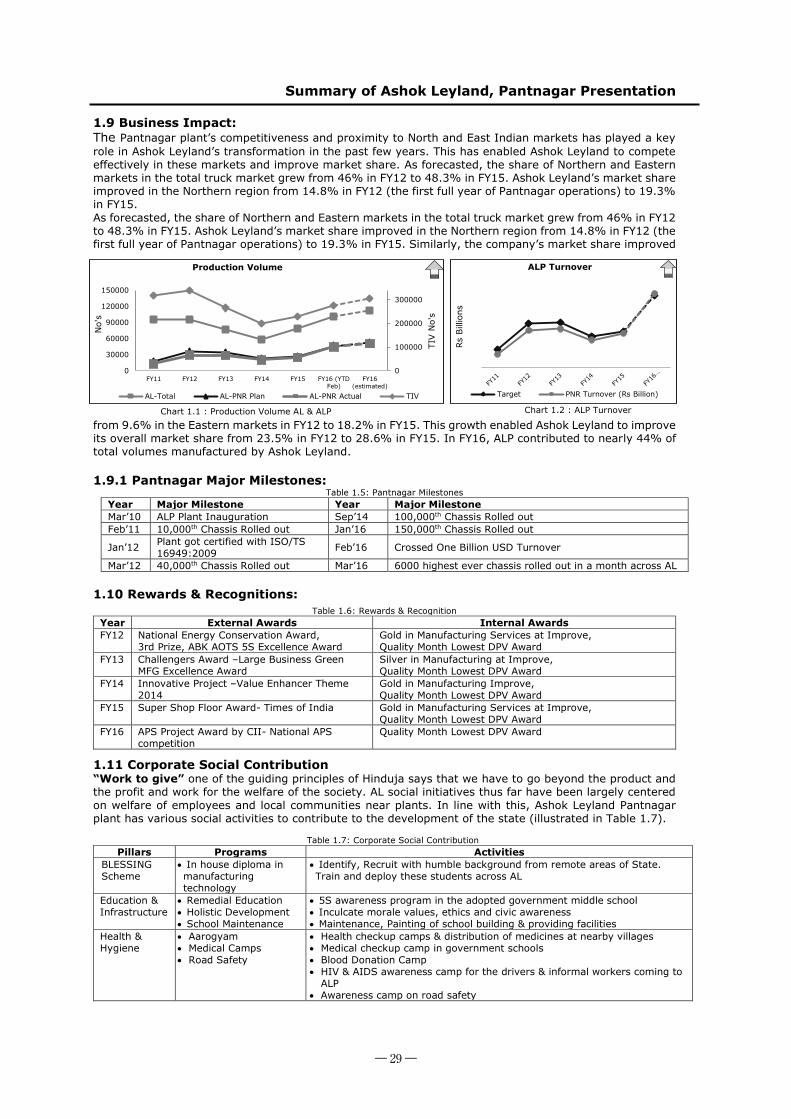
1.9 Business Impact: The Pantnagar plant’s competitiveness and proximity to North and East Indian markets has played a key role in Ashok Leyland’s transformation in the past few years. This has enabled Ashok Leyland to compete effectively in these markets and improve market share. As forecasted, the share of Northern and Eastern markets in the total truck market grew from 46% in FY12 to 48.3% in FY15. Ashok Leyland’s market share improved in the Northern region from 14.8% in FY12 (the first full year of Pantnagar operations) to 19.3% in FY15. As forecasted, the share of Northern and Eastern markets in the total truck market grew from 46% in FY12 to 48.3% in FY15. Ashok Leyland’s market share improved in the Northern region from 14.8% in FY12 (the first full year of Pantnagar operations) to 19.3% in FY15. Similarly, the company’s market share improved
from 9.6% in the Eastern markets in FY12 to 18.2% in FY15. This growth enabled Ashok Leyland to improve its overall market share from 23.5% in FY12 to 28.6% in FY15. In FY16, ALP contributed to nearly 44% of total volumes manufactured by Ashok Leyland. 1.9.1 Pantnagar Major Milestones:
Table 1.5: Pantnagar Milestones Year Major Milestone Year Major Milestone Mar’10 ALP Plant Inauguration Sep’14 100,000th Chassis Rolled out Feb’11 10,000th Chassis Rolled out Jan’16 150,000th Chassis Rolled out
Jan’12 Plant got certified with ISO/TS 16949:2009 Feb’16 Crossed One Billion USD Turnover
Mar’12 40,000th Chassis Rolled out Mar’16 6000 highest ever chassis rolled out in a month across AL 1.10 Rewards & Recognitions:
Table 1.6: Rewards & Recognition Year External Awards Internal Awards FY12 National Energy Conservation Award,
3rd Prize, ABK AOTS 5S Excellence Award Gold in Manufacturing Services at Improve, Quality Month Lowest DPV Award
FY13 Challengers Award –Large Business Green MFG Excellence Award
Silver in Manufacturing at Improve, Quality Month Lowest DPV Award
FY14 Innovative Project –Value Enhancer Theme 2014
Gold in Manufacturing Improve, Quality Month Lowest DPV Award
FY15 Super Shop Floor Award- Times of India Gold in Manufacturing Services at Improve, Quality Month Lowest DPV Award
FY16 APS Project Award by CII- National APS competition
Quality Month Lowest DPV Award
1.11 Corporate Social Contribution “Work to give” one of the guiding principles of Hinduja says that we have to go beyond the product and the profit and work for the welfare of the society. AL social initiatives thus far have been largely centered on welfare of employees and local communities near plants. In line with this, Ashok Leyland Pantnagar plant has various social activities to contribute to the development of the state (illustrated in Table 1.7).
Table 1.7: Corporate Social Contribution Pillars Programs Activities
BLESSING Scheme
In house diploma in manufacturing technology
Identify, Recruit with humble background from remote areas of State. Train and deploy these students across AL
Education & Infrastructure
Remedial Education Holistic Development School Maintenance
5S awareness program in the adopted government middle school Inculcate morale values, ethics and civic awareness Maintenance, Painting of school building & providing facilities
Health & Hygiene
Aarogyam Medical Camps Road Safety
Health checkup camps & distribution of medicines at nearby villages Medical checkup camp in government schools Blood Donation Camp HIV & AIDS awareness camp for the drivers & informal workers coming to
ALP Awareness camp on road safety
Rs
Bill
ions
ALP Turnover
Target PNR Turnover (Rs Billion)
ALP: 44% Contribution
Chart 1.1 : Production Volume AL & ALP Chart 1.2 : ALP Turnover
0
100000
200000
300000
0
30000
60000
90000
120000
150000
FY11 FY12 FY13 FY14 FY15 FY16 (YTDFeb)
FY16(estimated)
TIV N
o's
No'
s
Production Volume
AL-Total AL-PNR Plan AL-PNR Actual TIV
Chart: 1.2
― 29 ―
Summary of Ashok Leyland, Pantnagar Presentation
___ (Functional + Administrative) Reporting
_ _ _Administrative Reporting
(XX) Departmental Employee Strength
2. Organization Structure:
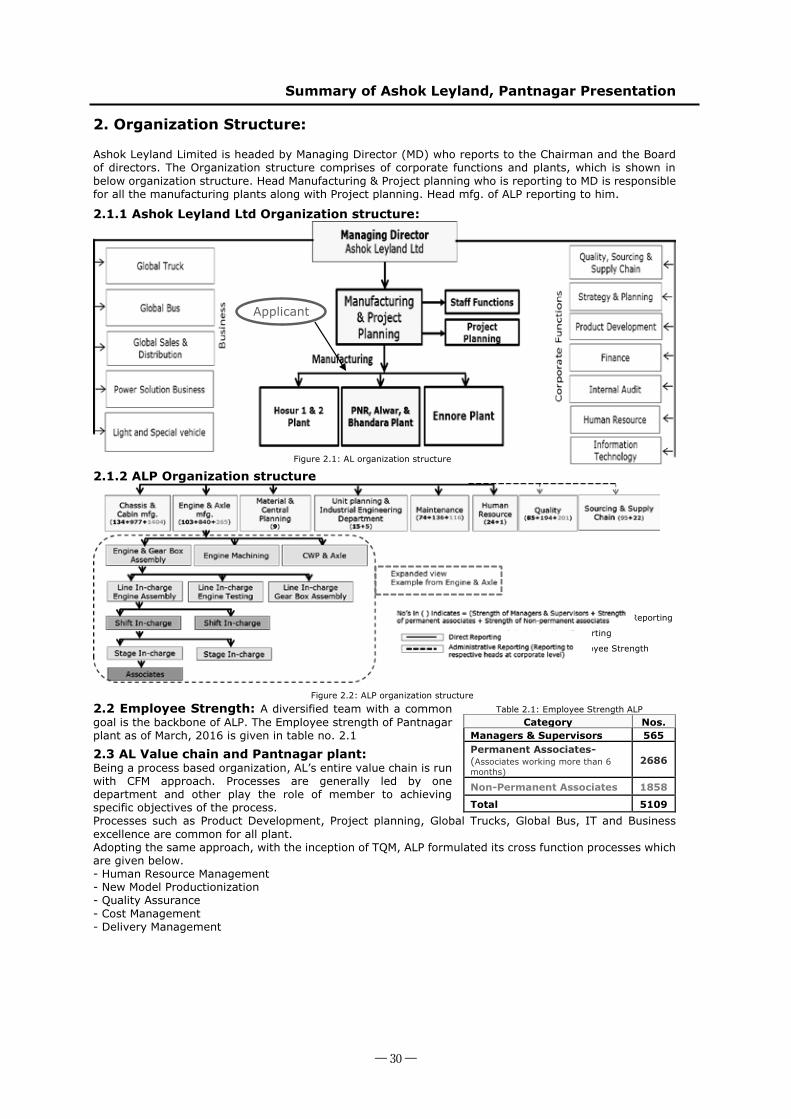
Ashok Leyland Limited is headed by Managing Director (MD) who reports to the Chairman and the Board of directors. The Organization structure comprises of corporate functions and plants, which is shown in below organization structure. Head Manufacturing & Project planning who is reporting to MD is responsible for all the manufacturing plants along with Project planning. Head mfg. of ALP reporting to him.
2.1.1 Ashok Leyland Ltd Organization structure:
2.1.2 ALP Organization structure
2.2 Employee Strength: A diversified team with a common goal is the backbone of ALP. The Employee strength of Pantnagar plant as of March, 2016 is given in table no. 2.1
2.3 AL Value chain and Pantnagar plant: Being a process based organization, AL’s entire value chain is run with CFM approach. Processes are generally led by one department and other play the role of member to achieving specific objectives of the process. Processes such as Product Development, Project planning, Global Trucks, Global Bus, IT and Business excellence are common for all plant. Adopting the same approach, with the inception of TQM, ALP formulated its cross function processes which are given below. - Human Resource Management - New Model Productionization - Quality Assurance - Cost Management - Delivery Management
Table 2.1: Employee Strength ALP Category Nos.
Managers & Supervisors 565 Permanent Associates- (Associates working more than 6 months)
2686
Non-Permanent Associates 1858
Total 5109
Figure 2.1: AL organization structure
Figure 2.2: ALP organization structure
Applicant
― 30 ―
Summary of Ashok Leyland, Pantnagar Presentation
3. Business Objectives and Strategies
3.1 Business Environment 3.1.1 Global Environment The global industry volumes for medium and heavy commercial trucks (>7.5 T GVW) was estimated to grow from ~2.77 million in FY12 to ~3.88 million in 2020, i.e. an annual growth rate of 5%. The market for medium and heavy commercial buses was much smaller, at ~388,000 unit in FY13. It was estimated to grow to ~538,000 unit by year 2020. In addition, three major insights were identified 1) Most future growth would be driven by India, Middle East and Africa 2) The scale required for companies to survive as independent players had grown from ~50,000 per
annum of sales to >100,000 per annum of sales. 3) “Budget Trucks”, placed between low cost and premium trucks, will be the fastest growing segment.
3.1.2 Indian Business Environment (during Vision Formulation phase) The market for Medium & Heavy Commercial Vehicles (M&HCV) was expected to grow in the long term, but at least one recessionary scenario was anticipated in medium term. The number of competitors in the market was about to increase from 2 major players and 3 marginal players, to 9 players. In summary, 1) The Indian market was expected to grow, though it would remain cyclical 2) Major global OEMs were entering the market, all with “budget” trucks 3) Massive excess capacity will result in severe competitive pressure
3.1.3 Competitive Scenario The market comprised three players in India – “Low cost”, “budget” and “premium” products. Different OEMs operated in different parts of this market. An assessment was made of the technology gap, quality, reliability and durability performance of AL with reference to other competitors. The following conclusions were drawn 1) AL needed to develop a full range of “budget trucks” with factory fitted cabins, engines in the 180-360
HP range and a modular chassis design 2) AL needed to substantially enhance its quality and reliability
3.2 Ashok Leyland’s Vision & AL Pantnagar’s Vision Based on the both business environments analysis and competition analysis AL concluded the followings. 1) To survive as an independent player, AL needs to grow much larger in scale 2) To do the above, it had to enter fast-growing markets(CIS,LatAm,ASEAN,MENA & Sub Saharan Africa) 3) AL had to defend itself from multinational rivals by introducing “budget” trucks and with quality &
reliability To set the new direction of the company, the leadership of the company defined the new vision as
“To be in the Global Top 10 in M&HCV Trucks (>7.5T GVW) & Global Top 5 in M&HCV buses (>8 m) in volume terms”
It was estimated that, to achieve the above position, AL would need to reach sales volumes of ~140,000 to 150,000 trucks (~5% market share) and ~40-50000 buses (~10% market share). Achieving the above scale would make AL large enough to survive as an independent player.
3.2.1 Role of Pantnagar to achieve AL Vision There are four parameters which are critical to Company’ vision viz Technology, Market, Product and volumes. At the time of setting up the plant all these factors were taken into considerations. ALP is having the latest technology deployed for all critical processes, having proximity to serve North & Eastern market as earlier base to serve these markets were the southern plants, is capable to launch all new platform vehicles and the capacity to produce 50,000 vehicles annually. ALP will facilitate AL to serve the domestic and international market as it is being the only plant with capability to manufacture critical aggregates (Cabins & Engines) for future medium & heavy commercial trucks.
3.2.2 Pantnagar Plant Vision Over the time ALP evolved with young & dynamic team and a need was felt to rephrase the initial objectives and formulate a vision statement. The Vision statement would include initial thought process and present strategy of Organization which would convey the following message:
• Supporting organization vision by providing World Class Quality products • Enhancing economic viability of the state • Developing employable youth from remote areas • Sustainable growth of local suppliers
ALP vision circulated on 6th Dec’14 is
“Help to achieve organization’s vision through World-Class Operations and contribute to Uttarakhand’s development by enhancing Localization as well as increasing Employability”.
― 31 ―
Summary of Ashok Leyland, Pantnagar Presentation
3.2.3 Background of Keywords included in ALP Vision
3.2.3.1 World Class Operations To meet vision, AL has planned to grow internationally in 5 cluster markets depending upon the “Attractiveness of the market” and “Ability to serve”. Further, 7 anchor markets (Russia, UAE, Peru, Nigeria, Kenya, Indonesia, and Thailand) were identified in 5 clusters to grow. ALP has considered these key clusters as world so that the actions taken should be in-line with the requirements of these areas. Ashok Leyland need to have the world class products which can help the company to penetrate into these markets and have a good will amongst its customer. We need to have the World class operations to supply the world class products. This has led to the statement of “World Class Operations” in the ALP Vision. World class technology, Machinery & Equipment’s plays a vital role to achieve the World Class Operations. ALP from its inception has latest technology from all across the world chosen to perform the critical operations illustrated in Figure 3.1. For ALP, World Class Operation is: “Improving Customer Experience through Competitive Quality Levels and On Time Delivery while
operating with Capital Efficient Practices at “Happy Work Place”
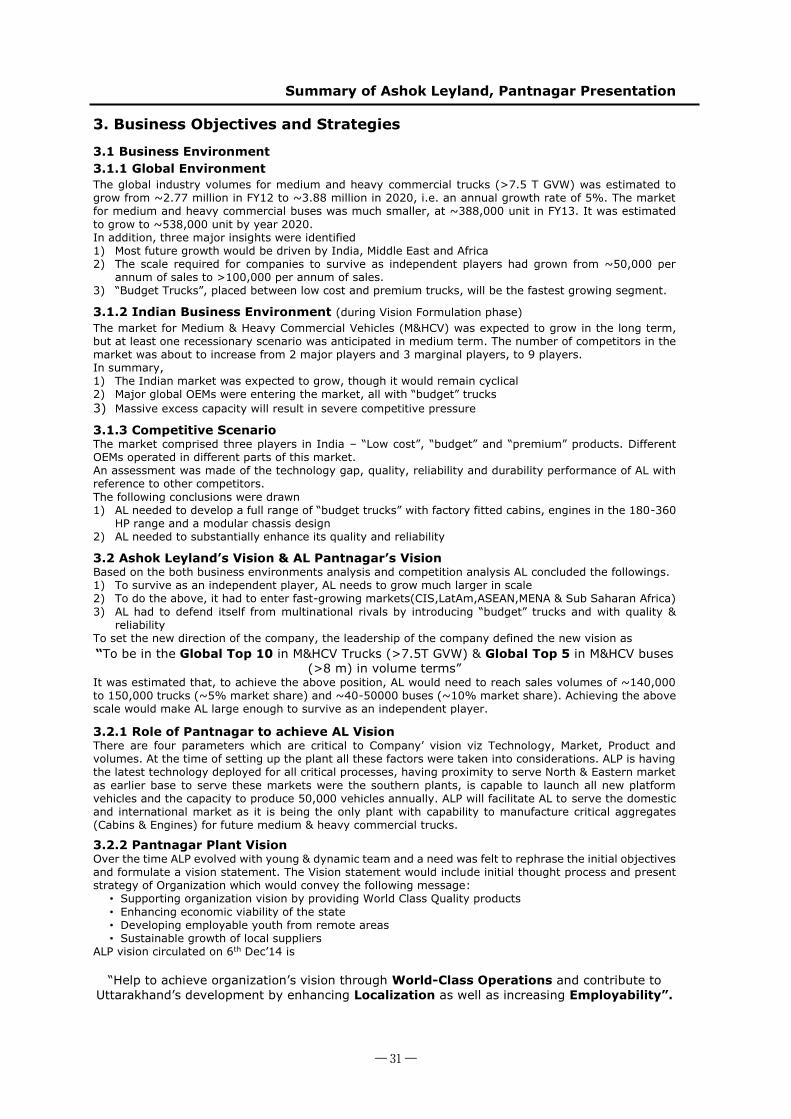
3.2.3.2 Localization: Uttarakhand Development Ashok Leyland being the company operating in the southern & central part of the country had its supplier base confined mainly in the southern region and few in the central part of the country. This led to the long transit time of 7 days from southern India and 5 days from central India respectively to procure the material at ALP plant from current supplier hub (Figure3.2).This would result into the high inventory to be maintained in-house to counter the logistics delay and the damages during transit. Therefore, to increase the economic activities in the state “Localization” term comes into the vision.
3.2.3.3 Employability: Uttarakhand Development: Uttarakhand state stands on 18th rank among 28 states of India in the Gross Domestic Product (GDP) – an indicator of economic activities. This was mainly because of the hilly areas in the state and leading to the less employable conditions in the state. ALP comes with the vision of generating employable conditions and making the manpower skilled so that it will contribute the development of the state.
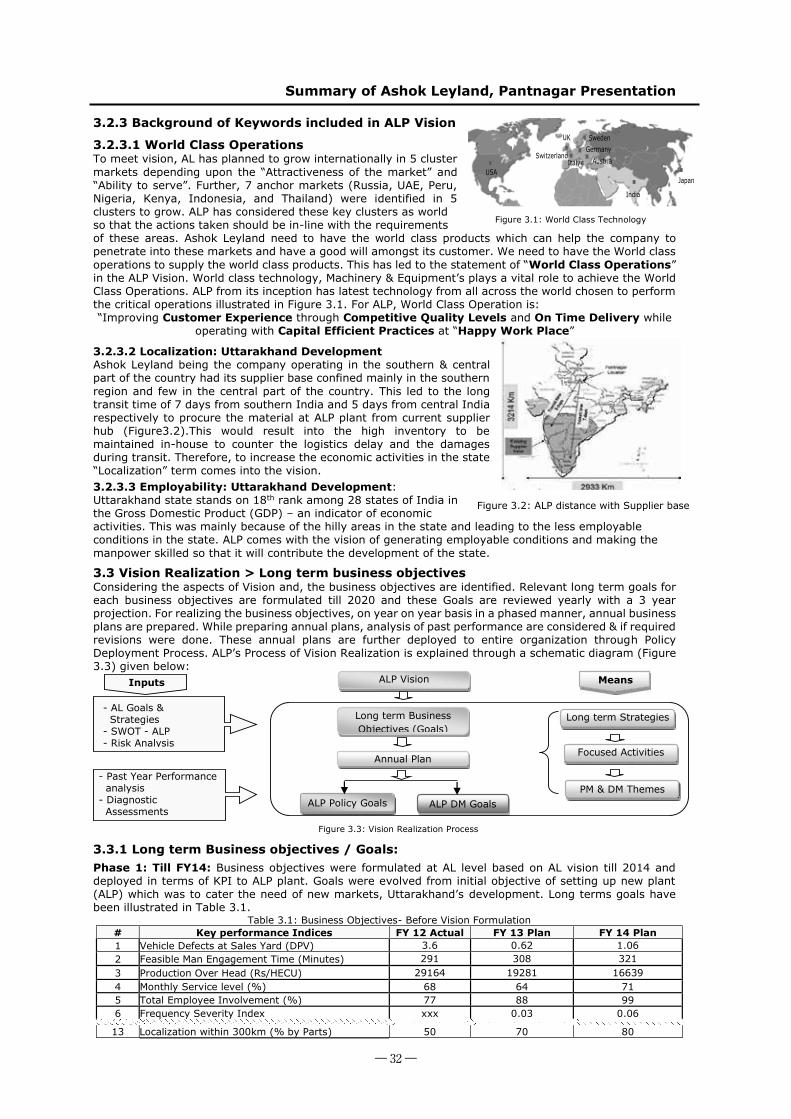
3.3 Vision Realization > Long term business objectives Considering the aspects of Vision and, the business objectives are identified. Relevant long term goals for each business objectives are formulated till 2020 and these Goals are reviewed yearly with a 3 year projection. For realizing the business objectives, on year on year basis in a phased manner, annual business plans are prepared. While preparing annual plans, analysis of past performance are considered & if required revisions were done. These annual plans are further deployed to entire organization through Policy Deployment Process. ALP’s Process of Vision Realization is explained through a schematic diagram (Figure 3.3) given below:
3.3.1 Long term Business objectives / Goals:
Phase 1: Till FY14: Business objectives were formulated at AL level based on AL vision till 2014 and deployed in terms of KPI to ALP plant. Goals were evolved from initial objective of setting up new plant (ALP) which was to cater the need of new markets, Uttarakhand’s development. Long terms goals have been illustrated in Table 3.1.
Table 3.1: Business Objectives- Before Vision Formulation # Key performance Indices FY 12 Actual FY 13 Plan FY 14 Plan 1 Vehicle Defects at Sales Yard (DPV) 3.6 0.62 1.06 2 Feasible Man Engagement Time (Minutes) 291 308 321 3 Production Over Head (Rs/HECU) 29164 19281 16639 4 Monthly Service level (%) 68 64 71 5 Total Employee Involvement (%) 77 88 99 6 Frequency Severity Index xxx 0.03 0.06
13 Localization within 300km (% by Parts) 50 70 80
Long term Strategies
Focused Activities
ALP Policy Goals ALP DM Goals
Long term Business Objectives (Goals)
Annual Plan
PM & DM Themes
ALP Vision Means Inputs
- AL Goals & Strategies - SWOT - ALP - Risk Analysis
Figure 3.2: ALP distance with Supplier base
- Past Year Performance analysis - Diagnostic Assessments
India
Japan
SwedenGermany
Austria
UK
SwitzerlandItaly
USA
Figure 3.1: World Class Technology
Figure 3.3: Vision Realization Process
― 32 ―
Summary of Ashok Leyland, Pantnagar Presentation
14 Localization from Uttarakhand State (% by value) 35 37 38 15 UTK people made employable (Nos.) xxx
Phase 2: After Vision formulation (FY15 onwards): In order to realize organization new vision, ALP’s objectives / goals were redefined and evolved in phased manner. As vision was inline of initial thought process, few of the objectives were continued as is.
ALP is the key player to help AL to achieve its position as per vision. Targeting 5 clusters, AL identified its product expectations of current and future customers. AL benchmarked its competitors (Mitsubishi & Isuzu etc.) w.r.t. Quality Expectations, delivery norms and cost efficiency. Hence ALP formulated its Objectives and KPI for its vision of World Class Operations.
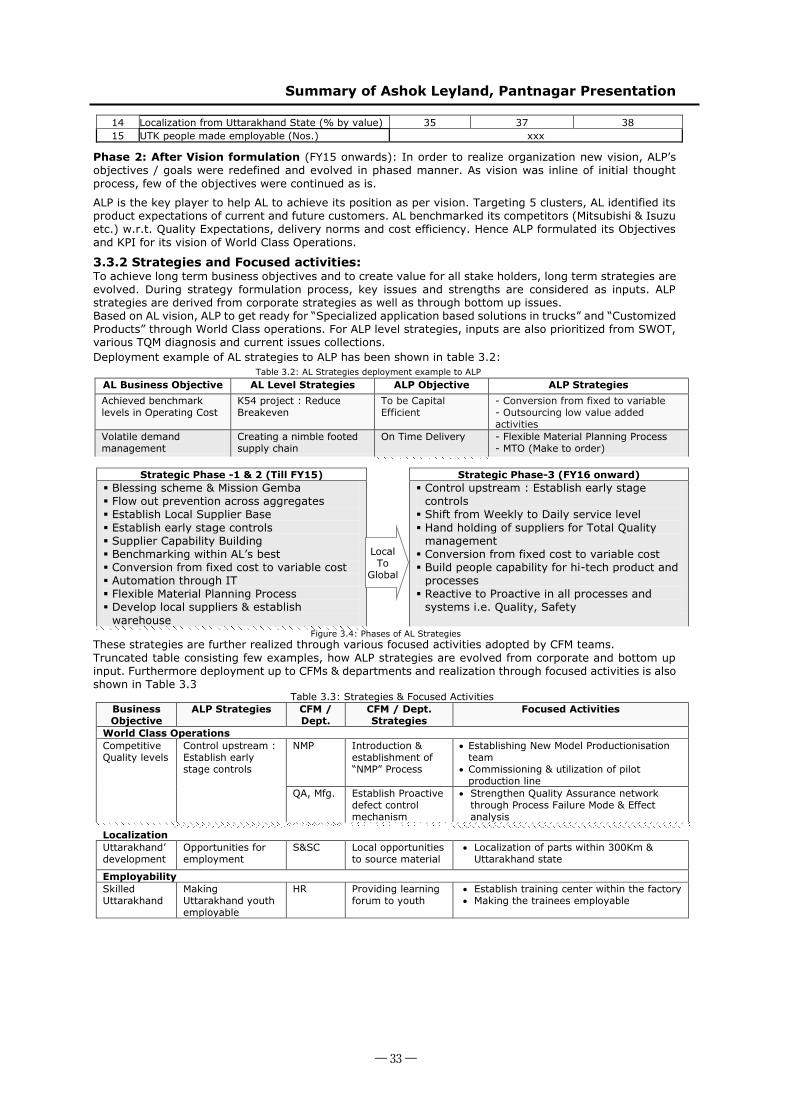
3.3.2 Strategies and Focused activities: To achieve long term business objectives and to create value for all stake holders, long term strategies are evolved. During strategy formulation process, key issues and strengths are considered as inputs. ALP strategies are derived from corporate strategies as well as through bottom up issues. Based on AL vision, ALP to get ready for “Specialized application based solutions in trucks” and “Customized Products” through World Class operations. For ALP level strategies, inputs are also prioritized from SWOT, various TQM diagnosis and current issues collections.
Deployment example of AL strategies to ALP has been shown in table 3.2:
AL Business Objective AL Level Strategies ALP Objective ALP Strategies Achieved benchmark levels in Operating Cost
K54 project : Reduce Breakeven
To be Capital Efficient
- Conversion from fixed to variable - Outsourcing low value added activities
Volatile demand management
Creating a nimble footed supply chain
On Time Delivery
- Flexible Material Planning Process - MTO (Make to order)
Strategic Phase -1 & 2 (Till FY15) Strategic Phase-3 (FY16 onward) Blessing scheme & Mission Gemba Flow out prevention across aggregates Establish Local Supplier Base Establish early stage controls Supplier Capability Building Benchmarking within AL’s best Conversion from fixed cost to variable cost Automation through IT Flexible Material Planning Process Develop local suppliers & establish
warehouse
Control upstream : Establish early stage controls
Shift from Weekly to Daily service level Hand holding of suppliers for Total Quality
management Conversion from fixed cost to variable cost Build people capability for hi-tech product and
processes Reactive to Proactive in all processes and
systems i.e. Quality, Safety
These strategies are further realized through various focused activities adopted by CFM teams. Truncated table consisting few examples, how ALP strategies are evolved from corporate and bottom up input. Furthermore deployment up to CFMs & departments and realization through focused activities is also shown in Table 3.3
Table 3.3: Strategies & Focused Activities Business Objective
ALP Strategies CFM / Dept.
CFM / Dept. Strategies
Focused Activities
World Class Operations Competitive Quality levels
Control upstream : Establish early stage controls
NMP Introduction & establishment of “NMP” Process
Establishing New Model Productionisation team
Commissioning & utilization of pilot production line
QA, Mfg. Establish Proactive defect control mechanism
Strengthen Quality Assurance network through Process Failure Mode & Effect analysis
Localization Uttarakhand’ development
Opportunities for employment
S&SC Local opportunities to source material
Localization of parts within 300Km & Uttarakhand state
Employability Skilled Uttarakhand
Making Uttarakhand youth employable
HR Providing learning forum to youth
Establish training center within the factory Making the trainees employable
Local To
Global
Table 3.2: AL Strategies deployment example to ALP
Figure 3.4: Phases of AL Strategies
― 33 ―
Summary of Ashok Leyland, Pantnagar Presentation
4. TQM Promotion 4.1 Need for TQM: On the one hand, our Vision amidst the intense competition and falling TIV and Profits, forced AL to drastically change the way its business was done. On the other hand, ALP was a clean slate whose culture can be molded into a best in class culture. TQM was considered as the appropriate way to make these two ends to meet. ALP has been selected among two pilot plants on the basis of “Impact on business”, “Flexibility to adopt change” and “Willingness to experiment new concepts”. For achieving the above objectives through TQM, Ashok Leyland started seeking guidance from eminent TQM Sensei from Japan.
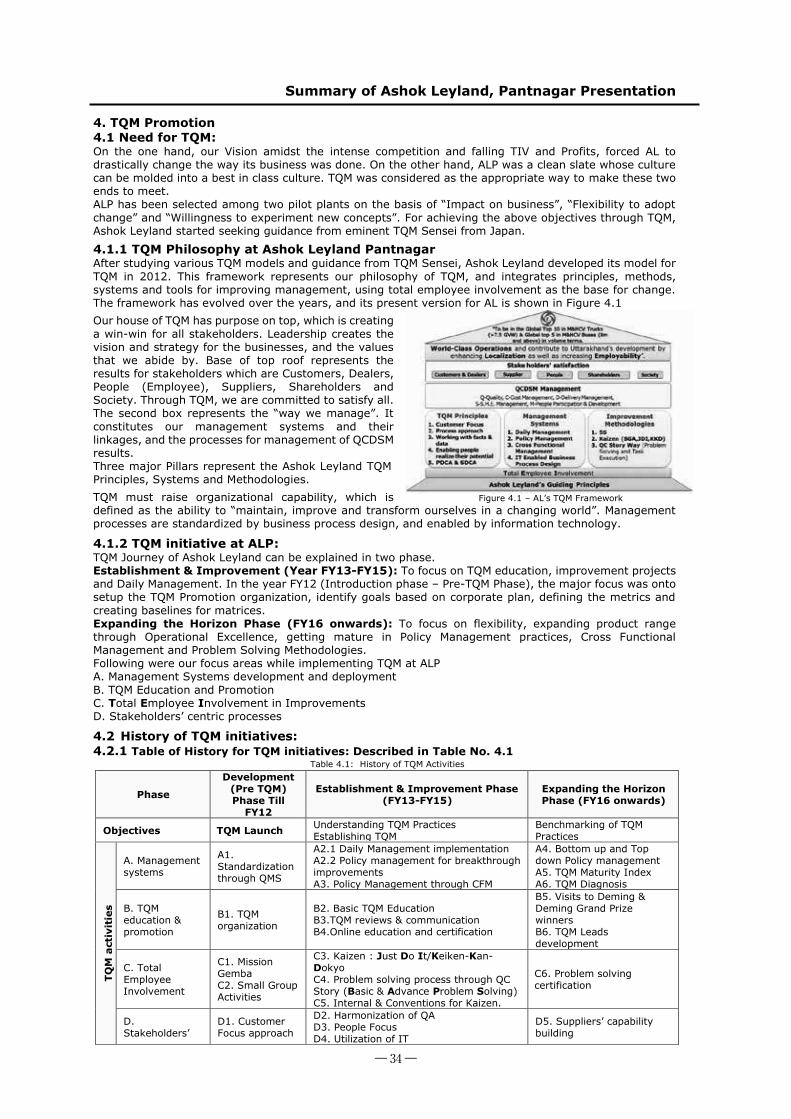
4.1.1 TQM Philosophy at Ashok Leyland Pantnagar After studying various TQM models and guidance from TQM Sensei, Ashok Leyland developed its model for TQM in 2012. This framework represents our philosophy of TQM, and integrates principles, methods, systems and tools for improving management, using total employee involvement as the base for change. The framework has evolved over the years, and its present version for AL is shown in Figure 4.1
Our house of TQM has purpose on top, which is creating a win-win for all stakeholders. Leadership creates the vision and strategy for the businesses, and the values that we abide by. Base of top roof represents the results for stakeholders which are Customers, Dealers, People (Employee), Suppliers, Shareholders and Society. Through TQM, we are committed to satisfy all. The second box represents the “way we manage”. It constitutes our management systems and their linkages, and the processes for management of QCDSM results. Three major Pillars represent the Ashok Leyland TQM Principles, Systems and Methodologies.
TQM must raise organizational capability, which is defined as the ability to “maintain, improve and transform ourselves in a changing world”. Management processes are standardized by business process design, and enabled by information technology.
4.1.2 TQM initiative at ALP: TQM Journey of Ashok Leyland can be explained in two phase. Establishment & Improvement (Year FY13-FY15): To focus on TQM education, improvement projects and Daily Management. In the year FY12 (Introduction phase – Pre-TQM Phase), the major focus was onto setup the TQM Promotion organization, identify goals based on corporate plan, defining the metrics and creating baselines for matrices. Expanding the Horizon Phase (FY16 onwards): To focus on flexibility, expanding product range through Operational Excellence, getting mature in Policy Management practices, Cross Functional Management and Problem Solving Methodologies. Following were our focus areas while implementing TQM at ALP A. Management Systems development and deployment B. TQM Education and Promotion C. Total Employee Involvement in Improvements D. Stakeholders’ centric processes
4.2 History of TQM initiatives: 4.2.1 Table of History for TQM initiatives: Described in Table No. 4.1
Table 4.1: History of TQM Activities
Phase
Development (Pre TQM) Phase Till
FY12
Establishment & Improvement Phase (FY13-FY15)
Expanding the Horizon Phase (FY16 onwards)
Objectives TQM Launch Understanding TQM Practices Establishing TQM
Benchmarking of TQM Practices
TQM
act
ivit
ies
A. Management systems
A1. Standardization through QMS
A2.1 Daily Management implementation A2.2 Policy management for breakthrough improvements A3. Policy Management through CFM
A4. Bottom up and Top down Policy management A5. TQM Maturity Index A6. TQM Diagnosis
B. TQM education & promotion
B1. TQM organization
B2. Basic TQM Education B3.TQM reviews & communication B4.Online education and certification
B5. Visits to Deming & Deming Grand Prize winners B6. TQM Leads development
C. Total Employee Involvement
C1. Mission Gemba C2. Small Group Activities
C3. Kaizen : Just Do It/Keiken-Kan-Dokyo C4. Problem solving process through QC Story (Basic & Advance Problem Solving) C5. Internal & Conventions for Kaizen.
C6. Problem solving certification
D. Stakeholders’
D1. Customer Focus approach
D2. Harmonization of QA D3. People Focus D4. Utilization of IT
D5. Suppliers’ capability building
Figure 4.1: Ashok Leyland TQM Framework
Figure 4.1 – AL’s TQM Framework
― 34 ―
Summary of Ashok Leyland, Pantnagar Presentation
centric processes
Effects The overall performance on Quality, Cost, Delivery, Safety and Morale is given in the “Effects of TQM”
4.2.2 Major Progress (Detailed Explanation) of the TQM initiatives
A. Management systems A.1 Standardization through QMS/TS 16949 Improvements in the QA systems were made, and ALP was certified to TS 16949 standard. Also, as a result of DM as well as ISO efforts, the making and use of standards was brought in all areas. More than 2500 Standards operating procedures and Work instructions were made and, for the first time, displayed on the shop floor. More than 150 managers have been trained in internal audit methodology and System audits are carried out by these auditors.
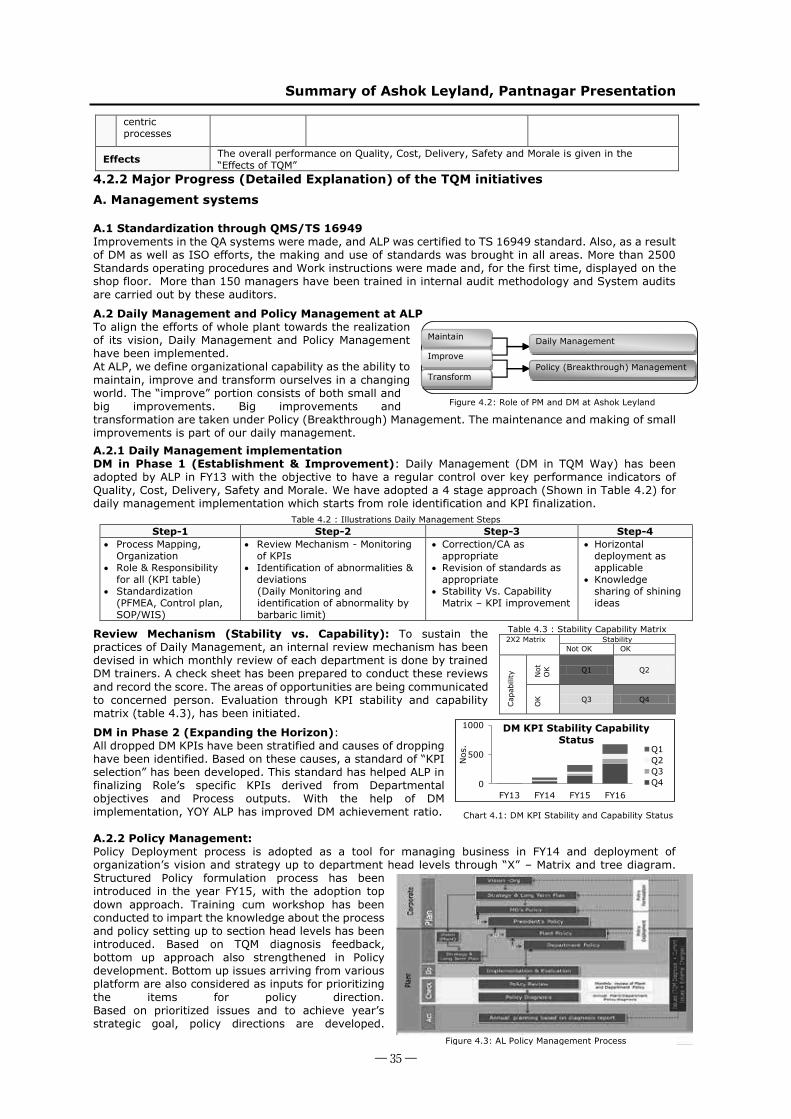
A.2 Daily Management and Policy Management at ALP To align the efforts of whole plant towards the realization of its vision, Daily Management and Policy Management have been implemented. At ALP, we define organizational capability as the ability to maintain, improve and transform ourselves in a changing world. The “improve” portion consists of both small and big improvements. Big improvements and transformation are taken under Policy (Breakthrough) Management. The maintenance and making of small improvements is part of our daily management.
A.2.1 Daily Management implementation DM in Phase 1 (Establishment & Improvement): Daily Management (DM in TQM Way) has been adopted by ALP in FY13 with the objective to have a regular control over key performance indicators of Quality, Cost, Delivery, Safety and Morale. We have adopted a 4 stage approach (Shown in Table 4.2) for daily management implementation which starts from role identification and KPI finalization.
Review Mechanism (Stability vs. Capability): To sustain the practices of Daily Management, an internal review mechanism has been devised in which monthly review of each department is done by trained DM trainers. A check sheet has been prepared to conduct these reviews and record the score. The areas of opportunities are being communicated to concerned person. Evaluation through KPI stability and capability matrix (table 4.3), has been initiated.
DM in Phase 2 (Expanding the Horizon): All dropped DM KPIs have been stratified and causes of dropping have been identified. Based on these causes, a standard of “KPI selection” has been developed. This standard has helped ALP in finalizing Role’s specific KPIs derived from Departmental objectives and Process outputs. With the help of DM implementation, YOY ALP has improved DM achievement ratio. A.2.2 Policy Management: Policy Deployment process is adopted as a tool for managing business in FY14 and deployment of organization’s vision and strategy up to department head levels through “X” – Matrix and tree diagram. Structured Policy formulation process has been introduced in the year FY15, with the adoption top down approach. Training cum workshop has been conducted to impart the knowledge about the process and policy setting up to section head levels has been introduced. Based on TQM diagnosis feedback, bottom up approach also strengthened in Policy development. Bottom up issues arriving from various platform are also considered as inputs for prioritizing the items for policy direction. Based on prioritized issues and to achieve year’s strategic goal, policy directions are developed.
Table 4.2 : Illustrations Daily Management Steps Step-1 Step-2 Step-3 Step-4
Process Mapping, Organization
Role & Responsibility for all (KPI table)
Standardization (PFMEA, Control plan, SOP/WIS)
Review Mechanism - Monitoring of KPIs
Identification of abnormalities & deviations
(Daily Monitoring and identification of abnormality by barbaric limit)
Correction/CA as appropriate
Revision of standards as appropriate
Stability Vs. Capability Matrix – KPI improvement
Horizontal deployment as applicable
Knowledge sharing of shining ideas
Table 4.3 : Stability Capability Matrix 2X2 Matrix Stability
Not OK OK
Cap
abili
ty
Not
O
K
Q1 Q2
OK
Q3 Q4
Figure 4.3: AL Policy Management Process
Daily Management
Policy (Breakthrough) Management
Maintain
Improve
Transform
Fig 4.3 TQM infrastructure
Figure 4.2: Role of PM and DM at Ashok Leyland
0
500
1000
FY13 FY14 FY15 FY16
Nos
.
DM KPI Stability Capability Status
Q1Q2Q3Q4
Chart 4.1: DM KPI Stability and Capability Status
― 35 ―
Summary of Ashok Leyland, Pantnagar Presentation
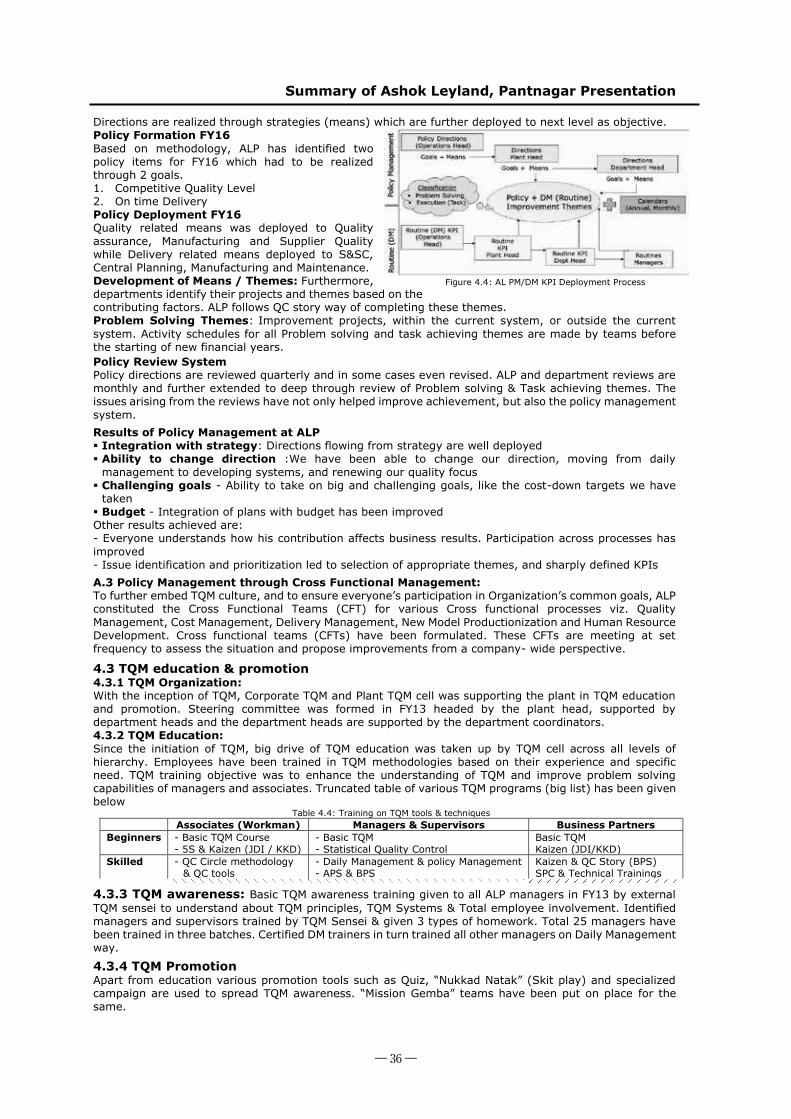
Directions are realized through strategies (means) which are further deployed to next level as objective. Policy Formation FY16 Based on methodology, ALP has identified two policy items for FY16 which had to be realized through 2 goals. 1. Competitive Quality Level 2. On time Delivery Policy Deployment FY16 Quality related means was deployed to Quality assurance, Manufacturing and Supplier Quality while Delivery related means deployed to S&SC, Central Planning, Manufacturing and Maintenance. Development of Means / Themes: Furthermore, departments identify their projects and themes based on the contributing factors. ALP follows QC story way of completing these themes. Problem Solving Themes: Improvement projects, within the current system, or outside the current system. Activity schedules for all Problem solving and task achieving themes are made by teams before the starting of new financial years.
Policy Review System Policy directions are reviewed quarterly and in some cases even revised. ALP and department reviews are monthly and further extended to deep through review of Problem solving & Task achieving themes. The issues arising from the reviews have not only helped improve achievement, but also the policy management system.
Results of Policy Management at ALP Integration with strategy: Directions flowing from strategy are well deployed Ability to change direction :We have been able to change our direction, moving from daily
management to developing systems, and renewing our quality focus Challenging goals - Ability to take on big and challenging goals, like the cost-down targets we have
taken Budget - Integration of plans with budget has been improved Other results achieved are: - Everyone understands how his contribution affects business results. Participation across processes has improved - Issue identification and prioritization led to selection of appropriate themes, and sharply defined KPIs
A.3 Policy Management through Cross Functional Management: To further embed TQM culture, and to ensure everyone’s participation in Organization’s common goals, ALP constituted the Cross Functional Teams (CFT) for various Cross functional processes viz. Quality Management, Cost Management, Delivery Management, New Model Productionization and Human Resource Development. Cross functional teams (CFTs) have been formulated. These CFTs are meeting at set frequency to assess the situation and propose improvements from a company- wide perspective.
4.3 TQM education & promotion 4.3.1 TQM Organization: With the inception of TQM, Corporate TQM and Plant TQM cell was supporting the plant in TQM education and promotion. Steering committee was formed in FY13 headed by the plant head, supported by department heads and the department heads are supported by the department coordinators. 4.3.2 TQM Education: Since the initiation of TQM, big drive of TQM education was taken up by TQM cell across all levels of hierarchy. Employees have been trained in TQM methodologies based on their experience and specific need. TQM training objective was to enhance the understanding of TQM and improve problem solving capabilities of managers and associates. Truncated table of various TQM programs (big list) has been given below
Table 4.4: Training on TQM tools & techniques Associates (Workman) Managers & Supervisors Business Partners
Beginners - Basic TQM Course - 5S & Kaizen (JDI / KKD)
- Basic TQM - Statistical Quality Control
Basic TQM Kaizen (JDI/KKD)
Skilled - QC Circle methodology & QC tools
- Daily Management & policy Management - APS & BPS
Kaizen & QC Story (BPS) SPC & Technical Trainings
4.3.3 TQM awareness: Basic TQM awareness training given to all ALP managers in FY13 by external TQM sensei to understand about TQM principles, TQM Systems & Total employee involvement. Identified managers and supervisors trained by TQM Sensei & given 3 types of homework. Total 25 managers have been trained in three batches. Certified DM trainers in turn trained all other managers on Daily Management way.
4.3.4 TQM Promotion Apart from education various promotion tools such as Quiz, “Nukkad Natak” (Skit play) and specialized campaign are used to spread TQM awareness. “Mission Gemba” teams have been put on place for the same.
Figure 4.4: AL PM/DM KPI Deployment Process
― 36 ―
Summary of Ashok Leyland, Pantnagar Presentation
5S Promotion Nukkad Natak Poster competitions Reward & Recognition
4.3.5 Total Employee Involvement
Deployment of TQM Initiatives through “Mission Gemba” People participation: To deploy all TQM initiatives with 100% involvement of all employee, “Mission Gemba” has been started in FY11. The objective of Mission Gemba was to drive frontline attitudinal change and improve work culture to achieve significant business performance improvement. Mission Gemba is based on ISER (Information, Skill, Empowerment, and Reward & Recognition) concept. Various TQM initiatives such as 5S, SGA, Kaizen (JDI/KKD), Safety and Cost reduction projects have been promoted through Gemba initiative.
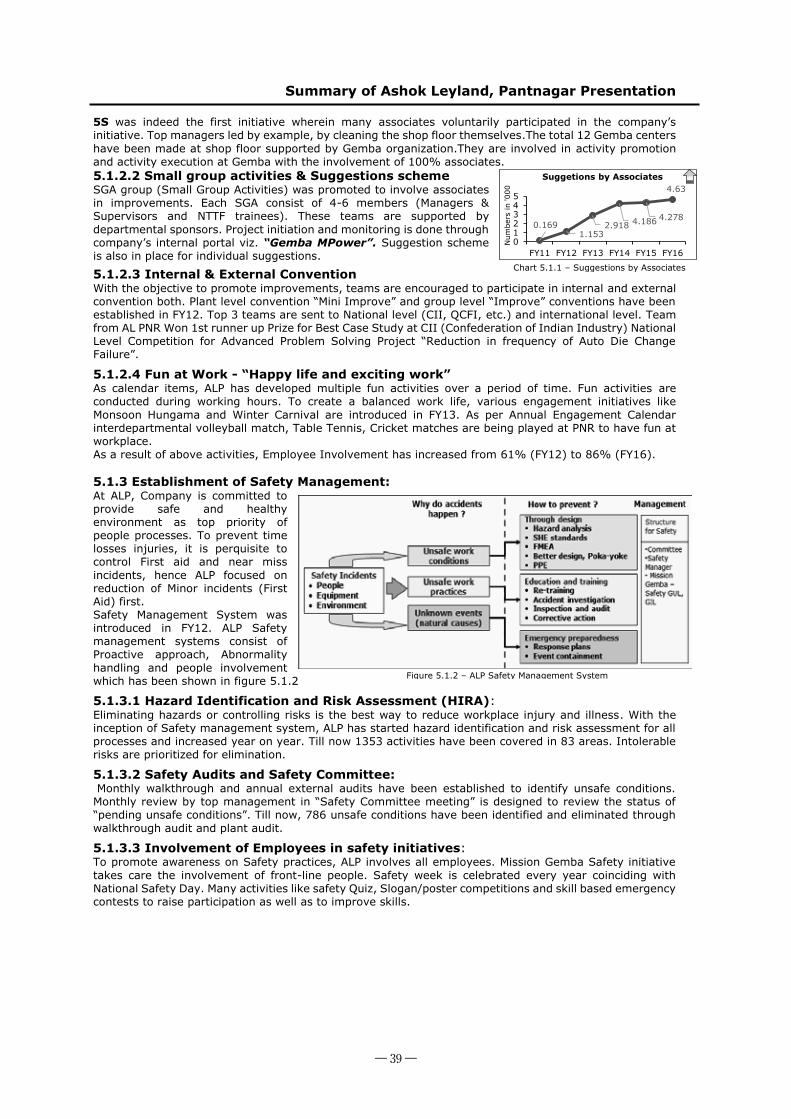
Small Group Activities, Kaizens (JDI & KKD) & Problem solving process SGA group (Small Group Activities) was promoted to involve associates in improvements. A complete Kaizen hierarchy has been developed based on the level of complexity and employee participation. Just Do It and Keiken, Kan, Dokyo concept has been started in FY14 by quality department and over the period of time this initiative spread across the plant. JDIs are the actions on abnormalities or problems which can be found by just pondering over and analyzing the situation. Total 26229 JDI projects have been completed till FY16. KKD four step methodology for system level analysis which can be resolved through experience, intuition and guts. 1035 Projects have been completed till FY16.
(6) Internal Convention / External Convention With the objective to promote improvements, teams are encouraged to participate in internal and external convention both. Plant level convention “Mini Improve” and organization level “Improve” conventions have been started in FY12 at ALP. All SGA teams participate at plant level first and then go for AL level convention. In FY16, total 50 teams participated in plant level and 10 teams have participated at AL level. Top 3 teams are sent to National level (CII, QCFI, etc.) and international level.
4.4 Stakeholder centric processes 4.4.1 Customer Focus Ashok Leyland reiterated the fundamental principle of putting the customer first. The year FY12 was a turning point for ALP, wherein under the slogan “Your Product (Customer’s product)” was launched. Customers were involved in product up-gradation. We have started VOC (Voice of customer) capturing directly by inviting customer to our premises, suggestions are deployed to various functions (Product development, Service team) directly.
4.4.2 Harmonization of QA Efforts towards harmonizing QA systems were initiated. To provide the same experience to customer, Central Quality has established and deployed common systems to all AL plants. QA has been strengthened with various sub processes for Field Quality, Manufacturing Quality, Supplier Quality and New Product Quality.
4.4.3 People Focus (Participation, Capability and Team Work) Ashok Leyland is a people oriented organization. We really care about enhancing the abilities and quality of life of all our people. With the initiation of TQM, Processes have been established to enhance people engagement, capability and team work. Accountability of people have been shifted to processes and departments with HR support. All people related processes are run through CFT approach.
4.4.4 Improving Processes productivity through utilization of IT Information Technology (IT) in Ashok Leyland has come a long way from batch processing applications for payroll, accounting and inventory to enterprise-wide on-line information systems at present. The current IT infrastructure provides web applications & mobility solutions for providing information connectivity with customers & suppliers and implementation of SAP for integrating various business functions. Aim of information systems at ALP is to effectively implement business strategy, provide optimum service to all internal and external customers and gain competitive advantage.
4.4.5 Suppliers’ capability building programs At Ashok Leyland, we consider Suppliers as our business partners. Common business plans and review have been started quarterly. Capability building programs have been launched at supplier end in FY14 through trainings, system audit and establishing process control measures. In FY16, Supplier capability program rejuvenated through the implementation of TQM at supplier end. Total 9 suppliers have been selected for same.
Figure 4.5: TQM Promotion events through Mission Gemba
0500100015002000
10
60
110
FY12 FY13 FY14 FY15 FY16 Rs
in '0
00
No.
of
Pr
ojec
tsAPS Project and Cost Benefits
Cum. Cost Saving in (INR Lacs) Project Plan
0
2000
4000
FY11 FY12 FY13 FY14 FY15 FY16
Proj
ects
in
Nos
.
SGA Improvements
Plan Actual
236% Improvement
Chart 4.2 SGA project status Chart 4.3 APS Project vs. cost savings
― 37 ―

Summary of Ashok Leyland, Pantnagar Presentation
5. Major management challenges, strategies & progress of TQM initiatives
5.1 Human Resource Management Uttarakhand, being a hilly state was less exposed to industries and technical education. ALP was facing the draught of required technical skill during inception phase. In line with company vision, HRM has taken an objective to create a happy work place where people can strive from within to contribute for self-development as well as in improvements
5.1.1 Enhancing availability and quality of fixed & variable manpower:
To enhance the skill level at ALP , Blessing scheme was introduced and NTTF Trainees (fixed manpower) were developed as per the skill requirements. Sub contractor (Layam) Diploma trainees were inducted year after year to maintain the required skill level.The contract workmen (Variable manpower) is also focussed now with the help of practical training centers to give them hands on exposure before they start working in the shop floor.
5.1.1.1 Creating Employability- Blessing Scheme:
In line with our vision of “Creating Employability”, Blessing Scheme (Ashirwaad Yojana) was introduced in FY11, which is a collaborative initiative between ALP, State Govt and training partner NTTF (a premium Technical Institute in India). Objective of scheme is to target the underprivileged section of society, living in remote places and have no opportunity of employment. A state of the art Technical Learning Centre with all modern Laboratory facilities was created and started under the umbrella of Blessing Scheme. This programme has helped us to meet the skill demand by imparting relevant industry skills and also promoting the employability of the underpriviliged & needy youth of Uttarakhand. Initially, our joining rate was only 50% as parents were hesitating to send their children to city for technical education especially girls. To assure them, a fully furnished girls Hostel within plant was built to give “Home away from home” feeling & comfort. Presently we have 22% of girls in this category
5.1.1.2 Technical manpower from other sources: After mapping of required skills, it was analysed that there was a gap due to less availability of technically trained manpower in UTK state.To bridge the gap between skilled manpower required Vs. actual at Plant, induction of Diploma Engineers from other states & other categories of trainees commenced like:, UOU (Uttarakhand Open University), KU (Kumaon University). This skilled workforce also get training (Theory as well as practical training) as a part of their curriculum at their respective Institution/ Universities. 5.1.1.3 Improve people skill in all processes: All the manufacturing processes were mapped for the required skill level. This was done to optimise the allocation of the fixed and variable manpopwer. Each manufacturing process was studied closely for the required skill levels and consequently the skills were defined and modified. Process of skill building at ALP is shown in figure below (5.1.1)
5.1.1.4 TQM in NTTF Curriculum: System of “post deployment” feedback is established and changes have been done in curriculum. TQM knowledge was one of the major feedbacks from departments as Company is working with TQM way now. TQM subjects have been added in curriculum from FY16 onwards (Refer in table 5.1.1) This scheme is resulted in changing lives of 308 students till now who has successfully completed the 4 year tenure of this scheme and got placed pan India in various networks of Ashok Leyland to serve the Nation.
5.1.2 Total Employee Involvement (TEI): 5.1.2.1 Mission Gemba for TEI To involve 100% front line associates in improvements, “Mission Gemba” has been started in FY11. The objective of Mission Gemba was to drive frontline attitudinal change and improve work culture to achieve significant business performance improvement. Mission Gemba is based on ISER (Information, Skill, Empowerment, and Reward & Recognition) concept. 9 Initiatives are run under the umbrella of mission Gemba.
Safety 5 S Quality Cost Critical Machine Inventory Mission Gemba Effort Ergnomy index Go Green
Identification of required skill set
Skill evaluation (Gap analysis)
Training need identifiacation Training Plan On job training Training evaluation
and assessment
Table 5.1.1 – TQM Subjects in Curriculum Topics Items to Cover Basics of TQM
Importance, bigger meaning of TQM, TQM Principles, Methodology and tools
Problem solving Basic problem solving steps and tools
Daily Management
What it is, how it helps and what is his role and contribution
TPM Basic knowledge of TPM
Figure 5.1.1– Mission Gemba Initiatives
Figure 5.1.1 - Associate’s Skill Assessment process
― 38 ―
Summary of Ashok Leyland, Pantnagar Presentation
5S was indeed the first initiative wherein many associates voluntarily participated in the company’s initiative. Top managers led by example, by cleaning the shop floor themselves.The total 12 Gemba centers have been made at shop floor supported by Gemba organization.They are involved in activity promotion and activity execution at Gemba with the involvement of 100% associates. 5.1.2.2 Small group activities & Suggestions scheme SGA group (Small Group Activities) was promoted to involve associates in improvements. Each SGA consist of 4-6 members (Managers & Supervisors and NTTF trainees). These teams are supported by departmental sponsors. Project initiation and monitoring is done through company’s internal portal viz. “Gemba MPower”. Suggestion scheme is also in place for individual suggestions.
5.1.2.3 Internal & External Convention With the objective to promote improvements, teams are encouraged to participate in internal and external convention both. Plant level convention “Mini Improve” and group level “Improve” conventions have been established in FY12. Top 3 teams are sent to National level (CII, QCFI, etc.) and international level. Team from AL PNR Won 1st runner up Prize for Best Case Study at CII (Confederation of Indian Industry) National Level Competition for Advanced Problem Solving Project “Reduction in frequency of Auto Die Change Failure”.
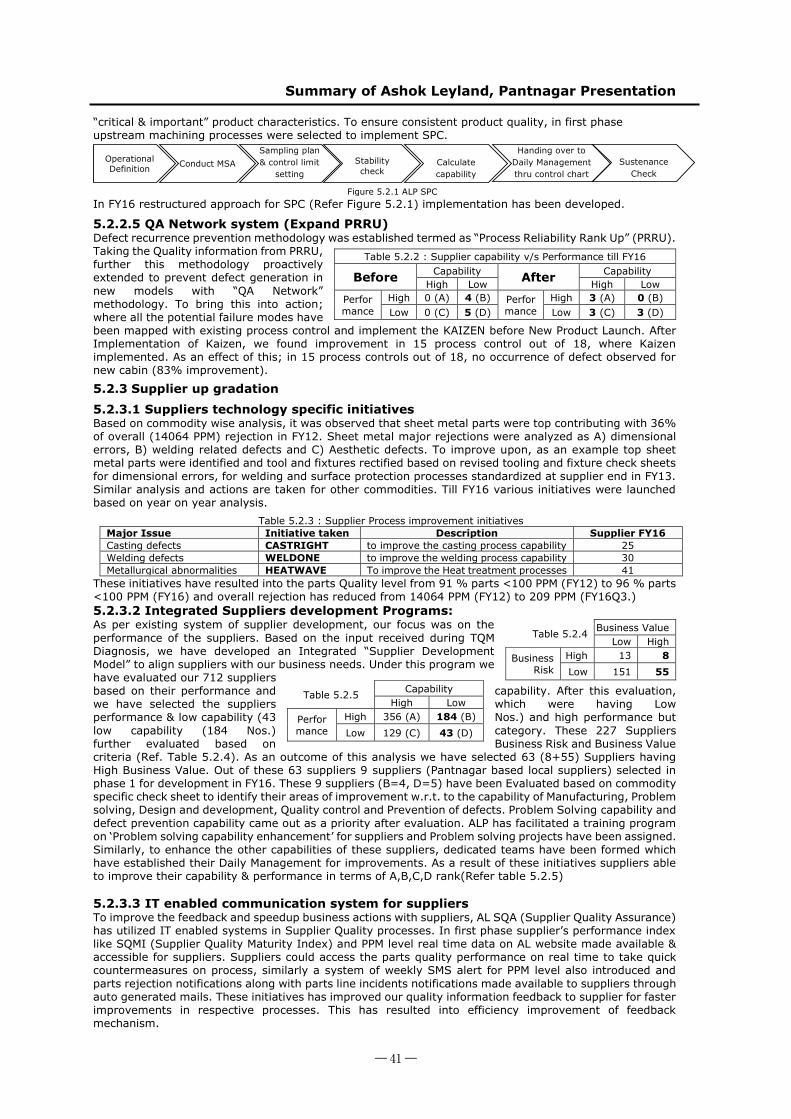
5.1.2.4 Fun at Work - “Happy life and exciting work” As calendar items, ALP has developed multiple fun activities over a period of time. Fun activities are conducted during working hours. To create a balanced work life, various engagement initiatives like Monsoon Hungama and Winter Carnival are introduced in FY13. As per Annual Engagement Calendar interdepartmental volleyball match, Table Tennis, Cricket matches are being played at PNR to have fun at workplace. As a result of above activities, Employee Involvement has increased from 61% (FY12) to 86% (FY16). 5.1.3 Establishment of Safety Management: At ALP, Company is committed to provide safe and healthy environment as top priority of people processes. To prevent time losses injuries, it is perquisite to control First aid and near miss incidents, hence ALP focused on reduction of Minor incidents (First Aid) first. Safety Management System was introduced in FY12. ALP Safety management systems consist of Proactive approach, Abnormality handling and people involvement which has been shown in figure 5.1.2
5.1.3.1 Hazard Identification and Risk Assessment (HIRA): Eliminating hazards or controlling risks is the best way to reduce workplace injury and illness. With the inception of Safety management system, ALP has started hazard identification and risk assessment for all processes and increased year on year. Till now 1353 activities have been covered in 83 areas. Intolerable risks are prioritized for elimination.
5.1.3.2 Safety Audits and Safety Committee: Monthly walkthrough and annual external audits have been established to identify unsafe conditions. Monthly review by top management in “Safety Committee meeting” is designed to review the status of “pending unsafe conditions”. Till now, 786 unsafe conditions have been identified and eliminated through walkthrough audit and plant audit.
5.1.3.3 Involvement of Employees in safety initiatives: To promote awareness on Safety practices, ALP involves all employees. Mission Gemba Safety initiative takes care the involvement of front-line people. Safety week is celebrated every year coinciding with National Safety Day. Many activities like safety Quiz, Slogan/poster competitions and skill based emergency contests to raise participation as well as to improve skills.
Chart 7- Grievance Raised Vs. Closed Chart 8- Grievance Area-wise
0.1691.153
2.918 4.186 4.278
4.63
012345
FY11 FY12 FY13 FY14 FY15 FY16
Num
bers
in '0
00
Suggetions by Associates
Figure 5.1.2 – ALP Safety Management System
Chart 5.1.1 – Suggestions by Associates
― 39 ―

Summary of Ashok Leyland, Pantnagar Presentation
5.2 Quality Assurance In FY11, majority of incoming parts were received from southern AL Plant (long distance) of India, transit quality & on time delivery were the concerns. With introduction of new models and variants and production ramp-up, complexity of vehicle increased. Immediate challenge was to stop flow-out of defects to customer to meet desired quality with operational efficiency. 5.2.1 Defect Flow out Control to improve Outgoing “Product Quality” 5.2.1.1 “0 MIS” Audit @ sales yard: To improve the immediate feedback on built quality, based on the check sheet “0 MIS audit at sales yard has been started from FY12. During this audit, passed to sales vehicles are being selected on random basis.
Vehicle visual appearance was also one of the major concerns to develop customer perceived quality. Since plant was getting major part supply from southern India therefore transit method was contributing to part aesthetics. To improve the exterior parts aesthetic customized trolleys and packaging standards has been prepared. Design improvement also initiated at part level to reduce the defect. To further strengthened the Quality standards based on customer feedback “0MIS” new desired Quality standard revised in FY14 with new check points. 5.2.1.2 Daily management @ Quality gates: Defects used to get capture at Quality Gates & rectified before moving to next stage. Daily Management provided a framework for inspection associate to deal & resolve defects along with the support of concern supervisor. Daily Management Practice started at 27 Nos. of Quality Gates across 8 shops in ALP with standard format of Quality Gate. Inspection check sheets are being derived from Control Plan, Design documents, QA Network, PFMEA, External and Internal Customer complaints etc. Inspection Manual Sheets were prepared for standardized Inspection process.100% of aggregates were inspected on respective quality gates. Check sheets of Quality gates are being revised based on the revision of PFMEA etc. As a result of Daily Management practice, plant could reduce the defect level at respective Quality gates. As an example of DM at QG result, defect per cabin reduced from 7.8 to 2.23 till FY16.
5.2.2 Occurrence Prevention Control:
5.2.2.1 Pokayoke: To avoid “Unintentional Errors” in manufacturing processes, Pokayoke has been introduced across the plant. The input for Pokayoke is being taken from PFMEA, feedback from next process etc. Sustenance of Pokayoke is being ensured thru’ a periodic audit system. Number of Pokayoke improvements have been increased from 403 numbers in FY12 to 1137 in FY16.
5.2.2.2 Benchmarking the cabin quality: As a part of AL strategy, it has been decided to benchmark AL international product ‘AVIA’ (ICV-Truck) for new platform truck “Boss” at ALP in FY13. It also brought a big challenge along with, to sustain its world class quality. Major change part was Cabin and its appearance is equally important for customer, ALP Quality team benchmarked all the cabin related parameters with AVIA truck. ALP compared the truck level data with Indian passenger cars for cabin Gloss Level, Body accuracy and painted cabin salt Spray life. During initial cabin, it was observed that the gloss level in ALP was low as compared to AVIA cabin. Since the painting process of ‘AVIA’ and ALP was different therefore project taken to optimize the parameters. ALP team has optimized the various parameter of paint process by use of Design of Experiment to achieve the desired level of Gloss. Similarly; due to achievement of good quality in gloss & other related parameters in cabin, AL decided to provide 3 years warranty for rust free Cabin which was the new feature in the product. These learnings were horizontally deployed in our new model cabin i.e. CAPTAIN.
5.2.2.3 System improvement in PFMEA: In FY12, PFMEA has been introduced to prevent the potential process failure modes which may affect to our customer. PFMEA was prepared for each process (Line wise) and total 296 PFMEA were got prepared. But still ALP was having defects occurrence in spite of having PFMEA. Also from the inputs of TQM Diagnosis Examiners & past defects data base from all the QG collected and PFMEAs analyzed by Defects vs. their availability in PFMEA and found that: 1) All potential process failure modes were not captured in PFMEA. 2) Failure modes were available in PFMEA but still defects are occurring. During system analysis for finding the weakness of system it was observed that existing system of preparing PFMEA, doesn’t have any adequate methodology. All the inputs are based on brain storming of Cross function teams which is resulting into more time to generate the inputs and also leading to the lapses of many important inputs. So PFMEAs has methodology revised and numbers have reduced from 296 to 32. We have also adopted a new methodology of preparing PFMEA with 16 type Human error identification, Master Ishikawa Diagram etc. Earlier inputs were coming only through brain storming. 5.2.2.4 SPC implementation for critical characteristics: To “Make all critical and important parameters stable & capable” SPC has been initiated by covering
Table 5.2.1 – Cabin Gloss % comparison with domestic players Benchmarking done with Ashok
Leyland Cabin: Boss
Passenger Car Commercial Vehicle Honda Maruti Suzuki Tata Motors AVIA
96 94 88 93 95.5
― 40 ―
Summary of Ashok Leyland, Pantnagar Presentation
“critical & important” product characteristics. To ensure consistent product quality, in first phase upstream machining processes were selected to implement SPC.
In FY16 restructured approach for SPC (Refer Figure 5.2.1) implementation has been developed.
5.2.2.5 QA Network system (Expand PRRU) Defect recurrence prevention methodology was established termed as “Process Reliability Rank Up” (PRRU). Taking the Quality information from PRRU, further this methodology proactively extended to prevent defect generation in new models with “QA Network” methodology. To bring this into action; where all the potential failure modes have been mapped with existing process control and implement the KAIZEN before New Product Launch. After Implementation of Kaizen, we found improvement in 15 process control out of 18, where Kaizen implemented. As an effect of this; in 15 process controls out of 18, no occurrence of defect observed for new cabin (83% improvement).
5.2.3 Supplier up gradation
5.2.3.1 Suppliers technology specific initiatives Based on commodity wise analysis, it was observed that sheet metal parts were top contributing with 36% of overall (14064 PPM) rejection in FY12. Sheet metal major rejections were analyzed as A) dimensional errors, B) welding related defects and C) Aesthetic defects. To improve upon, as an example top sheet metal parts were identified and tool and fixtures rectified based on revised tooling and fixture check sheets for dimensional errors, for welding and surface protection processes standardized at supplier end in FY13. Similar analysis and actions are taken for other commodities. Till FY16 various initiatives were launched based on year on year analysis.
These initiatives have resulted into the parts Quality level from 91 % parts <100 PPM (FY12) to 96 % parts <100 PPM (FY16) and overall rejection has reduced from 14064 PPM (FY12) to 209 PPM (FY16Q3.)
5.2.3.2 Integrated Suppliers development Programs: As per existing system of supplier development, our focus was on the performance of the suppliers. Based on the input received during TQM Diagnosis, we have developed an Integrated “Supplier Development Model” to align suppliers with our business needs. Under this program we have evaluated our 712 suppliers based on their performance and capability. After this evaluation, we have selected the suppliers which were having Low performance & low capability (43 Nos.) and high performance but low capability (184 Nos.) category. These 227 Suppliers further evaluated based on Business Risk and Business Value criteria (Ref. Table 5.2.4). As an outcome of this analysis we have selected 63 (8+55) Suppliers having High Business Value. Out of these 63 suppliers 9 suppliers (Pantnagar based local suppliers) selected in phase 1 for development in FY16. These 9 suppliers (B=4, D=5) have been Evaluated based on commodity specific check sheet to identify their areas of improvement w.r.t. to the capability of Manufacturing, Problem solving, Design and development, Quality control and Prevention of defects. Problem Solving capability and defect prevention capability came out as a priority after evaluation. ALP has facilitated a training program on ‘Problem solving capability enhancement’ for suppliers and Problem solving projects have been assigned. Similarly, to enhance the other capabilities of these suppliers, dedicated teams have been formed which have established their Daily Management for improvements. As a result of these initiatives suppliers able to improve their capability & performance in terms of A,B,C,D rank(Refer table 5.2.5) 5.2.3.3 IT enabled communication system for suppliers To improve the feedback and speedup business actions with suppliers, AL SQA (Supplier Quality Assurance) has utilized IT enabled systems in Supplier Quality processes. In first phase supplier’s performance index like SQMI (Supplier Quality Maturity Index) and PPM level real time data on AL website made available & accessible for suppliers. Suppliers could access the parts quality performance on real time to take quick countermeasures on process, similarly a system of weekly SMS alert for PPM level also introduced and parts rejection notifications along with parts line incidents notifications made available to suppliers through auto generated mails. These initiatives has improved our quality information feedback to supplier for faster improvements in respective processes. This has resulted into efficiency improvement of feedback mechanism.
Table 5.2.2 : Supplier capability v/s Performance till FY16
Before Capability After
Capability High Low High Low
Performance
High 0 (A) 4 (B) Performance
High 3 (A) 0 (B) Low 0 (C) 5 (D) Low 3 (C) 3 (D)
Table 5.2.3 : Supplier Process improvement initiatives Major Issue Initiative taken Description Supplier FY16 Casting defects CASTRIGHT to improve the casting process capability 25 Welding defects WELDONE to improve the welding process capability 30 Metallurgical abnormalities HEATWAVE To improve the Heat treatment processes 41
Table 5.2.4 Business Value Low High
Business Risk
High 13 8 Low 151 55
Table 5.2.5 Capability High Low
Performance
High 356 (A) 184 (B) Low 129 (C) 43 (D)
Operational Definition Conduct MSA
Sampling plan & control limit
setting
Stability check
Calculate capability
Sustenance
Check
Figure 5.2.1 ALP SPC methodology
Handing over to Daily Management thru control chart
― 41 ―

Summary of Ashok Leyland, Pantnagar Presentation
5.3 Cost Management
Plants are cost centers however Product, Raw material and finance cost are managed at AL level. ALP cost management is mainly focuses on manufacturing cost. Initiatives are aligned with the objective of retaining essentials and eliminate MUDA to the extent possible year by year. High production overhead, high administrative overhead & potentially high direct labor cost were the major issues.
5.3.1 Pre TQM issue 1: High Production Overhead During the FY12, the baseline was created. The cost improvement at Pantnagar is as per the Figure 5.3.1. These activities are carried out every year as a part of expenditure planning process and understanding the extent of cost improvement.
After the clear-cut understanding of target for the coming year, actual expenditure of last year, the gap becomes focus area. The total team of supervisors and managers along with associates working in all twelve Gembas are engaged actively to generate an idea bank in a way that even if some ideas become non-feasible for implementation at a later stage, teams do not miss the target. This is a continuous activity throughout the year, which helps having some ideas in hand in advance, for implementation in subsequent year right from the first month itself. To identify the opportunity for cost reduction, the creativity and work innovation at Gemba is fully explored as shown in table 5.3.1 for tool cost MUDA. These ideas are implemented after validation for adverse impact if any on quality, lead time and on-going services. An online system, Gemba MPower E-Portal is created for effective use of IT to capture ideas and improving employee involvement. Gemba MPower process is an eight step process as shown in Figure 5.3.2
Review of projects was done by cost committee to ensure timely implementation of projects. Projects were identified under different initiatives such as Energy Saving, Tool cost reduction, Consumable cost reduction and Machine spares cost reduction.
5.3.1.1 Power Cost Optimization: Energy is a major contributor for Plant Overhead Cost (POH). It contributes 29% of total POH. It is further categorized in to fixed and variable energy. Drive for power cost optimization (Table 5.3.2) was taken and various levers like New Technology, Administrative Controls, and Engineering improvements were used to achieve the target of reduction in energy cost. Earlier, shop wise electricity consumption was not tracked. The tracking system was initiated and implemented. This modified system helped monitoring of shop wise power consumption data, which helped identifying big project area through close monitoring and identification of MUDA on energy consumption. After improving to certain level, domain expertise was taken externally. In FY12, Energy Audit was conducted by external agency; Petroleum Conservation Research Association (PCRA) and total 20 big ticket ideas were identified during the audit, out of which 10 were feasible for implementation. These projects included waste heat recovery and introduction of Variable frequency drives to optimize energy consumption. Apart from this Inter plant energy audits were conducted which helped cross learning. In FY16 alone, 44 Kaizens have been identified and implemented for power cost optimization (Illustrated in table no 5.3.2) 5.3.1.2 Tool Cost Optimization: Tool is second largest contributor for production overhead. After having our own baseline, benchmarking from other AL plants helped visualizing different opportunities with different effort levels. Tool Management through - Optimization, Re-design, Re-use and alternate sourcing: Projects were identified in area of life improvement, work process innovation, new technology, indigenization, operation elimination and negotiations. These levers were used extensively across the plant to eliminate tool cost MUDA.
Table 5.3.2 – Power Cost Optimization Projects Category FY12 FY13 FY14 FY15 FY16 New Technology 2 1 0 0 4
Admin Control 9 22 12 6 17 Engineering Improvements 10 48 44 29 23
Total 21 71 56 35 44
ProjectIdentification ®istration
Team Formation & KPI Selection
BaselineandAspirationSetting
Brainstorming & Idea Generation
Idea Impact & Cost Estimation
IdeaEvaluationion
Idea Completion & Implementaion
Project Completion & Finance sign off
Figure 5.3.2 – Project Approach Flow
Figure 5.3.3 Tool cost reduction methods
Figure 5.3.1 – Cost Improvement Process Approach Flow
Budget Preparation
Budget Approval (Corp finance)
Budget deployment
Budget Allocation to cost center department wise
Corporate Function
Muda identification Area to focus Methodology
Unused Life Explore alternate OperationBreakage CAPDImport Indigenisation Life improvement Usage of new technologyOperation elimination VA-VE
Alternate sourceTechnology exploration and Horizontal deployment
Gap between standard and actual life
Paramter optimisation, Partner's expertise
Table 5.3.1 – MUDA Elimination on Tools
― 42 ―

Summary of Ashok Leyland, Pantnagar Presentation
5.3.1.3 Outsourcing tooling management: After using all our efforts on tool cost improvement, need was felt to get another breakthrough improvement through taking the service from core tool suppliers. A thought process was planned and implemented for converting tool cost expenditure linked to product output. The strategy was formulated and implemented from lesser complex line and horizontally deployed complete machining area in a phased manner as shown in Figure 5.3.4 While taking this forward two things were kept in focus;
Linking tool cost pay out to the output Converting tool cost completely variable.
This helped ALP in two aspects Cost prediction became accurate and easy. Pain on account of cyclic nature of business is significantly reduced.
This activity started from axle arm and beam line and implemented across plant in phased manner keeping quality and delivery intact.
5.3.2 Pre TQM Issue 2. High Administrative overhead: Services under Administrative overheads (AOH) are the basic requirement to maintain plant health. AOH is a fixed cost, it primarily consists of Annual Maintenance contracts & services. Contract rationalization was done based on required skill not available in the plant or low value addition activity such as housekeeping, Horticulture. These services are not directly related to production volumes.
5.3.2.1 Optimize Repair (fixed) Expenditure: Revisit and Optimize Annual Maintenance Contracts In FY14, CFT team was formed to look into details of each Administrative contract with an objective to reduce the administrative overheads. Main focus of the CFT was to;
Reviewing the need for an AMC and terminate it if not required in changed scenario. Convert AMCs/contracts to the extent possible into variable cost. Revisit AMCs/contracts, re-define the scope and reduce the fixed content of cost With the help of above initiatives, variable AMCs increased from 60% (FY12) to 83% (FY16).
5.3.2.2 Revisiting Plant operation days: In the starting of FY13, plant started facing the problem of low vehicle demand due to deep recession commercial vehicle industry. A need has been felt to re-calibrate the number of working days available for production activities. To efficiently utilize the resources and maintain AOH under control, based on the month plan, numbers of working days were decided for each month.
5.3.3 Pre TQM Issue: 3. Risk of increase in direct labor cost 5.3.3.1 Direct Labor Mix: When ALP was conceptualized, it was planned that the plant will employ local manpower which would be trained under “Blessing Scheme”. Risk has been assessed of existing scheme and strategy of “Mix direct labor” has been adopted. HR and Manufacturing team worked on having 4 types of manpower with different tenures of working structure. While on-boarding itself, HR gives a due consideration to keep a balance between the 4 category of manpower and different skill set required for the business. It was decided to create four category of manpower are covering under NTTF students, Layam Associates, Uttarakhand Open University (UOU) students and contract manpower.
5.3.3.2 MUDA Elimination (Rejection Control) Rejection of component is a MUDA which result in high cost and rework. The part which gets scrapped due to operation problem was another pain area for the plant. This not only impacted the BOM cost but affected the POH and AOH as well. Structured efforts were put to reduce rejections on machining as well as assembly lines. Daily management, Poka yoke, On-The-Job training, SOPs, cost awareness, etc. were technics used to achieve this. Various KPIs under DM/PM were taken at the shop level and driven through daily management wherein abnormalities were eliminated through necessary countermeasures. Effect of the good practices has resulted in improvement and is visible in reduction of rejection cost per HECU. (Refer Chart 5.3.1)
Example for rejection control in machining: Head face milling and honing operation were contributing 66% in total rejection of finish block machining line. Target was taken to reduce this rejection from 1860 PPM level to Zero. A policy KPI was taken and this problem was eliminated with involvement of maintenance, systematic change in procedure, development and introduction of new gauges, training of operator, and development of new tooling source for honing sticks. With the help of multiple improvements (QC Stories, KKD and JDI), Assembly Rejections came down significantly from 5064 Rs/Component in FY13 to 954 Rs/ Components in FY16 (Chart 5.3.1)
Feasibility for CPC
Identify Potential Sources
Shortlisting Reliable Sources
Plan pilot implementation
Horizontal deployed for family of operation
Horizontally deployed to all Operation
Figure 5.3.4 – Tool CPC Structured Way
Chart 5.3.1: Rejection Cost
35451908
11045064
27261380 9540
3000
6000
FY13 FY14 FY15 FY16Q3
Rs/
HEC
U
Rejection Cost
Plan Actual
― 43 ―
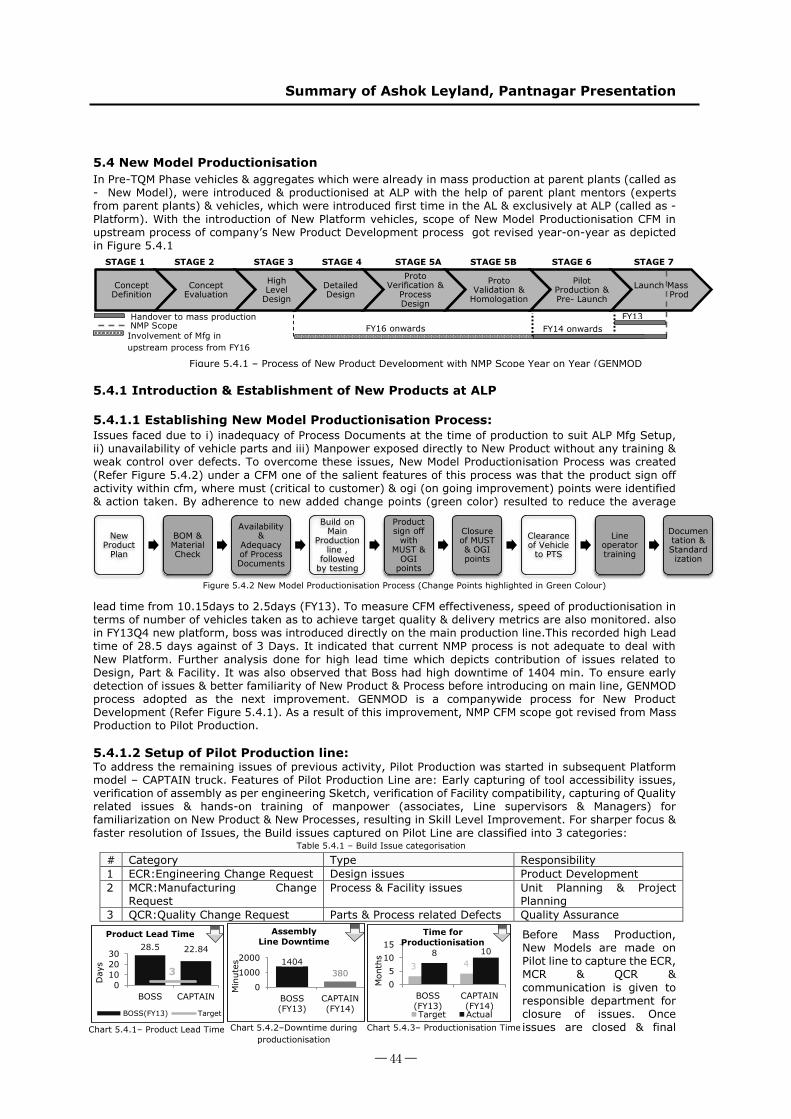
Summary of Ashok Leyland, Pantnagar Presentation
5.4 New Model Productionisation
In Pre-TQM Phase vehicles & aggregates which were already in mass production at parent plants (called as - New Model), were introduced & productionised at ALP with the help of parent plant mentors (experts from parent plants) & vehicles, which were introduced first time in the AL & exclusively at ALP (called as - Platform). With the introduction of New Platform vehicles, scope of New Model Productionisation CFM in upstream process of company’s New Product Development process got revised year-on-year as depicted in Figure 5.4.1
5.4.1 Introduction & Establishment of New Products at ALP 5.4.1.1 Establishing New Model Productionisation Process:
Issues faced due to i) inadequacy of Process Documents at the time of production to suit ALP Mfg Setup, ii) unavailability of vehicle parts and iii) Manpower exposed directly to New Product without any training & weak control over defects. To overcome these issues, New Model Productionisation Process was created (Refer Figure 5.4.2) under a CFM one of the salient features of this process was that the product sign off activity within cfm, where must (critical to customer) & ogi (on going improvement) points were identified & action taken. By adherence to new added change points (green color) resulted to reduce the average
lead time from 10.15days to 2.5days (FY13). To measure CFM effectiveness, speed of productionisation in terms of number of vehicles taken as to achieve target quality & delivery metrics are also monitored. also in FY13Q4 new platform, boss was introduced directly on the main production line.This recorded high Lead time of 28.5 days against of 3 Days. It indicated that current NMP process is not adequate to deal with New Platform. Further analysis done for high lead time which depicts contribution of issues related to Design, Part & Facility. It was also observed that Boss had high downtime of 1404 min. To ensure early detection of issues & better familiarity of New Product & Process before introducing on main line, GENMOD process adopted as the next improvement. GENMOD is a companywide process for New Product Development (Refer Figure 5.4.1). As a result of this improvement, NMP CFM scope got revised from Mass Production to Pilot Production. 5.4.1.2 Setup of Pilot Production line: To address the remaining issues of previous activity, Pilot Production was started in subsequent Platform model – CAPTAIN truck. Features of Pilot Production Line are: Early capturing of tool accessibility issues, verification of assembly as per engineering Sketch, verification of Facility compatibility, capturing of Quality related issues & hands-on training of manpower (associates, Line supervisors & Managers) for familiarization on New Product & New Processes, resulting in Skill Level Improvement. For sharper focus & faster resolution of Issues, the Build issues captured on Pilot Line are classified into 3 categories:
# Category Type Responsibility 1 ECR:Engineering Change Request Design issues Product Development 2 MCR:Manufacturing Change
Request Process & Facility issues Unit Planning & Project
Planning 3 QCR:Quality Change Request Parts & Process related Defects Quality Assurance
Before Mass Production, New Models are made on Pilot line to capture the ECR, MCR & QCR & communication is given to responsible department for closure of issues. Once issues are closed & final
FY13
Figure 5.4.1 – Process of New Product Development with NMP Scope Year on Year (GENMOD Process)
NMP Scope
STAGE 1 STAGE 2 STAGE 3 STAGE 4 STAGE 5A STAGE 5B STAGE 6 STAGE 7
New Product
Plan
BOM & Material Check
Availability &
Adequacy of Process Documents
Build on Main
Production line ,
followed by testing
Product sign off
with MUST &
OGI points
Closure of MUST & OGI points
Clearance of Vehicle
to PTS
Line operator training
Documentation & Standardization
Handover to mass production
Figure 5.4.2 New Model Productionisation Process (Change Points highlighted in Green Colour)
Chart 8.13 – Downtime/Boss
Concept Definition
Concept Evaluation
High Level
DesignDetailed Design
Proto Verification &
Process Design
Proto Validation &
Homologation
Pilot Production & Pre- Launch
Launch Mass Prod
FY14 onwards Involvement of Mfg in upstream process from FY16
FY16 onwards
1404380
0
1000
2000
BOSS(FY13)
CAPTAIN(FY14)
Min
utes
Assembly Line Downtime
Chart 5.4.2–Downtime during productionisation
3 48 10
05
1015
BOSS(FY13)
CAPTAIN(FY14)
Mon
ths
Time for Productionisation
Target ActualChart 5.4.3– Productionisation Time
28.5 22.84
30
102030
BOSS CAPTAIN
Day
s
Product Lead Time
BOSS(FY13) Target
Chart 5.4.1– Product Lead Time
Table 5.4.1 – Build Issue categorisation
― 44 ―
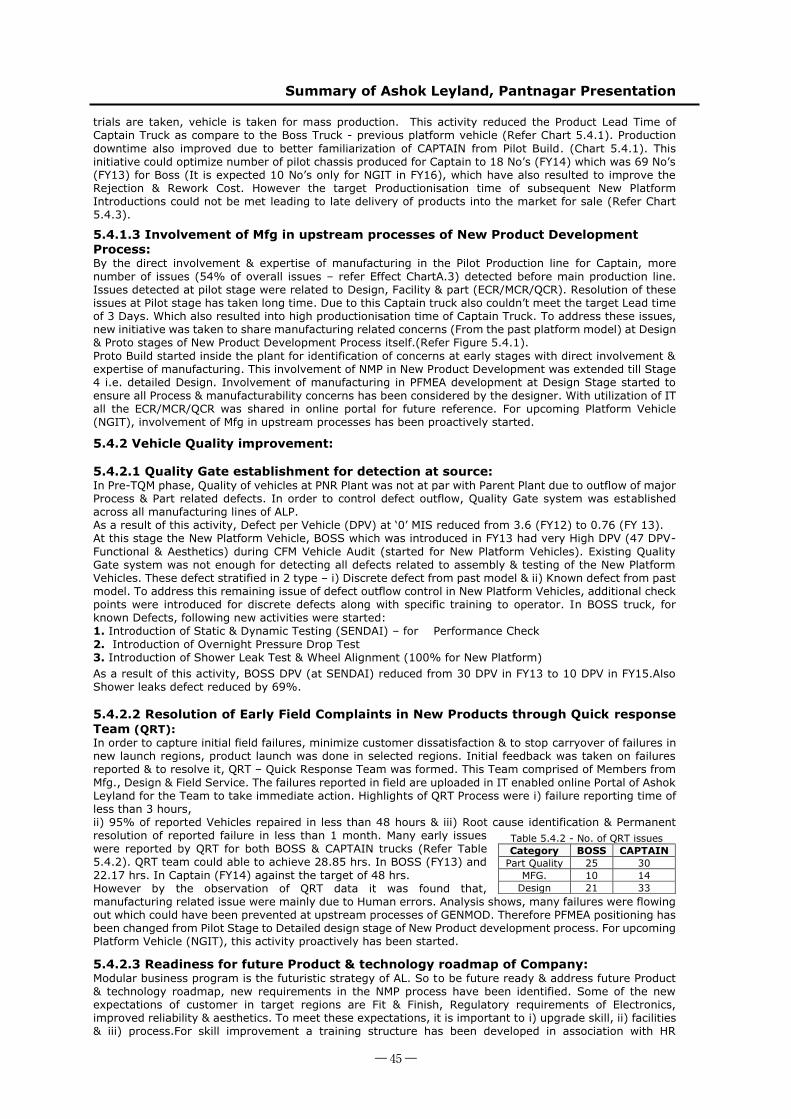
Summary of Ashok Leyland, Pantnagar Presentation
trials are taken, vehicle is taken for mass production. This activity reduced the Product Lead Time of Captain Truck as compare to the Boss Truck - previous platform vehicle (Refer Chart 5.4.1). Production downtime also improved due to better familiarization of CAPTAIN from Pilot Build. (Chart 5.4.1). This initiative could optimize number of pilot chassis produced for Captain to 18 No’s (FY14) which was 69 No’s (FY13) for Boss (It is expected 10 No’s only for NGIT in FY16), which have also resulted to improve the Rejection & Rework Cost. However the target Productionisation time of subsequent New Platform Introductions could not be met leading to late delivery of products into the market for sale (Refer Chart 5.4.3).
5.4.1.3 Involvement of Mfg in upstream processes of New Product Development Process: By the direct involvement & expertise of manufacturing in the Pilot Production line for Captain, more number of issues (54% of overall issues – refer Effect ChartA.3) detected before main production line. Issues detected at pilot stage were related to Design, Facility & part (ECR/MCR/QCR). Resolution of these issues at Pilot stage has taken long time. Due to this Captain truck also couldn’t meet the target Lead time of 3 Days. Which also resulted into high productionisation time of Captain Truck. To address these issues, new initiative was taken to share manufacturing related concerns (From the past platform model) at Design & Proto stages of New Product Development Process itself.(Refer Figure 5.4.1). Proto Build started inside the plant for identification of concerns at early stages with direct involvement & expertise of manufacturing. This involvement of NMP in New Product Development was extended till Stage 4 i.e. detailed Design. Involvement of manufacturing in PFMEA development at Design Stage started to ensure all Process & manufacturability concerns has been considered by the designer. With utilization of IT all the ECR/MCR/QCR was shared in online portal for future reference. For upcoming Platform Vehicle (NGIT), involvement of Mfg in upstream processes has been proactively started.
5.4.2 Vehicle Quality improvement: 5.4.2.1 Quality Gate establishment for detection at source: In Pre-TQM phase, Quality of vehicles at PNR Plant was not at par with Parent Plant due to outflow of major Process & Part related defects. In order to control defect outflow, Quality Gate system was established across all manufacturing lines of ALP. As a result of this activity, Defect per Vehicle (DPV) at ‘0’ MIS reduced from 3.6 (FY12) to 0.76 (FY 13). At this stage the New Platform Vehicle, BOSS which was introduced in FY13 had very High DPV (47 DPV-Functional & Aesthetics) during CFM Vehicle Audit (started for New Platform Vehicles). Existing Quality Gate system was not enough for detecting all defects related to assembly & testing of the New Platform Vehicles. These defect stratified in 2 type – i) Discrete defect from past model & ii) Known defect from past model. To address this remaining issue of defect outflow control in New Platform Vehicles, additional check points were introduced for discrete defects along with specific training to operator. In BOSS truck, for known Defects, following new activities were started:
1. Introduction of Static & Dynamic Testing (SENDAI) – for Performance Check 2. Introduction of Overnight Pressure Drop Test 3. Introduction of Shower Leak Test & Wheel Alignment (100% for New Platform)
As a result of this activity, BOSS DPV (at SENDAI) reduced from 30 DPV in FY13 to 10 DPV in FY15.Also Shower leaks defect reduced by 69%. 5.4.2.2 Resolution of Early Field Complaints in New Products through Quick response Team (QRT): In order to capture initial field failures, minimize customer dissatisfaction & to stop carryover of failures in new launch regions, product launch was done in selected regions. Initial feedback was taken on failures reported & to resolve it, QRT – Quick Response Team was formed. This Team comprised of Members from Mfg., Design & Field Service. The failures reported in field are uploaded in IT enabled online Portal of Ashok Leyland for the Team to take immediate action. Highlights of QRT Process were i) failure reporting time of less than 3 hours, ii) 95% of reported Vehicles repaired in less than 48 hours & iii) Root cause identification & Permanent resolution of reported failure in less than 1 month. Many early issues were reported by QRT for both BOSS & CAPTAIN trucks (Refer Table 5.4.2). QRT team could able to achieve 28.85 hrs. In BOSS (FY13) and 22.17 hrs. In Captain (FY14) against the target of 48 hrs. However by the observation of QRT data it was found that, manufacturing related issue were mainly due to Human errors. Analysis shows, many failures were flowing out which could have been prevented at upstream processes of GENMOD. Therefore PFMEA positioning has been changed from Pilot Stage to Detailed design stage of New Product development process. For upcoming Platform Vehicle (NGIT), this activity proactively has been started.
5.4.2.3 Readiness for future Product & technology roadmap of Company: Modular business program is the futuristic strategy of AL. So to be future ready & address future Product & technology roadmap, new requirements in the NMP process have been identified. Some of the new expectations of customer in target regions are Fit & Finish, Regulatory requirements of Electronics, improved reliability & aesthetics. To meet these expectations, it is important to i) upgrade skill, ii) facilities & iii) process.For skill improvement a training structure has been developed in association with HR
Table 5.4.2 - No. of QRT issues Category BOSS CAPTAIN
Part Quality 25 30 MFG. 10 14
Design 21 33
― 45 ―

Summary of Ashok Leyland, Pantnagar Presentation
department to identify the change points in upcoming products & technology for arranging necessary training of associates & managers to improve their skill. Facilities improvement also taken place like 3 coordinate measurement machince installed to improve the process as well as improve the produt quality. And by utilization of such facilities we could able to par the benchmark quality standards.(eg. Body accuracy, gloss level etc) 5.5 Delivery Management: Delivery performance was measured on volume basis during initial stages of the plant with 50 % parts from northern region. Key challenge was to establish planning process to streamline parts availability.
5.5.1 Improving Material Availability: During FY12, Material shortage was the biggest contributor for low monthly delivery performance. ALP started aligning parts with production planning through various initiatives. 1. Localization 2. Establishment and Strengthening of Warehousing 3. Enhance in house capacities 4. Capacity Enhancement at Supplier end 5. Initiation of Supply & Apply and Plant in Plant Initiatives 5.5.1.1 Localization: Systematic Process of Localization has been established
5.5.1.2 Enhancing the In house Capacities In FY12 considering the expected future volume, bottleneck analysis done for each aggregate level. Project taken to improve the capacity for Engine Assembly, which was the first bottleneck, as block rough machining capacity was 28K against 36K only. Further to this, although the expected volumes of FY15 was within the capacity of 36,000 but it was noticed that the requirement of multi axle vehicles may become nearly double. This necessitated the recheck of our in-house manufacturing capacities with respect to Front Axle as for all other aggregates capacities and improvement project done on the same.
5.5.1.3 Capacity Enhancement at Supplier end: Looking at higher expected volumes in 2nd half of FY16 supplier capacity was reviewed for all 154 part families covering 100% parts, so as to ensure material availability to meet these peak volumes of 6000 in March’16. Out of these 154 families, 87 part families containing critical parts were further categorized in RYG. Actions initiated and converted 18 red into green. Further actions are in progress to convert 21 yellow also into green. In February’16 we achieved record volume of 5680 vehicles.
5.5.1.4 Initiation of ‘Supply & Apply' (S&A) and ‘Plant in Plant’ Initiatives: S&A initiative started to utilize the supplier’s expertise is being used for assembling the parts. In this process supplier arranges for the fitment of parts or sub assembly on conveyor during vehicle assembling process. Towards this supplier is deputing their trained persons and arranging the necessary fixtures or special tools required for assembly and also pulling the material as per the assembly sequence from their unit or warehouse. We also have started Plant in plant initiative at ALP. Axles being a major component and was procured from long distance, we have localized the same with DANA India inside ALP. With the above activities the overall part receipt trend from Northern Region is improving year on year up to 94% and vehicle loss due to material shortage is reduced from 9.6% to 1.62%.
5.5.2 Improving material Traceability and Handling: In FY12 12.2% loss was observed due to material poor traceability, even though the parts were available inside the plant but either were not traceable or were in damaged condition. Hence the need aroused for “2S“implementation in stores along with the improvement in line side material supplies (LSMS). Towards this: 5.5.2.1 Place for every part earmarked to store the part in that place. For easy identification and retrieval bin nos. with the part nos. fed in SAP and displayed in stores. This improvement started in FY13 with 30% parts storage location mapped in SAP. Now with continuous effort in optimizing inventory,
Identify potential suppliers & Supplier
Evaluation & ApprovalCost Negotiation &
Purchase Order ReleaseComponent
Development , Testing & Clearance
Quality Approvals & Parts Inwarding
Table 5.4.3 - Localization strengthening year Over Year Year FY12 FY13 FY14 FY15 FY16
Improvements Development with supplier available in and around PNR Establishment of south Based Suppliers at PNR
Scope expanded within 300KMs
Implementation of Warehouse
New local suppliers development for new platform -BOSS & CAPTAIN
Capacity Enhancement New Variants Localization Enhanced
Total Parts receipt 2998 2610 3166 3796 4755 Parts receipt from Northern region (%) 1499 (50%) 1644(63
%) 2461(78
%) 3168(83%) 4493(94%)
No. of suppliers with warehouse - - 80 246 290
In SAP
Figure 5.4.3: Localization process
― 46 ―
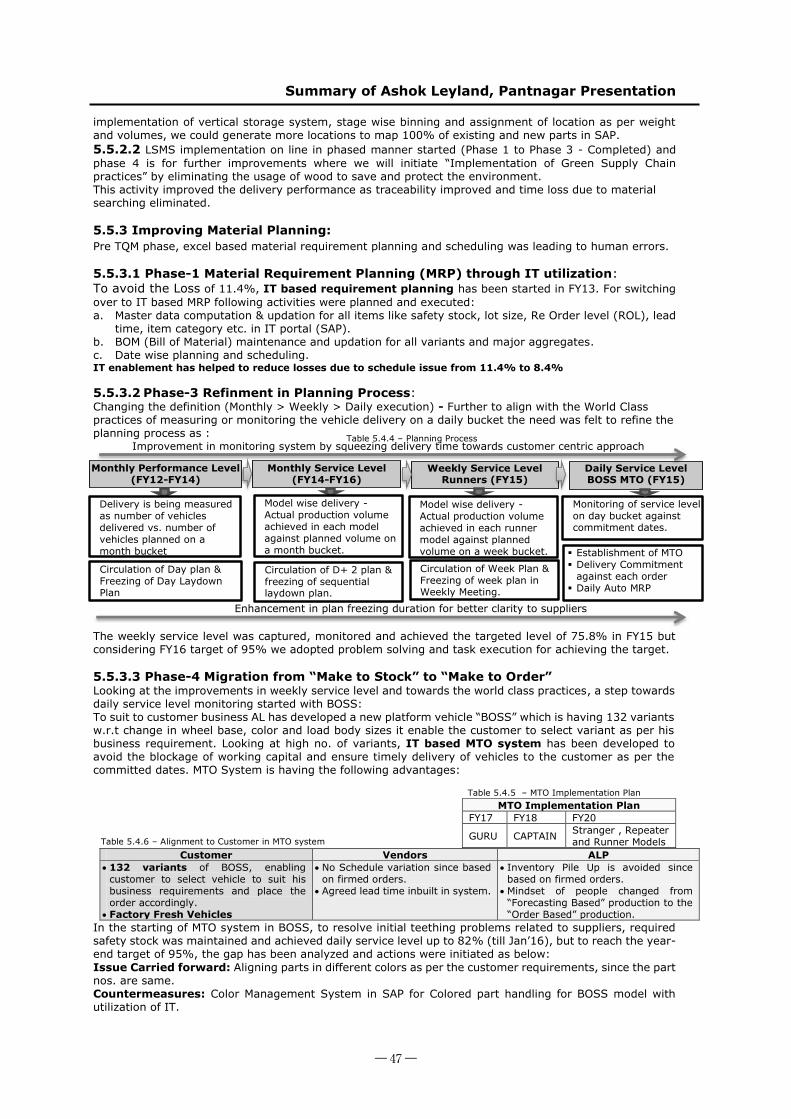
Summary of Ashok Leyland, Pantnagar Presentation
implementation of vertical storage system, stage wise binning and assignment of location as per weight and volumes, we could generate more locations to map 100% of existing and new parts in SAP. 5.5.2.2 LSMS implementation on line in phased manner started (Phase 1 to Phase 3 - Completed) and phase 4 is for further improvements where we will initiate “Implementation of Green Supply Chain practices” by eliminating the usage of wood to save and protect the environment. This activity improved the delivery performance as traceability improved and time loss due to material searching eliminated. 5.5.3 Improving Material Planning: Pre TQM phase, excel based material requirement planning and scheduling was leading to human errors. 5.5.3.1 Phase-1 Material Requirement Planning (MRP) through IT utilization: To avoid the Loss of 11.4%, IT based requirement planning has been started in FY13. For switching over to IT based MRP following activities were planned and executed: a. Master data computation & updation for all items like safety stock, lot size, Re Order level (ROL), lead
time, item category etc. in IT portal (SAP). b. BOM (Bill of Material) maintenance and updation for all variants and major aggregates. c. Date wise planning and scheduling. IT enablement has helped to reduce losses due to schedule issue from 11.4% to 8.4% 5.5.3.2 Phase-3 Refinment in Planning Process: Changing the definition (Monthly > Weekly > Daily execution) - Further to align with the World Class practices of measuring or monitoring the vehicle delivery on a daily bucket the need was felt to refine the planning process as :
The weekly service level was captured, monitored and achieved the targeted level of 75.8% in FY15 but considering FY16 target of 95% we adopted problem solving and task execution for achieving the target. 5.5.3.3 Phase-4 Migration from “Make to Stock” to “Make to Order” Looking at the improvements in weekly service level and towards the world class practices, a step towards daily service level monitoring started with BOSS: To suit to customer business AL has developed a new platform vehicle “BOSS” which is having 132 variants w.r.t change in wheel base, color and load body sizes it enable the customer to select variant as per his business requirement. Looking at high no. of variants, IT based MTO system has been developed to avoid the blockage of working capital and ensure timely delivery of vehicles to the customer as per the committed dates. MTO System is having the following advantages:
Customer Vendors ALP 132 variants of BOSS, enabling
customer to select vehicle to suit his business requirements and place the order accordingly.
Factory Fresh Vehicles
No Schedule variation since based on firmed orders.
Agreed lead time inbuilt in system.
Inventory Pile Up is avoided since based on firmed orders.
Mindset of people changed from “Forecasting Based” production to the “Order Based” production.
In the starting of MTO system in BOSS, to resolve initial teething problems related to suppliers, required safety stock was maintained and achieved daily service level up to 82% (till Jan’16), but to reach the year-end target of 95%, the gap has been analyzed and actions were initiated as below: Issue Carried forward: Aligning parts in different colors as per the customer requirements, since the part nos. are same.
Countermeasures: Color Management System in SAP for Colored part handling for BOSS model with utilization of IT.
MTO Implementation Plan FY17 FY18 FY20
GURU CAPTAIN Stranger , Repeater and Runner Models
Circulation of Day plan & Freezing of Day Laydown Plan
Circulation of Week Plan & Freezing of week plan in Weekly Meeting.
Weekly Service Level Runners (FY15)
Daily Service Level BOSS MTO (FY15)
Monitoring of service level on day bucket against commitment dates.
Circulation of D+ 2 plan & freezing of sequential laydown plan.
Monthly Performance Level (FY12-FY14)
Monthly Service Level (FY14-FY16)
Improvement in monitoring system by squeezing delivery time towards customer centric approach
Enhancement in plan freezing duration for better clarity to suppliers
Delivery is being measured as number of vehicles delivered vs. number of vehicles planned on a month bucket
Model wise delivery - Actual production volume achieved in each model against planned volume on a month bucket. buceket.
Model wise delivery - Actual production volume achieved in each runner model against planned volume on a week bucket.
Establishment of MTO Delivery Commitment
against each order Daily Auto MRP
Table 5.4.4 – Planning Process
Table 5.4.5 – MTO Implementation Plan
Table 5.4.6 – Alignment to Customer in MTO system
― 47 ―
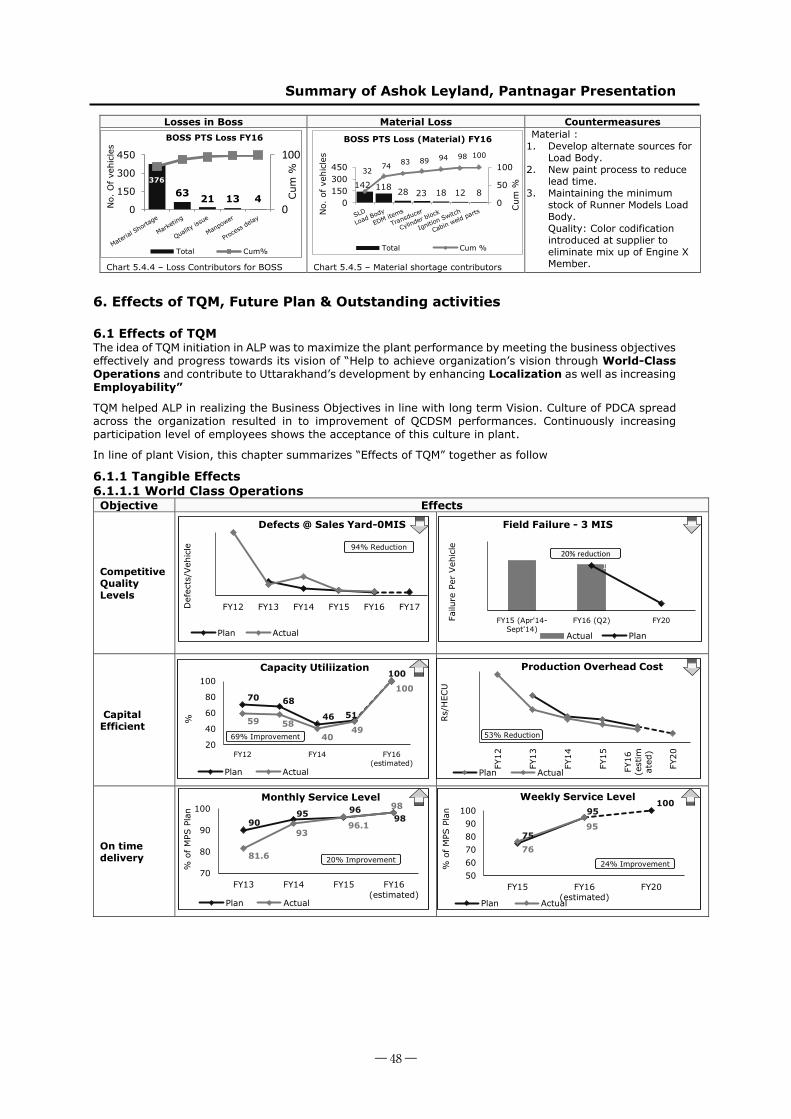
Summary of Ashok Leyland, Pantnagar Presentation
6. Effects of TQM, Future Plan & Outstanding activities 6.1 Effects of TQM The idea of TQM initiation in ALP was to maximize the plant performance by meeting the business objectives effectively and progress towards its vision of “Help to achieve organization’s vision through World-Class Operations and contribute to Uttarakhand’s development by enhancing Localization as well as increasing Employability”
TQM helped ALP in realizing the Business Objectives in line with long term Vision. Culture of PDCA spread across the organization resulted in to improvement of QCDSM performances. Continuously increasing participation level of employees shows the acceptance of this culture in plant.
In line of plant Vision, this chapter summarizes “Effects of TQM” together as follow
6.1.1 Tangible Effects 6.1.1.1 World Class Operations Objective Effects
Competitive Quality Levels
Capital Efficient
On time delivery
Losses in Boss Material Loss Countermeasures
Chart 5.4.4 – Loss Contributors for BOSS Chart 5.4.5 – Material shortage contributors
Material : 1. Develop alternate sources for
Load Body. 2. New paint process to reduce
lead time. 3. Maintaining the minimum
stock of Runner Models Load Body. Quality: Color codification introduced at supplier to eliminate mix up of Engine X Member.
142 118 28 23 18 12 8
3274 83 89 94 98 100
0
50
100
0150300450
Cum
%
No.
of
vehi
cles
BOSS PTS Loss (Material) FY16
Total Cum %
376
63 21 13 40
100
0
150
300
450
Cum
%
No.
Of
vehi
cles
BOSS PTS Loss FY16
Total Cum%
0
0.9
1.8
2.7
3.6
FY12 FY13 FY14 FY15 FY16 FY17Def
ects
/Veh
icle
Defects @ Sales Yard-0MIS
Plan Actual
94% Reduction 1.44 1.321.3
0.20
0.5
1
1.5
2
FY15 (Apr'14-Sept'14)
FY16 (Q2) FY20Failu
re P
er V
ehic
le
Field Failure - 3 MIS
Actual Plan
20% reduction
23271
17353 1650014567
12700
29163
19281 16639 152391374010000
15000
20000
25000
30000
FY12
FY13
FY14
FY15
FY16
(est
imat
ed)
FY20
Rs/
HEC
U
Production Overhead Cost
Plan Actual
53% Reduction
70 68
46 51
100
59 5840
49
100
20
40
60
80
100
FY12 FY14 FY16(estimated)
%
Capacity Utiliization
Plan Actual
69% Improvement
75
95100
76
95
5060708090
100
FY15 FY16(estimated)
FY20
% o
f M
PS P
lan
Weekly Service Level
Plan Actual
24% Improvement
9095 96
98
81.6
9396.1
98
70
80
90
100
FY13 FY14 FY15 FY16(estimated)
% o
f M
PS P
lan
Monthly Service Level
Plan Actual
20% Improvement
― 48 ―
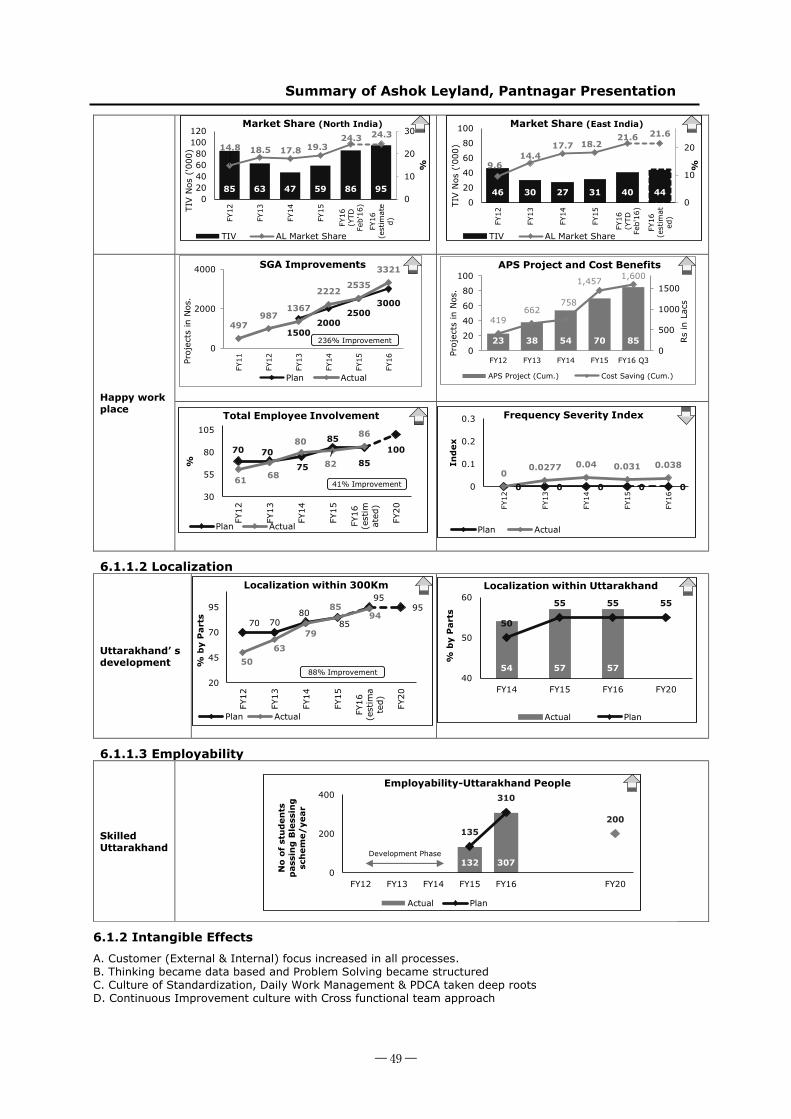
Summary of Ashok Leyland, Pantnagar Presentation
Happy work place
6.1.1.2 Localization
Uttarakhand’ s development
6.1.1.3 Employability
Skilled Uttarakhand
6.1.2 Intangible Effects
A. Customer (External & Internal) focus increased in all processes. B. Thinking became data based and Problem Solving became structured C. Culture of Standardization, Daily Work Management & PDCA taken deep roots D. Continuous Improvement culture with Cross functional team approach
54 57 57
50
55 55 55
40
50
60
FY14 FY15 FY16 FY20
% b
y P
arts
Localization within Uttarakhand
Actual Plan
132 307
135
310
200
0
200
400
FY12 FY13 FY14 FY15 FY16 FY20
No
of s
tud
ents
p
assi
ng
Ble
ssin
g
sch
eme/
year
Employability-Uttarakhand People
Actual Plan
Development Phase
0 0 0 0 00
0.0277 0.04 0.031 0.038
0
0.1
0.2
0.3
FY12
FY13
FY14
FY15
FY16
Ind
ex
Frequency Severity Index
Plan Actual
70 70
75
85
85100
61 68
80
82
86
30
55
80
105
FY12
FY13
FY14
FY15
FY16
(est
imat
ed)
FY20
%
Total Employee Involvement
Plan Actual
41% Improvement
70 7080
85
9595
5063
79
8594
20
45
70
95
FY12
FY13
FY14
FY15
FY16
(est
ima
ted) FY20
% b
y P
arts
Localization within 300Km
Plan Actual
88% Improvement
15002000
25003000
497987
1367
22222535
3321
0
2000
4000
FY11
FY12
FY13
FY14
FY15
FY16Pr
ojec
ts in
Nos
.
SGA Improvements
Plan Actual
236% Improvement 23 38 54 70 85
419662
758
1,457 1,600
0
500
1000
1500
0
20
40
60
80
100
FY12 FY13 FY14 FY15 FY16 Q3
Rs
in L
acs
Proj
ects
in N
os.
APS Project and Cost Benefits
APS Project (Cum.) Cost Saving (Cum.)
85 63 47 59 86 95
14.8 18.5 17.8 19.324.3 24.3
0
10
20
30
020406080
100120
FY12
FY13
FY14
FY15
FY16
(YTD
Feb'
16)
FY16
(est
imat
ed)
%
TIV N
os (
'000
)
Market Share (North India)
TIV AL Market Share
46 30 27 31 40 44
9.614.4
17.7 18.221.6 21.6
0
10
20
0
20
40
60
80
100
FY12
FY13
FY14
FY15
FY16
(YTD
Feb'
16)
FY16
(est
imat
ed)
%
TIV N
os (
'000
)
Market Share (East India)
TIV AL Market Share
― 49 ―

Summary of Ashok Leyland, Pantnagar Presentation
6.2 Future Plan TQM put ALP on the right path towards its Vision which is …. “Help to achieve organization’s vision through World-Class Operations and contribute to Uttarakhand’ s development by enhancing Localization as well as increasing Employability”.
Till FY16, ALP has come across a long journey in Employability and Localization whereas in World Class Operations, a long way to go due to opportunities in new markets (5 clusters of CIS, LatAm, ASEAN, MENA, and Sub Saharan Africa).
ALP need to have the World class operations to supply the world class products. For ALP, World Class Operation is: “Improving Customer Experience through Competitive Quality Levels and On Time Delivery while
operating with Capital Efficient Practices at “Happy Work Place” Based on the learning from TQM journey, Future plan has been evolved to realize long term objectives
6.2.1 Plan to realize Vision and Business Objectives Table 6.2.1 : ALP Future Plan
Key Word Objective Plan
World Class Operations
Competitive Quality Levels
Reduce early failure through manufacturing Quality improvement
Strengthen system of VOC capturing and resolution Strengthen proactive approach through QA network and
FMEAs Hand holding of suppliers for Total Quality management
On Time Delivery Capacity enhancement projects to meet the global demand MaxIT for utilizing IT to place the orders. Change in approach
from “Make to Stock” to “Make to Order”. Improve Schedule adherence in all models to support
marketing to improve market share in Northern & Eastern market
Cost Competitiveness
Flexible Cost management different business scenario (Sluggish market Vs. Booming market)
Leverage technology for cost reduction Happy Workplace Further enhance the employee skill especially non-permanent
associates Establish system to gauge and improve employee satisfaction
Localization Uttarakhand Development
Supplier upgradation programs for local suppliers
Employability Skilled Uttarakhand
Enhance business orientation in Blessing Scheme for better fit of students in Non-Manufacturing functions
6.2.2 Future Plans for further strengthening TQM ALP seeks to sustain the TQM journey in the future through: 1) Continuation of implementation of Deming Prize Guidelines: After challenging the Deming Prize,
ALP plans to sustain the drive through regular assessment on the lines of Deming Prize Guidelines and would like to challenge Deming Grand Prize in future.
2) Enhance the rigor of KAIZEN among all categories of Employee: after achieving the total employee involvement from Managers and Associates through various Kaizen initiatives, ALP plans to enhance the sphere of improvements across all employee covering Non-permanent associates also.
3) Fostering Creativity and Innovation : Plans are being drafted in the AL Group to roll out initiatives for bringing creativity and innovation. ALP is committed to provide enabling atmosphere where employee strive from within for creativity and innovation.
4) Strengthening Annual Planning Process : Further strengthening of bottom-up process to develop better affinity of issues and identify improvement projects during annual planning cycle.
5) Visual Factory : Improve “how to do” area in all standards with visuals and display in reach of associates. Establish “Andons” for fast feedback
6) Benchmarking : Benchmarking of Systems, Processes and Results with “Best in class”
7) TQM in AL’s plants and Key suppliers : Sharing TQM experience with other plants / key suppliers and help them to improve their processes and performance.
8) Spread TQM : Guide and facilitate other interested companies who want to implement TQM in India
― 50 ―

Summary of Ashok Leyland, Pantnagar Presentation
6.3 Outstanding activities 6.3.1 Blessing Scheme Objective: Most of the area of Uttarakhand state is hilly and economic activities are low, which results into the less opportunities for employment in the state. ALP comes with the vision of generating more employment opportunities and making the skilled manpower (selected from humble background) hence employable to contribute to the development of the state as well as to cater the business need of skilled manpower. This scheme addresses the issue of growing appetite for technical requirements within the automobile industry on one hand and fulfilling Corporate Social Responsibility on the other hand.
Linkage with Plant Vision and Execution: Looking into Plant vision to enhance the Employability of youth in UTK state, Blessing Scheme was introduced with the collaboration of Government and training partner NTTF (A premier Technical Institute of India) in FY11.
Process In this programme, trainee is offered for four year Diploma in Manufacturing Technology by NTTF. During this training he/she is exposed to various technical inputs i.e. on Computer Numerical control machines (CNC), Auto CAD, Metrology, Pneumatics and Hydraulics, Computers, Robotics, Electronics, Mechatronics, Welding, Painting etc. During the final phase of the programme, the trainees are given exposure to the Product & service related concepts & best practices of Auto Industry including TQM initiatives as a part of their curriculum. The major highlight of this programme is that students acquire industry relevant skills through OJT (On the Job training) at ALP shop floor.
To provide such training a state of the Art Technical Learning Centre with modern Laboratory Facilities were started in 2012. This Centre provides a platform to the youth of UTK to Learn & Earn. This scheme provides theoretical as well as practical training to the trainees.
Why Outstanding Activity: The theme of Blessing scheme is to target the underprivileged section of society, living in remote places and have no opportunity of employment and that’s make it unique in nature. This scheme provides professional competence coupled with remuneration through the tenure of this course. Unique feature of this scheme is to absorb 100% pass out trainees in the company, vis a vis placement of Diploma engineers in industries by any engineering college is 60% in UTK State. It helped them to support their families back at native place making them feel proud in living up to expectations of the society.
Benefits: Out Of 365 trainees inducted in the scheme in eight batches, 310 Trainees successfully completed “Diploma in Manufacturing Technology “in FY16. Total 308 trainees were absorbed in AL and deployed all over India across all the verticals i.e. Operations, PD, Marketing, Quality, Service & After Market. 6.3.2 Make To Order (MTO) Objective: To suit to customer business, AL has developed a new platform vehicle “BOSS” which is having 132 variants w.r.t change in wheel base, color and load body sizes. These variants enables customers to select product as per his business requirement. Looking at high number of variants, IT based MTO system has been developed to avoid the blockage of working capital. This is also a first step towards the best world class practices.
Linkage with Plant Vision and Execution: In line with the ALP Vision to have World Class Operations, “On time delivery” has been taken as long term objective. ALP has improved on its Key performance indices of delivery performance from Monthly to weekly and weekly to daily. Looking in to Daily service level, “Make to Order” has been started as an initiative of world class supply chain for BOSS models in year FY14.
Process Process flow chart is shown for MTO in below figure 6.3.2
To accomplish this, extensive use of IT was done for end to end process (i.e. from Order to delivery) with various dashboards and related MIS operating at plant in SAP. While the above system was working well, we still had a challenge for aligning parts in different colors as per the customer requirements, since the part no’s were same.
Order by
Dealer
Approval by AL
Marketing
Delivary commitment
by Plant
Material Scheduling
in MRPMaterial
Procurement Manufacturing Vehicle Inspection
Delivery to Customer
Figure 6.3.1 – NTTF Training Center
Figure 6.3.2 – Make to Order Process
Figure 6.3.3 – MIS through SAP
― 51 ―

Summary of Ashok Leyland, Pantnagar Presentation
To overcome this challenge we have developed a Color Management System in SAP for Colored part handling for BOSS model with utilization of IT. This system will get horizontally deployed in all future products requiring Color Management.
Why Outstanding Activity: The aim for introduction of the MTO based system for production is to deliver the Factory Fresh Vehicles to the customer as against the vehicles from stocks which were in the sales yard and not so fresh. This activity stands out because it makes the whole system customer centric in turn pushing all the stakeholders to act fast , remove MUDA from all the related processes and make it more efficient.
Benefits The major benefits of this system is in changing the mindset of people from “Forecasting Based” production to the “Order Based” production and be more committed to dates given to the customers and thereby enhancing the Customer Satisfaction. Benefits of MTO to customer, suppliers & ALP shown in table 6.3.1
Table 6.3.1 : Benefits of MTO to Customer, Suppliers and ALP Customer Suppliers ALP 132 variants of BOSS w.r.t wheel bases, load body and color, so customer can select vehicle to suit his business requirements and place the order accordingly.
Factory Fresh Vehicles
Schedules are being flown based on the orders and hence unlikely change in requirement is avoided, resulting in no inventory pile up at supplier end.
Agreed lead time inbuilt in system.
In-warding of materials based on the committed orders and thus helps in reducing the working capital.
Inventory Pile Up is avoided Mindset of people changed from “Forecasting Based” to the “Order Based” production.
6.3.3 Mission Gemba Objective: To deploy all TQM initiatives with 100% involvement of all employee, ALP has started “Mission Gemba” in FY11. The objective of Mission Gemba was to drive frontline attitudinal change and improve work culture to achieve significant business performance improvement.
Linkage with Plant Vision and Execution: For ALP Vision of having World Class Operations, world class work culture was the top most requirement which can only come through the empowered employees who contribute for improvements. Employees are educated to have knowledge to change the way they work to make it more efficient by identifying the problems, identify root cause, take counter measures and standardize to prevent its recurrence.
Process Mission Gemba is based on ISER (Information, Skill, Empowerment, and Reward & Recognition) concept. Various TQM initiatives such as 5S, SGA, Kaizen (KKD/JDI), Safety and Cost reduction projects have been promoted through Gemba initiative.
Total 12 Gemba centers have been made at shop floor supported by Gemba organization (Shown in Figure 6.3.4). All Gemba centers are supported by Core team verticals and Core team members. Each Gemba is run by 01 GUL (Gemba Unit leader) and 8 GIL (Gemba Initiative leaders). They are involved in TQM promotion and activity execution at Gemba with the involvement of 100% associates. At Gemba center (shown in figure 6.3.5), team is meeting on daily basis to review all departmental routine KPI and counter measures are taken.
Comprehensive reward & recognition schemes has been put in place to recognize associates for improvements
Why Outstanding Activity: Mission Gemba has triggered an attitudinal transformation of the workforce leading to operational excellence. It has opened channels for two way communications, confidence building, improve sense of belonging, transparency and empowerment at all levels overall manufacturing process excellence and improve the competitive edge.
Benefits: Total Employee Involvement in TQM Initiatives (86% People involved in Improvements) SGA projects completion level raised from nil to more than 3000 projects / annum Enhanced belongingness with company Improved motivation level
Figure 6.3.4 – Mission Gemba Organization Structure
Figure 6.3.5 – Gemba Communication Centre
― 52 ―
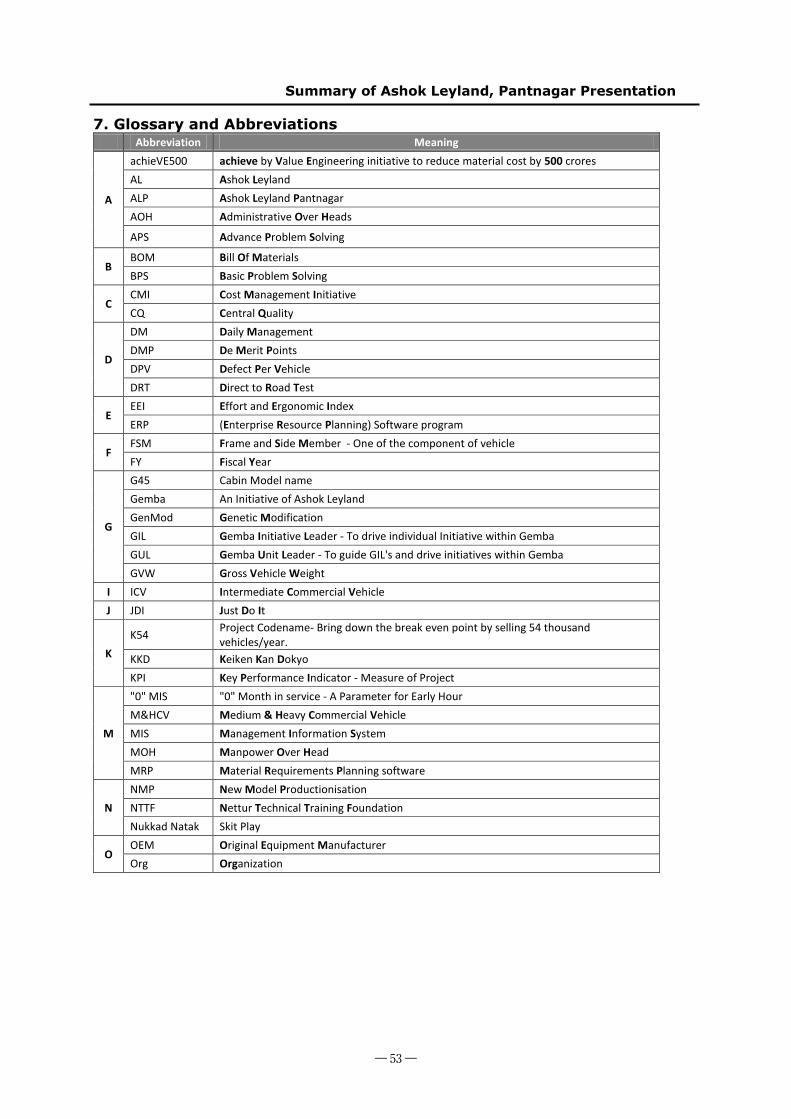
Summary of Ashok Leyland, Pantnagar Presentation
7. Glossary and Abbreviations
Abbreviation Meaning
A
achieVE500 achieve by Value Engineering initiative to reduce material cost by 500 crores AL Ashok Leyland ALP Ashok Leyland Pantnagar AOH Administrative Over Heads
APS Advance Problem Solving
B BOM Bill Of Materials BPS Basic Problem Solving
C CMI Cost Management Initiative CQ Central Quality
D
DM Daily Management DMP De Merit Points DPV Defect Per Vehicle DRT Direct to Road Test
E EEI Effort and Ergonomic Index ERP (Enterprise Resource Planning) Software program
F FSM Frame and Side Member - One of the component of vehicle FY Fiscal Year
G
G45 Cabin Model name Gemba An Initiative of Ashok Leyland GenMod Genetic Modification GIL Gemba Initiative Leader - To drive individual Initiative within Gemba GUL Gemba Unit Leader - To guide GIL's and drive initiatives within Gemba GVW Gross Vehicle Weight
I ICV Intermediate Commercial Vehicle J JDI Just Do It
K K54 Project Codename- Bring down the break even point by selling 54 thousand
vehicles/year. KKD Keiken Kan Dokyo KPI Key Performance Indicator - Measure of Project
M
"0" MIS "0" Month in service - A Parameter for Early Hour M&HCV Medium & Heavy Commercial Vehicle MIS Management Information System MOH Manpower Over Head MRP Material Requirements Planning software
N NMP New Model Productionisation NTTF Nettur Technical Training Foundation Nukkad Natak Skit Play
O OEM Original Equipment Manufacturer Org Organization
― 53 ―
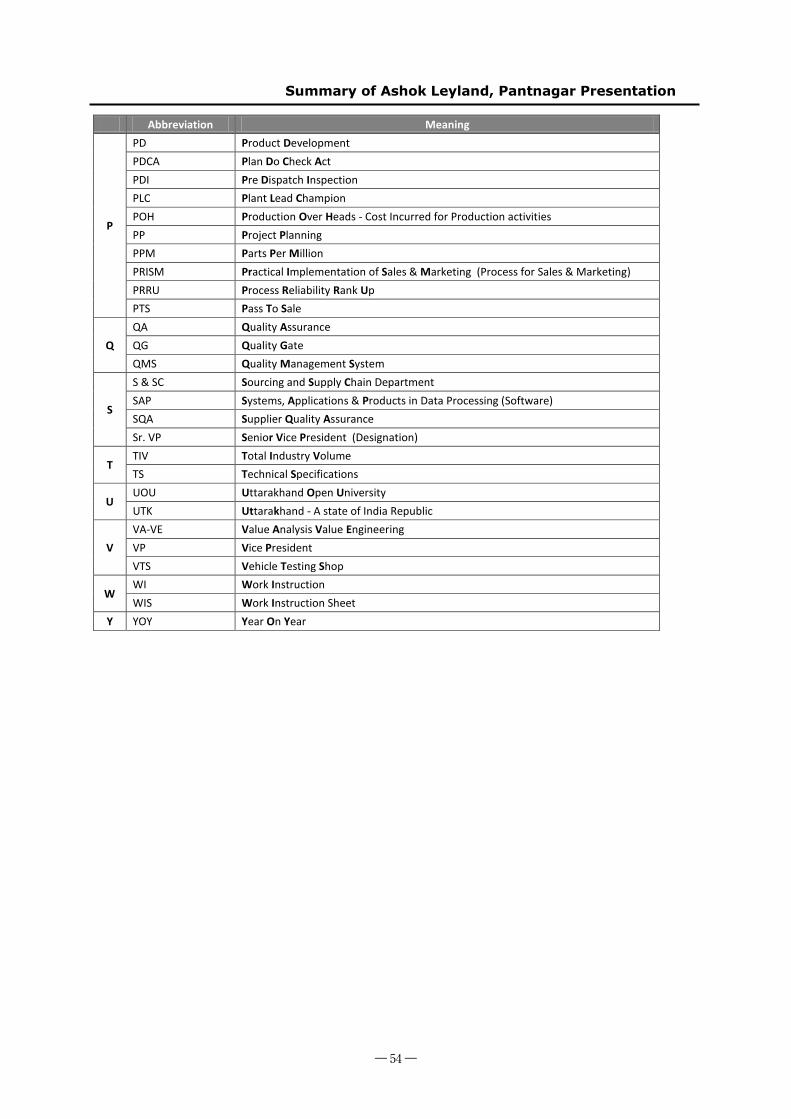
Summary of Ashok Leyland, Pantnagar Presentation
Abbreviation Meaning
P
PD Product Development PDCA Plan Do Check Act PDI Pre Dispatch Inspection PLC Plant Lead Champion POH Production Over Heads - Cost Incurred for Production activities PP Project Planning PPM Parts Per Million PRISM Practical Implementation of Sales & Marketing (Process for Sales & Marketing) PRRU Process Reliability Rank Up PTS Pass To Sale
Q QA Quality Assurance QG Quality Gate QMS Quality Management System
S
S & SC Sourcing and Supply Chain Department SAP Systems, Applications & Products in Data Processing (Software) SQA Supplier Quality Assurance Sr. VP Senior Vice President (Designation)
T TIV Total Industry Volume TS Technical Specifications
U UOU Uttarakhand Open University UTK Uttarakhand - A state of India Republic
V VA-VE Value Analysis Value Engineering VP Vice President VTS Vehicle Testing Shop
W WI Work Instruction WIS Work Instruction Sheet
Y YOY Year On Year
― 54 ―