Evaluation of muscle quality and quantity for the ...
8
RESEARCH ARTICLE Open Access Evaluation of muscle quality and quantity for the assessment of sarcopenia using mid-thigh computed tomography: a cohort study Hiroki Oba 1,2* , Yasumoto Matsui 2 , Hidenori Arai 2 , Tsuyoshi Watanabe 2,3 , Hiroki Iida 1,2 , Takafumi Mizuno 1,2 , Satoshi Yamashita 1 , Shinya Ishizuka 1 , Yasuo Suzuki 2,4 , Hideki Hiraiwa 1 and Shiro Imagama 1 Abstract Background: For the diagnosis of Sarcopenia, European Working Group on Sarcopenia in Older People (EWGSOP) revised the algorisms in 2019, where they added computed tomography (CT) as an assessment tool not only for quantity but also for quality in research purpose. However, the evidence for clinical appreciation of CT has been lacking. Therefore, we investigated the correlation between CT and various motor function tests to assess the utility of CT as a potential diagnostic tool for sarcopenia. Methods: In total, 214 patients who were examined at our center during the study period (2016–2017) were included in the study. Single-slice CT scan of the mid-thigh region was performed, from which cross-sectional area (CSA) and CT attenuation value (CTV) of quadriceps femoris were evaluated for each subject. Other assessments included skeletal muscle mass index by DXA and BIA, muscle strength and physical performance. Furthermore, subjects were classified into four groups as per the Asia Working Group of Sarcopenia (AWGS) 2019 criteria as those with: normal, poor muscle function/strength (poor function), sarcopenia and severe sarcopenia. Results: Knee muscle strength correlated with CSA (r = 0.60) and the correlation was significantly greater than that with DXA and BIA. For physical performance, standing-up test correlated with CSA (r = - 0.20) and CTV (r = - 0.40) and walking speed with CTV (r = 0.43), which was significantly greater than that with DXA and BIA. The CSA was significantly lower in women with sarcopenia group and in both men and women with severe sarcopenia (all p < 0.01). Furthermore, CTV was significantly lower in women with poor-function and in both men and women with severe sarcopenia group (all p < 0.01). Conclusions: CSA mostly correlated with muscle strength, whereas CTV mostly correlated with physical performance. CT with measurements of CSA and CTV enables the evaluation of muscle mass and quality simultaneously. CT is believed to be useful in inferring evaluation of motor function and assessment of sarcopenia. Keywords: Sarcopenia, Mid-thigh computed tomography, Muscle quality, Computed tomography attenuation value, Motor function © The Author(s). 2021 Open Access This article is licensed under a Creative Commons Attribution 4.0 International License, which permits use, sharing, adaptation, distribution and reproduction in any medium or format, as long as you give appropriate credit to the original author(s) and the source, provide a link to the Creative Commons licence, and indicate if changes were made. The images or other third party material in this article are included in the article's Creative Commons licence, unless indicated otherwise in a credit line to the material. If material is not included in the article's Creative Commons licence and your intended use is not permitted by statutory regulation or exceeds the permitted use, you will need to obtain permission directly from the copyright holder. To view a copy of this licence, visit http://creativecommons.org/licenses/by/4.0/. The Creative Commons Public Domain Dedication waiver (http://creativecommons.org/publicdomain/zero/1.0/) applies to the data made available in this article, unless otherwise stated in a credit line to the data. * Correspondence: [email protected] 1 Department of Orthopedics, Nagoya University Graduate School of Medicine, 65 Tsurumaicho, Showaku, Nagoya, Aichi 466-8560, Japan 2 Center for Frailty and Locomotive Syndrome, National Center for Geriatrics and Gerontology, 7-430 Moriokacho, Obu, Aichi 474-8511, Japan Full list of author information is available at the end of the article Oba et al. BMC Geriatrics (2021) 21:239 https://doi.org/10.1186/s12877-021-02187-w
Transcript of Evaluation of muscle quality and quantity for the ...
RESEARCH ARTICLE Open Access
Evaluation of muscle quality and quantityfor the assessment of sarcopenia usingmid-thigh computed tomography: a cohortstudyHiroki Oba1,2* , Yasumoto Matsui2, Hidenori Arai2, Tsuyoshi Watanabe2,3, Hiroki Iida1,2, Takafumi Mizuno1,2,Satoshi Yamashita1, Shinya Ishizuka1, Yasuo Suzuki2,4, Hideki Hiraiwa1 and Shiro Imagama1
Abstract
Background: For the diagnosis of Sarcopenia, European Working Group on Sarcopenia in Older People (EWGSOP)revised the algorisms in 2019, where they added computed tomography (CT) as an assessment tool not only forquantity but also for quality in research purpose. However, the evidence for clinical appreciation of CT has beenlacking. Therefore, we investigated the correlation between CT and various motor function tests to assess the utilityof CT as a potential diagnostic tool for sarcopenia.
Methods: In total, 214 patients who were examined at our center during the study period (2016–2017) wereincluded in the study. Single-slice CT scan of the mid-thigh region was performed, from which cross-sectional area(CSA) and CT attenuation value (CTV) of quadriceps femoris were evaluated for each subject. Other assessmentsincluded skeletal muscle mass index by DXA and BIA, muscle strength and physical performance. Furthermore,subjects were classified into four groups as per the Asia Working Group of Sarcopenia (AWGS) 2019 criteria as thosewith: normal, poor muscle function/strength (poor function), sarcopenia and severe sarcopenia.
Results: Knee muscle strength correlated with CSA (r = 0.60) and the correlation was significantly greater than thatwith DXA and BIA. For physical performance, standing-up test correlated with CSA (r = − 0.20) and CTV (r = − 0.40)and walking speed with CTV (r = 0.43), which was significantly greater than that with DXA and BIA. The CSA wassignificantly lower in women with sarcopenia group and in both men and women with severe sarcopenia (all p <0.01). Furthermore, CTV was significantly lower in women with poor-function and in both men and women withsevere sarcopenia group (all p < 0.01).
Conclusions: CSA mostly correlated with muscle strength, whereas CTV mostly correlated with physicalperformance. CT with measurements of CSA and CTV enables the evaluation of muscle mass and qualitysimultaneously. CT is believed to be useful in inferring evaluation of motor function and assessment of sarcopenia.
Keywords: Sarcopenia, Mid-thigh computed tomography, Muscle quality, Computed tomography attenuationvalue, Motor function
© The Author(s). 2021 Open Access This article is licensed under a Creative Commons Attribution 4.0 International License,which permits use, sharing, adaptation, distribution and reproduction in any medium or format, as long as you giveappropriate credit to the original author(s) and the source, provide a link to the Creative Commons licence, and indicate ifchanges were made. The images or other third party material in this article are included in the article's Creative Commonslicence, unless indicated otherwise in a credit line to the material. If material is not included in the article's Creative Commonslicence and your intended use is not permitted by statutory regulation or exceeds the permitted use, you will need to obtainpermission directly from the copyright holder. To view a copy of this licence, visit http://creativecommons.org/licenses/by/4.0/.The Creative Commons Public Domain Dedication waiver (http://creativecommons.org/publicdomain/zero/1.0/) applies to thedata made available in this article, unless otherwise stated in a credit line to the data.
* Correspondence: [email protected] of Orthopedics, Nagoya University Graduate School ofMedicine, 65 Tsurumaicho, Showaku, Nagoya, Aichi 466-8560, Japan2Center for Frailty and Locomotive Syndrome, National Center for Geriatricsand Gerontology, 7-430 Moriokacho, Obu, Aichi 474-8511, JapanFull list of author information is available at the end of the article
Oba et al. BMC Geriatrics (2021) 21:239 https://doi.org/10.1186/s12877-021-02187-w
BackgroundAs the adult population ages, the extension of healthylife expectancy has become a major issue. Sarcopeniawas initially defined as a reduction in the skeletal musclemass with aging. The term “sarcopenia” was first intro-duced by Rosemberg et al. [1] in 1989, from the Greekterms “sarx” (muscle) and “penia” (loss). In 1998, Baum-gartner et al. [2] defined sarcopenia as a mean skeletalmuscle mass index (SMI) of −2SD or less determinedusing dual energy X-ray absorption (DXA) in young in-dividuals, and since then, sarcopenia has been deter-mined using SMI. However, it has been reported thatcompared with muscle mass, muscle strength is moreassociated with falling and limited mobility [3, 4], andtherefore, in determining sarcopenia, it is thought thatmuscle strength and physical performance should be in-cluded. The 2010 consensus report from the EuropeanWorking Group on Sarcopenia in older people (EWG-SOP) [5] proposed a diagnostic algorithm for determin-ing sarcopenia according to SMI, grip strength, andwalking speed. In 2011, a condition “sarcopenia withlimited mobility” defined as a person with muscle losswhose walking ability is reduced was described as a con-dition that requires treatment [6].In 2014, the Asia Working Group of Sarcopenia
(AWGS) presented diagnostic criteria for sarcopeniabased on data obtained from various Asian countries [7].Furthermore, In the EWGSOP2 revised in 2018, atten-tion was focused on loss of muscle strength as the pri-mary parameter of sarcopenia, and for a definitediagnosis of sarcopenia, it was reported that the assess-ment of muscle quantity and quality is important [8].AWGS 2019 updated the consensus of sarcopenia diag-nosis in Asia: the previous definition of sarcopenia wasretained; however, the diagnostic algorithm, protocols,and some criteria have been revised. Specifically, AWGS2019 introduces “possible sarcopenia,” defined by lowmuscle strength with or without reduced physical per-formance [9].Muscle mass is conventionally measured using DXA
and bioelectrical impedance analysis (BIA). DXA canmeasure appendicular skeletal muscle mass; however,there are problems with this method, i.e., the values dif-fer depending on the machine used [10], and in Asianwomen, this measurement does not change with age[11]. BIA is affected by the amount of body fluids; there-fore, precise evaluations cannot be achieved [12]. There-fore, the EWGSOP2 described computed tomography(CT) and magnetic resonance imaging (MRI) as methodsto verify the muscle quantity and quality; however, thereare only few reports of their use in clinical practice [13].Motor function is evaluated using measurements of
walking speed and grip strength; however, the reproduci-bility is poor depending on the physical and mental
condition of the participant and the measurementmethods and tool used [14]. CT and MRI are consideredthe gold standards of minimally invasive tests to meas-ure muscle mass [15]; however, their use in the evalu-ation of muscle quality remains controversial.Goodpaster et al. [16] noted a good correlation betweenCT attenuation value (CTV) and intramuscular fat infil-tration, whereas Ikemoto-Uezumi et al. [17] reported re-duced muscle fibers and fatty tissue infiltration in themuscular tissue of the vastus medialis in patients withosteoarthritis. Therefore, it is inferred that CT can evalu-ate muscle quantity and that CTV can evaluate fat infil-tration which might be associated with decreased motorfunction.However, there are few reports of the use of CTV in
CT scans of the mid-thigh and their use in evaluatingmotor function. The purpose of this study was to evalu-ate to what extent CT, DXA and BIA derived muscle pa-rameters correlate with muscle strength and function inorder to investigate the utility of CT as a potential as-sessment method for muscle quality as well as for the as-sessment of sarcopenia.
MethodsOf 300 patients who were examined at the outpatientservices of the National Center for Geriatrics and Ger-ontology, Center for Frailty and Locomotive Syndromebetween 2016 and 2017, 214 (78 men and 136 women;average age, 78.3 and 78.4 years respectively) were in-cluded in the study after excluding those with gait im-pairment caused by severe osteoarthritis of the knee andhip, progressive motor disease such as Parkinson disease,dementia and those with missing data. To assess the riskof falls, we investigated fall scores, as proposed by Tobaet al. [18] To assess motor function, we measured walk-ing speed (Walkway MW-1000, ANIMA, Tokyo Japan);grip strength using a new grip dynamometer developedat our institution with ZP-500 N (Imada Co., Ltd., Toyo-hashi, Aichi, Japan) [19]; knee extension strength (ZP-500 N, Imada Co., Ltd., Toyohashi, Aichi, Japan) that isthe measure of the isometric muscle extension strengthin the sitting position with knee at 90° of flexion, devel-oped at our institution [20]; single-leg standing; timedup and go (TUG); short physical performance battery(SPPB) using stand-up test and two-step test. For singleleg standing, the participants were instructed to standon a single leg with their eyes open as long as possibleand the time was recorded. For TUG, we measured thetime required to stand up from the chair and go back 3m and to sit on the chair again. The stand-up and two-step tests were performed to assess the degree of loco-motive syndrome. For the stand-up test, we measuredwhether the participants could stand up on both the legsfrom the sitting position on a platform of 10, 20, 30, and
Oba et al. BMC Geriatrics (2021) 21:239 Page 2 of 8
40 cm [21]. For the two-step test, the participants stoodat the starting line and took two strides as long as pos-sible; then, the two legs were aligned and the distance ofthe two steps was measured. For SPPB, the test evalu-ated the balance, gait, strength, and endurance by exam-ining an individual’s ability to stand on their feettogether in side-by-side semi-tandem and tandem posi-tions, time to walk 8 ft., and time to rise from a chairand return to the seated position five times [22]. Fur-thermore, the muscle mass of the four limbs from thewhole-body scan was measured by DXA (Lunar iDXA,GE Healthcare, Chicago, Illinois, USA) and BIA(Inbody720, BIOSPACE, Iowa, USA). Appendicular skel-etal muscle mass (ASM) (kg) by DXA and BIA /height2(m2) was calculated as a skeletal muscle massindex (SMI) [2].For CT (SOMATOM Sensation 64; Siemens, Munich,
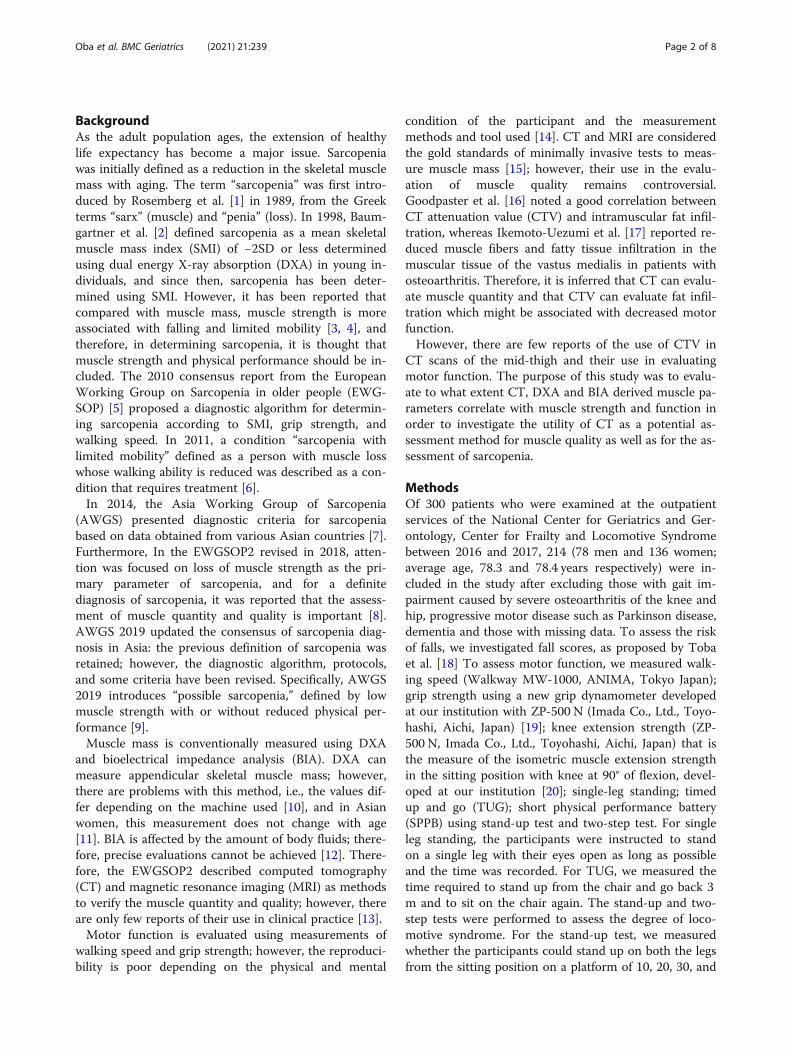
Germany), the subject was placed in the supine position,and a single slice of the right mid-thigh was taken. Wedefined the mid-thigh as the midpoint of the inguinalligament and the superior pole of the patella manually.The scanning conditions were as follows: 120 kV, 120mA, rotation time of 1 s, and field of view of 233 mm.From this single slice, the cross-sectional surface area(CSA) and CTV of the quadriceps femoris muscle weremeasured using SliceOmatic ver.5.0 (Tomovision,Canada) by a single examiner (Fig. 1). CTV was definedas − 1000 Hounsfield Unit (HU) for air and 0 HU forwater and indicated the degree of X-ray absorption of asubstance. The average CTV is 40–100 HU for a muscleand approximately − 50 to − 100 HU for fat. For CSAand CTV, the imaging data of 21 subjects were mea-sured by three examiners, and the associated interclasscorrelation was determined. The intraclass correlation ofCSA and CTV of the examiners was > 0.998, and the in-terclass correlation among the three examiners was0.999.
The subjects were classified in accordance with theAWGS 2019 diagnostic criteria [7] into four groups.Among the subjects without reduced walking speed andgrip strength, the group with normal muscle mass wasdefined as the “normal” group and the group with re-duced walking speed and/or grip strength and normalmuscle mass was defined as the “poor muscle function/strength (poor function)” group. The group with lowASM and low muscle strength or low physical perform-ance was termed the “sarcopenia” group, and the groupwith low ASM, low muscle strength, and low physicalperformance was called the “severe-sarcopenia” group.According to the AWGS 2019 criteria, the cutoff
values [7] were as follows: walking speed,1.0 m/s; gripstrength,28 kg for men and 18 kg for women; SMI withDXA 7.0 kg/m2 for men and 5.4 kg/m2 for women; andSMI with BIA 7.0 kg/m2 for men and 5.7 kg/m2 forwomen. For the four groups, we evaluated the associ-ation between the muscle function and CT, DXA andBIA.Statistical analysis were performed via SPSS (IBM
SPSS Statistics ver.24, Tokyo, Japan) using ANOVA fordemographic data for men and women, CSA and CTVof the quadriceps femoris muscle between each fourgroups. Tukey’s test was applied for post-hoc multipletesting. To determine the association between musclestrength and function parameters on one hand, andCSA, CTV, DXA and BIA on the other hand, partial cor-relations were calculated to correct for the effect of gen-der. Pearson’s correlation coefficient was applied formuscle strength and Spearman’s correlation coefficientwas applied for physical performance test. The differenceof correlation coefficient among the subjects was calcu-lated using Fisher’s Z transformation [23], and then Bon-ferroni correction was performed. P values of < 0.05were considered statistically significant. Power analysiswas performed via G*Power (Heinrich Heine university,
Fig. 1 Procedure for CT measurement. a. We defined the mid-thigh as the midpoint of the inguinal ligament and the superior pole of the patellamanually. b. Obtained CT image of mid-thigh. c. Trace quadriceps femoris using SliceOmatic manually. CT: computed tomography
Oba et al. BMC Geriatrics (2021) 21:239 Page 3 of 8
version 3.1.9.7, Dusseldorf, Germany). The parameterswere as follows: α = 0.05, 1-β = 0.8, assumed correlationcoefficients between CSA and grip strength was 0.2,CTV and grip strength was 0.4 and CTV and CSA was0.3 [24]. Because the calculated appropriate sample sizewas 236, the sample size was almost sufficient for thestudy.
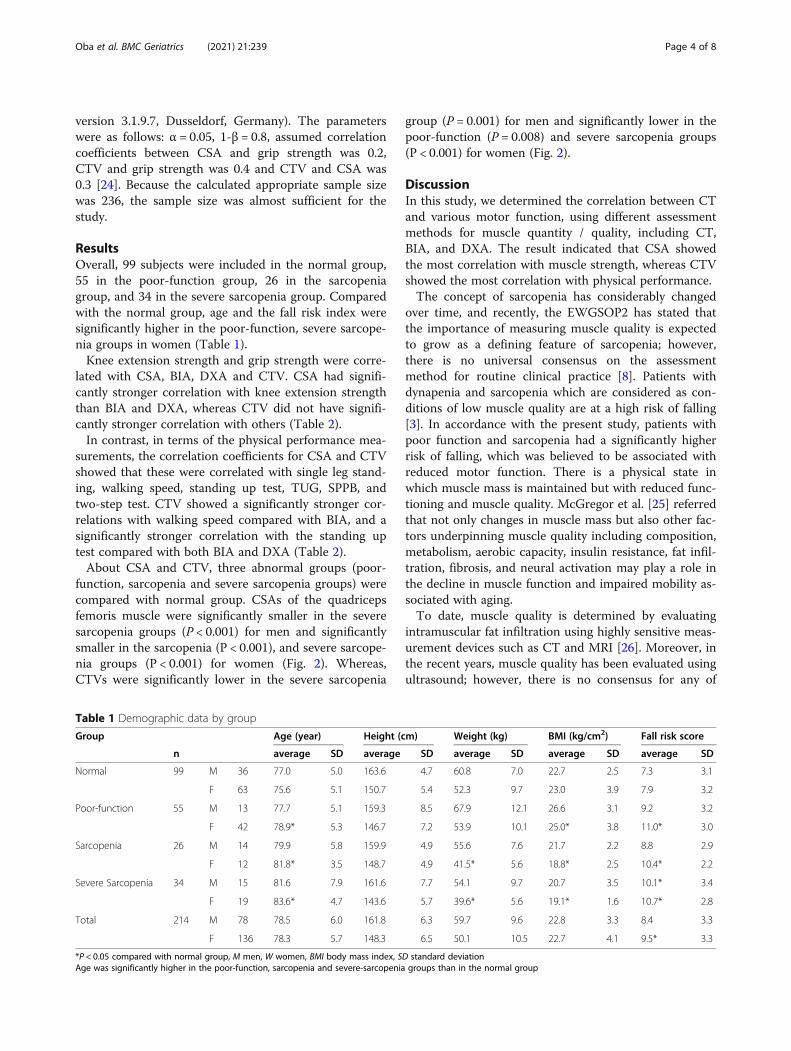
ResultsOverall, 99 subjects were included in the normal group,55 in the poor-function group, 26 in the sarcopeniagroup, and 34 in the severe sarcopenia group. Comparedwith the normal group, age and the fall risk index weresignificantly higher in the poor-function, severe sarcope-nia groups in women (Table 1).Knee extension strength and grip strength were corre-
lated with CSA, BIA, DXA and CTV. CSA had signifi-cantly stronger correlation with knee extension strengththan BIA and DXA, whereas CTV did not have signifi-cantly stronger correlation with others (Table 2).In contrast, in terms of the physical performance mea-
surements, the correlation coefficients for CSA and CTVshowed that these were correlated with single leg stand-ing, walking speed, standing up test, TUG, SPPB, andtwo-step test. CTV showed a significantly stronger cor-relations with walking speed compared with BIA, and asignificantly stronger correlation with the standing uptest compared with both BIA and DXA (Table 2).About CSA and CTV, three abnormal groups (poor-
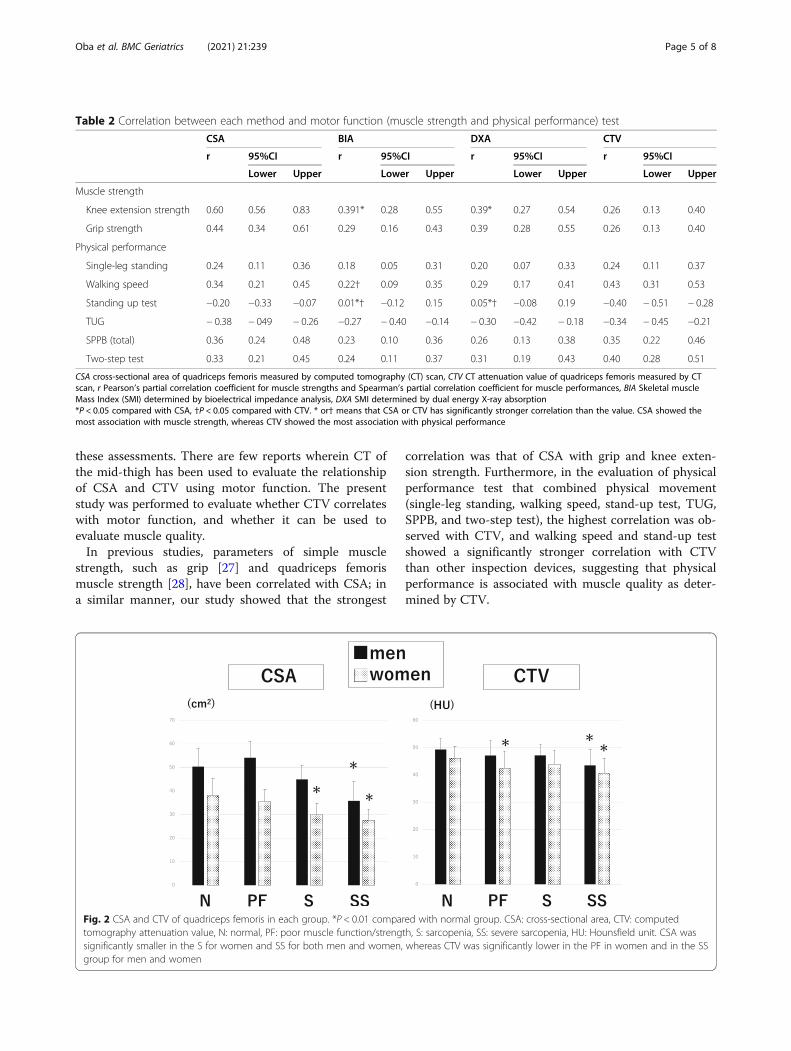
function, sarcopenia and severe sarcopenia groups) werecompared with normal group. CSAs of the quadricepsfemoris muscle were significantly smaller in the severesarcopenia groups (P < 0.001) for men and significantlysmaller in the sarcopenia (P < 0.001), and severe sarcope-nia groups (P < 0.001) for women (Fig. 2). Whereas,CTVs were significantly lower in the severe sarcopenia
group (P = 0.001) for men and significantly lower in thepoor-function (P = 0.008) and severe sarcopenia groups(P < 0.001) for women (Fig. 2).
DiscussionIn this study, we determined the correlation between CTand various motor function, using different assessmentmethods for muscle quantity / quality, including CT,BIA, and DXA. The result indicated that CSA showedthe most correlation with muscle strength, whereas CTVshowed the most correlation with physical performance.The concept of sarcopenia has considerably changed
over time, and recently, the EWGSOP2 has stated thatthe importance of measuring muscle quality is expectedto grow as a defining feature of sarcopenia; however,there is no universal consensus on the assessmentmethod for routine clinical practice [8]. Patients withdynapenia and sarcopenia which are considered as con-ditions of low muscle quality are at a high risk of falling[3]. In accordance with the present study, patients withpoor function and sarcopenia had a significantly higherrisk of falling, which was believed to be associated withreduced motor function. There is a physical state inwhich muscle mass is maintained but with reduced func-tioning and muscle quality. McGregor et al. [25] referredthat not only changes in muscle mass but also other fac-tors underpinning muscle quality including composition,metabolism, aerobic capacity, insulin resistance, fat infil-tration, fibrosis, and neural activation may play a role inthe decline in muscle function and impaired mobility as-sociated with aging.To date, muscle quality is determined by evaluating
intramuscular fat infiltration using highly sensitive meas-urement devices such as CT and MRI [26]. Moreover, inthe recent years, muscle quality has been evaluated usingultrasound; however, there is no consensus for any of
Table 1 Demographic data by group
Group Age (year) Height (cm) Weight (kg) BMI (kg/cm2) Fall risk score
n average SD average SD average SD average SD average SD
Normal 99 M 36 77.0 5.0 163.6 4.7 60.8 7.0 22.7 2.5 7.3 3.1
F 63 75.6 5.1 150.7 5.4 52.3 9.7 23.0 3.9 7.9 3.2
Poor-function 55 M 13 77.7 5.1 159.3 8.5 67.9 12.1 26.6 3.1 9.2 3.2
F 42 78.9* 5.3 146.7 7.2 53.9 10.1 25.0* 3.8 11.0* 3.0
Sarcopenia 26 M 14 79.9 5.8 159.9 4.9 55.6 7.6 21.7 2.2 8.8 2.9
F 12 81.8* 3.5 148.7 4.9 41.5* 5.6 18.8* 2.5 10.4* 2.2
Severe Sarcopenia 34 M 15 81.6 7.9 161.6 7.7 54.1 9.7 20.7 3.5 10.1* 3.4
F 19 83.6* 4.7 143.6 5.7 39.6* 5.6 19.1* 1.6 10.7* 2.8
Total 214 M 78 78.5 6.0 161.8 6.3 59.7 9.6 22.8 3.3 8.4 3.3
F 136 78.3 5.7 148.3 6.5 50.1 10.5 22.7 4.1 9.5* 3.3
*P < 0.05 compared with normal group, M men, W women, BMI body mass index, SD standard deviationAge was significantly higher in the poor-function, sarcopenia and severe-sarcopenia groups than in the normal group
Oba et al. BMC Geriatrics (2021) 21:239 Page 4 of 8
these assessments. There are few reports wherein CT ofthe mid-thigh has been used to evaluate the relationshipof CSA and CTV using motor function. The presentstudy was performed to evaluate whether CTV correlateswith motor function, and whether it can be used toevaluate muscle quality.In previous studies, parameters of simple muscle
strength, such as grip [27] and quadriceps femorismuscle strength [28], have been correlated with CSA; ina similar manner, our study showed that the strongest
correlation was that of CSA with grip and knee exten-sion strength. Furthermore, in the evaluation of physicalperformance test that combined physical movement(single-leg standing, walking speed, stand-up test, TUG,SPPB, and two-step test), the highest correlation was ob-served with CTV, and walking speed and stand-up testshowed a significantly stronger correlation with CTVthan other inspection devices, suggesting that physicalperformance is associated with muscle quality as deter-mined by CTV.
Table 2 Correlation between each method and motor function (muscle strength and physical performance) test
CSA BIA DXA CTV
r 95%CI r 95%CI r 95%CI r 95%CI
Lower Upper Lower Upper Lower Upper Lower Upper
Muscle strength
Knee extension strength 0.60 0.56 0.83 0.391* 0.28 0.55 0.39* 0.27 0.54 0.26 0.13 0.40
Grip strength 0.44 0.34 0.61 0.29 0.16 0.43 0.39 0.28 0.55 0.26 0.13 0.40
Physical performance
Single-leg standing 0.24 0.11 0.36 0.18 0.05 0.31 0.20 0.07 0.33 0.24 0.11 0.37
Walking speed 0.34 0.21 0.45 0.22† 0.09 0.35 0.29 0.17 0.41 0.43 0.31 0.53
Standing up test −0.20 −0.33 −0.07 0.01*† −0.12 0.15 0.05*† −0.08 0.19 −0.40 − 0.51 − 0.28
TUG − 0.38 − 049 − 0.26 −0.27 − 0.40 −0.14 − 0.30 −0.42 − 0.18 −0.34 − 0.45 −0.21
SPPB (total) 0.36 0.24 0.48 0.23 0.10 0.36 0.26 0.13 0.38 0.35 0.22 0.46
Two-step test 0.33 0.21 0.45 0.24 0.11 0.37 0.31 0.19 0.43 0.40 0.28 0.51
CSA cross-sectional area of quadriceps femoris measured by computed tomography (CT) scan, CTV CT attenuation value of quadriceps femoris measured by CTscan, r Pearson’s partial correlation coefficient for muscle strengths and Spearman’s partial correlation coefficient for muscle performances, BIA Skeletal muscleMass Index (SMI) determined by bioelectrical impedance analysis, DXA SMI determined by dual energy X-ray absorption*P < 0.05 compared with CSA, †P < 0.05 compared with CTV. * or† means that CSA or CTV has significantly stronger correlation than the value. CSA showed themost association with muscle strength, whereas CTV showed the most association with physical performance
Fig. 2 CSA and CTV of quadriceps femoris in each group. *P < 0.01 compared with normal group. CSA: cross-sectional area, CTV: computedtomography attenuation value, N: normal, PF: poor muscle function/strength, S: sarcopenia, SS: severe sarcopenia, HU: Hounsfield unit. CSA wassignificantly smaller in the S for women and SS for both men and women, whereas CTV was significantly lower in the PF in women and in the SSgroup for men and women
Oba et al. BMC Geriatrics (2021) 21:239 Page 5 of 8
Lang et al. [29] reported that a low CTV of the thighindicated a higher risk of fall and hip fracture; the resultsof the present study are consistent with these results. Inthis study, we classified patients into four groups as permuscle mass and motor function, based on the AWGS2019 criteria. Between the women in the normal andsarcopenia groups, there was no decrease in the CTV;however, there was a significant decline in the CTV ofthose in the poor-function and severe sarcopenia groups.We consider that the decrease in CTV may be attribut-able to muscle atrophy and increased fat composition inthe muscle. Ikemoto-Uezumi et al. [17] compared tissuein the vastus medialis muscle of patients with osteoarth-ritis and reported that intramuscular adipose tissue(IMAT) and an increased proportion of interstitial tissuewere observed. Thus, a decline in CTV with an increasedproportion of IMAT was associated with intramuscularfat infiltration [30]. Similarly, in sarcopenia, increasedIMAT is observed [16], and these changes in muscle tis-sue could explain the decrease in CTV. Reportedly, in-creased IMAT measured by MRI is a prognostic factorof gait ability [31], and IMAT accumulates markedlyafter reduced activity in healthy young adults [32]. Weconsider that reduced activity or motor function mayhave caused an increase in IMAT and that CTV couldevaluate this change in muscle composition.As a minimally invasive tool, CT is considered as a
gold standard to measure muscle quantity; however, it isnot used in general practice owing to the high costs,poor portability, and requirement of an experienced op-erator [15]. In patients with cancer, reduced musclemass is an independent predictor of immobility andmortality [33]. Kasai et al. [34] reported that among themuscles in the mid-thigh CT, CSA decreased with agemainly in quadriceps femoris. Schweitzer et al. [35] re-ported that on MRI, the best estimates for skeletalmuscle were shown in the thigh. Lee SJ reported thatCT of the femur was a useful method to evaluate musclemass for the entire body [36]. Compared with other testequipment, DXA showed no change with age amongAsian women [11]. Recently, we reported significant as-sociations of thigh CT CSA with muscle strength [37].For BIA, changes associated with the physical conditionsuch as fluid balance and body temperature fluctuatedduring the day, resulting in reduced accuracy of BIA[38]. CT could be a better form of assessment becauseof its accuracy, reproducibility, and objectivity [39]. CTcan simultaneously measure the muscle CSA and CTV,indicating muscle mass and composition; thus, CT isuseful for assessing the severity of sarcopenia. Regardingthe amount of radiation exposure, as only a single sliceis scanned, we consider that there is no problem interms of the radiation levels [10]. In addition, single sliceleg CT scanning takes only about 5 min. We think that
the present results represent the initial steps toward theaccumulation of evidence for the evaluation of musclequality and will form the basis for future studies toexamine the pathophysiology of severe sarcopenia ac-companied by not only muscle mass loss but also phys-ical functional decline. It is also useful for detailedevaluation in patients who have difficulty to walk, or toconfirm the muscle condition after screening with a sim-ple physical test.There were limitations to the present study. First, this
was a cross-sectional study and changes caused by nat-ural history or therapeutic intervention could not beevaluated. Further study is required to determinewhether or not the changes occurred as a result of exer-cise therapy, nutritional counseling, and pharmacother-apy. Second, this study did not include large-scale dataof CSA and CTV from each age group of the generalpopulation without sarcopenia, and therefore, thehealthy control information was weak. Thus, analysisusing a large-scale epidemiological study is required. Inthe future, we plan to perform an analysis on a largersample. As noted in the EWGSOP2, our results showedthat CT may be useful in objectively evaluating sarcope-nia more accurately and understand the pathology ingreater detail [8].
ConclusionsThis study was the first to report a relationship betweenmid-thigh CT and motor function in clinical setting. CTallows CSA and CTV to be measured simultaneously;CSA showed the most association with muscle strength,whereas CTV showed the most association with physicalperformance. These results could be useful for the asses-sing the presence and severity of sarcopenia.
AbbreviationsAWGS: Asia Working Group of Sarcopenia; BIA: Bioelectrical impedanceanalysis; CSA: Cross-sectional area; CT: Computed tomography; CTV: CTAttenuation value; DXA: Dual energy X-ray absorption; EWGSOP: EuropeanWorking Group on Sarcopenia in Older People; MRI: Magnetic resonanceimaging; SMI: Skeletal muscle mass index; SPPB: Short physical performancebattery; TUG: Timed Up and Go; HU: Hounsfield unit
AcknowledgmentsWe would like to express our gratitude to everyone who cooperated in thestudy at National Center for Geriatrics and Gerontology.
Authors’ contributionsHO drafted the manuscript. YM suggested this study concept and design.HA supervised study concept and helped in the interpretation of this study.YS analyzed mid-thigh CT data and calculated CSA and CTV. HO and SY ana-lyzed the participants data. TW, HI, TM, SI1, HH and SI2 advised study designand results. All authors critically revised the report, commented on drafts ofthe manuscript, and approved the final manuscript.
FundingThis work was supported by a grant from Expenses for Research andDevelopment of Geriatrics and Gerontology (26–12, 29–12) and FurunoElectronics; the funding agencies played no role in the study.
Oba et al. BMC Geriatrics (2021) 21:239 Page 6 of 8
Availability of data and materialsThe datasets generated during and/or analyzed during the current study areavailable from the corresponding author on reasonable request.
Declarations
Ethics approval and consent to participateThe study was conducted with the approval of the Ethical Review Board ofthe National Center for Geriatrics and Gerontology, Japan and all participantsprovided fully informed consent with written documents prior toparticipation.
Consent for publicationNot applicable.
Competing interestsThe authors declare that they have no competing interests.
Author details1Department of Orthopedics, Nagoya University Graduate School ofMedicine, 65 Tsurumaicho, Showaku, Nagoya, Aichi 466-8560, Japan. 2Centerfor Frailty and Locomotive Syndrome, National Center for Geriatrics andGerontology, 7-430 Moriokacho, Obu, Aichi 474-8511, Japan. 3Department ofOrthopedics, National Center for Geriatrics and Gerontology, 7-430Moriokacho, Obu, Aichi 474-8511, Japan. 4Department of Human CareEngineering, Faculty of Health Sciences, Nihon Fukushi University, Okuda,Mihamacho, Chita, Aichi 470-3295, Japan.
Received: 22 August 2020 Accepted: 2 April 2021
References1. Rosenberg IH. Symposium: Sarcopenia: Diagnosis and Mechanisms
Sarcopenia: Origins and Clinical Relevance. 1997;127(5):990S-1S. https://academic.oup.com/jn/article-abstract/127/5/990S/4724144.
2. Baumgartner RN, Koehler KM, Gallagher D, Romero L, Heymsfield SB, RossRR, et al. Epidemiology of sarcopenia among the elderly in New Mexico.Am J Epidemiol. 1998;147(8):755–63. https://doi.org/10.1093/oxfordjournals.aje.a009520.
3. Schaap LA, Van Schoor NM, Lips P, Visser M. Associations of sarcopeniadefinitions, and their components, with the incidence of recurrent fallingand fractures: the longitudinal aging study Amsterdam. J Gerontol A Biol SciMed Sci. 2018;73(9):1199–204. https://doi.org/10.1093/gerona/glx245.
4. Alley DE, Shardell MD, Peters KW, McLean RR, Dam TT, Kenny AM, et al. Gripstrength cutpoints for the identification of clinically relevant weakness. JGerontol A Biol Sci Med Sci. 2014;69(5):559–66. https://doi.org/10.1093/gerona/glu011.
5. Cruz-Jentoft AJ, Baeyens JP, Bauer JM, Boirie Y, Cederholm T, Landi F, et al.Sarcopenia: European consensus on definition and diagnosis: report of theEuropean working group on sarcopenia in older people. Age Ageing. 2010;39(4):412–23. https://doi.org/10.1093/ageing/afq034.
6. Morley JE, Abbatecola AM, Argiles JM, Baracos V, Bauer J, Bhasin S, et al.Sarcopenia with limited mobility: an international consensus. J Am Med DirAssoc. 2011;12(6):403–9. https://doi.org/10.1016/j.jamda.2011.04.014.
7. Chen LK, Liu L, Woo J, Assantachai P, Auyeung T, Bahyah KS, et al.Sarcopenia in Asia: consensus report of the Asian working group forsarcopenia. J Am Med Dir Assoc. 2014;15(2):95–101. https://doi.org/10.1016/j.jamda.2013.11.025.
8. Cruz-Jentoft AJ, Bahat G, Bauer J, Boirie Y, Bruyere O, Cederholm T, et al.Sarcopenia: revised European consensus on definition and diagnosis. AgeAgeing. 2019;48(1):16–31. https://doi.org/10.1093/ageing/afy169.
9. Chen LK, Liu LK, Woo J, Assantachai P, Auyeung TW, Bahyah SK, et al. Asianworking group for sarcopenia. J Am Med Dir Assoc. 2014;15(2):95–101.https://doi.org/10.1016/j.jamda.2013.11.025.
10. Buckinx F, Landi F, Cesari M, Fielding RA, Visser M, Engelke K, et al. Pitfalls inthe measurement of muscle mass: a need for a reference standard. JCachexia Sarcopenia Muscle. 2018;9(2):269–78. https://doi.org/10.1002/jcsm.12268.
11. Shimokata H, Ando F, Yuki A, Otsuka R. Age-related changes in skeletalmuscle mass among community-dwelling Japanese: a 12-year longitudinal
study. Geriatr Gerontol Int. 2014;14(Suppl 1):85–92. https://doi.org/10.1111/ggi.12219.
12. Gonzalez MC, Heymsfield SB. Bioelectrical impedance analysis fordiagnosing sarcopenia and cachexia: what are we really estimating? JCachexia Sarcopenia Muscle. 2017;8(2):187–9. https://doi.org/10.1002/jcsm.12159.
13. Mourtzakis M, Prado CM, Lieffers JR, Reiman T, McCargar LJ, Baracos VE. Apractical and precise approach to quantification of body composition incancer patients using computed tomography images acquired duringroutine care. Appl Physiol Nutr Metab. 2008;33(5):997–1006. https://doi.org/10.1139/H08-075.
14. Beaudart C, Rolland Y, Cruz-Jentoft AJ, Bauer JM, Sieber C, Cooper C, et al.Assessment of muscle function and physical performance in daily clinicalpractice. Calcif Tissue Int. 2019;105(1):1–14. https://doi.org/10.1007/s00223-019-00545-w.
15. Beaudart C, McCloskey E, Bruyère O, Cesari M, Rolland Y, Rizzoli R, et al.Sarcopenia in daily practice: assessment and management. BMC Geriatr.2016;16(1):170. https://doi.org/10.1186/s12877-016-0349-4.
16. Goodpaster BH, Kelley DE, Thaete FL, He J, Ross R. Skeletal muscleattenuation determined by computed tomography is associated withskeletal muscle lipid content. J Appl Physiol (1985). 2000;89(1):104–10.https://doi.org/10.1152/jappl.2000.89.1.104.
17. Ikemoto-Uezumi M, Matsui Y, Hasegawa M, Fujita R, Kanayama Y, Uezumi A,et al. Disuse atrophy accompanied by intramuscular ectopic \adipogenesisin vastus medialis Musclevastus medialis muscle of advanced osteoarthritispatients. Am J Pathol. 2017;187(12):2674–85. https://doi.org/10.1016/j.ajpath.2017.08.009.
18. Toba K, Kikuchi R, Iwata A, Kozaki K. “Fall risk index” helps clinicians identifyhigh-risk individuals. Jpn Med Assoc J. 2009;52:237–42.
19. Matsui Y, Fujita R, Harada A, Sakurai T, Nemoto T, Noda N, et al. Associationof grip strength and related indices with independence of activities of dailyliving in older adults, investigated by a newly-developed grip strengthmeasuring device. Geriatr Gerontol Int. 2014;14(Suppl 2):77–86. https://doi.org/10.1111/ggi.12262.
20. Fujita R, Matsui Y, Harada A, Takemura M, Kondo I, Nemoto T, et al. Doesthe Q − H index show a stronger relationship than the H:Q ratio in regardto knee pain during daily activities in patients with knee osteoarthritis? JPhys Ther Sci. 2016;28:3320–4 doi: 10.1589%2Fjpts.28.3320.
21. Nakamura K, Ogata T. Locomotive syndrome: Definition and Management.Clin Rev Bone Miner Metab. 2016;14:56–67 doi: 10.1007%2Fs12018-016-9208-2.
22. Guralnik JM, Simonsick EM, Ferrucci L, Glynn RJ, Berkman LF, Blazer DG,et al. A short physical performance battery assessing lower extremityfunction: association with self-reported disability and prediction of mortalityand nursing home Admission.nursing home admission. J Gerontol. 1994;49:85–94. https://doi.org/10.1093/geronj/49.2.M85.
23. Dunn OJ, Clark V. Correlation Coefficients Measured on the SameIndividuals. J Am Stat Assoc. 64:325, 366–77. https://doi.org/10.1080/01621459.1969.10500981.
24. Cohen J. Statistical power analysis for the behavioral sciences. 2nd ed.Hillsdale: Lawrence Erlbaum Associates; 1988.
25. McGregor RA, Cameron-Smith D, Poppitt SD. It is not just muscle mass: areview of muscle quality, composition and metabolism during ageing asdeterminants of muscle function and mobility in later life. Longev Heal.2014;3:1–8.
26. Heymsfield SB, Gonzalez MC, Lu J, Jia G, Zheng J. Skeletal muscle mass andquality: evolution of modern measurement concepts in the context ofsarcopenia. Proc Nutr Soc. 2015;74(4):355–66. https://doi.org/10.1017/S0029665115000129.
27. Chalhoub D, Boudreau R, Greenspan S, Newman AB, Zmuda J, Frank-WilsonAW, et al. Associations between lean mass, muscle strength and power, andskeletal size, density and strength in older men. J Bone Miner Res. 2018;33(9):1612–21. https://doi.org/10.1002/jbmr.3458.
28. Visser M, Kritchevsky SB, Goodpaster BH, Newman AB, Nevitt M, Stamm E,et al. Leg muscle mass and composition in relation to lower extremityperformance in men and women aged 70 to 79: the health, aging andbody composition study. J Am Geriatr Soc. 2002;50(5):897–904. https://doi.org/10.1046/j.1532-5415.2002.50217.x.
29. Lang T, Cauley JA, Tylavsky F, Bauer D, Cummings S, Harris TB, et al. Study.Computed tomographic measurements of thigh muscle cross-sectional areaand attenuation coefficient predict hip fracture: the health, aging, and body
Oba et al. BMC Geriatrics (2021) 21:239 Page 7 of 8
composition study. J Bone Miner Res. 2010;25(3):513–9. https://doi.org/10.1359/jbmr.090807.
30. Aubrey J, Esfandiari N, Baracos VE, Buteau FA, Frenette J, Putman CT, et al.Measurement of skeletal muscle radiation attenuation and basis of itsbiological variation. Acta Physiol. 2014;210(3):489–97. https://doi.org/10.1111/apha.12224.
31. Marcus RL, Addison O, Dibble LE, Foreman KB, Morrell G, Lastayo P.Intramuscular adipose tissue, sarcopenia, and mobility function in olderindividuals. J Aging Res. 2012;2012:629637–6. https://doi.org/10.1155/2012/629637.
32. Manini TM, Clark BC, Nalls MA, Goodpaster BH, Ploutz-Snyder LL, Harris TB,et al. Reduced physical activity increases intermuscular adipose tissue inhealthy young adults. Am J Clin Nutr. 2007;85(2):377–84. https://doi.org/10.1093/ajcn/85.2.377.
33. Fearon K, Strasser F, Anker SD, Bosaeus I, Bruera E, Fainsinger RL, et al.Definition and classification of cancer cachexia: an international consensus.Lancet Oncol. 2011;12(5):489–95. https://doi.org/10.1016/S1470-2045(10)70218-7.
34. Kasai T, Ishiguro N, Matsui Y, Harada A, Takemura M, Yuki A, et al. Sex- andage-related differences in mid-thigh composition and muscle qualitydetermined by computed tomography in middle-aged and elderlyJapanese. Geriatr Gerontol Int. 2015;15(6):700–6. https://doi.org/10.1111/ggi.12338.
35. Schweitzer L, Geisler C, Pourhassan M, Braun W, Glüer CC, Bosy-Westphal A,et al. What is the best reference site for a single MRI slice to assess wholebody skeletal muscle and adipose tissue volumes in healthy adults? Am JClin Nutr. 2015;102(1):58–65. https://doi.org/10.3945/ajcn.115.111203.
36. Lee SJ, Janssen I, Heymsfield SB, Ross R. Relation between whole-body andregional measures of human skeletal muscle. Am J Clin Nutr. 2004;80(5):1215–21. https://doi.org/10.1093/ajcn/80.5.1215.
37. Tsukasaki K, Matsui Y, Arai H, Harada A, Tomida M, Takemura M, et al.Association of muscle strength and gait speed with cross-sectional musclearea determined by mid-thigh computed tomography - a comparison withskeletal muscle mass measured by dual-energy x-ray absorptiometry. JFrailty Aging. 2020;9(2):2019 doi: https://doi.org/10.14283/jfa.2020.16.
38. Leenders M, Verdijk LB, van der Hoeven L, van Kranenburg J, Nilwik R, vanLoon LJ. Elderly men and women benefit equally from prolongedresistance-type exercise training. J Gerontol A Biol Sci Med Sci. 2013;68(7):769–79. https://doi.org/10.1093/gerona/gls241.
39. Goodpaster BH, Thaete FL, Kelley DE. Composition of skeletal muscleevaluated with computed tomography. Ann N Y Acad Sci. 2000;904(1):18–24. https://doi.org/10.1111/j.1749-6632.2000.tb06416.x.
Publisher’s NoteSpringer Nature remains neutral with regard to jurisdictional claims inpublished maps and institutional affiliations.
Oba et al. BMC Geriatrics (2021) 21:239 Page 8 of 8