13 en new methods on sewage sludge dewatering and management
Upload
karim-osseiranCategory
view
149download
0
Energy from Wastewater Sewage Sludge in Lebanon
Transforming a Waste Disposal Problem into an Opportunity
Ecorient – June 2013
Council for Development & Reconstruction


Table of contents
‐ Objectives of the Study, Slide 4‐ Anaerobic Digestion & CHP Technology Review, Slides 5 to 12‐ AD General Guidelines for Future WWTP, Slide 13‐ Project 1 to Project 7 Definition, Slides 14 & 15‐ Scenario 1: AD from WWTP proper Sludge only, Slide 16‐ Scenario 2: AD with Added Sludge, Slide 17‐ Scenario 3: AD with Added Sludge & Co‐Substrates, Slide 18‐ AD Economics, Slide 19‐ Summary of Findings, Slide 20‐ Challenges & Recommendations, Slide 21‐ Conclusion, Slide 22

Objectives of the Study
• Issue Anaerobic Digestion ‐ AD technology general guidelines for future WWTP projects in Lebanon
• Evaluate Energy potential at 7 identified WWTP sites where sludge AD is feasible
• Evaluate options to maximize Energy production:a‐ Sludge imported from WWTP within 25 Kmb‐ Co‐digestion using local substrates
identified in the area during the National Bioenergy National Plan

Anaerobic Digestion Technology: Principle & Requirements
• Anaerobic digestion is a process in which organic matter from wet organic wastes (ie. Waste water sludge, liquid & solid manure, food processing wastes, slaughterhouse residues, agriculture residues etc.) is converted into Biogas by bacteria in the absence of oxygen.
• The Biogas including 60% Methane (CH4) is then collected and may be used to generate Electricity & Heat (1 Nm3 Biogas 0.6 liters LFO).
• Biogas reduces emissions by preventing methane release in the atmosphere. Methane is 21 times stronger than carbon dioxide as a greenhouse gas.
• In addition, the AD process creates potentially valuable by‐products, such as High Ammonia content fertilizer from hygenized sludge, and/or liquid with available nutrients.
• Finally the AD process has the advantage of Odor Control & Sludge volume reduction to (1/3).

Sludge Anaerobic Digestion Operational Parameters
1 Ton Organic Matter Destroyed
From 20 Nm3 to 900 Nm3 of Biogas depending on feedstock & AD design
+ Valuable Fertilizer

How an Anaerobic Digester Works ?
5 – 20 Days, Temperature Dependent

What an Anaerobic Digester looks like ?
Substrate Inflow Effluent
Substrate
Effluent Gas
Ground injection pipe
Ground sludge pipe
Fluid Zone
Sludge Zone
Mixing Zone
Biogas

Basic Anaerobic Digestion System Flow Diagram

Basic Combined Heat & Power Biogas Engine Gen‐set Diagram
Hot Return Water
Cold Supply Water
Pump
Exhaust Stack
CO2 Recovery
Secondary Exhaust Heat Exchanger
Selective Catalytic Reduction Exhaust after Treatment
Exhaust Silencer Heat Exchanger
Biogas Gensetwith Heat Recovery
Exhaust Oxidation Catalyst
Electric Utility
Exhaust Line
Electric Output
Switchgear
Biogas Supply
Jacket Water & After‐cooler Heat Exchangers
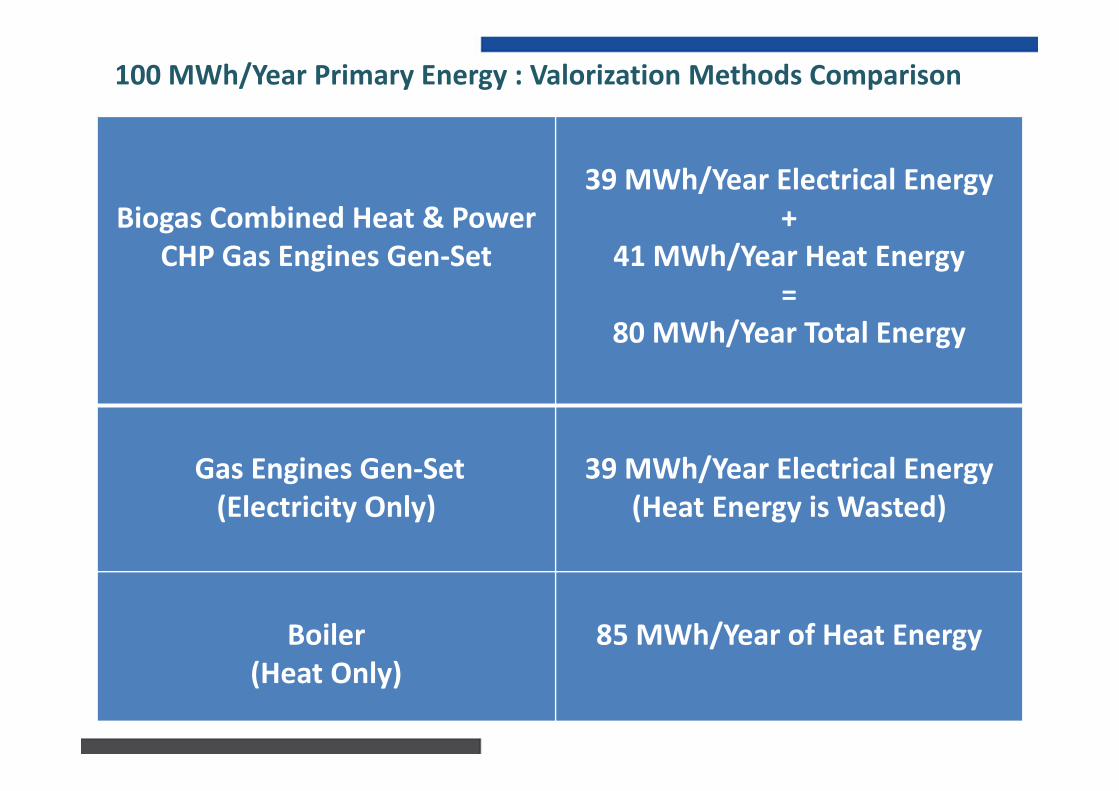
100 MWh/Year Primary Energy : Valorization Methods Comparison
Biogas Combined Heat & Power CHP Gas Engines Gen‐Set
39 MWh/Year Electrical Energy +
41 MWh/Year Heat Energy=
80 MWh/Year Total Energy
Gas Engines Gen‐Set (Electricity Only)
39 MWh/Year Electrical Energy(Heat Energy is Wasted)
Boiler (Heat Only)
85 MWh/Year of Heat Energy

Scale Requirements for Anaerobic Digestion
Feedstock (Tons / Year ) to produce 1 MWe
25,000 to 60,000 (depending on feedstock)

AD Technology General Guidelines for Future WWTP Projects

Medium to Large WWTP Projects in Lebanon
86%
7%7%
WWTP Distribution by Size
Less than 100,000 PEBetween 100,000 PE & 200,000 PEGreater than 200,000 PE
Name PE
100,000 to 200,000 PE
1 Nabatieh 100,0002 Tibnine & Chakra 100,0003 P7 ‐ Baalbek 100,000
4 West Beqaa (Jib Jenine + Saghbine) 100,000
5 Timnine El Tahta 100,0006 Zahle 150,0007 P3 ‐ Aabde 185,000
> 200,000 PE
1 P2 ‐ Tyr 250,0002 P6 ‐Majdal Aanjar 300,0003 P4 ‐ Sarafand 325,0004 P5 ‐ Saida 390,0005 Kessrwan 505,0006 Ghadir 800,000
7 P1‐ Tripoli 1,000,000
8 Bourj Hammoud 2,000,000

7 Identified AD Feasible WWTPWWTP PE Co-Substrates MW
P1
Tripoli 1,000,000 N.A.
3.1 MWJbeil 50,000 N.A.
Batroun 30,000 N.A.Chekka 24,000 N.A.
P2 Tyr 250,000 N.A. 0.9 MWTibnine & Chakra 100,000 N.A.
P3Aabde 185,000 Wheat Residues
1.4 MWBakhoun 48,000 Animal ManureMechmech 68,000 Food Industry Waste
P4
Sarafand 325,000 Wheat Residue
1.5 MWNabatieh 100,000 Yellow Grease
Kfarsir, Yahmour & Zawtar 35,000 Animal ManureFood Industry Waste
P5Saida 390,000 Slaughterhouse Waste
1.7 MWRas Nabi Younes 88,000 Wheat Residues
Olive cake Residues
P6
Majdal Aanjar 300,000 Wheat Residues
1.7 MWZahle 150,000
Animal ManureSlaughterhouse WasteFood Industry Waste
P7
Baalbeck 100,000 Milk Processing Co-products
1.4 MWTimnine El Tahta 100,000 Wheat Residues
Laboua 47,000 Animal ManureFood Industry Waste

Scenario 1: AD from WWTP proper Sludge Only
21,9175,579 4,129 7,253 8,703 6,695 0
54,27623,041
5,865 4,3407,625 9,150 7,038
0
57,059
0
20,000
40,000
60,000
80,000
100,000
120,000
MWh/Year Energy Production through CHP
Energy Production through CHP: Heat MWh/yearEnergy Production through CHP: Electriciity MWh/year
7.32 MW
75 %
% Self Generated Electricity
75 % 75 % 75 % 75 % 75 % 0 %
‐ 8,300 T CO2e/Year
‐ 2,100 T CO2e/Year
‐ 1,500 T CO2e/Year
‐ 2,800 T CO2e/Year
‐ 3,300 T CO2e/Year
‐ 2,500 T CO2e/Year
‐ 20,500 T CO2e/Year

Scenario 2: AD with Added Sludge from nearby WWTP
23,9687,217 6,029 8,940 10,772 8,333 3,964
69,22325,197
7,587 6,338 9,399 11,325 8,7604,168
72,774
0
20,000
40,000
60,000
80,000
100,000
120,000
140,000
160,000
MWh/Year Energy Production through CHP
Energy Production through CHP : Heat MWh/yearEnergy Production through CHP : Electriciity MWh/year
8.88 MW
+ 9.4 %
+ 29.4 %+ 46.0 %
+ 23.3 % + 23.8 % + 24.5 %
+ 27.5 %
+ 0.0 %
+ 22.5 %+ 42.1 %
+ 25.6 % + 21.0 % + 22.5 %
+ 21.4 %
% Increase in Installed Capacity% Increase in Energy Production
83 %
100 %112 %
95 % 95 % 96 %
% Self Generated Electricity
‐ 9,000 T CO2e/Year
‐ 2,700 T CO2e/Year
‐2,200 T CO2e/Year
‐ 3,300 T CO2e/Year
‐ 4,000 T CO2e/Year
‐ 3,100 T CO2e/Year
‐ 25,700 T CO2e/Year
‐ 1,400 T CO2e/Year

Scenario 3: AD with Added Sludge & Co‐Substrates
23,9687,217 11,011 11,921 13,611 13,560 11,395
92,68325,197
7,587 11,576 12,534 14,309 14,255 11,979
97,437
020,00040,00060,00080,000100,000120,000140,000160,000180,000200,000
MWh/Year Energy Production through CHP
Energy Production through CHP Heat MWh/yearEnergy Production through CHP Electriciity MWh/year
+ 9.4 %
% Increase in Installed Capacity% Increase in Energy Production
+ 29.4 % + 166.7 % + 64.4 % + 56.4 % + 102.5 % + 187.5 %
+ 70.8 %
% Self Generated Electricity
+ 0.0 %
11.68 MW
+ 22.5 %+ 89.8 % + 60.8 % + 53.3 % + 90.0 % + 189.4 %
+ 59.5 %
83 %
100 % 205 % 126 % 120 % 156 %
‐ 9,000 T CO2e/Year
‐ 2,700 T CO2e/Year
‐ 4,180 T CO2e/Year
‐ 4,500 T CO2e/Year
‐ 5,160 T CO2e/Year
‐ 5,160 T CO2e/Year
‐ 4,300 T CO2e/Year
‐ 35,000 T CO2e/Year

AD Economics
19.70
16.10 15.60 16.20
7.708.70
10.60 10.70
9.00 7.10
0.00
5.00
10.00
15.00
20.00
25.00
P3‐ Aabde P4‐ Sarafand P5‐ Saida P6‐ Majdal Anjar P7‐ Bekaa
Levelized Cost of Electrical Energy in $c/Kwh
$c/Kwh Scenario 2 $c/Kwh Scenario 3
Current Cost of Energy Production by EDL
Target Cost of Energy Production by EDL
Current EDL Tariff

Scenario 1: Sludge AD Only
(6 Plants)
Scenario 2 : Sludge AD withAdded Sludge(7 + 14 plants)
Scenario 3: Sludge AD with Added Sludge & Co‐Digestion
( 7 + 14 plants)Already Installed Generation
Capacity (Tripoli) 3.09 MW 3.09 MW 3.09 MW
Additional Generation Capacity 4.23 MW 5.79 MW 8.59 MW
Total Generation Capacity 7.32 MW 8.88 MW 11.68 MW
Electric Energy 54,276 MWh/y 69,223 MWh/y 92,683 MWh/y
Heat Energy 57,059 MWh/y 72,774 MWh/y 97,437 MWh/y
CO2 Reduction ‐ 20,500 T CO2e/y ‐ 25,700 T CO2e/y ‐35,000 T CO2e/y
Self Generation 75% 83% to 112% 83% to 205%
Levelized Cost of Electricity* N.A. 7.7 to 19.7 c/Kwh 7.1 to 10.7 c/Kwh
* The heat & the fertilizers that are produced are an added benefit that has not been priced
+ 21.4 % + 59.5 %
+ 27.5 % + 70.8 %
+ 25.4 % +70.8%
Scenario 3 represents 3% to 4% of Lebanon’s Bioenergy Potential
Findings Summary

Challenges & Recommendations• The future WWTP design must follow the general guidelines.• WWTP belonging to different Water Establishments must be able to
divert sludge from one plant to another under Scenario 2.• The Water Establishments to which the WWTP belong must have the
legal & administrative possibility to enter into agreements with third parties for acquiring the Co‐Substrates feedstock under Scenario 3.
• The WWTP that generate more then their Electrical Energy consumption must be enabled to evacuate the excess energy on the grid (ie: elaborate a customized Net Metering scheme).
• The Levelized cost of Energy Produced under Scenario 2 being higher than the target level of 14 c/Kwh , incentives will be required to proceed or we must stick to Scenario 3.
• The WWTP must have the legal & administrative possibility to sell the Heat Energy produced & the Fertilizers to neighboring end users.
• The AD technology requires a thorough technical monitoring in order to be effective. The Water Establishments must be allowed to collect money from the end users for the WWT service in order to finance the proper Operation & Maintenance of these plants.

Conclusion
• There is a valuable opportunity to do the following in one stroke:
‐ Produce Renewable Energy‐ Recycle Waste into Fertilizers‐ Reduce Emissions‐ Reduce Fuel consumption‐ Solve a Waste Disposal Problem‐ Save Money‐ Preserve our Environment
What are we waiting for ?