
ELECTRONICS - Business Opportunities in India: … 2016 For updated information, please visit 9...
52
1 SEPTEMBER 2016 ELECTRONICS For updated information, please visit www.ibef.org SEPTEMBER 2016
Transcript of ELECTRONICS - Business Opportunities in India: … 2016 For updated information, please visit 9...

11SEPTEMBER 2016
ELECTRONICS
For updated information, please visit www.ibef.orgSEPTEMBER 2016
22SEPTEMBER 2016 For updated information, please visit www.ibef.org
Executive Summary………………….…….…3
Advantage India…………………….……….. 5
Market Overview and Trends……….……… 7
Porter’s Five Forces Analysis .....................19
Strategies Adopted……...............................21
Growth Drivers…………………….….……. 23
Opportunities…………………….….……… 35
Success Stories…………………….……… 40
Useful Information…………………..……... 47
ELECTRONICS
SEPTEMBER 2016

33SEPTEMBER 2016
0.41
35
FY16 FY20E
84.80
200
FY16 FY18E
100
400
FY16 FY20E
EXECUTIVE SUMMARY … (1/2)
Source: Department of Electronics & Information Technology; TRAI
Notes: DTH - Direct-to-Home (satellite television broadcasting); CAGR - Compound Annual Growth Rate, LED - Light Emitting Diode
FY161 - Data is for April 2015; FY162 - Data is as on December 2015
By 2020, the electronics market
in India is expected to increase
with a CAGR of 41.4 per cent to
USD400 billion from USD100
billion in 2016
One of the largest growing
electronics market in the world
By 2020, the LED market in
India is expected to expand to
USD35 billion from USD0.41
billion in FY161
Promotion of LED products to
boost demand
By 2018, the number of DTH
subscribers in India is expected
to rise to 200 million from 84.80
million in FY162
Digitisation to drive growth in
DTH market
For updated information, please visit www.ibef.org
CAGR: 41.4%
CAGR: 53.6%
CAGR: 204.1%
ELECTRONICS
USD Billion
2
1USD Billion
USD Billion

44SEPTEMBER 2016
9.4
16.8
2016 2020E
20
30
FY16E FY20E
For updated information, please visit www.ibef.org
EXECUTIVE SUMMARY … (2/2)
Source: Department of Electronics & Information Technology; Indian Semiconductor Association; FICCI, TechSci Research
Notes: CAGR – Compound Annual Growth Rate; E – Estimated, 20161 – Data has been projected till December 2016
By 2020, the semiconductor
design market in India is
expected to increase with a
CAGR of 29.4 per cent to
USD52.58 billion from USD14.5
billion in 2015
Rising demand and availability
of talent to boost growth in the
semiconductor design market
By 2020, the television industry
in India is expected to expand
to USD16.8 billion from USD9.4
billion in 20161
World’s third-largest TV market
By 2020, demand for telecom
equipment in India is expected
to rise to USD30 billion from
USD20 billion in FY16E
Rising teledensity in the
country is leading to higher
demand for telecom equipment
ELECTRONICS
CAGR: 29.4%
CAGR: 10.7%
CAGR: 15.6%
14.5
52.58
2015 2020EUSD Billion
USD Billion
1
USD Billion
SEPTEMBER 2016
ADVANTAGE INDIA
ELECTRONICS

66SEPTEMBER 2016
Growing demand
For updated information, please visit www.ibef.org
ADVANTAGE INDIA
Source: Corporate Catalyst India; Department of Information Technology; Make in India, TechSci Research
Notes: FDI – Foreign Direct Investment; FY – Indian Financial Year (April–March); USD – US dollar, CAGR – Compound Annual Growth Rate, E - Estimated
Growing demand
• Demand from households is set to accelerate given rising disposable incomes, changing lifestyles, and easier access to credit
• Government and corporate spending will also contribute to growth in demand
Attractive opportunities
• The electronics market is expected toexpand at a CAGR of 41.4 per centduring 2016–20
• Intended reduction in government’simport bill is likely to boost domesticelectronics manufacturers
Policy support
• 100 per cent FDI allowed in the electronicshardware manufacturing sector under theautomatic route
• Initiatives like Modified Special IncentivePackage Scheme(M-SIPS) will provide acapex subsidy of 20 – 25 per cent
• As per Make in India Initiative, ElectronicDevelopment Fund Policy has beenapproved which would rationalise aninverted duty structure
Higher Investments
• Sector has attracted strong investmentsin the form of M&As and other FDI inflows
• Companies are set to augmentinvestments in production, distributionand R&D in the next few years
• Government has received investmentproposals for USD17.5 million for whichthey intend to provide incentives underM-SIPS scheme. Applications receivedbefore July, 2020 will be considered
2016E
Market size
– USD100
billion
2020E
Market size
– USD400
billion
Advantage
India
ELECTRONICS
SEPTEMBER 2016
MARKET OVERVIEW AND TRENDS
ELECTRONICS

88SEPTEMBER 2016 For updated information, please visit www.ibef.org
THE INDIAN ELECTRONICS SECTOR IS SPLIT INTO SIX PRODUCT SEGMENTS
ELECTRONICS
Electronics
Consumer electronics
Mobile phones
TVs
Music
systems
Industrial electronics
UPS systems
SCADA
PLC
AC drive systems
Computers
Notebooks
Desktops
Servers
Communication and broadcasting
equipment
Direct-To-Home (DTH)
Set Top Box (STB)
Strategic electronics
Radars
Satellite based communication
Internal security system
Disaster management
system
Electronic components
Semiconductor devices
Cathode ray tubes
Capacitors
Picture tubes
Source: Department of Information Technology Annual Report; Corporate Catalyst India; TechSci Research
Notes: SCADA – Supervisory Control and Data Acquisition; PLC – Programmable Logic Controller
99SEPTEMBER 2016 For updated information, please visit www.ibef.org
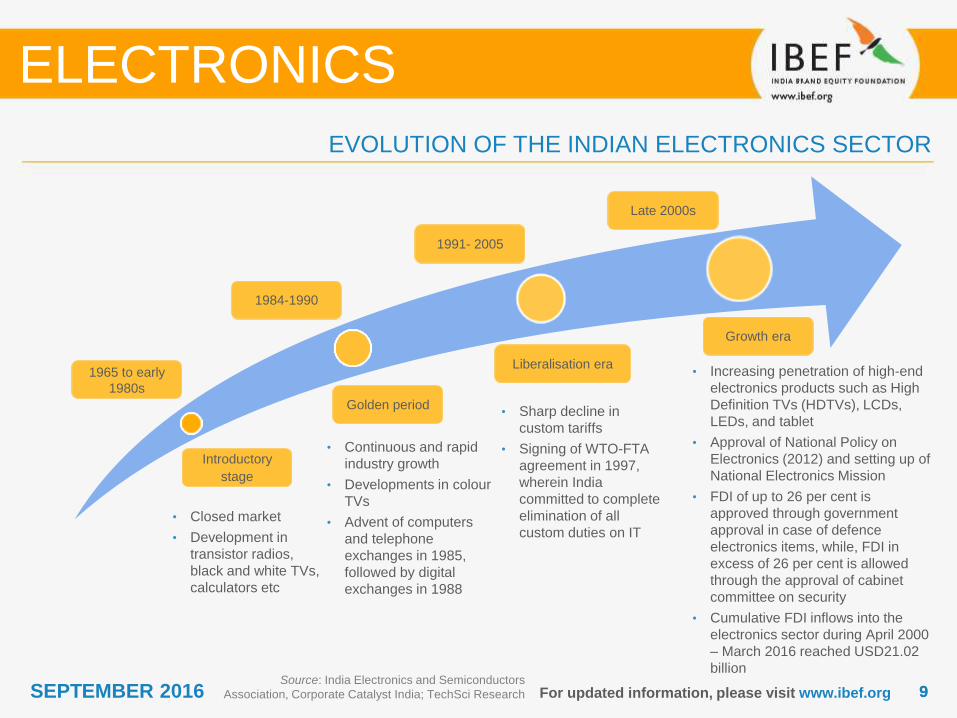
EVOLUTION OF THE INDIAN ELECTRONICS SECTOR
ELECTRONICS
Source: India Electronics and Semiconductors
Association, Corporate Catalyst India; TechSci Research
• Closed market
• Development in
transistor radios,
black and white TVs,
calculators etc
• Continuous and rapid
industry growth
• Developments in colour
TVs
• Advent of computers
and telephone
exchanges in 1985,
followed by digital
exchanges in 1988
• Sharp decline in
custom tariffs
• Signing of WTO-FTA
agreement in 1997,
wherein India
committed to complete
elimination of all
custom duties on IT
• Increasing penetration of high-end
electronics products such as High
Definition TVs (HDTVs), LCDs,
LEDs, and tablet
• Approval of National Policy on
Electronics (2012) and setting up of
National Electronics Mission
• FDI of up to 26 per cent is
approved through government
approval in case of defence
electronics items, while, FDI in
excess of 26 per cent is allowed
through the approval of cabinet
committee on security
• Cumulative FDI inflows into the
electronics sector during April 2000
– March 2016 reached USD21.02
billion
1965 to early
1980s
1984-1990
1991- 2005
Late 2000s
Introductory
stage
Golden period
Liberalisation era
Growth era
1010SEPTEMBER 2016
14.6
21.0 21.123.3
28.230.6
32.7
29.931.6
FY07 FY08 FY09 FY10 FY11 FY12 FY13 FY14 FY15
For updated information, please visit www.ibef.org
Value of electronics hardware production in India
(USD billion)
Source: Department of Information Technology Annual Reports; TechSci Research
Notes: LED – Light Emitting Diodes
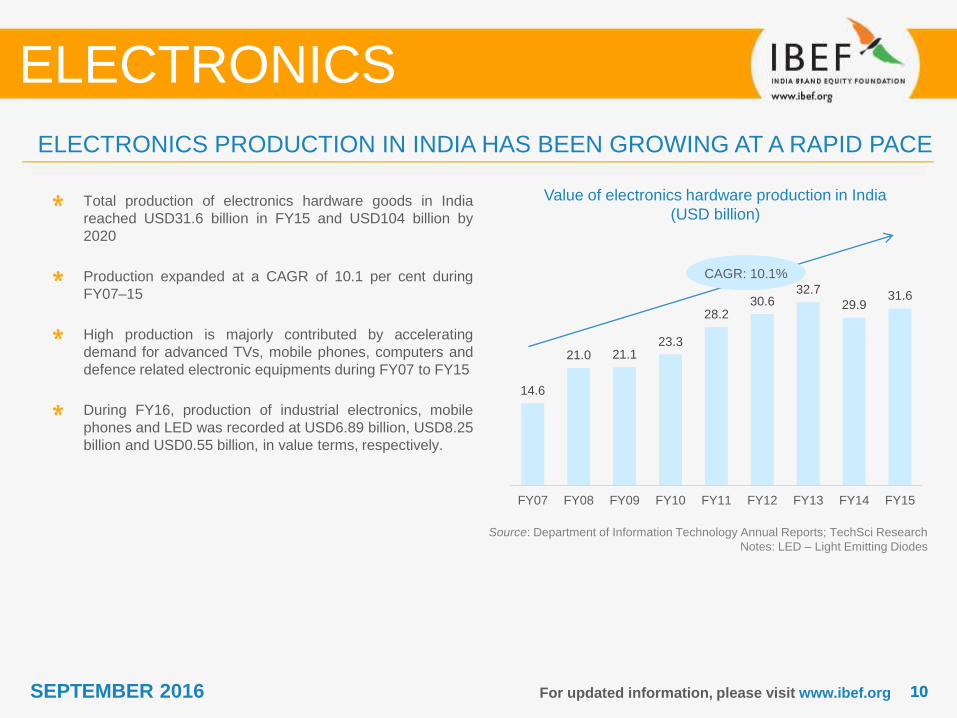
Total production of electronics hardware goods in India
reached USD31.6 billion in FY15 and USD104 billion by
2020
Production expanded at a CAGR of 10.1 per cent during
FY07–15
High production is majorly contributed by accelerating
demand for advanced TVs, mobile phones, computers and
defence related electronic equipments during FY07 to FY15
During FY16, production of industrial electronics, mobile
phones and LED was recorded at USD6.89 billion, USD8.25
billion and USD0.55 billion, in value terms, respectively.
ELECTRONICS PRODUCTION IN INDIA HAS BEEN GROWING AT A RAPID PACE
ELECTRONICS
CAGR: 10.1%

1111SEPTEMBER 2016 For updated information, please visit www.ibef.org
Shares in total production of electronic goods
(FY15)
Source: Department of Information Technology
(2014–15 Annual Report); TechSci Research
Notes: C&B – Communication and Broadcasting.
According to government estimates, Consumer Electronics
has the highest share (29.7 per cent) in the total production
of electronic goods in India. The growth in consumer
electronics over the years has been accompanied by an
increase in imports in respect of certain items like LCD/LED
TVs
The Electronic Components had witnessed a growth of about
23.74 per cent from the previous year which was supported
by the rapid growth in domestic manufacturing of electronic
components. Industrial electronics contributed 20.9 per cent
of the total output of electronics goods industry in FY15.
Industrial electronics is expected to grow at a considerable
pace with the new plans and schemes by govt.
Communication and broadcasting equipment constitutes 10
per cent of total production of electronic goods in India in
FY15. Not surprisingly, computers are a key component of
total electronics output in India (9.9 per cent in FY15); the
segment’s share is likely to go up over this decade, given
greater policy focus on encouraging computer hardware
manufacturing.
As of FY16, production of industrial electronics, mobile
phones and LEDs, in value terms, stood at around
USD6887.11 million, USD8249.31 million and USD548.43
million, respectively.
CONSUMER ELECTRONICS HAVE THE HIGHEST SHARE IN PRODUCTION
ELECTRONICS
29.7%
21.1%20.9%
10.0%
9.9%
8.3%
ConsumerElectronics
Components
IndustrialElectronics
C & B equipment
Computers
StrategicEquipment

1212SEPTEMBER 2016 For updated information, please visit www.ibef.org
Comparison in production trends of C&B
equipment and the overall electronics hardware
sector in India (USD billion)
Source: Department of Information Technology (Annual Report); TechSci Research
Notes: C&B – Communication and Broadcasting
Production (by value) of C&B equipment in India has
expanded at a CAGR of 5.1 per cent over FY07–15.
Consumer electronics have grown over the years which has
been accompanied by increase in LCD/LED TV imports and
accordingly this segment has registered about 16 per cent
growth in 2014 - 15
Growth in the hardware segment is expected to far outpace
the overall growth of electronics goods production in the
country (CAGR of 10.1 per cent over the same period)
The total computer hardware to reach USD31.6 billion in
FY15 from USD29.9 billion in FY14
Comparison of C & B equipment with other equipments… (1/2)
ELECTRONICS
14.6 21 21.123.3
28.230.6
32.7 29.9 31.6
2.14.6 5.8 6.5 7.8 8.6 8.5
4.4 3.1
FY07 FY08 FY09 FY10 FY11 FY12 FY13 FY14 FY15
Hardware C & B
Linear (Hardware ) Linear (C & B)

1313SEPTEMBER 2016
67
%
73
%
74
%
74
%
75
%
76
%
77
%
74
%
71
%
72
%
33
%
27
%
26
%
26
%
25
%
24
%
23
%
26
%
29
%
28
%
FY07 FY08 FY09 FY10 FY11 FY12 FY13 FY14 FY15 FY20F
Other Electronics Consumer Electronics
For updated information, please visit www.ibef.org
Share of Consumer Electronics in electronics
production over FY07–20F
Source: Department of Information Technology Annual Report, TechSci Research
Notes: C&B – Communication and Broadcasting,
F – Forecast
Production value of all other segments in the electronics
sector (other than Consumer Electronics) grew at a rate of
10.9 per cent over FY07-15
With growth in Consumer Electronics far outpacing those in
other segments till FY15, the former’s share in total
electronics production has doubled over FY07–12 to 8.4 per
cent.
The share of consumer electronics in the overall electronics
industry in India is likely to reach 28 per cent by FY20 with
the value of consumer electronics reaching USD29 billion
by FY20.
Comparison of Consumer Electronics with other equipments … (2/2)
ELECTRONICS
1414SEPTEMBER 2016
2.83.3
6.8
5.5
8.9 9.18.1 7.7
6.1
2.3
FY07 FY08 FY09 FY10 FY11 FY12 FY13 FY14 FY15 FY16
For updated information, please visit www.ibef.org
Electronics exports from India (USD billion)
Source: Department of Information Technology Annual Report;
Electronics and Computer Software Export Promotion Council;
TechSci Research
Notes: C&B – Communication and Broadcasting
FY161 - Data is for April-August 2015
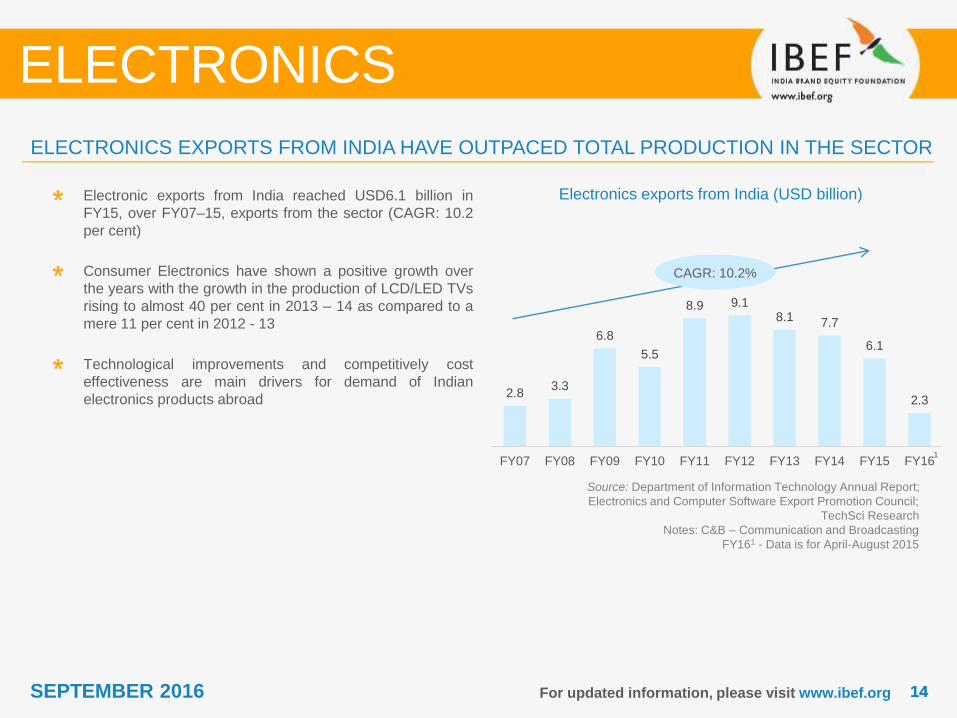
Electronic exports from India reached USD6.1 billion in
FY15, over FY07–15, exports from the sector (CAGR: 10.2
per cent)
Consumer Electronics have shown a positive growth over
the years with the growth in the production of LCD/LED TVs
rising to almost 40 per cent in 2013 – 14 as compared to a
mere 11 per cent in 2012 - 13
Technological improvements and competitively cost
effectiveness are main drivers for demand of Indian
electronics products abroad
ELECTRONICS EXPORTS FROM INDIA HAVE OUTPACED TOTAL PRODUCTION IN THE SECTOR
ELECTRONICS
CAGR: 10.2%
1

1515SEPTEMBER 2016 For updated information, please visit www.ibef.org
Source: Company websites; Dataquest; Corporate Catalyst India; TechSci Research
Notes: DVD – Digital Video Disc; AC – Air Conditioner; TV – Television; PC – Personal Computer
KEY PLAYERS IN THE ELECTRONICS SECTOR … (1/2)
Company Business description
• Established to meet specialised needs of Indian defence services
• Focuses on contract manufacturing, design and manufacturing services, software development and quality
assurance, has got plans to venture into solar energy
• Third largest consumer durables manufacturer in India after LG and Samsung, holds one fourth of the
consumer durables market in India
• Manufactures and markets TVs, DVD players, microwave ovens, refrigerators, washing machines, ACs and
power backup solutions
• Second largest leader in consumer durables after Samsung
• Manufactures TVs, audio-visual solutions, computers, mobile phones, refrigerators, washing machines,
microwave ovens, vacuum cleaners and Ac’s
• Largest player in the consumer durables market, provides employment to around 8000 people
• Manufactures TVs, home theatre systems, DVD players, mobile phones, digital cameras and camcorders,
refrigerators, ACs, washing machines, microwave ovens and computers, leads smart phone segment
• Leading IT hardware and software provider, extensive global offshore infrastructure and offices in 31 countries
• Manufactures and markets PCs, PC servers, storage solutions, display products and other electronic products
ELECTRONICS
1616SEPTEMBER 2016 For updated information, please visit www.ibef.org
Source: Company websites; Dataquest; Corporate Catalyst India; TechSci Research
Notes: CRT – Cathode Ray Tube
KEY PLAYERS IN THE ELECTRONICS SECTOR … (2/2)
Company Business description
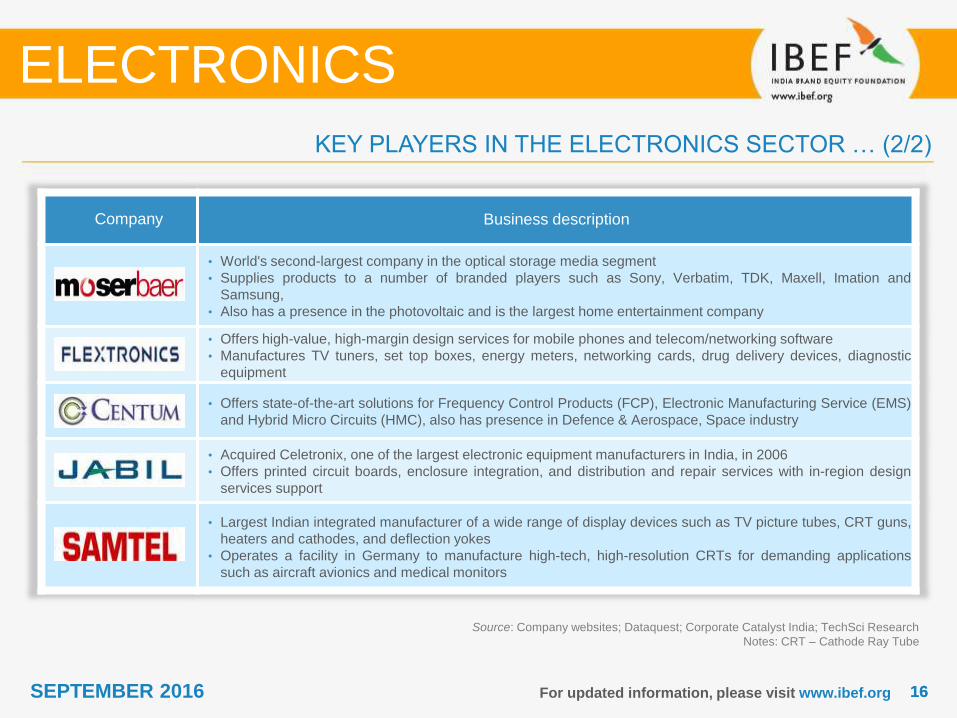
• World's second-largest company in the optical storage media segment
• Supplies products to a number of branded players such as Sony, Verbatim, TDK, Maxell, Imation and
Samsung,
• Also has a presence in the photovoltaic and is the largest home entertainment company
• Offers high-value, high-margin design services for mobile phones and telecom/networking software
• Manufactures TV tuners, set top boxes, energy meters, networking cards, drug delivery devices, diagnostic
equipment
• Offers state-of-the-art solutions for Frequency Control Products (FCP), Electronic Manufacturing Service (EMS)
and Hybrid Micro Circuits (HMC), also has presence in Defence & Aerospace, Space industry
• Acquired Celetronix, one of the largest electronic equipment manufacturers in India, in 2006
• Offers printed circuit boards, enclosure integration, and distribution and repair services with in-region design
services support
• Largest Indian integrated manufacturer of a wide range of display devices such as TV picture tubes, CRT guns,
heaters and cathodes, and deflection yokes
• Operates a facility in Germany to manufacture high-tech, high-resolution CRTs for demanding applications
such as aircraft avionics and medical monitors
ELECTRONICS
1717SEPTEMBER 2016 For updated information, please visit www.ibef.org
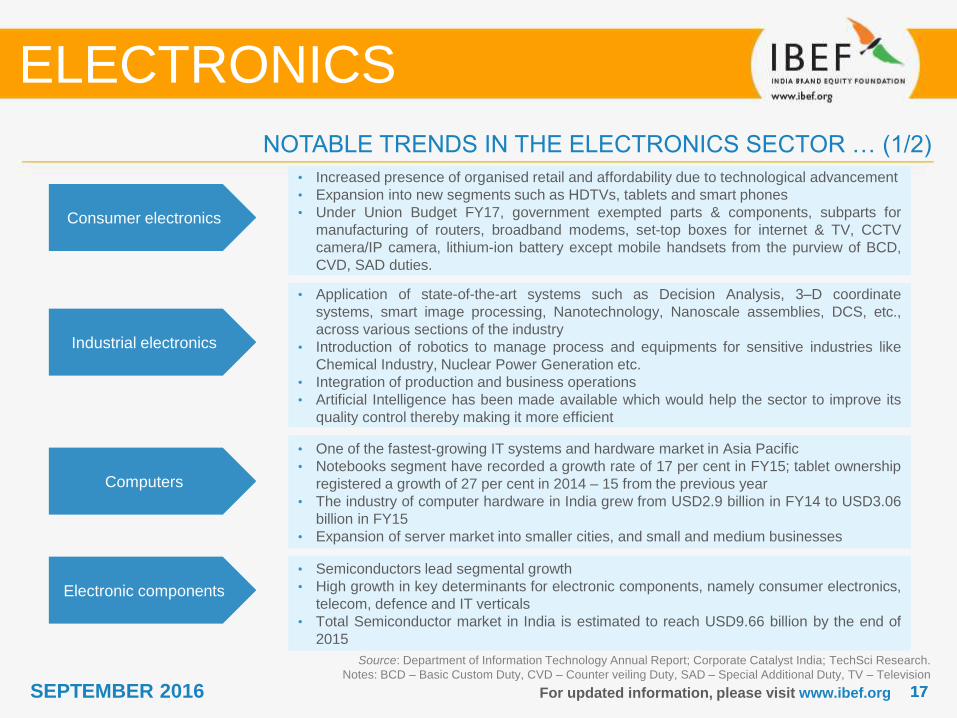
Consumer electronics
• Increased presence of organised retail and affordability due to technological advancement
• Expansion into new segments such as HDTVs, tablets and smart phones
• Under Union Budget FY17, government exempted parts & components, subparts for
manufacturing of routers, broadband modems, set-top boxes for internet & TV, CCTV
camera/IP camera, lithium-ion battery except mobile handsets from the purview of BCD,
CVD, SAD duties.
Industrial electronics
• Application of state-of-the-art systems such as Decision Analysis, 3–D coordinate
systems, smart image processing, Nanotechnology, Nanoscale assemblies, DCS, etc.,
across various sections of the industry
• Introduction of robotics to manage process and equipments for sensitive industries like
Chemical Industry, Nuclear Power Generation etc.
• Integration of production and business operations
• Artificial Intelligence has been made available which would help the sector to improve its
quality control thereby making it more efficient
Computers
• One of the fastest-growing IT systems and hardware market in Asia Pacific
• Notebooks segment have recorded a growth rate of 17 per cent in FY15; tablet ownership
registered a growth of 27 per cent in 2014 – 15 from the previous year
• The industry of computer hardware in India grew from USD2.9 billion in FY14 to USD3.06
billion in FY15
• Expansion of server market into smaller cities, and small and medium businesses
Source: Department of Information Technology Annual Report; Corporate Catalyst India; TechSci Research.
Notes: BCD – Basic Custom Duty, CVD – Counter veiling Duty, SAD – Special Additional Duty, TV – Television
NOTABLE TRENDS IN THE ELECTRONICS SECTOR … (1/2)
ELECTRONICS
Electronic components
• Semiconductors lead segmental growth
• High growth in key determinants for electronic components, namely consumer electronics,
telecom, defence and IT verticals
• Total Semiconductor market in India is estimated to reach USD9.66 billion by the end of
2015

1818SEPTEMBER 2016 For updated information, please visit www.ibef.org
Strategic electronics
• The production in strategic electronic segment in India increased from USD2.29 billion in
FY14 to USD2.57 billion in FY15
• Economic growth and low costs are likely to provide impetus to aerospace market
• Nuclear power to play a large role in India’s energy security needs
• Companies such as Bharat Electronics Limited, Hindustan Aeronautics Limited,
Electronics Corporation of India Limited, Bharat Dynamics Limited dominated this segment
C&B equipment's
• Growing broadband subscriber base
• As on 30th April, 2016, the total number of telephone subscribers in the country was
1,059.29 million, covering wireless subscriber base of 1,034.25 million and wireline
subscriber base of 25.04 million, respectively
Source: Department of Information Technology Annual Report; Corporate Catalyst India; TechSci Research, TRAI
Notes: C&B – Communication and Broadcasting; DTH – Direct-to-Home (Satellite Television Broadcasting)
NOTABLE TRENDS IN THE ELECTRONICS SECTOR … (2/2)
ELECTRONICS
E – Waste Management • Increasing Adoption of Electronic Waste Management Scheme supported by the
regulatory framework has improved the electronics sector to a large extent
Major Contributors to
Employment
• Major segments such as Consumer Electronics, Telecom Equipment, and IT Hardware
can be major contributors to employment
Increasing Consumption
and potential for
production
• Increasing PFCE on Recreational and Educational services, and Home appliances are
expected to contribute to the rise in consumption and production of Electronics and IT
Hardware.
• Growth of 17 per cent is expected with major contributors being Consumer Electronics,
Telecom and computers

SEPTEMBER 2016
PORTER FIVE FORCES ANALYSIS
ELECTRONICS

2020SEPTEMBER 2016 For updated information, please visit www.ibef.org
PORTERS’ FIVE FORCES ANALYSIS
Source: TechSci Research
• Competitive rivalry is quite high in this sector, as players use
innovation and product differentiation to beat peers
• Each player adopts different strategies to capture market share; for
example, one player innovates while another diversifies, thus
intensifying the rivalry in the sector
Threat of New Entrants Substitute Products
Bargaining Power of Suppliers Bargaining Power of Customers
• Threat is low due to capital-
intensive nature of the industry
• Evolving technology, brand
loyalty block entry
• Low bargaining power of
suppliers, as product
differentiation is less
• Low switching costs for
customers
• High as buyers possess
considerable product
information these days, which
helps in comparison
• Availability of similar options
• Threat is low because there is
no substitute for electronics
• Threat is present within the
industry due to product
innovation by peers
Competitive Rivalry
Competitive
Rivalry
(High)
Threat of New
Entrants
(Low)
Substitute
Products
(Medium)
Bargaining
Power of
Customers
(High)
Bargaining
Power of
Suppliers
(Low)
ELECTRONICS

SEPTEMBER 2016
STRATEGIES ADOPTED
ELECTRONICS

2222SEPTEMBER 2016 For updated information, please visit www.ibef.org
STRATEGIES ADOPTED
ELECTRONICS
Source: A report by Corporate Catalyst India (CCI) on ‘Electronics Industry in India’; TechSci Research
• Companies increasingly spending on R&D and stepping up innovation
• Customers frequently change to new-generation products due to low switching costs; thus,
companies with newer technologies gain significant market share
• With HD TVs entering the market, TVs working on CRT (Cathode Ray Tube) lost their
market share
• Most companies are now diversifying into other profitable segments; for example,
Samsung is focussing heavily on mobile phone manufacturing, while earlier it focussed
more on consumer electronics
• Videocon is also foraying into other segments such as TV Network and mobile phone
manufacturing
• Most electronics companies, especially consumer electronics, are shifting towards popular
ad campaigns to boost their sales
• Most companies in India are embracing aggressive social strategies (e.g., by going online)
to target young audience and build brand loyalty among them
• Most companies are forming strategic alliances and JVs for mutual benefits
• LG and Sun Microsystems are jointly developing Java platforms to enable LG phones and
TVs
• LG and Siemens have collaborated to develop standard solutions for air conditioners
Innovation
Diversification
Marketing strategy
JVs & partnerships
• Manufacturing technologies are exchanged with other countries for better knowledge of
innovations
• Being competitive on global platform is key to sustainability and growth for the sector
Outsourcing of
technology

SEPTEMBER 2016
GROWTH DRIVERS
ELECTRONICS

2424SEPTEMBER 2016
STRONG DEMAND AND POLICY SUPPORT ARE DRIVING INVESTMENTS
For updated information, please visit www.ibef.org
Source: TechSci Research
Notes: EHTP – Electronic Hardware Technology Park; SEZ – Special Economic Zone;
FDI – Foreign Direct Investment; R&D – Research and Development
ELECTRONICS
Growing demandGrowing demand
Higher real
disposable
incomes, easy
consumer credit
Falling prices,
increasing
penetration
Growing
consumer and
industrial base
Policy supportStrong
government
support
Policy support
Setting up of EHTPs, SEZs, favourable FDI
climate
Increasing liberalisation,
tariff relaxation
National Policy on
Electronics and
National Electronics
Mission
Innovation
Expanding
production and
distribution
facilities in India
Increased R&D
activity
Providing support
to global projects
from India
Resulting
Increasing
investments
Inflow of FDI in
sector
Increasing
domestic
investment
Expansion by
existing big
companies in the
sector
DrivingInviting

2525SEPTEMBER 2016 For updated information, please visit www.ibef.org
Rising per capita income in India (USD)
Source: IMF, World Bank, TechSci Research
Note: F – IMF Forecast
Increase in discretionary income and credit availability has
boosted demand for consumer durables
The government is one of the biggest consumers of the
sector and leads the corporate spend on electronics; this is
not surprising given that electronics facilitates e-
governance, developmental schemes and initiatives
launched by the government
Strong demand and favourable investment climate in the
sector are attracting investments in R&D as well as
manufacturing
Increasing demand for defence equipments has boosted the
production of electronics goods up to a considerable level
Electronic Manufacturing Services and R&D based exports
also drives the market. The increased value – addition
would further increase the demand for sales, production,
after – sales support and services. This would trigger the
demand for skilled human resources in the country
Rapid urbanisation have unravelled new markets for
consumer goods; easy financing options have made
consumer goods affordable
KEY GROWTH DRIVERS ARE RISING INCOMES, CREDIT AVAILABILITY AND GOVERNMENT SPENDING
ELECTRONICS
13
87
.9
14
55
.7
1444.3 14
56
.2
15
76
.8
15
81
.6
17
47
.5
18
74
.9
2026.7
22
07
.6
24
02
.4
0
500
1000
1500
2000
2500
3000
-2.0%
0.0%
2.0%
4.0%
6.0%
8.0%
10.0%
12.0%
GDP per capita, current prices Growth Rate
2626SEPTEMBER 2016 For updated information, please visit www.ibef.org
Source: Department of Commerce, Government of India;
Department of Electronics and Information Technology; TechSci Research
Notes: FDI – Foreign Direct Investment; SAD – Special Additional Duty of Customs,
R&D – Research & Development
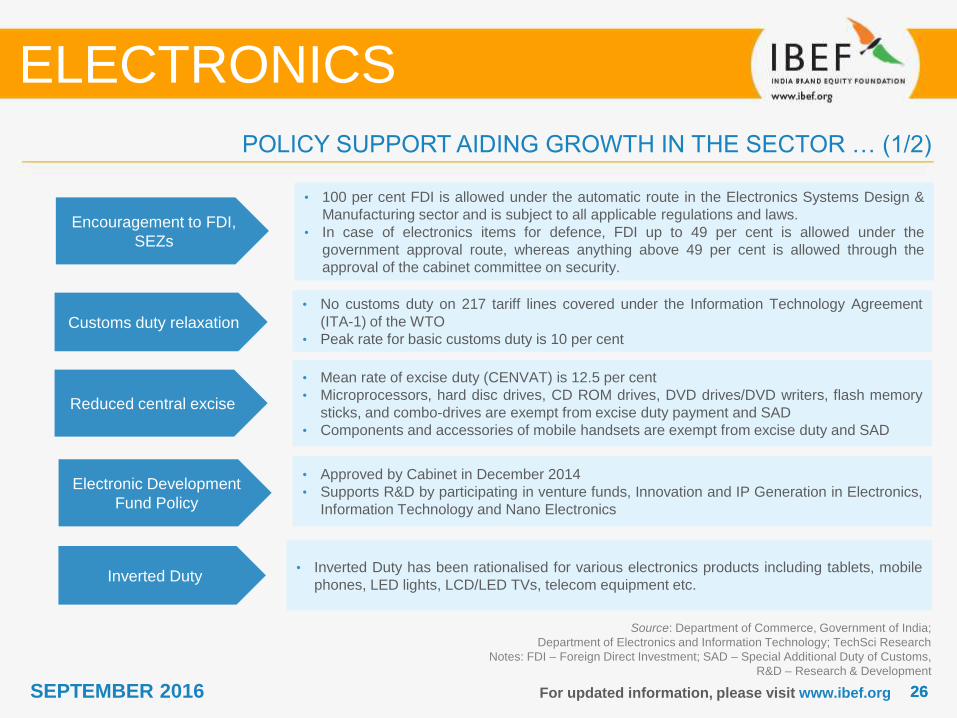
POLICY SUPPORT AIDING GROWTH IN THE SECTOR … (1/2)
ELECTRONICS
Encouragement to FDI,
SEZs
• 100 per cent FDI is allowed under the automatic route in the Electronics Systems Design &
Manufacturing sector and is subject to all applicable regulations and laws.
• In case of electronics items for defence, FDI up to 49 per cent is allowed under the
government approval route, whereas anything above 49 per cent is allowed through the
approval of the cabinet committee on security.
Customs duty relaxation
• No customs duty on 217 tariff lines covered under the Information Technology Agreement
(ITA-1) of the WTO
• Peak rate for basic customs duty is 10 per cent
Reduced central excise
• Mean rate of excise duty (CENVAT) is 12.5 per cent
• Microprocessors, hard disc drives, CD ROM drives, DVD drives/DVD writers, flash memory
sticks, and combo-drives are exempt from excise duty payment and SAD
• Components and accessories of mobile handsets are exempt from excise duty and SAD
Electronic Development
Fund Policy
• Approved by Cabinet in December 2014
• Supports R&D by participating in venture funds, Innovation and IP Generation in Electronics,
Information Technology and Nano Electronics
Inverted Duty• Inverted Duty has been rationalised for various electronics products including tablets, mobile
phones, LED lights, LCD/LED TVs, telecom equipment etc.

2727SEPTEMBER 2016 For updated information, please visit www.ibef.org
EPCG, EHTP schemes• EPCG allows import of electronic capital goods without paying any customs duty
• EHTP provides benefits, such as duty waivers and tax incentives, to companies which
replace certain imports with local manufacturing
Intellectual Property
Rights
• Intellectual Property Rights (IPR) are a key determinant of progress in R&D and innovation
in the electronics sector
• GOI has amended relevant IPR-related acts (like the Copyright Act, Trademark Act, New
Designs Act) from time to time to help spruce up innovation and new technologies in the
sector
Source: Department of Commerce, Government of India; Department of Information Technology Annual Report; TechSci Research
Notes: EPCG – Export Promotion Capital Goods Scheme; EHTP – Electronic Hardware Technology Park Scheme;
IPR – Intellectual Property Rights; GOI – Government of India
POLICY SUPPORT AIDING GROWTH IN THE SECTOR … (2/2)
ELECTRONICS
MSIPS
• The Union Cabinet gave its green signal to the Modified Special Incentive Package
Scheme (MSIPS) under which the central government will be offering up to USD1.7 billion
in benefits to the electronics sector in the upcoming five years
• The scheme was notified on July 27, 2015 to attract investments in electronics
manufacturing
• Incentives would be provided under MSIPS on the investment proposals being received.
Till September 2015, investments of USD17.5 billion has been received
Electronic
Manufacturing Cluster
(EMC) Scheme
• The Scheme attracts investments for the Electronics Systems Design and
Manufacturing(ESDM) Sector by supporting the creation of world – class infrastructure
• The scheme provides support for setting up Greenfield and Brownfield EMCs in the form
of grant – in – aid only
• As of July 2015, investments of USD13.96 million for 2 EMCs have been approved. Total
number of EMCs approved in the last 1 year have become 21; 16 for Greenfield EMCs, 3
for Brownfield EMCs in 7 states
• As of December 2015, investments of USD18.67 billion has been allocated in the
electronics manufacturing sector

2828SEPTEMBER 2016 For updated information, please visit www.ibef.org
Magnetic Heads• BCD of 7.50/10.00 per cent would be imposed on ceramic/magnetic cartridges and stylus,
level meters/level indicators/ tuning indicators/ peak level meters/ battery meter/VC
meters/ tape counters, antennas, EHT cables, tone arms, electron guns
Road Construction
Machinery
• CVD of 12.50 per cent would be charged on specified machinery required for construction
of roads
Source: Department of Electronics and Information Technology (DeitY), Union Budget 2016 – 17, TechSci Research,
Notes: BCD – Basic Custom Duty, CVD – Counter veiling Duty, SAD – Special Additional Duty,
VoIP – Voice over Internet Protocol, PCB – Printed Circuit Board
Union Budget 2016 – 17
ELECTRONICS
Mobile Phones
• BCD of 10 per cent, CVD of 12.50 per cent and SAD of 4 per cent will be imposed on
charger/adapter, battery & wired headsets/speakers for manufacture of mobile phones
• Whereas, no duty will be charged on inputs, parts & components, subparts for
manufacturing of charger/adapter, battery and wired headsets/speakers of mobile phones
• SAD of 2 per cent on populated PCB for manufacturing of mobile phones
Telecommunication
Equipment
• BCD of 10 per cent on specified telecommunication equipment (Soft switches and VoIP
equipment namely VoIP phones, media gateways, etc.
• BCD of 10 per cent on preform silica to manufacture telecom grade optical fibre/cables
Tablet & Desktop
Computers/Laptops
• SAD of 4 per cent on populated PCBs for manufacture of personal computers (laptop or
desktop)
• SAD of 2 per cent on populated PCB for manufacture of tablet computers

2929SEPTEMBER 2016 For updated information, please visit www.ibef.org
Electrical Equipments
• Exemption of BCD & SAD from machinery, electrical equipment & instrument and parts,
thereof (except PCBs) for semiconductor wafer fabrication/LCD fabrication units
• Machinery, electrical equipment and instrument and parts thereof (except populated
PCBs) imported for Assembly, Test, Marking and Packaging of semiconductor chips
(ATMP) would be exempted from BCD & SAD
Source: Department of Electronics and Information Technology (DeitY); TechSci Research,
Notes: BCD – Basic Custom Duty, CVD – Counter veiling Duty, SAD – Special Additional Duty, PCB – Printed Circuit Board
ELECTRONICS
Capital Goods
• Exemption of BCD on specified capital goods and inputs used in manufacturing of Micro
fuses, sub-miniature fuses, resettable fuses and thermal fuses
• CVD would be exempted from capital goods/spare: raw materials, parts, material handling
equipment and consumable for repairs of ocean-going vessels by a ship repair unit
Medical Equipments
• All type of duties will be exempted from disposable sterilized dialyzer and micro barrier of
artificial kidney
• Exemption of BCD from Medical Use Fission Molybdenum-99 imported by Board of
Radiation and Isotope Technology (BRIT) for manufacture of radio pharmaceuticals
Digital Electronics
• All duties exempted from parts and components, subparts for manufacture of routers,
broadband Modems, Set-top boxes for gaining access to internet, set top boxes for TV,
digital video recorder (DVR) / network video recorder (NVR), CCTV camera / IP camera,
lithium ion battery, other than those for mobile handsets
Union Budget 2016 – 17
3030SEPTEMBER 2016 For updated information, please visit www.ibef.org
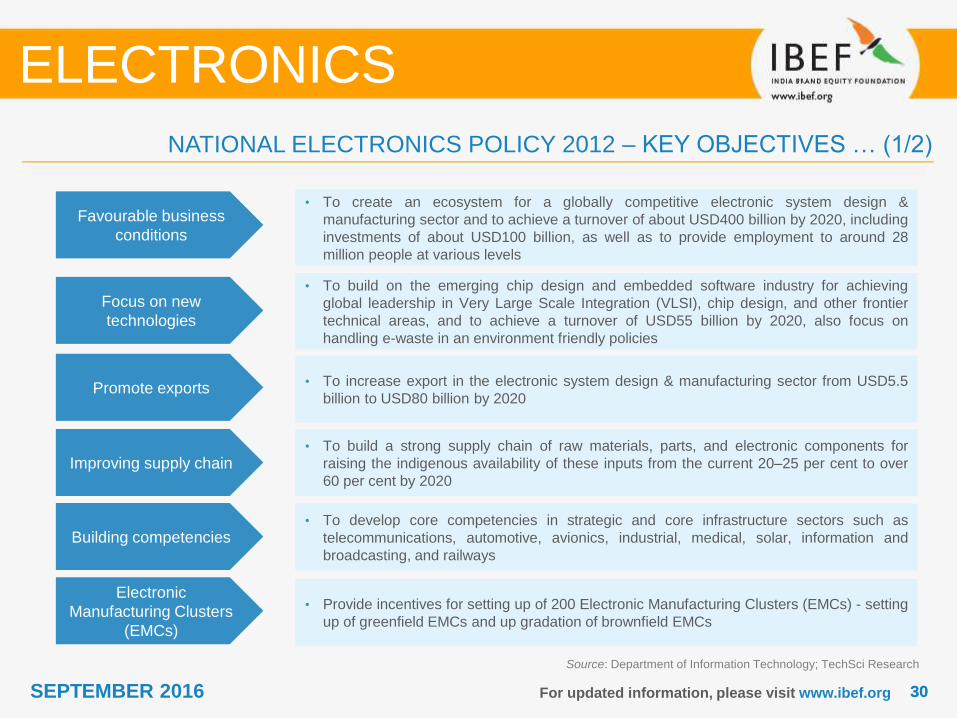
Favourable business
conditions
• To create an ecosystem for a globally competitive electronic system design &
manufacturing sector and to achieve a turnover of about USD400 billion by 2020, including
investments of about USD100 billion, as well as to provide employment to around 28
million people at various levels
Focus on new
technologies
• To build on the emerging chip design and embedded software industry for achieving
global leadership in Very Large Scale Integration (VLSI), chip design, and other frontier
technical areas, and to achieve a turnover of USD55 billion by 2020, also focus on
handling e-waste in an environment friendly policies
Source: Department of Information Technology; TechSci Research
NATIONAL ELECTRONICS POLICY 2012 – KEY OBJECTIVES … (1/2)
ELECTRONICS
Promote exports• To increase export in the electronic system design & manufacturing sector from USD5.5
billion to USD80 billion by 2020
Improving supply chain• To build a strong supply chain of raw materials, parts, and electronic components for
raising the indigenous availability of these inputs from the current 20–25 per cent to over
60 per cent by 2020
Building competencies• To develop core competencies in strategic and core infrastructure sectors such as
telecommunications, automotive, avionics, industrial, medical, solar, information and
broadcasting, and railways
Electronic
Manufacturing Clusters
(EMCs)
• Provide incentives for setting up of 200 Electronic Manufacturing Clusters (EMCs) - setting
up of greenfield EMCs and up gradation of brownfield EMCs

3131SEPTEMBER 2016 For updated information, please visit www.ibef.org
Incentives provided by government to attract investors
Source: Department of Information Technology; TechSci Research
ELECTRONICS
NATIONAL ELECTRONICS POLICY 2012 – KEY OBJECTIVES … (2/2)
Strategies
Favorable eco -system
Promoting exports
Focus on Human
resource development
Developing and
mandating electronics standards
Focus on strategic
electronics
Focus on innovation and R&D
To provide subsidy of up to USD10 million per 100
acres of project in electronics manufacturing
clusters
Reimbursement of excise duties for capital
equipment in non-SEZ units
No central taxes and duties for 10 years in high-
tech facilities such as semiconductor fabricating
units
Preferential market access to domestically
manufactured electronic products
Various export incentives such as 2–5 per cent of
duty credit on exports of different products
Create a completely secure cyber ecosystem in the
country
Implementation of e-waste (Management and
Handling) Rules, 2011
Moreover, the government proposed an
Electronics Development Fund worth USD2 billion
to promote innovation, R&D, product
commercialisation, and nano–electronics

3232SEPTEMBER 2016 For updated information, please visit www.ibef.org
Source: Department of Industrial Policy and Promotion (DIPP); TechSci Research
Notes: FDI – Foreign Direct Investment; FY – India Financial Year (April – March)1 – Includes computer software & hardware sector inflows
Cumulative FDI inflows into the electronics sector, including computer hardware and software, increased at a CAGR of
13.56 per cent, with the value increasing from USD9.8 billion in FY10 to USD21.02 billion in FY16
Demand growth, supply advantages, and policy support have been instrumental in attracting FDI
Cumulative FDI inflows to the electronics sector
(USD billion) (FY16)Cumulative FDI inflows to electronics sector
(combined)1 (USD billion) (FY16)
THE ELECTRONICS SECTOR IN INDIA HAS ATTRACTED STRONG FDI INFLOWS
ELECTRONICS
0.80.89
1.16 1.19
1.34
1.49
1.64
FY10 FY11 FY12 FY13 FY14 FY15 FY16
9.810.7 11.2 11.69
12.82
17.29
21.02
FY10 FY11 FY12 FY13 FY14 FY15 FY16
3333SEPTEMBER 2016
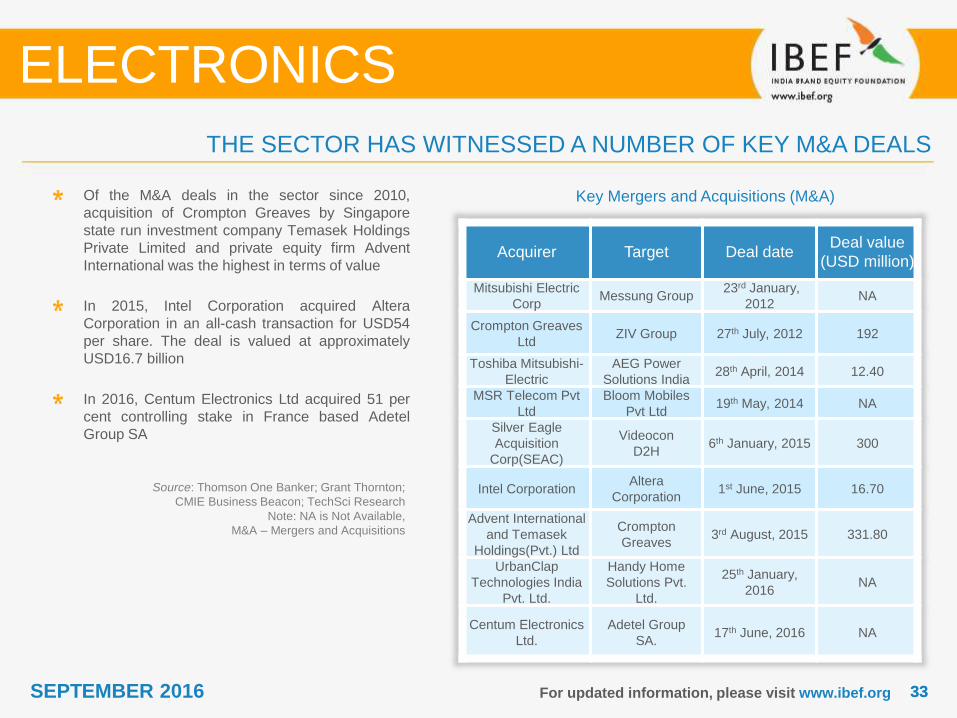
Key Mergers and Acquisitions (M&A)
Source: Thomson One Banker; Grant Thornton;
CMIE Business Beacon; TechSci Research
Note: NA is Not Available,
M&A – Mergers and Acquisitions
Of the M&A deals in the sector since 2010,
acquisition of Crompton Greaves by Singapore
state run investment company Temasek Holdings
Private Limited and private equity firm Advent
International was the highest in terms of value
In 2015, Intel Corporation acquired Altera
Corporation in an all-cash transaction for USD54
per share. The deal is valued at approximately
USD16.7 billion
In 2016, Centum Electronics Ltd acquired 51 per
cent controlling stake in France based Adetel
Group SA
Acquirer Target Deal dateDeal value
(USD million)
Mitsubishi Electric
CorpMessung Group
23rd January,
2012NA
Crompton Greaves
LtdZIV Group 27th July, 2012 192
Toshiba Mitsubishi-
Electric
AEG Power
Solutions India28th April, 2014 12.40
MSR Telecom Pvt
Ltd
Bloom Mobiles
Pvt Ltd19th May, 2014 NA
Silver Eagle
Acquisition
Corp(SEAC)
Videocon
D2H6th January, 2015 300
Intel CorporationAltera
Corporation1st June, 2015 16.70
Advent International
and Temasek
Holdings(Pvt.) Ltd
Crompton
Greaves3rd August, 2015 331.80
UrbanClap
Technologies India
Pvt. Ltd.
Handy Home
Solutions Pvt.
Ltd.
25th January,
2016NA
Centum Electronics
Ltd.
Adetel Group
SA.17th June, 2016 NA
ELECTRONICS
THE SECTOR HAS WITNESSED A NUMBER OF KEY M&A DEALS
For updated information, please visit www.ibef.org
3434SEPTEMBER 2016
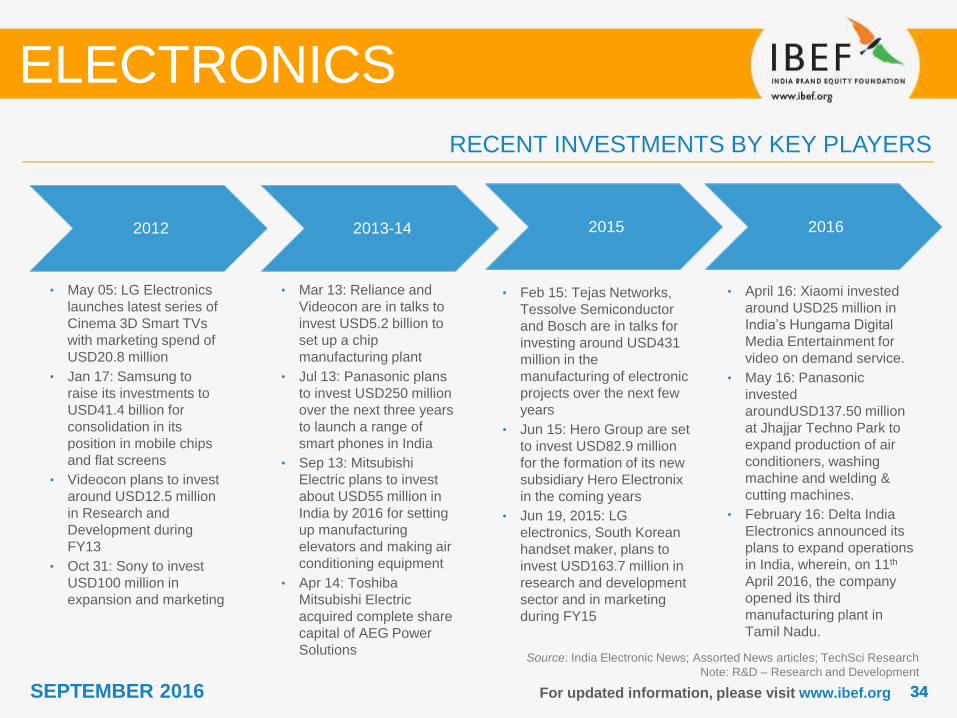
2012 2013-14
• May 05: LG Electronics
launches latest series of
Cinema 3D Smart TVs
with marketing spend of
USD20.8 million
• Jan 17: Samsung to
raise its investments to
USD41.4 billion for
consolidation in its
position in mobile chips
and flat screens
• Videocon plans to invest
around USD12.5 million
in Research and
Development during
FY13
• Oct 31: Sony to invest
USD100 million in
expansion and marketing
• Mar 13: Reliance and
Videocon are in talks to
invest USD5.2 billion to
set up a chip
manufacturing plant
• Jul 13: Panasonic plans
to invest USD250 million
over the next three years
to launch a range of
smart phones in India
• Sep 13: Mitsubishi
Electric plans to invest
about USD55 million in
India by 2016 for setting
up manufacturing
elevators and making air
conditioning equipment
• Apr 14: Toshiba
Mitsubishi Electric
acquired complete share
capital of AEG Power
Solutions
2015
• Feb 15: Tejas Networks,
Tessolve Semiconductor
and Bosch are in talks for
investing around USD431
million in the
manufacturing of electronic
projects over the next few
years
• Jun 15: Hero Group are set
to invest USD82.9 million
for the formation of its new
subsidiary Hero Electronix
in the coming years
• Jun 19, 2015: LG
electronics, South Korean
handset maker, plans to
invest USD163.7 million in
research and development
sector and in marketing
during FY15
ELECTRONICS
Source: India Electronic News; Assorted News articles; TechSci Research
Note: R&D – Research and Development
RECENT INVESTMENTS BY KEY PLAYERS
For updated information, please visit www.ibef.org
2016
• April 16: Xiaomi invested
around USD25 million in
India’s Hungama Digital
Media Entertainment for
video on demand service.
• May 16: Panasonic
invested
aroundUSD137.50 million
at Jhajjar Techno Park to
expand production of air
conditioners, washing
machine and welding &
cutting machines.
• February 16: Delta India
Electronics announced its
plans to expand operations
in India, wherein, on 11th
April 2016, the company
opened its third
manufacturing plant in
Tamil Nadu.

SEPTEMBER 2016
OPPORTUNITIES
ELECTRONICS
3636SEPTEMBER 2016 For updated information, please visit www.ibef.org
Source: Department of Information Technology Annual Reports; A Report by Corporate Catalyst India (CCI) on
‘Electronics Industry in India’; Dataquest India; Electronics Industries Association of India, TechSci Research
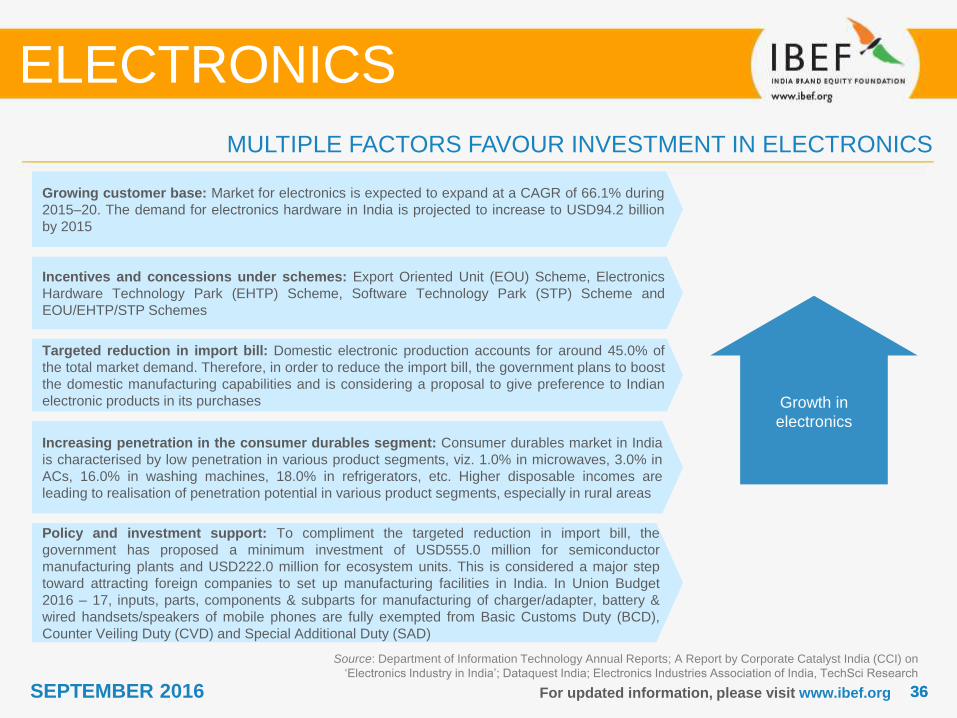
MULTIPLE FACTORS FAVOUR INVESTMENT IN ELECTRONICS
ELECTRONICS
Growing customer base: Market for electronics is expected to expand at a CAGR of 66.1% during
2015–20. The demand for electronics hardware in India is projected to increase to USD94.2 billion
by 2015
Targeted reduction in import bill: Domestic electronic production accounts for around 45.0% of
the total market demand. Therefore, in order to reduce the import bill, the government plans to boost
the domestic manufacturing capabilities and is considering a proposal to give preference to Indian
electronic products in its purchases
Increasing penetration in the consumer durables segment: Consumer durables market in India
is characterised by low penetration in various product segments, viz. 1.0% in microwaves, 3.0% in
ACs, 16.0% in washing machines, 18.0% in refrigerators, etc. Higher disposable incomes are
leading to realisation of penetration potential in various product segments, especially in rural areas
Policy and investment support: To compliment the targeted reduction in import bill, the
government has proposed a minimum investment of USD555.0 million for semiconductor
manufacturing plants and USD222.0 million for ecosystem units. This is considered a major step
toward attracting foreign companies to set up manufacturing facilities in India. In Union Budget
2016 – 17, inputs, parts, components & subparts for manufacturing of charger/adapter, battery &
wired handsets/speakers of mobile phones are fully exempted from Basic Customs Duty (BCD),
Counter Veiling Duty (CVD) and Special Additional Duty (SAD)
Growth in
electronics
Incentives and concessions under schemes: Export Oriented Unit (EOU) Scheme, Electronics
Hardware Technology Park (EHTP) Scheme, Software Technology Park (STP) Scheme and
EOU/EHTP/STP Schemes
3737SEPTEMBER 2016
84.80
200
FY16 FY18E
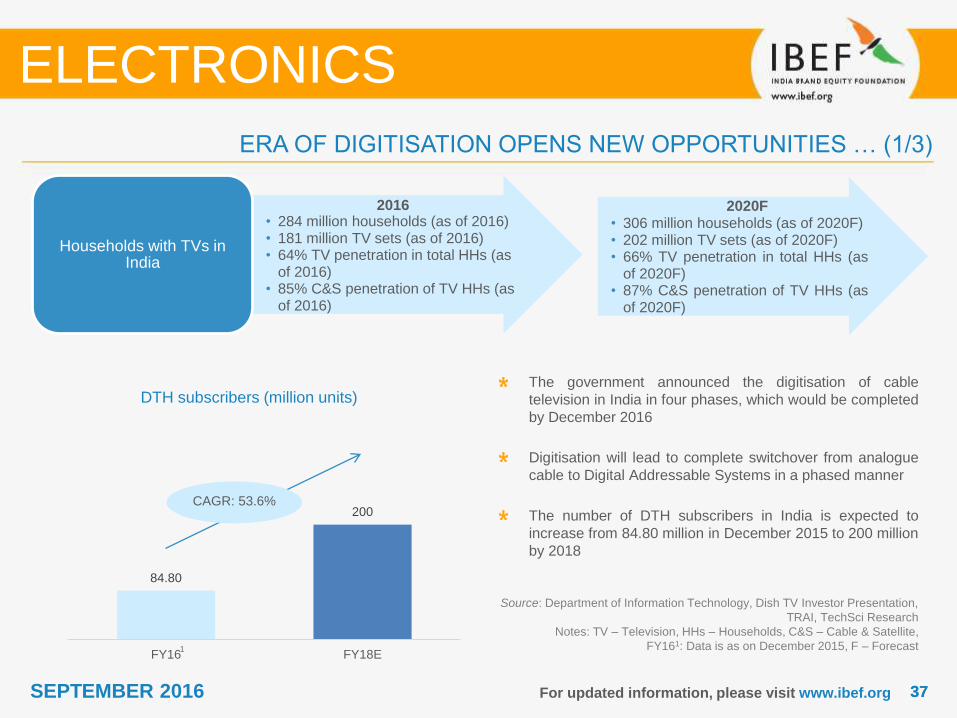
• 306 million households (as of 2020F)• 202 million TV sets (as of 2020F)• 66% TV penetration in total HHs (as
of 2020F)• 87% C&S penetration of TV HHs (as
of 2020F)
For updated information, please visit www.ibef.org
Source: Department of Information Technology, Dish TV Investor Presentation,
TRAI, TechSci Research
Notes: TV – Television, HHs – Households, C&S – Cable & Satellite,
FY161: Data is as on December 2015, F – Forecast
ERA OF DIGITISATION OPENS NEW OPPORTUNITIES … (1/3)
ELECTRONICS
• 284 million households (as of 2016)• 181 million TV sets (as of 2016)• 64% TV penetration in total HHs (as
of 2016)• 85% C&S penetration of TV HHs (as
of 2016)
Households with TVs in India
The government announced the digitisation of cable
television in India in four phases, which would be completed
by December 2016
Digitisation will lead to complete switchover from analogue
cable to Digital Addressable Systems in a phased manner
The number of DTH subscribers in India is expected to
increase from 84.80 million in December 2015 to 200 million
by 2018
DTH subscribers (million units)
CAGR: 53.6%
2016 2020F
1

3838SEPTEMBER 2016
26%
21%
20%
16%
12%
5%Dish TV
TATA Sky
Airtel Digital
Videocon D2h
Sun TV
Big TV
For updated information, please visit www.ibef.org
Source: Dish TV, TechSci Research
Dish TV accounted for the largest share in the DTH market
with 26 per cent in FY16, followed by Tata Sky and Airtel
Digital with shares of 21 per cent and 20 per cent, during the
same year, respectively, based on gross subscribers.
Dish TV is considered to be the first company to achieve a
break-even point in the Indian DTH market
Market Share of Leading Companies (FY16)
ELECTRONICS
ERA OF DIGITISATION OPENS NEW OPPORTUNITIES … (2/3)

3939SEPTEMBER 2016
213.80 218.50
294.20
421.70
374.90
334.70347.80
372.20392.57
FY08 FY09 FY10 FY11 FY12 FY13 FY14 FY15 FY16
102.50
159.90
228.40
314.50
417.60399.00
414.60
460.10
340.30
FY08 FY09 FY10 FY11 FY12 FY13 FY14 FY15 FY16
For updated information, please visit www.ibef.org
Source: Department of Information Technology; Company Websites, TechSci Research
The digitisation of cable television has led to increased demand for set-top boxes, dish, cables, and other electronic
component; this has resulted in many opportunities for local and foreign players to enter the market
Digitisation will lead to increased broadband penetration in India and open up new avenues for companies offering value-
added services such as online gaming, HD television Internet, music, and radio
Dish TV revenues (USD million) Sun TV revenues (USD million)
ELECTRONICS
ERA OF DIGITISATION OPENS NEW OPPORTUNITIES … (3/3)
CAGR: 7.9%CAGR: 16.18%

SEPTEMBER 2016
SUCCESS STORIES
ELECTRONICS
4141SEPTEMBER 2016
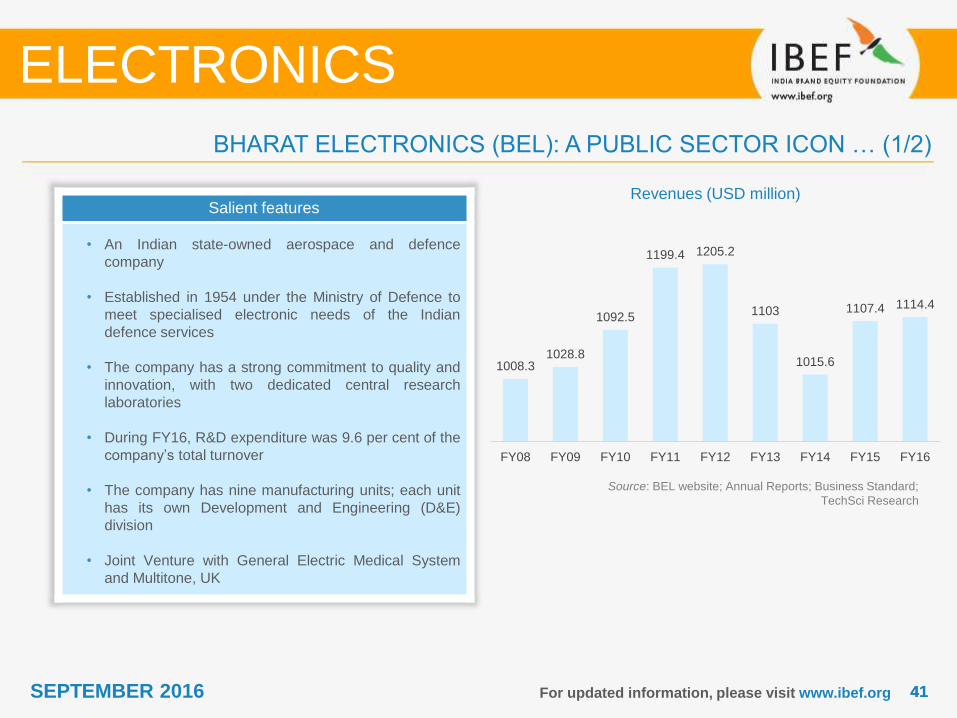
1008.31028.8
1092.5
1199.4 1205.2
1103
1015.6
1107.4 1114.4
FY08 FY09 FY10 FY11 FY12 FY13 FY14 FY15 FY16
For updated information, please visit www.ibef.org
BHARAT ELECTRONICS (BEL): A PUBLIC SECTOR ICON … (1/2)
Salient features
• An Indian state-owned aerospace and defence
company
• Established in 1954 under the Ministry of Defence to
meet specialised electronic needs of the Indian
defence services
• The company has a strong commitment to quality and
innovation, with two dedicated central research
laboratories
• During FY16, R&D expenditure was 9.6 per cent of the
company’s total turnover
• The company has nine manufacturing units; each unit
has its own Development and Engineering (D&E)
division
• Joint Venture with General Electric Medical System
and Multitone, UK
Revenues (USD million)
Source: BEL website; Annual Reports; Business Standard;
TechSci Research
ELECTRONICS
4242SEPTEMBER 2016 For updated information, please visit www.ibef.org
BHARAT ELECTRONICS (BEL): A PUBLIC SECTOR ICON … (2/2)
Key success factors
• Focus on innovation and R&D
• Key technological collaborations with leading European,
American and Israeli companies
• Rising defence spending in India
• Governmental emphasis on indigenisation and reduction
of import bill
• Diversification in the civilian and export market
• Under the Navratna category in 2016, Bharat Electronics
Ltd (BEL) won four PSE Excellence Awards 2015
Source: BEL website; Annual Reports; TechSci Research
Note: GOI – Government of India
ELECTRONICS
Financial highlights
• As of 31st March 2016, BEL's order book was around
USD4.9 billion
• During FY08–16, BEL’s revenue increased at a CAGR
of 1.26 per cent, from USD1008.3 million in FY08 to
USD1114.4 million in FY16
• During the same period, BEL’s net profits decreased at a
CAGR of 0.13 per cent, from USD205.29 million in FY08
to USD207.4 million in FY16.
• In 2016, GOI announced its plans to buy back 25 per
cent shares of Bharat Electronics Ltd (BEL)

4343SEPTEMBER 2016 For updated information, please visit www.ibef.org
Market share in consumer durables (FY15)
Source: Company website; TechSci Research
Third largest consumer durables company in India and one
of the largest Colour Picture Tube (CPT) manufacturers
globally
17 manufacturing sites in India and plants in Mainland
China, Poland, Italy and Mexico
Holds about one-fourth market share in the consumer
durables market
Leads the market in colour TV, refrigerator, washing
machine, and microwave oven segments
Acquired Colour Picture Tube (CPT) businesses from
Thomson S.A through a wholly owned offshore subsidiary.
The company has manufacturing facilities in Poland, Italy,
Mexico and China along with support research and
development facilities
ELECTRONICS
VIDEOCON: A PRIVATE SECTOR GIANT … (1/3)
26%
74%
Videocon
others

4444SEPTEMBER 2016
2.5
2.0
3.1
2.8
2.6
3.3
3.1
2.0
0.4
21
2.1
86
.8
15
7.0
11
9.6
24
.9
-13
.2
0.5 -9.1 -43
.8
FY08 FY09 FY10 FY11 FY12 FY13 FY14 FY15 FY16
Revenues (USD Billion) Net Profit (USD Million)
For updated information, please visit www.ibef.org
Top line and bottom line trends (USD million)
Source: Company website; TechSci Research
FY101 Data for 15 months
FY132 Data for 18 months (Jan 2012 to June 2013)
FY143 Data for 18 months
FY154 Data for 12 months till December 2015
FY165 Data for 6 months
During FY07–14, Videocon’s revenues increased at a
CAGR of 3.3 per cent
During the 6 months ended June 15, the company's
revenues reached USD1016.9 million
ELECTRONICS
Notes: FY – Financial Year; CAGR – Compound Annual Growth Rate,
During 2007–09, the financial year was October–September; however,
In 2013 the company changed its financial year end to June
VIDEOCON: A PRIVATE SECTOR GIANT … (2/3)
1 2 3 4 5

4545SEPTEMBER 2016 For updated information, please visit www.ibef.org
ELECTRONICS
Strong presence in the
consumer electronics
market
Sales expanded at a
CAGR of 3.3% during
FY08-14
Market capitalisation of
USD929 million
Revenue base of over
USD1016.9 million,
with net profit of USD3.4
million for 6 months
ended June 2015
Primary focus on consumer electronics products
Foray into manufacturing compressors and motors and crude oil business
Aggressive growth via acquisitions and entry in
telecom, DTH, and mobile handset manufacturing
Focus on R&D
Strong brand
presence in Tier 2
and Tier 3 cities
Foray into telecom
services and handset
manufacturing
Launched LCD TV
bundled with DTH
and Internet chip
1985–95 1995–05 2005–14
Plans to set up a
SEZ in Pune and
Aurangabad in
Maharashtra
Acquisitions
Thomson, Philips,
and Electrolux
plants
Source: Videocon website; TechSci Research
Note: DTH – Direct to Home
VIDEOCON: A PRIVATE SECTOR GIANT … (3/3)
Videocon DTH to
float IPO by the
end of 2014
The company
joined hands with
Coolpad group to
for smartphones

4646SEPTEMBER 2016
75.7
337.8
510.8
290.4
572.1
1184.7
FY09 FY10 FY11 FY12 FY13 FY14
For updated information, please visit www.ibef.org
Growth in Revenue
(USD million)
Source: Micromax website; TechSci Research
Micromax started out as an IT software company in 2000
Micromax began manufacturing mobile phones in 2010;
besides sourcing from China, and became one of the
largest Indian domestic mobile handsets company operating
in low cost feature phone segments by 2010
Micromax had a 9.7 per cent market share in Indian tablet
market during Q2 2013 and is ranked second in smart
phones market with 24.3 per cent share
With presence across 14 countries, the company
manufactures mobile handsets, tablets, and LED televisions
During FY09–14, Micromax’s revenues increased at a
CAGR of 73.3 per cent to USD1184.7 million in FY14
The company’s share in the mobile handset market in India
increased from 5 per cent in 2011 to 8.7 per cent in 2013
In April 2016, Micromax entered into strategic partnership
with TranServ and Visa to offer a digital payment
infrastructure platform to consumers.
THE MICROMAX STORY
ELECTRONICS
CAGR: 73.3%

SEPTEMBER 2016
USEFUL INFORMATION
ELECTRONICS

4848SEPTEMBER 2016
INDUSTRY ASSOCIATIONS … (1/2)
Electronics Industries Association of India (ELCINA)
ELCINA House, 422 Okhla Industrial Estate,
New Delhi – 110 020, India
Phone: 91 11 26924597,26928053
Fax: 91 11 26923440
E-mail: [email protected]
Website: www.elcina.com/
Telecom Equipment Manufacturers Association (TEMA)
4th Floor, PHD House, Opp. Asian Village,
New Delhi – 110 016, India
Tel: 91 11 26859621
Fax: 91 11 26859620
E-mail: [email protected]
Website: http://www.tfci.com/cni/tema.htm
For updated information, please visit www.ibef.org
ELECTRONICS

4949SEPTEMBER 2016
INDUSTRY ASSOCIATIONS … (2/2)
Manufacturers Association for Information Technology (MAIT)
4th Floor, PHD House, Opp. Asian Games Village,
New Delhi 110 016, India
Tel: 91 11 26855487
Fax: 91 11 26851321
E-mail: [email protected]
Website: www.mait.com
Consumer Electronics and Appliances Manufacturers Association
(CEAMA)
5th Floor, PHD House
4/2, Siri Institutional Area, August Kranti Marg
New Delhi-110 016
Telefax: 91- 11- 46070335, 46070336
e-mail: [email protected]
Website: www.ceama.in
For updated information, please visit www.ibef.org
ELECTRONICS

5050SEPTEMBER 2016
GLOSSARY
For updated information, please visit www.ibef.org
C&B: Communication and Broadcasting
CAGR: Compound Annual Growth Rate
Capex: Capital Expenditure
CENVAT: Central Value Added Tax
EHTP: Electronic Hardware Technology Park
EPCG: Export Promotion Capital Goods Scheme
FDI: Foreign Direct Investment
FY: Indian Financial Year (April – March); for example FY10 means April 2009 – March 2010
PLC: Programmable Logic Controller
R&D: Research and Development
SCADA: Supervisory Control and Data Acquisition
USD: US Dollar
Wherever applicable, numbers have been rounded off to the nearest whole number
ELECTRONICS

5151SEPTEMBER 2016
Year INR equivalent of one USD
2004–05 44.81
2005–06 44.14
2006–07 45.14
2007–08 40.27
2008–09 46.14
2009–10 47.42
2010–11 45.62
2011–12 46.88
2012–13 54.31
2013–14 60.28
2014-15 61.06
2015-16 65.46
2016-17 (E) 66.95
Year INR equivalent of one USD
2005 43.98
2006 45.18
2007 41.34
2008 43.62
2009 48.42
2010 45.72
2011 46.85
2012 53.46
2013 58.44
2014 61.03
2015 64.15
2016 (Expected) 67.22
Exchange rates (Fiscal Year)
For updated information, please visit www.ibef.org
EXCHANGE RATES
Exchange rates (Calendar Year)
Source: Reserve bank of India,
Average for the year
ELECTRONICS
5252SEPTEMBER 2016
India Brand Equity Foundation (“IBEF”) engaged TechSci to prepare this presentation and the same has been
prepared by TechSci in consultation with IBEF.
All rights reserved. All copyright in this presentation and related works is solely and exclusively owned by IBEF. The
same may not be reproduced, wholly or in part in any material form (including photocopying or storing it in any
medium by electronic means and whether or not transiently or incidentally to some other use of this presentation),
modified or in any manner communicated to any third party except with the written approval of IBEF.
This presentation is for information purposes only. While due care has been taken during the compilation of this
presentation to ensure that the information is accurate to the best of TechSci and IBEF’s knowledge and belief, the
content is not to be construed in any manner whatsoever as a substitute for professional advice.
TechSci and IBEF neither recommend nor endorse any specific products or services that may have been mentioned in
this presentation and nor do they assume any liability or responsibility for the outcome of decisions taken as a result of
any reliance placed on this presentation.
Neither TechSci nor IBEF shall be liable for any direct or indirect damages that may arise due to any act or omission
on the part of the user due to any reliance placed or guidance taken from any portion of this presentation.
For updated information, please visit www.ibef.org
DISCLAIMER
ELECTRONICS