Novel Molten Salt Electrochemical Processes for Industrial ...
1
Effect of numerical aperture on molten area characteristics in micro-joining of glass by picosecond pulsed laser
Yasuhiro Okamoto 1,* • Zhiyong Ouyang 1 • Takumi Fujiwara 1 • Akira Okada 1
1 Graduate School of Natural Science and Technology, Okayama University, 3-1-1 Tsushimanaka, Kita-ku, Okayama, Japan
* Yasuhiro Okamoto [email protected]
Abstract Glass products with precise and sophisticated shapes are highly demanded in the field of MEMS due to their excellent properties. Ultrashort pulsed laser has been expected to be a powerful and reliable tool for micro-welding of glass. Focusing condition such as numerical aperture (N.A.) is a critical parameter that controls how ultrashort laser pulses interact with and propagate in glass, and it has a great influence on the laser micro-welding characteristics of glass. In order to investigate the quality of welding process, it is important to understand the dependence of the mechanical strength of molten area created in glass specimen with various numerical apertures. Therefore, the mechanical strength of molten area with various numerical apertures was evaluated in micro-welding of glass by picosecond pulsed laser. Higher bending strength could be obtained under an appropriate volume ratio of molten area inside glass specimen, when continuous molten areas were formed. In addition, high density and large size of molten area without crack led to higher breaking stress. It is concluded that superior focusing characteristics such as N.A. 0.65 enable a long region of high power density in beam axis, which can satisfy both high mechanical strength and high processing speed. Keywords Picosecond pulsed laser • Glass material • Numerical aperture • Bending strength • Breaking stress
1 Introduction Considering the demand for glass products with precise and sophisticated shapes in the field of Micro Electro Mechanical Systems (MEMS) because of their excellent properties [1, 2], optical contact, the gluing method and anodic bonding have been widely used to achieve reliable and stable joining of glass [3-5]. However, these methods have some disadvantages, and space selective joining is unavailable [6, 7]. In the past several years, ultrashort pulsed laser has been proven to be a powerful and reliable tool for micro-welding of glass [8, 9]. Ultrashort pulsed laser micro-welding process can be accomplished by local heating without any intermediate layer and mechanical contact [10], and space selective joining is possible. Tightly focused ultrashort laser pulses enable the nonlinear absorption through nonlinear photo-ionization and avalanche ionization in glass material [11]. In addition, ultrashort pulsed laser with high pulse repetition rate leads to the melting of glass at the vicinity of focal region by the heat accumulation [12]. It should be
pointed out that the absorption point moves periodically in laser irradiation direction. Then, the molten area is created around the focusing point [13].
Moreover, it has been considered that focusing condition such as numerical aperture (N.A.) has a great influence on the creation characteristics of molten area and the stability of welding process in laser micro-welding of glass [14]. In order to investigate the quality of welding process, the influence of numerical aperture on the mechanical strength of molten area created in glass should be discussed. It is reported that the mechanical strength of molten area in laser welded glass has been examined by different testing methods such as a three-point bending test [15-19], pulling test [13] and shearing test [20-22].
Mohid et al. [15] carried out the three-point bending test and it revealed that the bending strength of molten zone decreased with the increment of feed rate. They demonstrated that proper selection of laser processing parameters would achieve a reliable welding of glass without the fatal decrease of
2
mechanical strength. Miyamoto et al. [16, 17] evaluated the mechanical strength of an internally laser melted single glass plate and overlapped welded glass plates by three-point bending test and shearing test. They showed that the mechanical strength of both single and overlap welded glass decreased with increasing the average value of absorbed laser power. Okamoto et al. [19] reported the evaluation of mechanical strengths of molten zone such as the bending and the shearing strength in fusion welding of glass material by a picosecond pulsed laser. They showed that the proper pulse repetition rate could achieve high bending strength and shear stress.
As for the pulling test, Nordin et al. [13] presented a paper discussing breaking strength of molten area in laser welded glass by the pulling test. They showed that the breaking stress of focusing condition with spherical aberration correction was higher than that without spherical aberration correction.
Numerical aperture is a critical parameter that governs how ultrashort laser pulses interact with and propagate in glass [23]. Schaffer et al. [24] investigated the relationship between N.A. and structural changes in laser welding of glass by femtosecond laser pulses. Their results showed that the structures produced by single pulses consist of small density and refractive index changes. Kongsuwan et al. [25] reported the aspect ratio of absorption volume in glass specimen using femtosecond laser pulses at a 1 kHz repetition rate. They indicated that the heights and the aspect ratio of absorption volumes are decreased with higher N.A..
Cvecek et al. [26] investigated the relationship between N.A. and the defect generation observed in glass welding by ultrashort pulsed laser. They showed that the molten zones were almost radially symmetric by using high N.A., indicating evenly distributed stress field was generated. Thus, the formation of longitudinal cracks could be suppressed. Ouyang et al. [14] reported the influence of numerical aperture on the formation and characteristics of molten area inside glass by picosecond pulsed laser. They concluded that the N.A. of 0.65 with superior focusing characteristics could form a large and continuous molten area without cracks, which enabled the achievement of stable joining of glass. As mentioned above, different testing methods have been used to evaluate the mechanical strength of molten area in laser welded glass, and the influence of N.A. on structural changes and characteristics of molten area were well investigated. However, the discussion of the relationship between molten area characteristics and N.A. was insufficient. Since N.A. has a great influence on the creation characteristics of molten area inside glass and the stability of welding process, it is very important to investigate the quality of welding process by
evaluating the mechanical strength at different numerical apertures.
In this paper, a picosecond pulsed laser of 1064 nm wavelength and 12.5 ps pulse duration was tightly focused inside glass at high pulse repetition rate of 1 MHz by objective lenses of numerical apertures 0.45, 0.65 and 0.85 with spherical aberration correction. The influence of numerical aperture on mechanical strength on molten area was investigated by using three-point bending test and pulling test. Moreover, molten areas were characterized by etching rate and Young’s modulus, and high quality joining method of glass by using ultrashort pulsed lasers was discussed.
2 Evaluation of bending strength by three-point bending test
2.1 Experimental procedures of three-point bending test
In this study, borosilicate glasses (D263, Schott) was used as the specimen. D263 glass has excellent chemical and thermal stability, and a low coefficient of thermal expansion enables remarkable resistant against the thermal load. In addition, D263 glass can be cut easily by laser scribing or break method [27]. Figure 1 shows the schematic illustration of the specimen preparation for three-point bending test. Firstly, the laser scribing process was carried out by Q-switched YAG laser of 355 nm wavelength and 4 ns pulse duration to divide the glass specimen into small size pieces correctly. As shown in Fig. 1a, the glass specimen of 0.3 mm thickness was cut into 12 mm length and 1.5 mm width. Then, a picosecond pulsed laser of 1064 nm in wavelength and 12.5 ps in pulse duration was tightly focused at 250 µm below the top surface of glass specimen at 1.0 MHz pulse repetition rate and 100 mm/s scanning velocity by using objective lenses of numerical apertures 0.45, 0.65 and 0.85 with spherical aberration correction. The laser scanning direction was parallel with scribing line, and weld bead was generated in glass, as shown in Fig. 1b. The scribed surface was faced upward because only compressive stress was applied in this scribed area, which could remain cracks on the scribed surface. Thus, it is considered that the scribed area would not affect the measurement results of bending strength.
It has been reported that the absorption rate of laser beam varied by the numerical aperture [14]. When the input energy is determined, the absorbed energy of laser beam can be calculated by the measured absorption rate. Therefore, it is necessary to b) a)

3
equalize the total absorbed energy at each numerical aperture by controlling numbers of weld line. The processing conditions of different numerical apertures were shown in Table 1. N.A. 0.45 used input pulse energy of 3.0 µJ, and 3 weld lines were created. N.A. 0.65 and N.A. 0.85 employed the input pulse energy of 2.0 µJ, and generated 3 and 10 weld lines, respectively. The line pitch was 100 µm for all numerical apertures. The total absorbed energy was controlled into the same value of 4.8 µJ for all N.A. with the consideration of absorption rate. In addition, bending strength of glass including 10 weld lines using each N.A. was also measured in order to compare with the results of different numbers of weld line.
Figure 2 schematically shows the method of three-point bending test. The fulcrum distance was 10 mm, and the speed of cross head was set to 0.1 mm/min. The crosshead tip radius and fulcrum radius are 0.05 mm and 0.50 mm, respectively. The bending strength was obtained by measuring the breaking load to fracture the glass specimen. Fig. 2 Method of three-point bending test
2.2 Three-point bending test results and discussion
As mentioned in above section, the total absorbed energy Etotal.ab and the number of weld line N are considered as the important processing conditions that govern the heat absorption in glass. However, when Etotal.ab was set to the same value for all numerical apertures, the number of weld line N by N.A. 0.85 was different from that by N.A. 0.45 and 0.65, as mentioned in Table 1. Different number of weld line N might influence on the measurement results of bending strength. Therefore, in order to measure the bending strength precisely and obtain reliable results, the measurement results of breaking strength with different numerical apertures under the same total absorbed energy Etotal.ab and the same number of weld line N were shown in Fig. 3. The standard deviation and the average value were obtained by five experiments with each numerical aperture. The orange areas indicate the bending strength range of non-irradiated glass. The results at the same total absorbed energy Etotal.ab = 4.8 µJ were shown in Fig. 3a, while Fig. 3b is the results of the same number of weld line N = 10 for the comparison. As can be seen from both Figs. 3a and 3b, the bending strength increased with increasing the numerical aperture under both conditions of the same total absorbed energy and the same number of weld line. The bending strength of N.A. 0.45 was lower than that of the base material, while N.A. 0.65 took higher value than the base
N.A. Input energy
Ein (μJ) Absorption rate
Aab (%) Absorbed energy
Eab (μJ) Number of weld line
N Total absorbed energy
Etotal.ab (μJ)
0.45 3.0 53.6 1.61 3 4.8 0.65 2.0 80.4 1.61 3 4.8 0.85 2.0 23.8 0.48 10 4.8
Fig. 1 Specimen preparation for three-point bending test. a Scribing. b Creation of weld bead
Table 1 Processing conditions of different N.A. with the same total absorbed energy

4
material. It can be noticed that the bending strength of N.A. 0.85 showed nearly two times higher value compared with the base material. Under both conditions of the same total absorbed energy and the same number of weld line, appropriate N.A. could achieve higher breaking strength than the base material.
The fractured surfaces of molten areas created by each numerical aperture were observed after three-point bending test, as shown in Fig. 4. The left figure shows the optical microphotographs, and the right one shows Scanning Electron Microscope (SEM) photographs. As shown in Fig. 4, there was no crack at the molten area even after three-point bending test in the case of N.A. 0.65. It is considered that the formation of this non-cracking molten area resulted in
the improvement of the bending strength compared with the base material as mentioned above. In the case of N.A. 0.85, cracks occurred at the middle of molten areas, and these cracks elongated horizontally. As mentioned before, the load was applied in perpendicular direction to the top surface of glass specimen in three-point bending test. Therefore, the cracks elongating in parallel direction to the top surface suppressed the growth of cracks around the molten area, which resulted in maximum bending strength compared with other numerical apertures. On the other hand, SEM photograph of N.A. 0.45 showed that the location of molten area fluctuated in laser irradiation axis. The middle molten area existed at higher location in the laser beam axis compared with that of both sides in SEM photograph. This
Fig. 3 Influence of numerical aperture on bending strength. a Same total absorbed energy. b Same number of weld line
Fig. 4 Fractured surfaces of molten areas after three-point bending test
b) a)
5
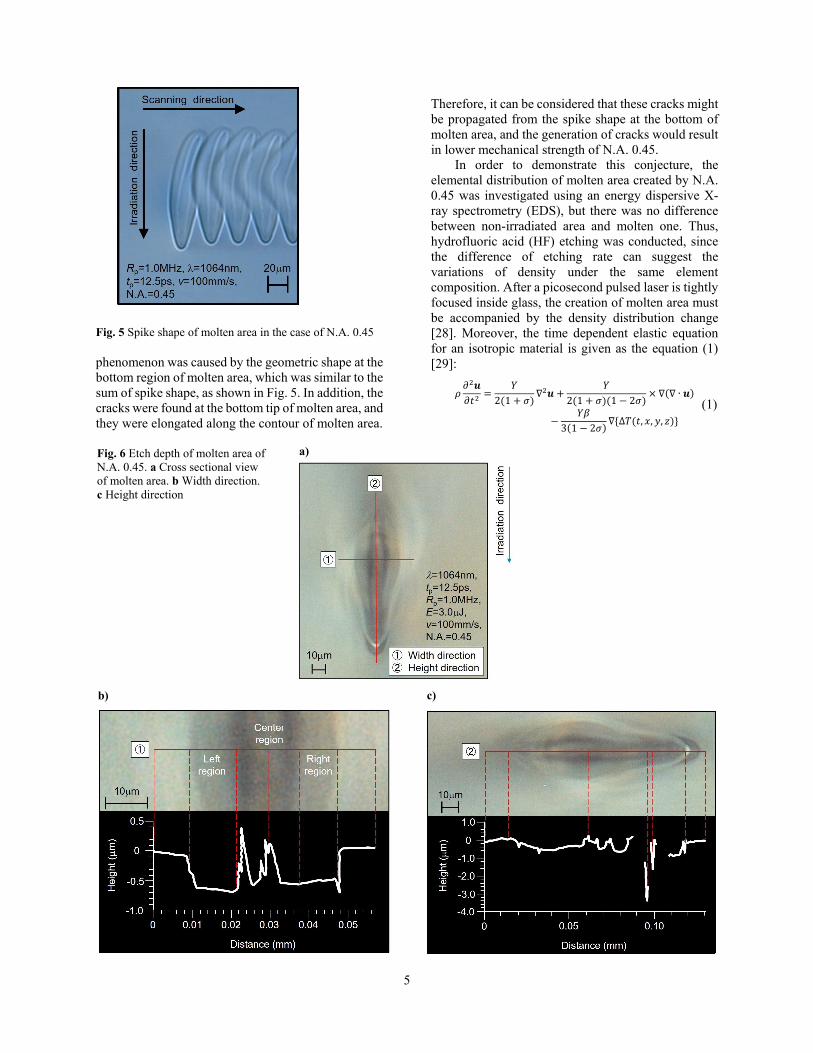
Fig. 5 Spike shape of molten area in the case of N.A. 0.45 phenomenon was caused by the geometric shape at the bottom region of molten area, which was similar to the sum of spike shape, as shown in Fig. 5. In addition, the cracks were found at the bottom tip of molten area, and they were elongated along the contour of molten area.
Therefore, it can be considered that these cracks might be propagated from the spike shape at the bottom of molten area, and the generation of cracks would result in lower mechanical strength of N.A. 0.45.
In order to demonstrate this conjecture, the elemental distribution of molten area created by N.A. 0.45 was investigated using an energy dispersive X-ray spectrometry (EDS), but there was no difference between non-irradiated area and molten one. Thus, hydrofluoric acid (HF) etching was conducted, since the difference of etching rate can suggest the variations of density under the same element composition. After a picosecond pulsed laser is tightly focused inside glass, the creation of molten area must be accompanied by the density distribution change [28]. Moreover, the time dependent elastic equation for an isotropic material is given as the equation (1) [29]:
𝜌𝜌𝜕𝜕2𝒖𝒖𝜕𝜕𝑡𝑡2
=𝑌𝑌
2(1 + 𝜎𝜎)∇2𝒖𝒖 +
𝑌𝑌2(1 + 𝜎𝜎)(1 − 2𝜎𝜎)
× ∇(∇ ∙ 𝒖𝒖)
−𝑌𝑌𝑌𝑌
3(1 − 2𝜎𝜎)∇{∆𝑇𝑇(𝑡𝑡, 𝑥𝑥, 𝑦𝑦, 𝑧𝑧)}
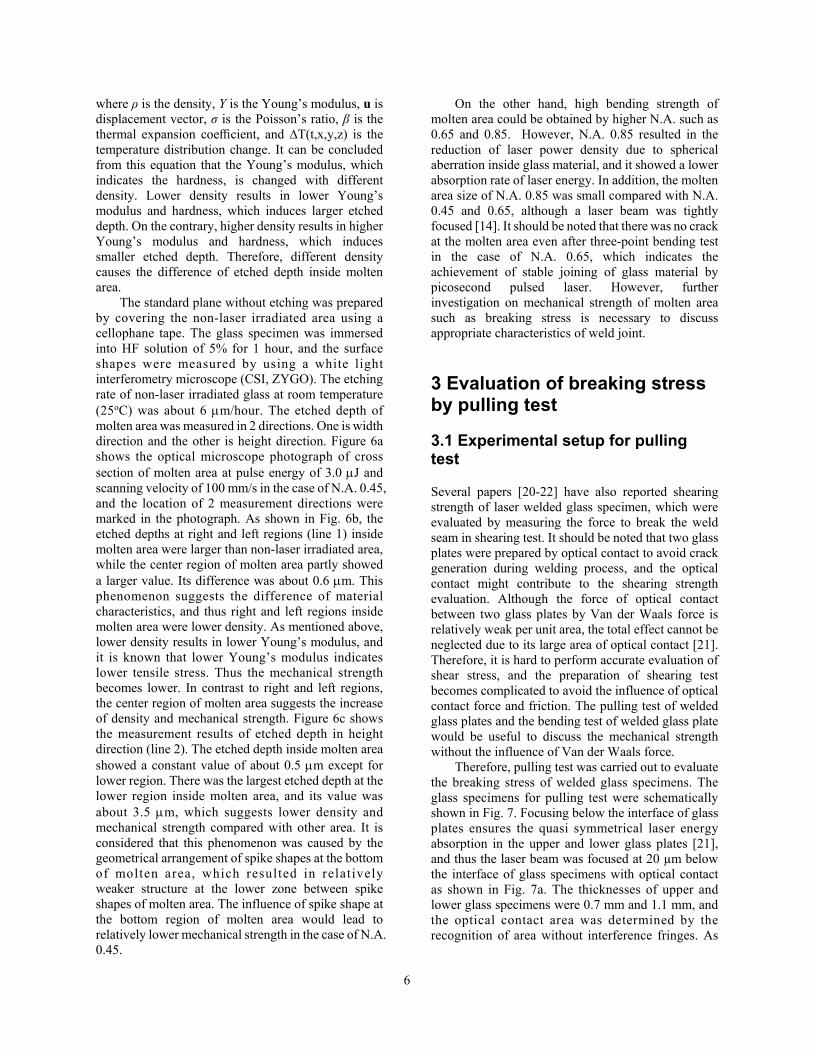
Fig. 6 Etch depth of molten area of N.A. 0.45. a Cross sectional view of molten area. b Width direction. c Height direction
c)
a)
b)
(1)
6
where ρ is the density, Y is the Young’s modulus, u is displacement vector, σ is the Poisson’s ratio, β is the thermal expansion coefficient, and ∆T(t,x,y,z) is the temperature distribution change. It can be concluded from this equation that the Young’s modulus, which indicates the hardness, is changed with different density. Lower density results in lower Young’s modulus and hardness, which induces larger etched depth. On the contrary, higher density results in higher Young’s modulus and hardness, which induces smaller etched depth. Therefore, different density causes the difference of etched depth inside molten area.
The standard plane without etching was prepared by covering the non-laser irradiated area using a cellophane tape. The glass specimen was immersed into HF solution of 5% for 1 hour, and the surface shapes were measured by using a white light interferometry microscope (CSI, ZYGO). The etching rate of non-laser irradiated glass at room temperature (25oC) was about 6 µm/hour. The etched depth of molten area was measured in 2 directions. One is width direction and the other is height direction. Figure 6a shows the optical microscope photograph of cross section of molten area at pulse energy of 3.0 µJ and scanning velocity of 100 mm/s in the case of N.A. 0.45, and the location of 2 measurement directions were marked in the photograph. As shown in Fig. 6b, the etched depths at right and left regions (line 1) inside molten area were larger than non-laser irradiated area, while the center region of molten area partly showed a larger value. Its difference was about 0.6 µm. This phenomenon suggests the difference of material characteristics, and thus right and left regions inside molten area were lower density. As mentioned above, lower density results in lower Young’s modulus, and it is known that lower Young’s modulus indicates lower tensile stress. Thus the mechanical strength becomes lower. In contrast to right and left regions, the center region of molten area suggests the increase of density and mechanical strength. Figure 6c shows the measurement results of etched depth in height direction (line 2). The etched depth inside molten area showed a constant value of about 0.5 µm except for lower region. There was the largest etched depth at the lower region inside molten area, and its value was about 3.5 µm, which suggests lower density and mechanical strength compared with other area. It is considered that this phenomenon was caused by the geometrical arrangement of spike shapes at the bottom of molten area, which resulted in relatively weaker structure at the lower zone between spike shapes of molten area. The influence of spike shape at the bottom region of molten area would lead to relatively lower mechanical strength in the case of N.A. 0.45.
On the other hand, high bending strength of molten area could be obtained by higher N.A. such as 0.65 and 0.85. However, N.A. 0.85 resulted in the reduction of laser power density due to spherical aberration inside glass material, and it showed a lower absorption rate of laser energy. In addition, the molten area size of N.A. 0.85 was small compared with N.A. 0.45 and 0.65, although a laser beam was tightly focused [14]. It should be noted that there was no crack at the molten area even after three-point bending test in the case of N.A. 0.65, which indicates the achievement of stable joining of glass material by picosecond pulsed laser. However, further investigation on mechanical strength of molten area such as breaking stress is necessary to discuss appropriate characteristics of weld joint.
3 Evaluation of breaking stress by pulling test
3.1 Experimental setup for pulling test
Several papers [20-22] have also reported shearing strength of laser welded glass specimen, which were evaluated by measuring the force to break the weld seam in shearing test. It should be noted that two glass plates were prepared by optical contact to avoid crack generation during welding process, and the optical contact might contribute to the shearing strength evaluation. Although the force of optical contact between two glass plates by Van der Waals force is relatively weak per unit area, the total effect cannot be neglected due to its large area of optical contact [21]. Therefore, it is hard to perform accurate evaluation of shear stress, and the preparation of shearing test becomes complicated to avoid the influence of optical contact force and friction. The pulling test of welded glass plates and the bending test of welded glass plate would be useful to discuss the mechanical strength without the influence of Van der Waals force.
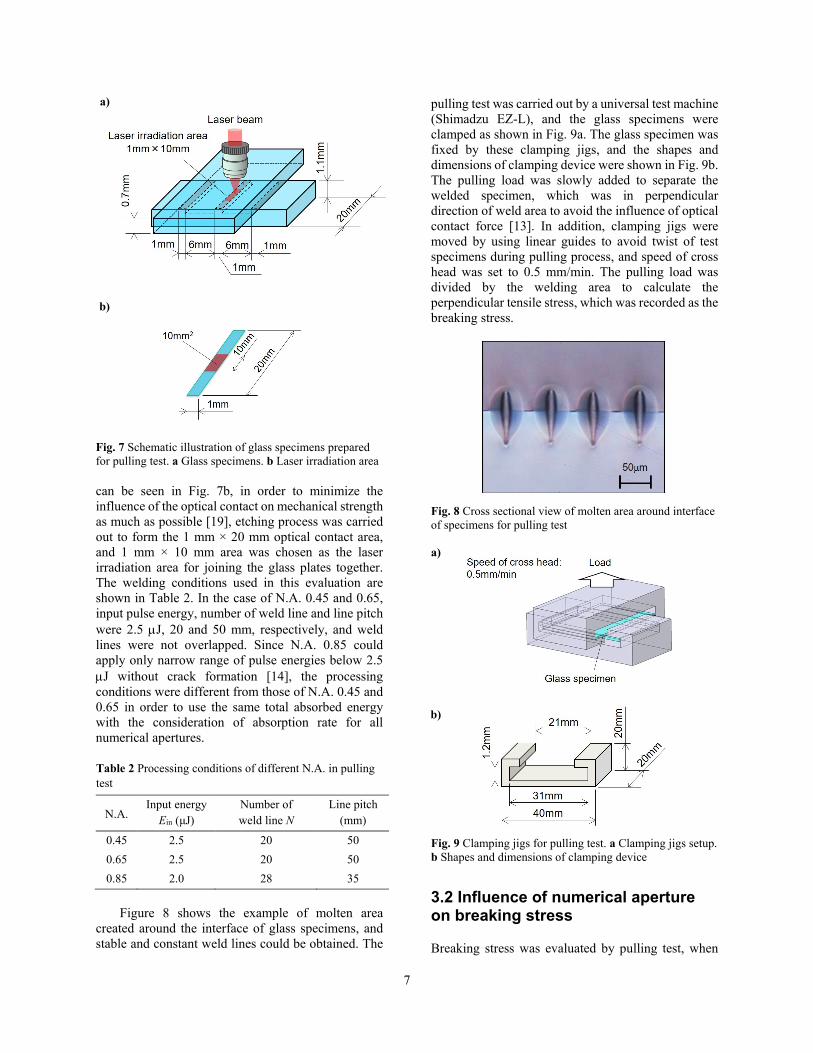
Therefore, pulling test was carried out to evaluate the breaking stress of welded glass specimens. The glass specimens for pulling test were schematically shown in Fig. 7. Focusing below the interface of glass plates ensures the quasi symmetrical laser energy absorption in the upper and lower glass plates [21], and thus the laser beam was focused at 20 µm below the interface of glass specimens with optical contact as shown in Fig. 7a. The thicknesses of upper and lower glass specimens were 0.7 mm and 1.1 mm, and the optical contact area was determined by the recognition of area without interference fringes. As
7
Fig. 7 Schematic illustration of glass specimens prepared for pulling test. a Glass specimens. b Laser irradiation area can be seen in Fig. 7b, in order to minimize the influence of the optical contact on mechanical strength as much as possible [19], etching process was carried out to form the 1 mm × 20 mm optical contact area, and 1 mm × 10 mm area was chosen as the laser irradiation area for joining the glass plates together. The welding conditions used in this evaluation are shown in Table 2. In the case of N.A. 0.45 and 0.65, input pulse energy, number of weld line and line pitch were 2.5 µJ, 20 and 50 mm, respectively, and weld lines were not overlapped. Since N.A. 0.85 could apply only narrow range of pulse energies below 2.5 µJ without crack formation [14], the processing conditions were different from those of N.A. 0.45 and 0.65 in order to use the same total absorbed energy with the consideration of absorption rate for all numerical apertures.
Figure 8 shows the example of molten area
created around the interface of glass specimens, and stable and constant weld lines could be obtained. The
pulling test was carried out by a universal test machine (Shimadzu EZ-L), and the glass specimens were clamped as shown in Fig. 9a. The glass specimen was fixed by these clamping jigs, and the shapes and dimensions of clamping device were shown in Fig. 9b. The pulling load was slowly added to separate the welded specimen, which was in perpendicular direction of weld area to avoid the influence of optical contact force [13]. In addition, clamping jigs were moved by using linear guides to avoid twist of test specimens during pulling process, and speed of cross head was set to 0.5 mm/min. The pulling load was divided by the welding area to calculate the perpendicular tensile stress, which was recorded as the breaking stress. Fig. 8 Cross sectional view of molten area around interface of specimens for pulling test a)
Fig. 9 Clamping jigs for pulling test. a Clamping jigs setup. b Shapes and dimensions of clamping device
3.2 Influence of numerical aperture on breaking stress
Breaking stress was evaluated by pulling test, when
N.A. Input energy
Ein (μJ) Number of weld line N
Line pitch (mm)
0.45 2.5 20 50 0.65 2.5 20 50 0.85 2.0 28 35
Table 2 Processing conditions of different N.A. in pulling test
a)
b)
b)

8
equivalent joining areas were created by using various numerical apertures. Figure 10 shows the relationship between breaking stress and numerical aperture, and the optical microscope photographs of molten area taken from cross sectional view. As can be seen from the figure, the highest breaking stress was obtained by using N.A. 0.65. This result proved that the superior focusing characteristics of N.A. 0.65 could achieve the stable joining of glass. However, the breaking stress of N.A. 0.45 was lower than that of N.A. 0.65, although the size of molten area was the largest. This phenomenon was mainly caused by the geometrical arrangement of spike shape at the bottom region of molten area in the case of N.A. 0.45. On the contrary, N.A. 0.85 showed the lowest breaking stress, although continuous and crack-free molten area could be formed [14]. This phenomenon might be caused by a small size of molten area. Fig. 10 Influence of numerical aperture on breaking stress
Figure 11 shows the fractured surface after
Figure 11 shows the fractured surface after pulling test. As shown in Fig. 11 (a), the pulling load
pulling test. As shown in Fig. 11 (a), the pulling load was added to separate the welded specimen. The molten area was remained in upper side after pulling test, and the tip of molten area protruded towards the interface of two glass specimens. As a result, the fractured surface of lower glass was left with a groove. Figure 11 (b) shows the SEM photographs of fractured surface on both upper and lower sides for various numerical apertures. It can be seen that the upper side showed convex shape in the welded area, and the lower side had grooves accordingly. It proved that the weld joint was broken from the bottom side of molten area, and molten area remained in the upper side. In the case of N.A. 0.45, a lot of cracks appeared on fractured structure of both upper and lower sides. This phenomenon proved that cracks were originated from the bottom of molten area, in which the spike shapes existed as mentioned in Fig.5. On the contrary, there was no remarkable crack, and weld lines were kept stable in the case of N.A. 0.65 and 0.85.
3.3 Influence of molten area size on breaking stress
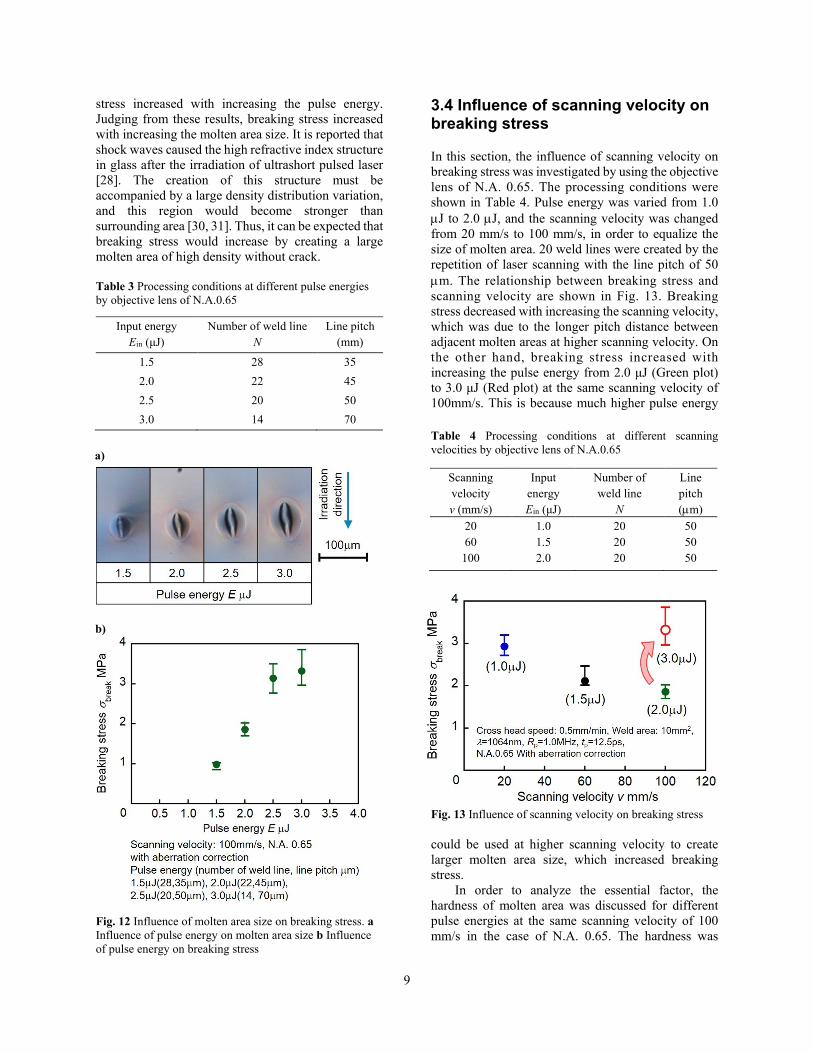
N.A. 0.65, which was obtained the highest breaking stress, was used to investigate the influence of molten area size on breaking stress, and the pulse energy was varied from 1.5 µJ to 3.0 µJ. The number of weld line and line pitch were controlled at different pulse energies to equalize the welded area, as shown in Table 3. Firstly, the influence of pulse energy on molten area size was shown in Fig. 12a. It can be seen that molten area size increased with increasing the pulse energy. Next, the influence of pulse energy on breaking stress was discussed, and its results are shown in Fig. 12b. As shown in this graph, breaking
Fig. 11 Fractured surface after pulling test. a Schematic illustration of fractured glass specimen. b SEM photographs of fractured surface on both sides for various numerical apertures.
a)
b)
9
stress increased with increasing the pulse energy. Judging from these results, breaking stress increased with increasing the molten area size. It is reported that shock waves caused the high refractive index structure in glass after the irradiation of ultrashort pulsed laser [28]. The creation of this structure must be accompanied by a large density distribution variation, and this region would become stronger than surrounding area [30, 31]. Thus, it can be expected that breaking stress would increase by creating a large molten area of high density without crack. Table 3 Processing conditions at different pulse energies by objective lens of N.A.0.65
Fig. 12 Influence of molten area size on breaking stress. a Influence of pulse energy on molten area size b Influence of pulse energy on breaking stress
3.4 Influence of scanning velocity on breaking stress
In this section, the influence of scanning velocity on breaking stress was investigated by using the objective lens of N.A. 0.65. The processing conditions were shown in Table 4. Pulse energy was varied from 1.0 µJ to 2.0 µJ, and the scanning velocity was changed from 20 mm/s to 100 mm/s, in order to equalize the size of molten area. 20 weld lines were created by the repetition of laser scanning with the line pitch of 50 µm. The relationship between breaking stress and scanning velocity are shown in Fig. 13. Breaking stress decreased with increasing the scanning velocity, which was due to the longer pitch distance between adjacent molten areas at higher scanning velocity. On the other hand, breaking stress increased with increasing the pulse energy from 2.0 μJ (Green plot) to 3.0 μJ (Red plot) at the same scanning velocity of 100mm/s. This is because much higher pulse energy Table 4 Processing conditions at different scanning velocities by objective lens of N.A.0.65
Fig. 13 Influence of scanning velocity on breaking stress could be used at higher scanning velocity to create larger molten area size, which increased breaking stress.
In order to analyze the essential factor, the hardness of molten area was discussed for different pulse energies at the same scanning velocity of 100 mm/s in the case of N.A. 0.65. The hardness was
Input energy Ein (μJ)
Number of weld line N
Line pitch (mm)
1.5 28 35 2.0 22 45 2.5 20 50 3.0 14 70
Scanning velocity v (mm/s)
Input energy Ein (μJ)
Number of weld line
N
Line pitch (µm)
20 1.0 20 50 60 1.5 20 50
100 2.0 20 50
b)
a)
10
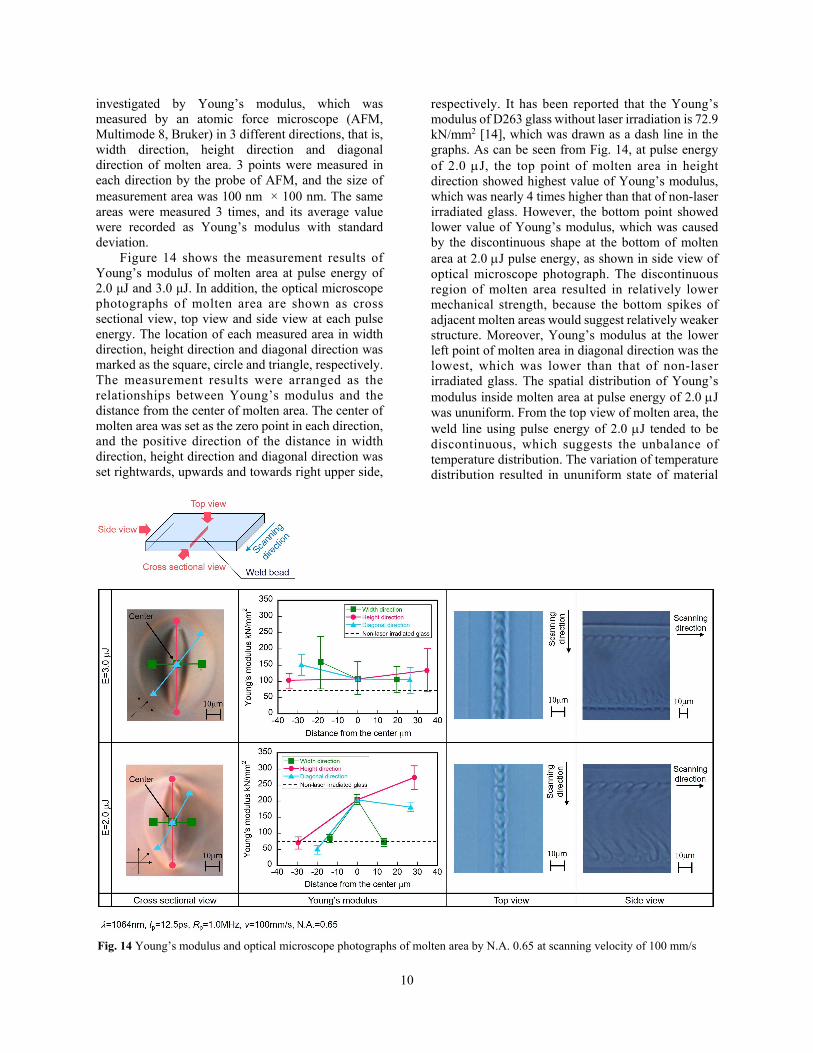
investigated by Young’s modulus, which was measured by an atomic force microscope (AFM, Multimode 8, Bruker) in 3 different directions, that is, width direction, height direction and diagonal direction of molten area. 3 points were measured in each direction by the probe of AFM, and the size of measurement area was 100 nm × 100 nm. The same areas were measured 3 times, and its average value were recorded as Young’s modulus with standard deviation.
Figure 14 shows the measurement results of Young’s modulus of molten area at pulse energy of 2.0 μJ and 3.0 μJ. In addition, the optical microscope photographs of molten area are shown as cross sectional view, top view and side view at each pulse energy. The location of each measured area in width direction, height direction and diagonal direction was marked as the square, circle and triangle, respectively. The measurement results were arranged as the relationships between Young’s modulus and the distance from the center of molten area. The center of molten area was set as the zero point in each direction, and the positive direction of the distance in width direction, height direction and diagonal direction was set rightwards, upwards and towards right upper side,
respectively. It has been reported that the Young’s modulus of D263 glass without laser irradiation is 72.9 kN/mm2 [14], which was drawn as a dash line in the graphs. As can be seen from Fig. 14, at pulse energy of 2.0 µJ, the top point of molten area in height direction showed highest value of Young’s modulus, which was nearly 4 times higher than that of non-laser irradiated glass. However, the bottom point showed lower value of Young’s modulus, which was caused by the discontinuous shape at the bottom of molten area at 2.0 µJ pulse energy, as shown in side view of optical microscope photograph. The discontinuous region of molten area resulted in relatively lower mechanical strength, because the bottom spikes of adjacent molten areas would suggest relatively weaker structure. Moreover, Young’s modulus at the lower left point of molten area in diagonal direction was the lowest, which was lower than that of non-laser irradiated glass. The spatial distribution of Young’s modulus inside molten area at pulse energy of 2.0 µJ was ununiform. From the top view of molten area, the weld line using pulse energy of 2.0 µJ tended to be discontinuous, which suggests the unbalance of temperature distribution. The variation of temperature distribution resulted in ununiform state of material
Fig. 14 Young’s modulus and optical microscope photographs of molten area by N.A. 0.65 at scanning velocity of 100 mm/s

11
characteristics. In conclusion, Young’s modulus showed an ununiform distribution, and higher values were concentrated around the top and the center of molten area at pulse energy of 2.0 µJ due to geometrical arrangement of spike shapes. On the other hand, all average values of Young’s modulus were higher than that of non-laser irradiated glass at pulse energy of 3.0 µJ, and Young’s modulus showed more uniform distribution inside molten area compared with pulse energy of 2.0 µJ. Judging from top and side views shown in Fig. 14, the weld line using pulse energy of 3.0 µJ was continuously formed inside glass specimen. These phenomena indicated that a relatively uniform temperature distribution was formed at pulse energy of 3.0 µJ, and the hardness distribution was uniform accordingly. Thus, it was expected that higher pulse energy such as 3.0 µJ could achieve both higher value of Young’s modulus than that of non-laser irradiated glass and uniform distribution within whole molten area, and these phenomena resulted in higher breaking stress than that at lower pulse energy of 2.0 µJ. In addition, this phenomenon proved that it is possible to obtain higher breaking stress by a stable creation of large molten area without cracks at higher scanning velocity and higher pulse energy, when N.A. 0.65 is employed. Therefore, superior focusing characteristics of N.A. 0.65 enable long region of high power density in beam axis, which can satisfy both high mechanical strength and high processing speed.
4 Conclusions In this study, effect of numerical aperture on molten area characteristics in micro-welding of glass by picosecond pulsed laser was experimentally investigated. The main conclusions obtained are as follows:
(1) The formation of continuous molten area by N.A. 0.65 is effective in improving the mechanical strength of weld line from 2.0 MPa to 2.8 MPa.
(2) A large volume of molten area using higher pulse energy such as 3.0 µJ is expected to achieve higher mechanical strength.
(3) Breaking stress can be increased by creating a large molten area of high density without crack.
(4) Superior focusing characteristics such as N.A. 0.65 achieve both high mechanical strength of 3.3
MPa at high processing speed of 100 mm/s.
Acknowledgments The research work covered in this paper was partly supported by Japanese Ministry of Education, Culture, Sports, Science and Technology, JSPS KAKEN Grand Number 24760107 and Amada Foundation AF-2018204. Authors would
like to express their sincere thanks to Dr. Togo Shinonaga, Assistant Professor, Graduate School of Natural Science and Technology, Okayama University for his contribution to the experiments.
References 1. Miyamoto I, Horn A, Gottmann J, Wortmann D,
Yoshino F (2007) Fusion welding of glass using femtosecond laser pulses with high-repetition rates. Journal of Laser Micro/Nanoengineering 2: 57-63
2. Miyamoto I, Horn A, Gottmann J (2007) Local melting of glass material and its application to direct fusion welding by ps-laser pulses. Journal of Laser Micro/Nanoengineering 2: 7–14
3. Cvecek K, Miyamoto I, Strauss J, Wolf M, Frick T, Schmidt M (2011) Sample preparation method for glass welding by ultrashort laser pulses yields higher seam strength. Applied Optics 50 (13): 1941–1944
4. Niklaus F, Stemme G, Lu J Q, Gutmann R (2006) Adhesive wafer bonding. Journal of Applied Physics 99: 031101
5. Ziaie B, Von Arx J, Dokmeci M, Najafi K (1996) A hermetic glass–silicon micropackage with high-density on-chip feedthroughs for sensors and actuators. Journal of Microelectromechanical Systems 5: 166-179
6. Cvecek K, Odato R, Dehmel S, Miyamoto I, Schmidt M (2015) Gap bridging in joining of glass using ultra short laser pulses. Optics Express 23 (5): 5681–5693
7. Watanabe W, Onda S, Tamaki T, Itoh K, Nishii J (2006) Space-selective laser joining of dissimilar transparent materials using femtosecond laser pulses. Applied Physics Letters 89: 021106
8. Miyamoto I, Horn A, Gottmann J, Wortmann D, Mingareev I, Yoshino F, Schmidt M, Bechtold P, Okamoto Y, Uno Y, Herrmann T (2008) Novel fusion welding technology of glass using ultrashort pulse lasers. Proceedings of the International Congress on Applications of Lasers & Electro-Optics
9. Miyamoto I, Okamoto Y, Tanabe R, Ito Y, Cvecek K, Schmidt M (2016) Mechanism of dynamic plasma motion in internal modification of glass by fs-laser pulses at high pulse repetition rate. Optics Express 24 (22): 25718–25731
10. Takekuni T, Okamoto Y, Fujiwara T, Okada A, Miyamoto I (2015) Effects of focusing condition on micro-welding characteristics of borosilicate glass by picosecond pulsed laser. Key Engineering Materials 656–657: 461–467
11. Miyamoto I, Okamoto Y, Tanabe R, Ito Y (2014)
12
Characterization of plasma in microwelding of glass using ultrashort laser pulse at high pulse repetition rates. Physics Procedia 56: 973–982
12. Richter S, Döring S, Tünnermann A, Nolte S (2011) Bonding of glass with femtosecond laser pulses at high repetition rates. Applied Physics A 103: 257–261
13. Nordin I H W, Okamoto Y, Okada A, Takekuni T, Sakagawa T (2016) Effect of focusing condition on molten area characteristics in micro-welding of borosilicate glass by picosecond laser. Applied Physics A 122: 492
14. Ouyang Z, Okamoto Y, Ogino Y, Sakagawa T, Okada A (2019) Influence of numerical aperture on molten area formation in fusion micro-welding of glass by picosecond pulsed laser. Applied Sciences 9 (1412): 1-15
15. Mohid Z. B, Okamoto Y, Yamamoto K, Uno Y, Miyamoto I, Cvecek K, Schmidt M, Bechtold P (2009) Evaluation of molten zone in glass welding using ultra-short pulsed laser. Proceedings of International Conference on Leading Edge Manufacturing in 21st century 2009: 569-572
16. Miyamoto I, Cvecek K, Okamoto Y, Schmidt M, Helvajian H (2011) Characteristics of laser absorption and welding in FOTURAN glass by ultrashort laser pulses. Optics Express 19 (23): 22961
17. Miyamoto I, Cvecek K, Okamoto Y, Schmidt M (2014) Internal modification of glass by ultrashort laser pulse and its application to microwelding. Applied Physics A 114 (1): 187–208
18. Richter S, Nolte S, Tünnermann A (2012) Ultrashort pulse laser welding-a new approach for high-stability bonding of different glasses. Physics Procedia 39: 556–562
19. Okamoto Y, Miyamoto I, Cvecek K, Okada A, Takahashi K, Schmidt M (2013) Evaluation of molten zone in micro-welding of glass by picosecond pulsed laser. Journal of Laser Micro/Nanoengineering 8 (11): 65-69
20. Cvecek K, Miyamoto I, Strauss J, Bui V, Scharfenberg S, Frick T, Schmidt M (2012) Strength of joining seams in glass welded by ultra-fast lasers depending on focus height. Journal of Laser Micro/Nanoengineering 7 (1): 68–72
21. Alexeev I, Cvecek K, Schmidt C, Miyamoto I, Frick T, Schmidt M (2012) Characterization of shear strength and bonding energy of laser produced welding seams in glass. Journal of Laser Micro/Nanoengineering 7 (3): 279–283
22. Carter R M, Troughton M, Chen J, Elder I, Thomson R R, Esser M D, Robert A L, Hand D P (2017) Towards industrial ultrafast laser microwelding: SiO2 and BK7 to aluminum alloy. Applied Optics 56 (16): 4873– 4881
23. Ashcom J B, Gattass R R, Schaffer C B, Mazur E (2006) Numerical aperture dependence of damage and supercontinuum generation from femtosecond laser pulses in bulk fused silica. Journal of the Optical Society of America B 23: 2317-2322
24. Schaffer C B, Jamison A O, Mazur E (2004) Morphology of femtosecond laser-induced structural changes in bulk transparent materials. Applied Physics Letters 84: 1441–1443
25. Kongsuwan P, Yao Y L (2010) Transmission welding of glasses by femtosecond laser: structural and mechanical properties. International Congress on Applications of Lasers & Electro-Optics: 1069
26. Cvecek K, Miyamoto I, Alexeev I, Schmidt M (2010) Defect formation in glass welding by means of ultrashort laser pulses. Physics Procedia 5: 495
27. Schott North America, Inc. Available online: https://www.us.schott.com/d/corporate/6e742d05-4d1a-4c2a-b4d4-8b9ea369b7e7/us-schott-d263t-eco-thin-glass-datenflyer-view-2019-05-24.pdf
28. Sakakura M, Terazima M, Shimotsuma Y, Miura K, Hirao K (2007) Observation of pressure wave generated by focusing a femtosecond laser pulse inside a glass. Optics Express 15: 5674–5686
29. Sakakura M, Terazima M, Shimotsuma Y, Miura K, Hirao K (2010) Elastic and thermal dynamics in femtosecond laser-induced structural change inside glasses studied by the transient lens method. Laser Chemistry 2010: 1–15
30. Shimotsuma Y, Qiu J, Kazansky P G, Hirao K (2004) Fabrication of nanograting inside transparent materials by using a single femtosecond laser beam. Proceeding of SPIE—International Society Optical Engineering 5662: 173–178
31. Kanehira S, Miura K, Hirao K (2008) Ion exchange in glass using femtosecond laser
irradiation. Applied Physics Letters 93 (2): 023112