
Effect of higher modes on the seismic response and design...
14
Effect of higher modes on the seismic response and design of moment-resisting RC frame structures Charilaos A. Maniatakis, Ioannis N. Psycharis ⇑ , Constantine C. Spyrakos School of Civil Engineering, National Technical University of Athens, Greece article info Article history: Received 16 November 2012 Revised 1 May 2013 Accepted 13 May 2013 Keywords: Higher modes Frame structures Modal response Nonlinear analysis Reduction factor Behaviour factor Design of MRF structures abstract Recently, extensive research has been conducted regarding higher-mode effects on the response of multi degree-of-freedom (MDOF) systems. The research has been focused mainly on structures with a lateral force resisting system consisting of slender walls, since these types of buildings are expected to be mostly affected by higher-mode phenomena according to structural dynamics, and simplified expressions have been proposed for slender-wall structures to account for higher-mode response in estimating shear forces. Current seismic design practice assumes the same reduction factor for all modes, even though there is strong evidence that inelasticity affects higher modes of vibration unequally. Additionally, sim- plified design methods are based only on the fundamental mode of vibration neglecting the effect of higher modes or considering them as elastic. In this paper, higher-mode contributions on the overall response of a nine-storey moment resisting frame (MRF), for which a domination of the first mode is expected, are investigated. The accuracy of a modified Modal Response Spectrum Analysis (mMRSA) method and other available methods is evaluated by comparing the results with the ones of the nonlinear response history analysis. Modal behaviour (reduction) factors are directly calculated for the first three modes and the validity of common assumptions is examined. The assessment of the methods is not restricted to deformations, but is extended to storey inertial forces and shears as well, which have attracted less interest from structural engineers, even though they are considered responsible for numer- ous structural and non-structural failures during major recent earthquakes and are critical for the design of several structures, such as precast buildings. The results suggest that the storey inertial forces and accelerations at all storeys and shear forces at higher storeys are significantly underestimated by meth- ods neglecting or non-properly accounting for higher modes, even for first-mode dominated structures. The contribution of higher modes depends on the ground motion characteristics, the overstrength asso- ciated with each mode and the response quantity examined. Ó 2013 Elsevier Ltd. All rights reserved. 1. Introduction The contribution of higher modes to the dynamic response of multi degree-of-freedom (MDOF) systems is an issue of addressed significance affecting the design of new structures and the assess- ment of existing ones. As a result of higher-mode vibrations, two main phenomena have challenged the interest of engineers during the last decades. The first phenomenon, known as shear amplification, describes the amplification of shear demands due to higher modes and was firstly addressed by Blakeley et al. [1] for yielding slender walls. The amplification of the shear forces was found to increase with increasing fundamental period and ductility [2,3]. The shear amplification is expected to be more pronounced in slender walls, where the higher modes’ effective modal mass is larger and also, well separated periods are observed compared to frames; there- fore, it is more likely for slender shear walls to retain the second eigenperiod, T 2 , in the acceleration-sensitive region of the response spectrum, affecting the base shear, while the first eigenperiod T 1 is located at the velocity- or even the displacement-sensitive region [4,5]. Several methods can be found in the literature to account for shear amplification [6–8] while an extensive review of the engi- neering studies regarding shear magnification in RC structural walls can be found in [9]. The second phenomenon, known as floor acceleration magnifi- cation, demonstrates the unexpectedly large earthquake-induced accelerations that have been recorded during seismic events or evaluated based on analytical models. During the Northridge, 1994, earthquake, maximum floor accelerations, more than four times the peak ground acceleration, were measured [10]. The floor acceleration magnification phenomenon is strongly related to the inertia forces, since the ratio of the storey inertia force to the storey mass is equal to the storey acceleration in a lumped-parameter 0141-0296/$ - see front matter Ó 2013 Elsevier Ltd. All rights reserved. http://dx.doi.org/10.1016/j.engstruct.2013.05.021 ⇑ Corresponding author. Address: Laboratory for Earthquake Engineering, National Technical University of Athens, 9, Heroon Polytechneiou Str., Zografos 15780, Athens, Greece. Tel.: +30 2107721154. E-mail address: [email protected] (I.N. Psycharis). Engineering Structures 56 (2013) 417–430 Contents lists available at SciVerse ScienceDirect Engineering Structures journal homepage: www.elsevier.com/locate/engstruct
Transcript of Effect of higher modes on the seismic response and design...
Engineering Structures 56 (2013) 417–430
Contents lists available at SciVerse ScienceDirect
Engineering Structures
journal homepage: www.elsevier .com/ locate /engstruct
Effect of higher modes on the seismic response and designof moment-resisting RC frame structures
0141-0296/$ - see front matter � 2013 Elsevier Ltd. All rights reserved.http://dx.doi.org/10.1016/j.engstruct.2013.05.021
⇑ Corresponding author. Address: Laboratory for Earthquake Engineering,National Technical University of Athens, 9, Heroon Polytechneiou Str., Zografos15780, Athens, Greece. Tel.: +30 2107721154.
E-mail address: [email protected] (I.N. Psycharis).
Charilaos A. Maniatakis, Ioannis N. Psycharis ⇑, Constantine C. SpyrakosSchool of Civil Engineering, National Technical University of Athens, Greece
a r t i c l e i n f o
Article history:Received 16 November 2012Revised 1 May 2013Accepted 13 May 2013
Keywords:Higher modesFrame structuresModal responseNonlinear analysisReduction factorBehaviour factorDesign of MRF structures
a b s t r a c t
Recently, extensive research has been conducted regarding higher-mode effects on the response of multidegree-of-freedom (MDOF) systems. The research has been focused mainly on structures with a lateralforce resisting system consisting of slender walls, since these types of buildings are expected to be mostlyaffected by higher-mode phenomena according to structural dynamics, and simplified expressions havebeen proposed for slender-wall structures to account for higher-mode response in estimating shearforces. Current seismic design practice assumes the same reduction factor for all modes, even thoughthere is strong evidence that inelasticity affects higher modes of vibration unequally. Additionally, sim-plified design methods are based only on the fundamental mode of vibration neglecting the effect ofhigher modes or considering them as elastic. In this paper, higher-mode contributions on the overallresponse of a nine-storey moment resisting frame (MRF), for which a domination of the first mode isexpected, are investigated. The accuracy of a modified Modal Response Spectrum Analysis (mMRSA)method and other available methods is evaluated by comparing the results with the ones of the nonlinearresponse history analysis. Modal behaviour (reduction) factors are directly calculated for the first threemodes and the validity of common assumptions is examined. The assessment of the methods is notrestricted to deformations, but is extended to storey inertial forces and shears as well, which haveattracted less interest from structural engineers, even though they are considered responsible for numer-ous structural and non-structural failures during major recent earthquakes and are critical for the designof several structures, such as precast buildings. The results suggest that the storey inertial forces andaccelerations at all storeys and shear forces at higher storeys are significantly underestimated by meth-ods neglecting or non-properly accounting for higher modes, even for first-mode dominated structures.The contribution of higher modes depends on the ground motion characteristics, the overstrength asso-ciated with each mode and the response quantity examined.
� 2013 Elsevier Ltd. All rights reserved.
1. Introduction where the higher modes’ effective modal mass is larger and also,
The contribution of higher modes to the dynamic response ofmulti degree-of-freedom (MDOF) systems is an issue of addressedsignificance affecting the design of new structures and the assess-ment of existing ones. As a result of higher-mode vibrations, twomain phenomena have challenged the interest of engineers duringthe last decades.
The first phenomenon, known as shear amplification, describesthe amplification of shear demands due to higher modes and wasfirstly addressed by Blakeley et al. [1] for yielding slender walls.The amplification of the shear forces was found to increase withincreasing fundamental period and ductility [2,3]. The shearamplification is expected to be more pronounced in slender walls,
well separated periods are observed compared to frames; there-fore, it is more likely for slender shear walls to retain the secondeigenperiod, T2, in the acceleration-sensitive region of the responsespectrum, affecting the base shear, while the first eigenperiod T1 islocated at the velocity- or even the displacement-sensitive region[4,5]. Several methods can be found in the literature to accountfor shear amplification [6–8] while an extensive review of the engi-neering studies regarding shear magnification in RC structuralwalls can be found in [9].
The second phenomenon, known as floor acceleration magnifi-cation, demonstrates the unexpectedly large earthquake-inducedaccelerations that have been recorded during seismic events orevaluated based on analytical models. During the Northridge,1994, earthquake, maximum floor accelerations, more than fourtimes the peak ground acceleration, were measured [10]. The flooracceleration magnification phenomenon is strongly related to theinertia forces, since the ratio of the storey inertia force to the storeymass is equal to the storey acceleration in a lumped-parameter
418 C.A. Maniatakis et al. / Engineering Structures 56 (2013) 417–430
approach of multi-storey structures; thus, an inaccurate evaluationof storey accelerations suggests an imprecise estimation of storeyinertial forces. Several indications suggest that numerous failuresor even collapse of buildings during past earthquakes were in-duced by large floor accelerations not expected from the design[11–13]. The accurate calculation of inertial forces is critical forthe design of numerous structural components, as diaphragmsand connections of precast or steel buildings [14–16], and non-structural components, as equipment [17], which is based on flooraccelerations [18–20]. Furthermore, an as-possible-accurate esti-mation of lateral forces can improve the performance by makingmore uniform the distribution of maximum inter-storey driftsand enhance design economy [21,22].
Extensive recent research revealed that simplified methods forthe calculation of the seismic loads, which are based on the funda-mental mode and are adopted by seismic codes, fail to estimateaccurately the inertial forces and the seismic floor accelerations[21,23–25]. Recently, Chao et al. [21] showed that significant dis-persions can exist between storey inertial forces, which are calcu-lated by the linear static analysis (LSA) (also termed ‘‘lateral forcemethod’’ or ‘‘equivalent static analysis’’) of NEHRP 2003 and Inter-national Building Code 2006 provisions and nonlinear responsehistory analysis (NLRHA) results, especially for the upper storeys.This inconsistency was also observed during pseudo-dynamic teststhat were conducted with precast concrete buildings [26,27]. Itwas shown that the storey forces do not follow a decreasing ten-dency from the upper to the lower levels, as it would be expectedby a first mode dominated response, even in the case of a fully reg-ular and symmetric three-storey precast building [27].
In order to determine the maximum seismic demand for the de-sign of new structures, modern seismic codes, including Eurocode8 (EC8) [28] adopt multi-modal analysis procedures, such as thestandard Modal Response Spectrum Analysis (MRSA) (also termed‘‘linear dynamic’’ analysis) where the maximum base shear is givenas a combination of the maximum modal responses. This method,even though it is widely accepted and used by contemporary codesand is well established in engineering practice, has, among others,two significant shortcomings in view of the previous discussion:
(1) A single value for the yield reduction factor Ry (also calledbehaviour factor, qy) is considered for all significant modesof vibration.
(2) Design spectral values are calculated using the elastic peri-ods without accounting for the critical change of stiffnessduring the development of inelasticity.
However, recent studies have shown that the ductility demandassociated with higher modes might be significantly reduced[29,30]. For buildings with main lateral force resisting system com-prised of structural walls, it was shown that the modal reductionfactors decrease with increasing order of modes [23] and that theassumption of elastic behaviour for higher modes may lead to rea-sonable results [30]. However, limited available results on framestructures have shown that inelasticity can also affect highermodes. Applying a Multi-Mode Pushover procedure (MMP), Sasakiet al. [31] provided evidence that there is a possibility that the 2ndmode exceeds the elastic limit, while the 1st and 3rd modes re-main elastic. In other words, it is possible that a higher mode turnsnonlinear while lower modes remain linear, as was shown by Paretet al. [32] for a 17-storey steel frame building. Thus, the assump-tion that the reduction factors Ry decrease with increasing mode-order might be inaccurate in several cases. It is noted that,although local ductility is evidently related to the total deforma-tion of the structure, under the assumption that modal analysiscan be extended to nonlinear response member deformations areassociated with the corresponding modal displacements and, thus,
the notion of modal ductility can be established. On the other hand,the assumption of elastic higher-mode response might result inconservative predictions of storey shear forces [33]. Indicatingthe inconsistency of using the elastic modes for inelastic behav-iour, Sullivan et al. [34] proposed a new modal superpositionmethod that uses transitory inelastic modes.
Except of the standard MRSA method, several nonlinear staticprocedures (NSP) (or push-over analyses) have been proposed toevaluate the seismic performance of MDOF structures. EC8 [28]incorporates the N2 method, originally proposed by Fajfar and Fis-chinger [35]. However, the selection of a single lateral force distri-bution is believed to provide accurate results only for structuresdominated by the first mode. To assess the contribution of highermodes of MDOF structures, several multi-mode pushover methodshave been proposed in the literature [36–40]. Some of them implyan adaptive lateral load vector [41,42], while others attempt tocapture the probabilistic nature of the seismic response and thecontinuous modification of the dynamic characteristics of MDOFsystems at different intensity levels [43]. A detailed discussion onsome of these methods can be found in [42]. Finally, several seis-mic codes and design standards, such as Eurocode 8 [28], ASCE/SEI 7-05 [44] and Tall Buildings Initiative [45], suggest, as an alter-native to the common MRSA, LSA or NSPs methods, to conduct anumber of NLRHA in order to properly account for higher mode ef-fects. The proper selection and scaling of the seismic records to beused as base excitations remains an issue of research [46].
In the investigation presented herein, higher mode effects on anine-storey RC plane frame structure are examined. The selectedframe meets the provisions of Eurocode 8 [28] for the assessmentof the inelastic response through a single-mode pushover proce-dure. For the estimation of higher-mode effects, the UncoupledModal Response History Analysis (UMRHA) method is applied.The method was originally developed as a precursor of the MPAmethod [36]. A modified Modal Response Spectrum Analysis(mMRSA) is also proposed, which, in contrast to the standardMRSA, uses inelastic response spectra without assuming a uniquevalue of Ry for all modes. The idea of using inelastic spectra orempirical Ry–l formulas for the calculation of the maximum modaldisplacements and accelerations was also proposed by Goel andChopra [47] as a possible simplification of MPA. However, inmMRSA, storey deformations and internal forces are not extractedfrom the pushover database as in MPA, but are directly calculatedfrom the modal responses as explained in the following section.
The effectiveness of these methods and other commonly usedones, as the standard MPA [36], the modified MPA [37], the N2[35] and the extended-N2 [39], is assessed by comparison of the re-sults for a set of earthquake records with the ones of NLRHA. Itmust be noted that there are other methods available in the liter-ature which may also provide results of the same accuracy, as forexample the Modified Modal Superposition method (MMS) pro-posed by Priestley and Amaris [29] and other similar ones that con-sider elastic response for higher modes. Those methods, however,are more oriented at design, while this study is more centered onevaluating the ductile response of higher modes.
The results of the analyses show that the inertial forces may bestrongly affected by the higher modes of vibration even for a first-mode dominated frame structure. The suggested mMRSA proce-dure, and the other examined multimode pushover methods suchas MPA, may provide an accurate estimation of these forces, whileN2 leads to non-conservative results.
2. Considered methods of analysis
The results that are presented in the next section were obtainedusing several methods for the nonlinear analysis of structures that

C.A. Maniatakis et al. / Engineering Structures 56 (2013) 417–430 419
are briefly presented in the following. Most of them are based onthe combination of modal responses. It should be noted, however,that the application of modal analysis to nonlinear response, whichhas been widely adopted in the design of new structures and theassessment of the capacity of existing ones, is an assumption thatlacks conceptual accuracy, because: (i) the spread of inelasticity instructural members produces a continuous reduction in stiffnessthat changes mode shapes; and (ii) the coupling between modescan be neglected for low levels of inelasticity only. Even thoughthe modification of mode shapes is directly or indirectly addressedby many methods, the application of modal analysis to study dam-age that implies high levels of nonlinearity, based on an assump-tion valid for minor excursions into the nonlinear range, remainsa shortcoming of these methodologies.
2.1. NLRHA method
In case of inelastic behaviour, the differential equation that gov-erns the response of an MDOF structure with N degrees of freedomis [6]:
½m� � f€ug þ ½c� � f _ug þ ffSgðfug; signf _ugÞ ¼ �½m� � fig � €ugðtÞ ð1Þ
where [m] and [c] are the mass and damping matrices of the sys-tem; {u} is the lateral displacements vector; {i} is the influence vec-tor; {fS} is the vector of nonlinear lateral forces which depend on thehistory of the deformation; and €ugðtÞ is the ground acceleration.
In the standard Non-Linear Response History Analysis (NLRHA),which is generally considered the most accurate among the avail-able methods of nonlinear analysis, Eq. (1) is solved numerically. Inthe original presentation of most of the procedures mentioned inthe Introduction, the results were compared with the NLRHA con-sidering this method as the reference method to assess accuracy.However, it should be kept in mind that the accuracy of NLRHAmight be sensitive to the integration technique applied. Dokainishand Subbaraj [48] and Subbaraj and Dokainish [49] provided acomprehensive discussion on relative merits, computational as-pects and stability issues of some of the most popular available di-rect time-integration methods. For the analyses presented herein,SAP 2000 [51] was employed to determine the nonlinear response,which uses the Hilber-Hughes-Taylor alpha method to solve Eq.(1). It should be noted, however, that more elaborate integrationschemes than NLRHA are available today, such as time stepping ap-proaches with prescribed functions for displacement and accelera-tion within each time step [50].
2.2. UMRHA method
The Uncoupled Modal Response History Analysis (UMRHA)method is a valuable tool to account for higher mode effects, sinceit allows examining time-history response for each separate modeof vibration taking into consideration inelasticity [36].
Chopra and Goel [36] showed that the coupling between normalmodes can be neglected in relatively low levels of inelasticity and,thus, the superposition rule can be expanded to inelastic behav-iour. Based on this assumption, instead of Eq. (1), N independentnonlinear equivalent SDOF systems may be solved, governed bythe following equation of motion, valid for the nth degree offreedom:
€DnðtÞ þ 2 � fn �xn � _DnðtÞ þFsn
Ln¼ �€ugðtÞ ð2Þ
where Dn(t) is the time history of the deformation and dot denotesdifferentiation with respect to time; fn and xn are the damping ratioand natural frequency of the nth mode, respectively; Fsn is the lat-eral resisting force for the nth mode and Ln is the nominator ofthe participation factor Cn given by
Cn ¼Ln
Mn; Ln ¼
XN
n¼1
mj �ujn; Mn ¼XN
n¼1
mj � ðujnÞ2 ð3Þ
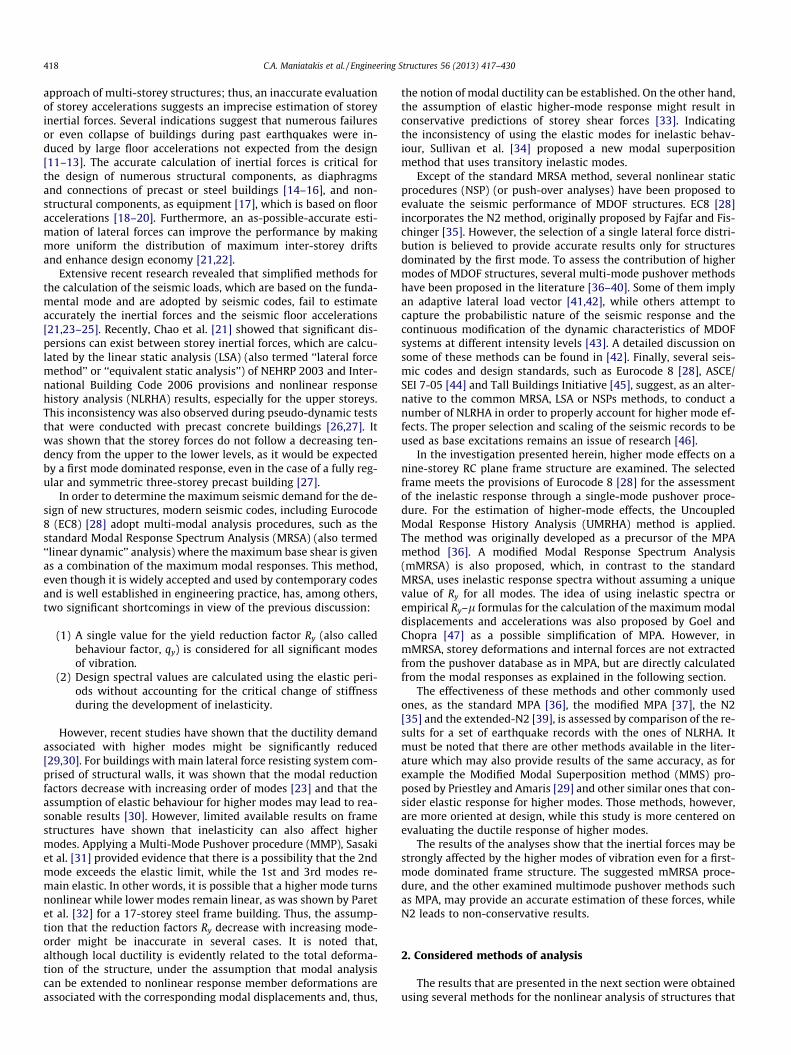
In Eq. (3), mj is the mass associated with the jth degree of freedomand ujn is the jth component of the nth mode. The lateral force–dis-placement relationships, Fsn/Ln–Dn, for the equivalent SDOF systemcan be obtained in two steps, as shown in Fig. 1: firstly pushoveranalyses are performed for the MDOF system for constant shapedlateral force vectorsfs�ng ¼ ½m� � fung and the base shear versus roofdisplacement curves, Vbn–urn, are obtained; and secondly the Vbn–urn curves are transformed to Fsn/Ln–Dn applying the followingequations:
Fsny
Ln¼ Vbny
Ln � CnDny ¼
urny
Cn �urnð4Þ
where the subscript ‘y’ denotes yielding and the subscript ‘r’ de-notes roof. Note that Fsny/Ln = Any, the yield acceleration. The numer-ical solution of Eq. (2) allows estimating the contribution of the nthmode to the overall response by applying the following equation,similarly to the elastic behaviour:
funðtÞg ¼ fung � Cn � DnðtÞ ð5Þ
while the total response is obtained from the superposition of themodal contributions.
2.3. MPA and MMPA methods
The MPA method is a simplification of the UMRHA methodaccording to which the peak deformation Dn of the nth SDOF sys-tem is calculated by a pushover analysis instead of solving Eq.(2). The corresponding maximum roof displacement, urn, of theMDOF system is determined applying Eq. (5). The desired responsevalues for each mode are extracted from the pushover databasesfor the corresponding maximum roof displacement and the modalresponses are combined applying typical combination rules asSRSS and CQC.
A modified version of MPA (denoted MMPA) has been proposedby Chopra et al. [37], according to which a single pushover is per-formed for the first mode only and the contribution of the highermodes is calculated for elastic response. The consideration of elas-tic response for higher modes has been widely adopted in the liter-ature, e.g. [3,8,29].
2.4. mMRSA method
The method mMRSA is proposed here as a modification of MPAthat uses the concept of the standard Modal Response SpectrumAnalysis (MRSA). The method considers modal uncoupling simi-larly to MPA and UMRHA. In contrast to the standard MRSA, inwhich the higher modes are considered with the same reductionfactor as the first mode, in mMRSA different reduction factors, Ry
are applied to each mode. The assumption of a single Ry for allmodes is not valid and leads to an underestimation of floor shearforces and accelerations. In mMRSA, the actual reduction factor,Rny, is calculated for each mode n from the equation:
Rny ¼SAelðTn; fnÞ
Anyð6Þ
where SAel is the elastic spectral acceleration. As observed by Sasakiet al. [31] and will be shown in the ensuing, the resulting reductionfactors are neither the same for all modes, nor are equal or less thanone for all higher modes denoting elastic behaviour. Their value de-pends on the structure characteristics and the shape of the responsespectrum.
(a) (b)
Fig. 1. (a) Vbn–urn pushover curve of the nth mode; (b) corresponding Fsn/Ln–Dn relationship for the equivalent SDOF inelastic system.
420 C.A. Maniatakis et al. / Engineering Structures 56 (2013) 417–430
In case that the post-yield stiffness of the equivalent SDOF systemis zero, the maximum inelastic acceleration, An, is equal to the yieldacceleration, Any. For systems with positive post-yield stiffness, An
will be larger than Any. Both the maximum acceleration An and themaximum displacement Dn can be calculated either from inelasticspectra or by applying proper relationships (Ry–l relationships)available in the literature (e.g. [52]). The plasticity index ln of thenth mode is equal to the ratio of the maximum displacement Dn overthe yield displacement Dny of the equivalent SDOF system:
ln ¼Dn
Dnyð7Þ
With An and Dn known for each equivalent SDOF, the modal maximafor the MDOF system can be calculated and the total response canbe determined applying a standard combination rule, as SRSS orCQC similarly to the standard MRSA.
The steps of the mMRSA method can be outlined as follows:
Step 1: Estimate the dynamic characteristics of the elastic MDOFsystem, specifically natural frequencies xn and mode vectors{un}.Step 2: Perform pushover analyses for the first K modes that areconsidered significant for the overall response with constant lat-eral force vectors fs�ng ¼ ½m� � fung and produce Vbn–urn curves.Step 3: Convert the pushover curves to bilinear form [36] anddetermine Vbny and urny.Step 4: Develop the Fsn/Ln–Dn relationships using Eq. (4).Step 5: Calculate the maximum displacement Dn and maximumacceleration An of the equivalent nth inelastic SDOF as describedabove.Step 6: Calculate the maximum response quantities for the nthmode at the jth level from the following equations:
ujn ¼ Cn �ujn � Dn
Fjn ¼ ujn � Cn �mj � An
IDRjn ¼ujn�uj�1;n
hj� Cn � Dn
Vjn ¼XN
l¼j
Cn �ml �uln � An
9>>>>>>>=>>>>>>>;
ð8Þ
where u, F, IDR and V denote displacement, storey inertial force, in-ter-storey drift and storey shear force, respectively.
Step 7: Evaluate the total response quantities applying a stan-dard combination rule, e.g. SRSS, to combine the modal quanti-ties of the K important modes:
uj ¼ffiffiffiffiffiffiffiffiffiffiffiffiffiffiffiffiffiffiPK
n¼1u2jn
q¼
ffiffiffiffiffiffiffiffiffiffiffiffiffiffiffiffiffiffiffiffiffiffiffiffiffiffiffiffiffiffiffiffiffiffiffiffiffiffiffiffiffiffiPKn¼1ðCn �ujn � DnÞ2
q
Fj ¼ffiffiffiffiffiffiffiffiffiffiffiffiffiffiffiffiffiPK
n¼1F2jn
q¼
ffiffiffiffiffiffiffiffiffiffiffiffiffiffiffiffiffiffiffiffiffiffiffiffiffiffiffiffiffiffiffiffiffiffiffiffiffiffiffiffiffiffiffiffiffiffiffiffiffiffiffiPKn¼1ðujn � Cn �mj � AnÞ2
q
IDRj ¼ffiffiffiffiffiffiffiffiffiffiffiffiffiffiffiffiffiffiffiffiffiffiPK
n¼1IDR2jn
q¼
ffiffiffiffiffiffiffiffiffiffiffiffiffiffiffiffiffiffiffiffiffiffiffiffiffiffiffiffiffiffiffiffiffiffiffiffiffiffiffiffiffiffiffiffiffiffiffiffiffiffiffiffiffiPKn¼1
ujn�uj�1;nhj
� Cn � Dn
� �2r
Vj ¼ffiffiffiffiffiffiffiffiffiffiffiffiffiffiffiffiffiffiPK
n¼1V2jn
q¼
ffiffiffiffiffiffiffiffiffiffiffiffiffiffiffiffiffiffiffiffiffiffiffiffiffiffiffiffiffiffiffiffiffiffiffiffiffiffiffiffiffiffiffiffiffiffiffiffiffiffiffiffiffiffiffiffiffiffiffiffiPKn¼1ð
PNl¼jCn �ml �uln � AnÞ2
q
9>>>>>>>>>=>>>>>>>>>;
ð9Þ
The mMRSA method described above is similar to MPA andresembles the standard, design oriented, Modal Response Spec-trum Analysis (MRSA). The pushover analyses performed withinStep 2 are only used to determine the characteristics of theequivalent SDOF systems, while the other maximum responsequantities rn are not extracted from the pushover databases asin MPA but can be evaluated based on the deformations andforces of each mode according to Eq. (8). For example, the rota-tions can be evaluated based on maximum IDR values. Similarly,the estimation of storey forces for the nth mode can be obtainedfrom the maximum acceleration An instead of calculating themfrom the column shears corresponding to the maximum roof dis-placement, which would be extracted from the pushover data-base and added according to the standard MPA. In this sense,mMRSA can be thought as a simplification of the MPA method[47].
The mMRSA method retains some of the significant shortcom-ings of the NSPs and MPA methods, specifically:
(i) Further research is needed to assess the error introduced byomitting the coupling of modes during inelastic response.
(ii) The development of Vbn–urn pushover curve for each mode isnot always possible due to changes in the direction of theroof deformation with increasing lateral load, a phenome-non termed as ‘‘reversal’’ [53]. The reversals might be relatedto the formation of a local plastic mechanism, not detectedby the traditional 1st mode NSPs. Thus, when a new struc-ture is designed, a reversal associated with a higher modemight require modifications in strength or ductility to avoidthis possible mechanism.
(iii) The method might not be accurate for stiffness-degradingsystems [54].
(iv) Proper modifications should be made for plan-asymmetricstructures where the translational and torsional motionsare coupled.

Table 1Dynamic properties of the equivalent inelastic SDOF systems for the three first modesof vibration.
Property Mode 1 Mode 2 Mode 3
Ln (kN s2/cm) 6.25 2.18 1.41Cn 1.297 0.463 0.294Fsny/Ln (cm/s2) 68.41 594.41 1619.14Dny (cm) 4.9 6.5 6.4Tn (s) 1.681 0.658 0.396
C.A. Maniatakis et al. / Engineering Structures 56 (2013) 417–430 421
2.5. Standard and extended N2 methods
The method N2 [35] is similar to MPA, but only the first mode isconsidered. The equivalent linear SDOF system is considered elas-tic–perfectly plastic without post-yield stiffness. The response iscalculated using Ry–l relations. An improvement of this methodwas proposed by Kreslin and Fajfar [39] (extended N2), in whichhigher modes are also considered but assuming that they respondelastically. The final response of a MDOF structure is calculatedfrom a combination of the standard N2 method and an elasticMRSA. In the extended N2 method [39], the final response of aMDOF structure is calculated by the results of the standard N2method applying a correction factor that considers higher modesthrough a scaled elastic MRSA. It is suggested that for local quanti-ties the correction factors obtained from storey drifts should beapplied.
3. Case study
The above-mentioned methods were applied in a case study forthe evaluation of their accuracy, using the results of NLRHA as thebasis of comparison, and the assessment of higher mode effects.For this case study, the central frame of a nine storey plan-sym-metric reinforced concrete building was selected. The buildingwas designed according to the Greek seismic design code EAK2000 [55] for ground acceleration 0.24 g and behaviour (reduction)factor q = 3.5. The floor plan of the building and the elevation of theframe are shown in Fig. 2. The analyses were performed using SAP2000 [51]. Beams and columns where modelled as linear elementswith tri-linear plastic hinges at their ends.
The dynamic characteristics of the equivalent inelastic SDOFsystems for the first three modes are given in Table 1. Note thatthe modal mass participating ratios for the 1st, 2nd and 3rd modesare approximately 80%, 10% and 4%, respectively. Therefore, thestructure might be considered as first-mode dominated accordingto the modal mass criterion employed by seismic codes, which
Fig. 2. Case study structure selected for the analysis: (a) typical floor plan
require that a total effective modal mass of at least 90% of the totalstructural mass should be accomplished for an acceptably accurateMRSA analysis [28]. This provision is based on the fact that theeffective modal mass is critical for the contribution of each modeto the base shear. It should be noted, however, that the actual con-tribution of the nth mode to the response of the structure is alsorelated to the spectral ordinate An corresponding to the naturalperiod Tn and damping ratio fn [5], thus it might be significantlydifferent for different quantities. For example, for structures withlong first period, the spectral acceleration of the first mode is gen-erally much smaller than the one of the second mode, thus, thecontribution of the second mode to the inertial forces might be sig-nificant. Concerning displacements, however, the spectral ampli-tudes generally increase with period; therefore the contributionof the first mode is expected to be indeed dominant. The accuracyof assuming a domination of the first mode for the nonlinear re-sponse of the considered frame will be assessed in the ensuing.
The frame is regular in elevation and has a fundamental periodT1 = 1.68 s, which is smaller than 2.0 s and four times larger thanthe transition period TC between the constant spectral accelerationand the constant spectral velocity regions of the design spectrum.Therefore, according to Eurocode 8 – part 1 [28], the contributionof the higher modes can be neglected in the design and the LateralForce Analysis (LFA) method can be applied. Also, N2 method canbe applied according to Eurocode 8 – part 3 [56].
of the building and (b) elevation view of the 9-storey central frame.

Fig. 3. Comparison of the mean acceleration spectrum of the seismic recordsselected and the design spectrum for 5% damping.
422 C.A. Maniatakis et al. / Engineering Structures 56 (2013) 417–430
Nonlinear response history analyses were performed for 34earthquake records selected from the NGA database [57] andincluding some major Greek earthquakes [58]. The selected recordshave different duration, frequency and energy characteristics. Ta-ble 2 summarizes the main characteristics of the selected earth-quake ground motions, while in Fig. 3 the elastic responsespectra of all records and their average spectrum are comparedwith the design spectrum. It is seen that the selected earthquakescorrespond to significantly stronger ground motions than the de-sign earthquake, which was done in purpose in order to produceinelastic response not only of the first mode but also of the secondor even the third mode if possible. It is noted that, although thespectral acceleration values of the second and third modes are highfor most records, inelastic response of these modes was not certain,since the corresponding yield accelerations of the equivalentSDOFs are also large (Table 1).
4. Presentation of the results
4.1. Contribution of higher modes to the response
In order to study the higher mode effects on the response of theRC planar frame described above, nonlinear analysis using UMRHAwere performed for the 34 base excitations shown in Table 2. Thismethod has the advantage that allows studying the time historiesof modal displacements and accelerations, similarly to the NLRHA.The first three modes of vibration were considered in these analy-ses. In the results presented herein, member forces, as bending mo-ments of the structural members, are not included, since emphasisis given on the two most important higher-mode phenomena,namely the shear amplification and the floor acceleration magnifi-cation, which involve global forces. It is noted, however, that in
Table 2Characteristics of earthquake records used in the study.
Event Year Station M
Imperial Valley, USA 1940 117 El Centro Array #9 7
Kern Country, USA 1952 USGS 1095 Taft Lincoln School 7
San Fernando, USA 1971 CDMG 279 Pacoima Dam 6
Friuli, Italy 1976 8023 Buia 5
Friuli, Italy 1976 8012 Tolmezzo 6
Imperial Valley, USA 1979 USGS 5053 Calexico Fire Station 6
5055 Holtville Post Office
USGS 952 El Centro Array #5
Kalamata, Greece 1986 Kalamata 1 6
Loma Prieta, USA 1989 47381 Gilroy Array #3 6
Erzincan, Turkey 1992 95 Erzincan 6
Northridge, USA 1994 DWP 77 Rinaldi Receiving Station 6
Hanshin (Kobe), Japan 1995 CUE 99999 Shin-Osaka 6
JMA 99999 KJMA 6
Duzce, Turkey 1999 ERD 99999 Bolu 7
ERD 99999 Duzce
Lefkas, Greece 2003 Lefkas 1 6
multi-mode nonlinear procedures, member forces must be calcu-lated from member deformations, using the member force–defor-mation relationship, and not from the superposition of the modalcontribution, since the latter may lead to member forces that ex-ceed the specified member capacity [54].
As a representative case, the results of UMRHA for the ELC180component of the Imperial Valley (1940) record are presented indetail. Time histories of the obtained results at storey levels 1, 5and 9 are shown in Fig. 4, while snapshots at the time of maximumtop displacement and the time of maximum base shear are given inFig. 5. From Figs. 4a and 5a it can be observed that the 2nd and the3rd mode contribution to the storey displacements is very small. Asimple explanation can be given by studying the elastic responsespectra of the record shown in Fig. 6. Note that for the specific
W Record Repicentral (km) PGA (cm/s2) PGV (cm/s)
.0 ELC180 13.0 307.1 29.8ELC270 13.0 210.9 30.2
.4 TAF021 43.5 153.0 15.3TAF111 43.5 174.6 17.5
.6 PCD164 11.9 1202.7 112.5PCD254 11.9 1138.0 54.3
.9 BUI000 17.1 107.9 10.2BUI270 17.1 89.3 10.6
.5 TMZ000 20.2 344.3 22.0TMZ270 20.2 309.0 30.8
.5 CXO225 17.7 269.8 21.2CXO315 17.7 198.2 16.0HVP225 19.8 248.2 48.8HVP315 19.8 216.8 49.8E05140 27.8 509.1 46.9E05230 27.8 371.8 90.5
.0 KAL-L 12.0 229.3 30.9KAL-T 12.0 263.9 24.0
.9 G03000 31.4 544.5 35.7G03090 31.4 360.0 44.7
.7 ERZ-NS 9.0 505.2 83.9ERZ-EW 9.0 486.6 64.3
.7 RRS228 10.9 822.1 166.1RRS318 10.9 463.0 73.0
.9 SHI000 46.0 238.4 37.8SHI090 46.0 208.0 27.9
.9 KJM000 18.3 805.4 81.3KJM090 18.3 587.6 74.3
.1 BOL000 41.3 714.2 56.4BOL090 41.3 806.4 62.1DZC180 1.6 341.4 60.0DZC270 1.6 524.8 83.5
.2 LEF065 12.0 333.4 14.7LEF335 12.0 408.6 15.7

Fig. 4. Time histories of the response at selective storey levels for the 1st mode (top line), the 2nd mode (second line), the 3rd mode (third line) and totally (bottom line),obtained using UMRHA: (a) displacements; (b) inter-storey drifts; (c) storey inertial forces; (d) storey shear forces (ELC180 component of Imperial Valley, 1940, earthquake).
C.A. Maniatakis et al. / Engineering Structures 56 (2013) 417–430 423
ground excitation, only the first mode response is inelastic, withreduction factor Ry1 = 2.53 and ductility l1 = 2.58, while the secondand the third modes respond elastically. Since Ry1 ffi l1, the equaldisplacement rule is valid and the inelastic response of the firstmode can be estimated from the elastic displacement responsespectrum. The first eigenperiod (T1 = 1.68 s) corresponds to theascending branch of the displacement spectrum and, thus, the firstmode comprises a greater value of spectral displacement, SD, thanthe 2nd or the 3rd modes which have periods T2 = 0.66 s andT3 = 0.40 s, respectively (Table 1). These lower values of spectraldisplacement for the higher modes are further reduced concerningthe displacement at each level, as they are multiplied by the corre-sponding participation factors Cn < 1.0 (Table 1).
The contribution of higher modes to the response, however, issignificant when the inter-storey drifts (IDRs) are considered, asshown in Figs. 4b and 5b. In this case, the second mode contributesto the response of the upper floors as much as the first one. Themore significant effects of the higher modes on IDR than on storeydisplacements is attributed to the fact that IDR is affected by therelative displacements of adjacent storeys, i.e. by ujn–uj�1,n, whichare generally larger for the higher modes at the upper storeys.Thus, the first mode is characterized by smoother ujn–uj�1,n distri-butions and larger Dn and Cn values, whereas the second mode ischaracterized by larger ujn–uj�1,n changes and smaller Dn and Cn
values. The ‘‘competition’’ between these parameters determinesthe extent of the contribution of the higher modes to IDR.
Concerning the inertial forces Fj that develop at the floors, thecontribution of higher modes is very important along the wholeheight of the frame and can be larger than the contribution of thefirst mode, as shown in Figs. 4c and 5c. It must be noted, however,that the contribution of the 2nd and the 3rd modes on the floor
accelerations is somehow exaggerated for the specific base excita-tion, because they responded elastically, while the 1st mode yielded.It must also be noticed that typically, the spectral accelerations ofthe higher modes are larger than the one of the first mode, sincethe first period is usually located outside the acceleration-sensitivearea of the response spectrum, which counter counts their smallerparticipation factors Cn. For the El Centro earthquake under consid-eration, the inertial forces of the 1st mode at the top floor were smal-ler than the ones of both the 2nd and the 3rd modes (Fig. 4c). Similarobservations were made for nearly all the seismic events examined.
The contribution of higher modes is also important for the esti-mation of storey shear forces, as shown in Figs. 4d and 5d.Although the first mode dominates, the 2nd and the 3rd modescontribute to the total shear with a significant high-frequencycomponent, which increases considerably the maximum values.
4.2. Evaluation of the methods of analysis
In order to assess the accuracy of the methods of analysis pre-sented in Section 2, the response of the RC planar frame was calcu-lated for all 34 ground motions shown in Table 2. The results of theNLRHA were serving as the basis of comparison in order to assessthe accuracy of the other methods.
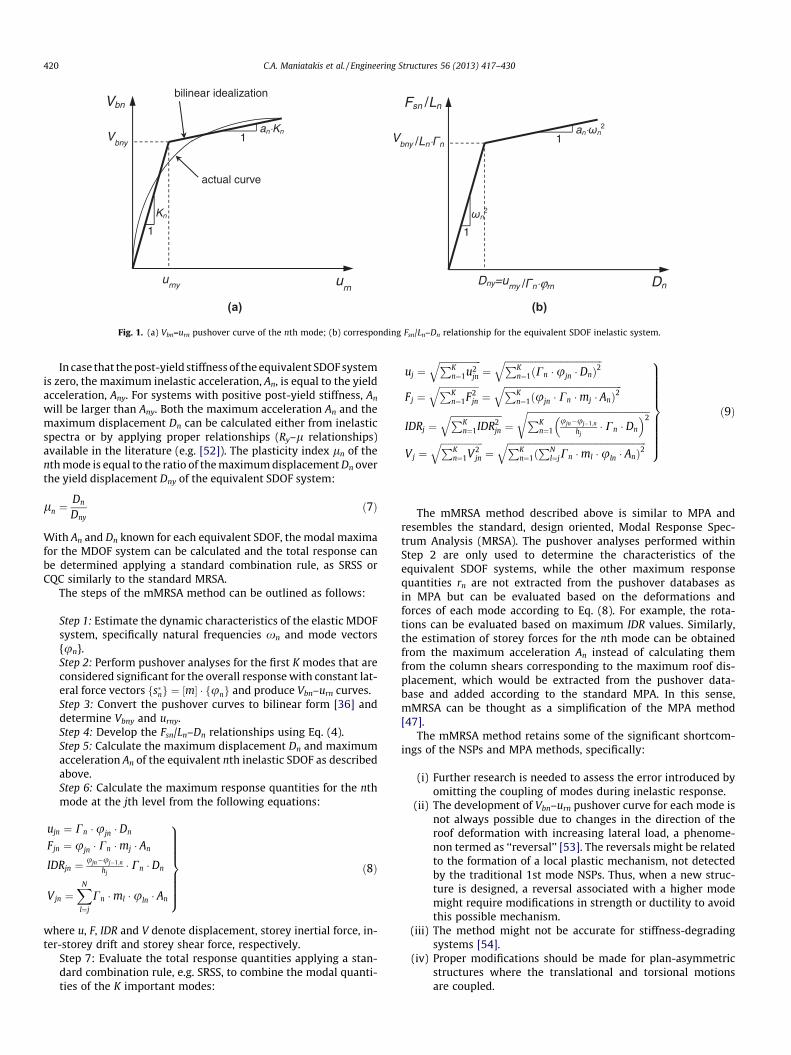
The envelopes of the maximum storey displacements, inter-sto-rey drifts, storey inertial forces and storey shear forces, obtainedwith the above-mentioned methods, plus a modified version ofthe mMRSA, denoted as nmMRSA, are depicted in Fig. 7 for theELC180 component of the Imperial Valley (1940) earthquake.Method nmMRSA is similar to mMRSA with the exception that itassumes inelastic response only for mode 1 and elastic responsefor the rest modes.
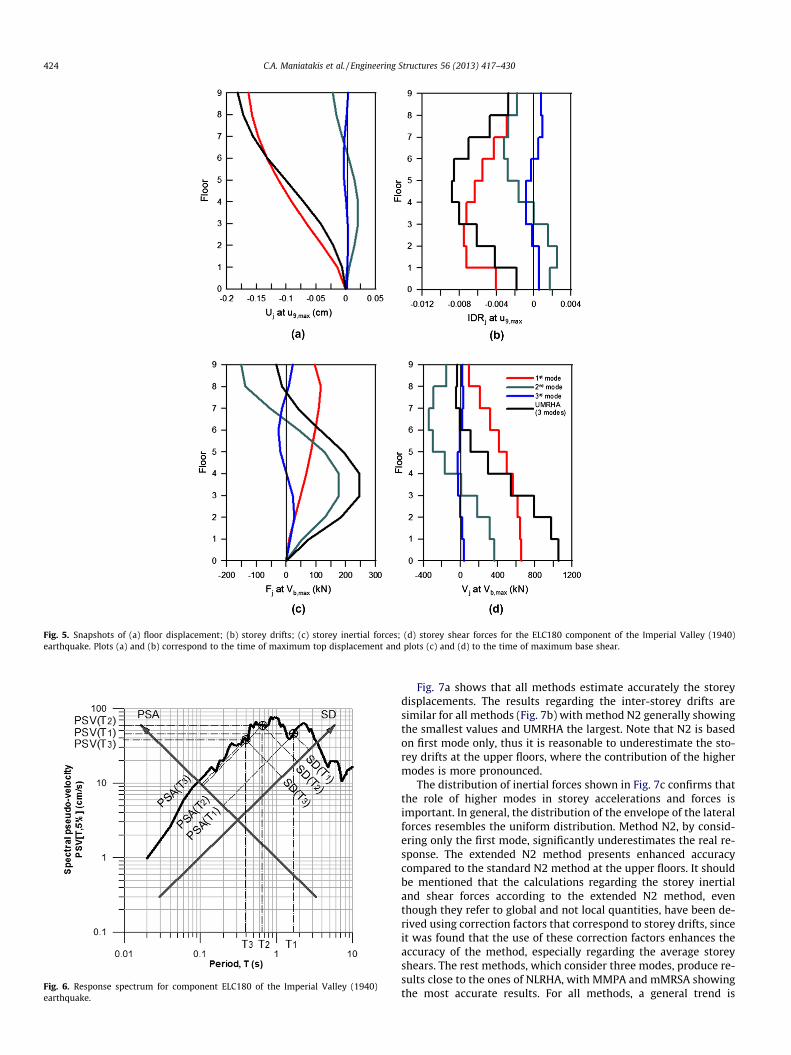
Fig. 5. Snapshots of (a) floor displacement; (b) storey drifts; (c) storey inertial forces; (d) storey shear forces for the ELC180 component of the Imperial Valley (1940)earthquake. Plots (a) and (b) correspond to the time of maximum top displacement and plots (c) and (d) to the time of maximum base shear.
Fig. 6. Response spectrum for component ELC180 of the Imperial Valley (1940)earthquake.
424 C.A. Maniatakis et al. / Engineering Structures 56 (2013) 417–430
Fig. 7a shows that all methods estimate accurately the storeydisplacements. The results regarding the inter-storey drifts aresimilar for all methods (Fig. 7b) with method N2 generally showingthe smallest values and UMRHA the largest. Note that N2 is basedon first mode only, thus it is reasonable to underestimate the sto-rey drifts at the upper floors, where the contribution of the highermodes is more pronounced.
The distribution of inertial forces shown in Fig. 7c confirms thatthe role of higher modes in storey accelerations and forces isimportant. In general, the distribution of the envelope of the lateralforces resembles the uniform distribution. Method N2, by consid-ering only the first mode, significantly underestimates the real re-sponse. The extended N2 method presents enhanced accuracycompared to the standard N2 method at the upper floors. It shouldbe mentioned that the calculations regarding the storey inertialand shear forces according to the extended N2 method, eventhough they refer to global and not local quantities, have been de-rived using correction factors that correspond to storey drifts, sinceit was found that the use of these correction factors enhances theaccuracy of the method, especially regarding the average storeyshears. The rest methods, which consider three modes, produce re-sults close to the ones of NLRHA, with MMPA and mMRSA showingthe most accurate results. For all methods, a general trend is
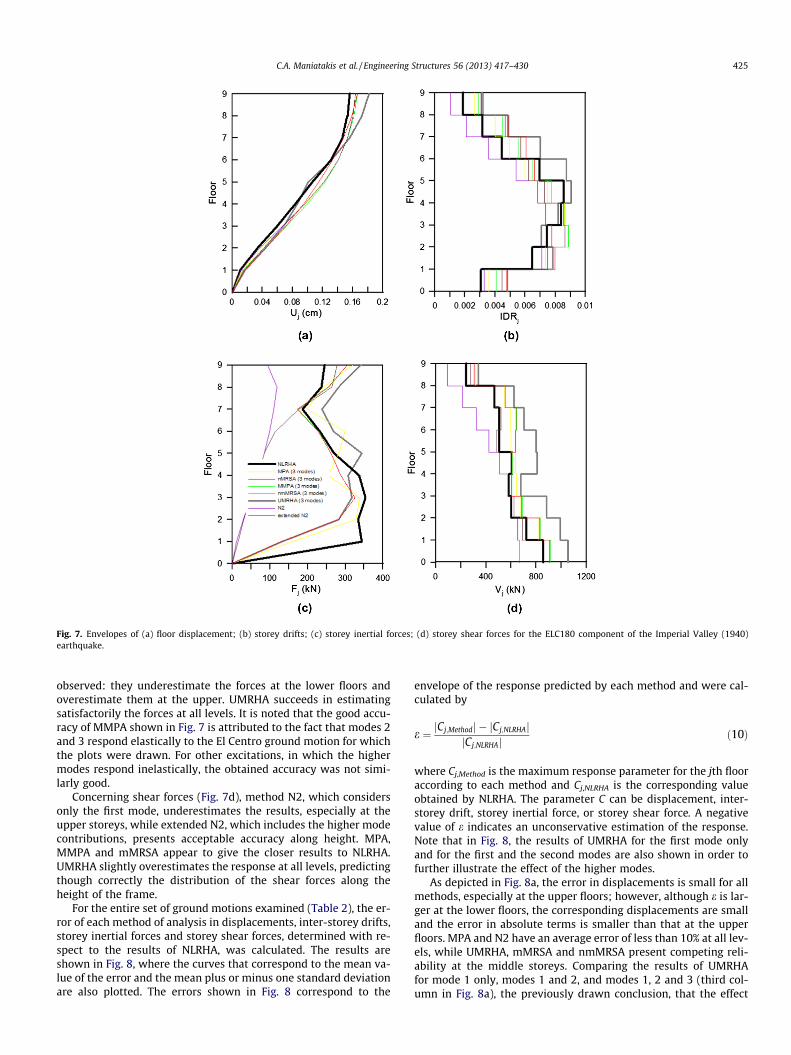
Fig. 7. Envelopes of (a) floor displacement; (b) storey drifts; (c) storey inertial forces; (d) storey shear forces for the ELC180 component of the Imperial Valley (1940)earthquake.
C.A. Maniatakis et al. / Engineering Structures 56 (2013) 417–430 425
observed: they underestimate the forces at the lower floors andoverestimate them at the upper. UMRHA succeeds in estimatingsatisfactorily the forces at all levels. It is noted that the good accu-racy of MMPA shown in Fig. 7 is attributed to the fact that modes 2and 3 respond elastically to the El Centro ground motion for whichthe plots were drawn. For other excitations, in which the highermodes respond inelastically, the obtained accuracy was not simi-larly good.
Concerning shear forces (Fig. 7d), method N2, which considersonly the first mode, underestimates the results, especially at theupper storeys, while extended N2, which includes the higher modecontributions, presents acceptable accuracy along height. MPA,MMPA and mMRSA appear to give the closer results to NLRHA.UMRHA slightly overestimates the response at all levels, predictingthough correctly the distribution of the shear forces along theheight of the frame.
For the entire set of ground motions examined (Table 2), the er-ror of each method of analysis in displacements, inter-storey drifts,storey inertial forces and storey shear forces, determined with re-spect to the results of NLRHA, was calculated. The results areshown in Fig. 8, where the curves that correspond to the mean va-lue of the error and the mean plus or minus one standard deviationare also plotted. The errors shown in Fig. 8 correspond to the
envelope of the response predicted by each method and were cal-culated by
e ¼ jCj;Methodj � jCj;NLRHAjjCj;NLRHAj
ð10Þ
where Cj,Method is the maximum response parameter for the jth flooraccording to each method and Cj,NLRHA is the corresponding valueobtained by NLRHA. The parameter C can be displacement, inter-storey drift, storey inertial force, or storey shear force. A negativevalue of e indicates an unconservative estimation of the response.Note that in Fig. 8, the results of UMRHA for the first mode onlyand for the first and the second modes are also shown in order tofurther illustrate the effect of the higher modes.
As depicted in Fig. 8a, the error in displacements is small for allmethods, especially at the upper floors; however, although e is lar-ger at the lower floors, the corresponding displacements are smalland the error in absolute terms is smaller than that at the upperfloors. MPA and N2 have an average error of less than 10% at all lev-els, while UMRHA, mMRSA and nmMRSA present competing reli-ability at the middle storeys. Comparing the results of UMRHAfor mode 1 only, modes 1 and 2, and modes 1, 2 and 3 (third col-umn in Fig. 8a), the previously drawn conclusion, that the effect

426 C.A. Maniatakis et al. / Engineering Structures 56 (2013) 417–430
of higher modes on the storey displacements is not important, isverified.
In Fig. 8b, the errors in inter-storey drifts are shown. For allmethods, the errors are larger at the upper and lower floors andsmaller at mid-height. MPA shows the smallest errors, less than10% at all levels except the upper floor where the error is less than20%. UMRHA with 3 modes, nMRSA and nmMRSA give conserva-tive results for the inter-storey drifts at the upper and lower sto-reys, with errors ranging from 40% to 52%. N2 presents thelargest negative values of e, underestimating the inter-storey driftsespecially at the upper floors. Extended N2 presents similar erroramplitudes, but overestimates the response, in general. Similar er-rors with N2 were obtained with UMRHA when only the first modewas used; the addition of the second and third modes did not de-crease the amplitude of the error, but produced positive values of e,yielding results to the safety side.
Concerning the floor inertial forces and the storey shear forces(Fig. 8c and d), nMRSA seems to be the more accurate, with errorsless than 23% at all levels. The worst results were obtained with N2and UMRHA for the 1st mode only, showing errors from �30% to�95% for the inertial forces and from 15% to �70% for the storeyshears, which were in the unsafe side in most cases. Addition ofthe 2nd and the 3rd mode in UMRHA significantly reduced the er-
Fig. 8. Errors in (a) floor displacement; (b) storey drifts; (c) storey inertial forces; (d) storline shows the mean value and dashed lines the mean plus/minus one standard deviati
ror. The other methods present similar accuracy, with errors rang-ing from about �50% for the inertial forces and from �25% for thestorey shears to more than 100% for both cases. It is interesting tonote that the extended N2 significantly improves the results com-pared to the standard N2 method specially as regards the storeyshears at all levels and inertial forces at higher storeys.
As evident from Fig. 8, the mean error significantly varies alongheight, even for the same method, depending on the responsequantity examined. For this reason, it would be difficult to definea unified error parameter to represent the accuracy of each meth-od. In Fig. 9, the average value of the mean error along height is de-picted. It is shown that the average error along height is stronglyrelated to the response parameter examined; thus, smaller valuesof error are related to storey displacements and inter-storey drifts,while more significant errors are observed in the estimation of sto-rey shears and inertial forces. Methods that consider only the firstmode of vibration, such as the N2 method and the UMRHA for thefirst mode only, present the most significant average error alongheight. The MPA method for three modes, the UMRHA methodincluding more modes beyond the first one and the mMRSA meth-od present more uniform values of average error regardless of theresponse parameter examined. The MMPA and the nmMRSA meth-ods, that consider elastic response for the higher modes, seem to
ey shear forces; of each method examined and for all records considered. Dark solidon.
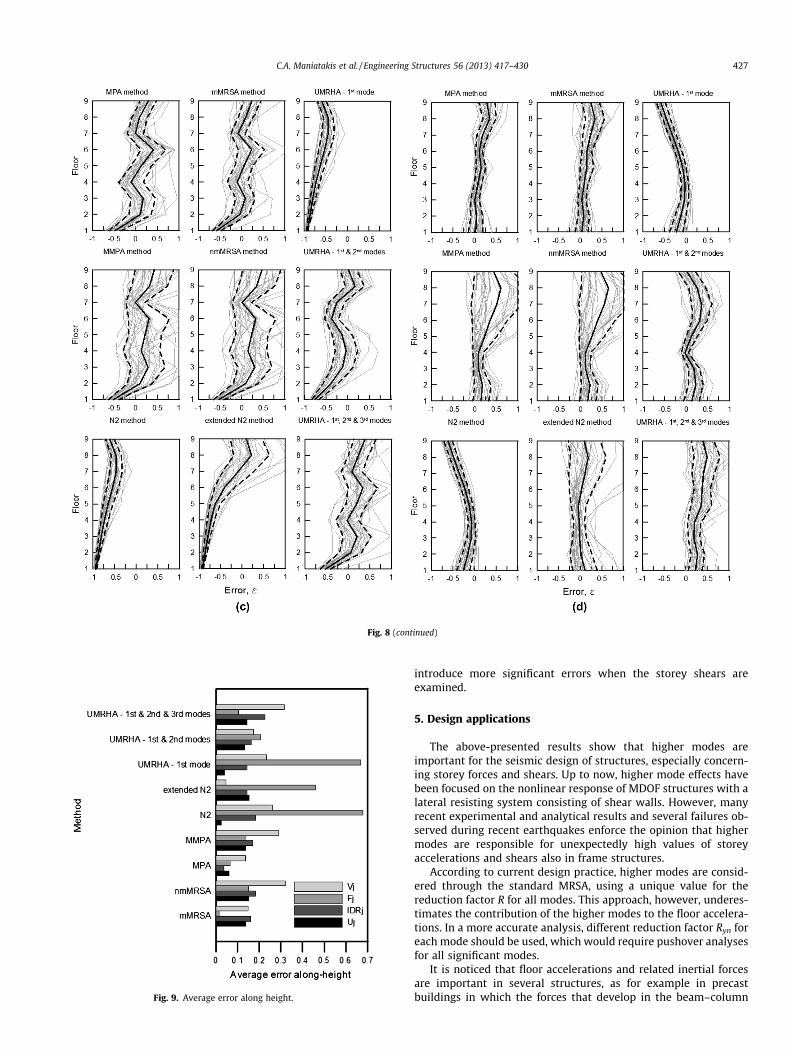
Fig. 8 (continued)
Fig. 9. Average error along height.
C.A. Maniatakis et al. / Engineering Structures 56 (2013) 417–430 427
introduce more significant errors when the storey shears areexamined.
5. Design applications
The above-presented results show that higher modes areimportant for the seismic design of structures, especially concern-ing storey forces and shears. Up to now, higher mode effects havebeen focused on the nonlinear response of MDOF structures with alateral resisting system consisting of shear walls. However, manyrecent experimental and analytical results and several failures ob-served during recent earthquakes enforce the opinion that highermodes are responsible for unexpectedly high values of storeyaccelerations and shears also in frame structures.
According to current design practice, higher modes are consid-ered through the standard MRSA, using a unique value for thereduction factor R for all modes. This approach, however, underes-timates the contribution of the higher modes to the floor accelera-tions. In a more accurate analysis, different reduction factor Ryn foreach mode should be used, which would require pushover analysesfor all significant modes.
It is noticed that floor accelerations and related inertial forcesare important in several structures, as for example in precastbuildings in which the forces that develop in the beam–column

Table 3Behaviour (reduction) and ductility factors for the equivalent inelastic SDOF systems.
No. Recorda Behaviour (reduction) factor Ductility factor
Ry1 Ry2 Ry3 l1 l2 l3
1 BUI000 1.47 0.52 0.09 1.22 0.52 0.092 BUI270 0.62 0.36 0.14 0.62 0.36 0.143 KAL-L 2.31 0.94 0.40 1.58 0.94 0.404 KAL-T 1.97 1.01 0.51 1.69 1.01 0.515 LEF065 2.85 1.68 0.61 2.25 1.26 0.616 LEF335 2.06 1.98 0.84 1.93 1.52 0.847 CXO225 1.26 0.60 0.43 1.23 0.60 0.438 CXO315 2.06 0.42 0.19 1.53 0.42 0.199 HVP225 2.08 0.74 0.33 2.68 0.74 0.33
10 HVP315 3.19 0.52 0.34 3.63 0.52 0.3411 E05140 3.70 0.83 0.55 7.09 0.83 0.5512 E05230 4.35 0.97 0.81 Collapse13 TMZ000 1.42 0.49 0.44 1.43 0.49 0.4414 TMZ270 1.08 1.67 0.52 1.08 1.37 0.5215 PCD164 9.73 1.09 1.75 9.43 1.09 1.4516 PCD254 4.40 1.76 1.47 3.29 1.92 1.3717 ERZ-NS 9.68 1.23 0.48 Collapse18 ERZ-EW 4.78 1.83 0.47 4.95 1.79 0.4719 RRS228 9.73 1.09 1.75 Collapse20 RRS318 6.63 1.56 0.85 5.93 1.59 0.8521 G03000 1.82 1.00 0.66 1.75 1.00 0.6622 G03090 4.79 0.64 0.29 3.18 0.64 0.2923 SHI000 1.72 1.48 0.32 2.18 1.44 0.3224 SHI090 3.06 1.12 0.34 1.63 1.13 0.3425 KJM000 8.28 3.28 1.38 5.29 3.87 1.2826 KJM090 4.97 3.15 1.38 6.19 3.14 1.3727 ELC180 2.53 0.95 0.37 2.58 0.95 0.3728 ELC270 2.42 0.71 0.35 2.30 0.71 0.3529 BOL000 4.01 1.51 0.98 3.53 1.46 0.9630 BOL090 3.42 1.97 0.84 2.80 1.66 0.8431 DZC180 4.24 1.43 1.10 4.49 1.43 1.0832 DZC270 6.04 1.81 0.62 6.39 1.94 0.6233 TAF021 1.37 0.61 0.22 1.41 0.61 0.2234 TAF111 2.27 0.49 0.24 1.88 0.49 0.24
a For corresponding earthquake see Table 2.
428 C.A. Maniatakis et al. / Engineering Structures 56 (2013) 417–430
connections and floor–beam connections depend on the seismicloads of the floors. It is evident that, if a unique reduction factorfor all modes were used in the design of such connections, theresulting joint forces would have been significantly underesti-mated. Thus, the importance of the correct consideration of thehigher modes becomes crucial, even for first-mode dominatedstructures.
The reduction factors Ryn and the displacement ductilities ln thatwere developed for all examined records are collected in Table 3 andgraphically depicted in Fig. 10. It is seen that the reduction factorshave different values for each mode, which proves the validity of
Fig. 10. Behaviour and ductility factors: (a) relationship between the behaviour factor Rrelationship between the behaviour factors Ry3 and Ry1.
the above statement. In general, there is a trend of Ry to decreasewith increasing order of mode, i.e., Ry1 P Ry2 P Ry3, as has also beenobserved by other researchers [23]; however, this observation can-not be generalized, since it is attributed to the flexural overstrengththat develops when the frame is deformed according to the secondand third modes. As shown in Table 1, the 2nd and the 3rd modesof the structure under consideration yield for significantly highervalues of the ratio Fsny/Ln than the 1st mode, namely 0.60 g and1.65 g, respectively. These large yield accelerations of the highermodes would require high spectral accelerations to provoke inelas-tic modal response. This flexural overstrength of the higher modes,which however might not be as much pronounced in other struc-tures, results in values of Ry2 and Ry3 smaller than Ry1, as shown inFig 10b and c respectively. There are only a few points that lie onthe Ry2 = Ry1 line, as shown in Fig. 10b, while many points of the Ry2 -� Ry1 space lie below the Ry2 = 1.00 line, denoting elastic responseaccording to the second mode. As regards the response of the thirdmode, elastic behaviour is noted for the majority of the records, asshown in Fig 10a and c. Further research is needed on this subject,as the factors that affect and control the flexural overstrength ofhigher modes have not been investigated enough.
It is evident from the above discussion that the reduction factorthat will be developed in each mode depends on the excitationcharacteristics. For example, for the PCD164 component of theSan Fernando (1971) earthquake and the RRS228 component ofthe Northridge (1994) earthquake, the elastic spectral accelerationfor the 3rd eigenperiod is quite large, resulting to a reduction factorR3y larger than R2y. Similar observations were made by Sasaki et al.[31] who reported cases in which the first mode remained elasticwhile higher modes responded nonlinearly.
When inelastic analyses are performed, the investigation re-ported herein showed that all methods examined predict satisfacto-rily storey displacements and inter-storey drifts. Concerning storeyforces and shears, MPA and mMRSA, which consider higher modes ina more accurate way than the other methods, produce the closest tothe NLRHA results. N2, which is based on the first mode only, failedto predict accurately the floor accelerations, while the extended N2seems to underestimate the inertial forces and slightly overestimatethe floor shear forces along the entire height, with the error depend-ing on the actual values of Ryn that are developed.
6. Conclusions
The assessment of the effect of higher modes on the nonlinearresponse of a 9-storey RC frame is investigated for 34 strongearthquake records using the Uncoupled Modal Response History
yn and ductility ln; (b) relationship between the behaviour factors Ry2 and Ry1; (c)

C.A. Maniatakis et al. / Engineering Structures 56 (2013) 417–430 429
Analysis (UMRHA) method. Additionally, the accuracy obtained byseveral methods which have been proposed in the literature toestimate the nonlinear response taking under consideration thecontribution of higher modes to the response (MPA, MMPA, UMR-HA, extended N2, mMRSA) is evaluated by comparing the resultswith the ones of the Non-Linear Response History Analysis(NLRHA). The comparison is not restricted to storey displacementsand inter-storey drifts, but it is extended to floor inertial forces andshears, which are of major importance for the design of severalstructural types, such as precast buildings with hinged beam–col-umn and floor–beam connections.
Based on the results of this investigation, the following conclu-sions can be drawn:
(a) Higher mode effects are significant even for planar, first-mode dominated RC frames, especially regarding inertialforces and storey accelerations at all floors and shear forcesat higher storeys. Displacements and inter-storey drifts areaffected significantly less.
(b) The contribution of higher modes to the storey inertial forcesand shear forces depends on the ground motion characteris-tics and the flexural overstrength associated with eachmode.
(c) The modal reduction factors Ryn that develop during earth-quakes are different for each mode and generally decreasewith increasing mode order. The adoption of a unique valueof R for all modes, which is determined from the response ofthe first mode, as is the current design practice, underesti-mates the storey accelerations and forces significantly. Onthe other hand, the assumption of linearly elastic responsefor higher modes might overestimate the response.
(d) The mMRSA method can predict both deformation and forcequantities satisfactorily, competing in accuracy with theMPA method. These methods provide the means to estimatethe modal reduction factors Ryn for a given base excitation,which can be used to design structural and non-structuralcomponents.
(e) The MMPA and the extended N2 methods provide accept-able results on the average, except of the underestimationof the inertial forces by extended N2; however, their accu-racy depends on the satisfaction of the assumption for elas-tic higher mode response.
(f) The standard N2 method estimates the displacements satis-factorily but significantly underestimates the storey acceler-ations and forces.
References
[1] Blakeley RWG, Cooney RC, Megget LM. Seismic shear loading at flexuralcapacity in cantilever wall structures. Bull NZ Soc Earthq Eng 1975;8:278–90.
[2] Kabeyasawa T, Ogata K. Ultimate-state design of R/C wall-frame structures.Trans Jpn Concr Inst 1985;6:629–36.
[3] Keintzel E. Ductility requirements for shear wall structures in seismic areas. In:Proc of the 8th world conference on earthquake engineering, vol. 5; 1984. p.671–7.
[4] Paulay T, Priestley MJN. Seismic design of reinforced concrete and masonrybuildings. New York: John Wiley & Sons; 1992.
[5] Chopra A. Dynamics of structures: theory and applications to earthquakeengineering. 3rd ed. Upper Saddle River: Pearson Prentice Hall; 2007.
[6] Rutenberg A, Nsieri E. The seismic shear demand in ductile cantilever wallsystems and the EC8 provisions. Bull Earthq Eng 2006;4:1–21.
[7] Pennucci D, Sullivan TJ, Calvi GM. Evaluation of higher mode effects in tallbuilding response. In: Proc of the 14th European conference on earthquakeengineering, vol. 8; 2010. p. 5879–86.
[8] Rejec K, Isakovic T, Fischinger M. Seismic shear force magnification in RCcantilever structural walls, designed according to Eurocode 8. Bull Earthq Eng2012;10:567–86.
[9] Rutenberg A. Seismic shear demand on RC structural walls: review andbibliography. In: Proc of the 3rd international conference on computational
methods in structural dynamics and earthquake engineering COMPDYN, paperno 330; 2011.
[10] Earthquake Engineering Research Institute. Northridge earthquake January 17,1994, preliminary reconnaissance report. In: Hall JF, technical editor.Earthquake spectra, supplement C to vol. 11, publication 95-03. El Cerrito,CA: EERI; 1995.
[11] Earthquake Engineering Research Institute. In: Wyllie Jr LA, Filson JR, editors.Armenia earthquake reconnaissance report. Earthquake spectra publication89-01. Special supplement. EERI; 1989.
[12] Restrepo JI, Cowan H. The ‘‘EJE Cafetero’’ earthquake, Colombia of January 25,1999. Bull NZ Soc Earthq Eng 2000;33(1):1–29.
[13] Villaverde R. Explanation for the numerous upper floor collapses during the1985 Mexico City earthquake. Earthq Eng Struct Dynam 1991;20:223–41.
[14] Wood S, Stanton J, Hawkins N. New seismic design provisions for diaphragmsin precast concrete parking structures. PCI J 2000;45(1):50–65.
[15] Rodriguez ME, Blandon JJ. Analysis of diaphragm forces in a five-storyminiature steel building during shaking table tests. In: Proc of the 13thworld conference on earthquake engineering, paper no 2132; 2004.
[16] Restrepo J, Naito CJ, Fleischman RB. Development of a seismic designmethodology for precast concrete floor diaphragms. In: Walraven JC,Stoelhorst D, editors. Tailor made concrete structures: new solutions for oursociety. London, UK: CRC Press/Balkema; 2008 [chapter 28].
[17] Hoehler MS, Panagiotou M, Restrepo JI, Silva JF, Floriani L, Bourgund U, et al.Performance of suspended pipes and their anchorages during shake tabletesting of a seven-story building. Earthq Spectra 2009;25:71–91.
[18] Al Abadi HA, Lam NTK, Gad EF, Chandler AM. Earthquake floor spectra forunrestrained building components. Int J Struct Stab Dynam 2004;4(3):361–77.
[19] Shooshtari M, Saatcioglu M, Naumoski N, Foo S. Floor response spectra forseismic design of operational and functional components of concrete buildingsin Canada. Can J Civil Eng 2010;37(12):1590–9.
[20] Kumar R, Singh Y, Tripathi S. Effect of building performance on floor responsespectra. J Struct Eng (Madras) 2011;37(6):422–6.
[21] Chao SH, Goel SC, Lee SS. A seismic design lateral force distribution based oninelastic state of structures. Earthq Spectra 2007;23(3):547–69.
[22] Panagiotou M, Restrepo JI, Conte JP. Shake table test of a 7-story full scalereinforced concrete wall building slice. Phase I: rectangular wall. ASCE J StructEng 2011;137(6):691–705.
[23] Rodriguez ME, Restrepo JI, Carr AJ. Earthquake-induced floor horizontalaccelerations in buildings. Earthq Eng Struct Dynam 2002;31:693–718.
[24] Medina RA, Sankaranarayanan R, Kingston KM. Floor response spectra for lightcomponents mounted on regular moment-resisting frame structures. EngStruct 2006;28:1927–40.
[25] Lee HJ, Kuchma D, Aschheim MA. Strength-based design of flexiblediaphragms in low-rise structures subjected to earthquake loading. EngStruct 2007;29(7):1277–95.
[26] Priestley MJN, Sritharan S, Conley J, Pampanin S. Preliminary results andconclusions from the PRESSS five-storey precast concrete test building. PCI J1999;44(6):42–67.
[27] SAFECAST. Performance of innovative mechanical connections in precastbuilding structures under seismic conditions. Deliverables 5.2. Generalizationof results to different structures. FP7 project no 218417; 2012.
[28] Comité Européen de Normalisation CEN. Eurocode 8 – design of structures forearthquake resistance. Part-1. General rules, seismic actions and rules forbuildings. Brussels: European Committee for Standardization; 2004.
[29] Priestley MJN, Amaris AD. Dynamic amplification of seismic moments andshears in cantilever walls. Research report no ROSE-2002/01. Pavia: EuropeanSchool for Advanced Studies in Reduction of Seismic Risk; 2002.
[30] Calugaru V, Panagiotou M. Response of tall cantilever wall buildings to strongpulse type seismic excitation. Earthq Eng Struct Dynam 2012;41:1301–18.
[31] Sasaki F, Freeman S, Paret T. Multi-mode pushover procedure (MMP)—amethod to identify the effect of higher modes in a pushover analysis. In: Procof the 6th US national conference on earthquake engineering; 1998.
[32] Paret TF, Sasaki KK, Eilbeck DH, Freeman SA. Approximate inelastic proceduresto identify failure mechanisms from higher mode effects. In: Proc of the 11thworld conference on earthquake engineering, Acapulco, Mexico, paper 966;1996.
[33] Priestley MJN. Does capacity design do the job? An examination of highermode effects in cantilever walls. Bull NZ Soc Earthq Eng2003;36(4):276–92.
[34] Sullivan TJ, Priestley MJN, Calvi GM. Estimating the higher-mode response ofductile structures. J Earthq Eng 2008;12(3):456–72.
[35] Fajfar P, Fischinger M. N2 – a method for non-linear seismic analysis of regularbuildings. In: Proc of the 9th world conference in earthquake engineering, vol.5; 1988. p. 111–6.
[36] Chopra AK, Goel RK. A modal pushover analysis procedure for estimatingseismic demands for buildings. Earthq Eng Struct Dynam 2002;31(3):561–82.
[37] Chopra AK, Goel RK, Chintanapakdee C. Evaluation of a modified MPAprocedure assuming higher modes as elastic to estimate seismic demands.Earthq Spectra 2004;20(3):757–78.
[38] Hernández-Montes E, Kwon OS, Aschheim M. An energy-based formulation forfirst and multiple-mode nonlinear static (pushover) analyses. J Earthq Eng2004;8(1):69–88.
[39] Kreslin M, Fajfar P. The extended N2 method considering higher mode effectsin both plan and elevation. Bull Earthq Eng 2012;10(2):695–715.
430 C.A. Maniatakis et al. / Engineering Structures 56 (2013) 417–430
[40] Sucuoglu H, Günay MS. Generalized force vectors for multi-mode pushoveranalysis. Earthq Eng Struct Dynam 2011;40:55–74.
[41] Kalkan E, Kunnath SK. Adaptive modal combination procedure for nonlinearstatic analysis of building structures. J Struct Eng (ASCE)2006;132(1):1721–31.
[42] Antoniou S, Pinho R. Displacement-based adaptive pushover. In Proc of the2nd international conference on computational methods in structuraldynamics and earthquake engineering, COMPDYN, paper no 448; 2009.
[43] Vamvatsikos D, Cornell CA. Incremental dynamic analysis. Earthq Eng StructDynam 2002;31:491–514.
[44] American Society of Civil Engineers (ASCE). Minimum design loads forbuildings and other structures. ASCE/SEI 7-05. Reston, VA; 2005.
[45] Pacific Earthquake Engineering Research Center (PEER). Tall buildingsinitiative, guidelines for performance-based seismic design of tall buildings,report 2010/05. Berkeley: PEER; 2010.
[46] Baker JW, Cornell CA. A vector-valued ground motion intensity measureconsisting of spectral acceleration and epsilon. Earthq Eng Struct Dynam2005;34(10):1193–217.
[47] Goel RK, Chopra AK. Evaluation of modal and FEMA pushover analyses: SACbuildings. Earthq Spectra 2004;20(1):225–54.
[48] Dokainish MA, Subbaraj K. A survey of direct time-integration methods incomputational structural dynamics – I. Explicit methods. Comput Struct1989;32(6):1371–86.
[49] Subbaraj K, Dokainish MA. A survey of direct time-integration methods incomputational structural dynamics – II. Implicit methods. Comput Struct1989;32(6):1387–401.
[50] Golley BW. A time-stepping procedure for structural dynamics using gausspoint collocation. Int J Numer Meth Eng 1996;39(23):3985–98.
[51] Computers and Structures (CSI), Inc. CSI analysis reference manual forSAP2000, ETABS, and SAFE. Berkeley, CA: Computers and Structures Inc.; 2010.
[52] Chopra AK, Chintanapakdee C. Inelastic deformation ratios for design andevaluation of structures: single-degree-of-freedom bilinear systems. J StructEng 2004;130(9):1309–19.
[53] Goel RK, Chopra AK. Role of higher-‘‘mode’’ pushover analyses in seismicanalysis of buildings. Earthq Spectra 2005;21(4):1027–41.
[54] Goel RK, Chopra AK. Extension of modal pushover analysis to computemember forces. Earthq Spectra 2005;21(1):125–39.
[55] Earthquake Planning and Protection Organization (EPPO). Greek aseismic codeEAK2000. Athens: EPPO; 2000.
[56] Comité Européen de Normalisation CEN. Eurocode 8 – design of structures forearthquake resistance. Part-3. Assessment and retrofit of buildings. Brussels:European Committee for Standardization; 2005.
[57] PEER strong motion database. <http://www.peer.berkeley.edu>.[58] Theodulidis N, Kalogeras I, Papazachos C, Karastathis V, Margaris V,
Papaioannou Ch, et al. HEAD v. 10: a unified Hellenic accelerogram database.Seismol Res Lett 2004;75(1):36–45.