DYNAMIC COLLAPSE ANALYSIS OF FOUR-STORY …isobe/265.pdf · The E-Simulator is a parallel finite...
12
COMPDYN 2013 4 th ECCOMAS Thematic Conference on Computational Methods in Structural Dynamics and Earthquake Engineering M. Papadrakakis, N.D.Lagaros, V. Plevris (eds.) Kos Island, Greece, 12–14 June 2013 DYNAMIC COLLAPSE ANALYSIS OF FOUR-STORY STEEL FRAME USING E-SIMULATOR Tomoshi Miyamura 1* , Makoto Ohsaki 2 , Takuzo Yamashita 3 , Daigoro Isobe 4 , Masayuki Kohiyama 5 1 Department of Computer Science, College of Engineering, Nihon University 1 Nakagawara, Tokusada, Tamura, Koriyama 963-8642, Japan [email protected] 2 Department of Architecture, Hiroshima University 1-4-1 Kagamiyama, Higashi-Hiroshima 739-8527, Japan [email protected] 3 Hyogo Earthquake Eng. Res. Center, National Res. Inst. for Earth Science and Disaster Prevention 1501-21 Nishikameyama, Mitsuta, Shijimi, Miki 673-0515, Japan [email protected] 4 Division of Engineering Mechanics and Energy, University of Tsukuba 1-1-1 Tennodai, Tsukuba-shi, Ibaraki 305-8573, Japan [email protected] 5 Department of System Design Engineering, Keio University 3-14-1 Hiyoshi, Kohoku, Yokohama 223-8522, Japan [email protected] Keywords: Finite Element Analysis, Steel Building Frame, Seismic Response, Parallel Com- puting. Abstract. Dynamic collapse analyses of a 4-story steel building frame modeled by solid ele- ments are performed using the E-Simulator, which is a parallel finite element analysis soft- ware package for civil and building structures. Code verification, calculation verification, and validation of the numerical codes (V&V) are conducted by comparing the results ob- tained by the E-Simulator, those obtained by a beam element analysis code, and the experi- mental results obtained by the 3-D full-scale earthquake testing facility, the E-Defense at NIED. The seismic response analyses under 60% or 100% of the JR Takatori seismic wave of the 1995 Hyogoken-Nanbu earthquake are performed. The shear forces and interstory drift angles of the 1st story obtained by the E-Simulator simulation and the E-Defense full-scale test have good agreement. Both response of the whole frame and local deformation due to plastic buckling are simulated in the analysis using the E-Simulator.
Transcript of DYNAMIC COLLAPSE ANALYSIS OF FOUR-STORY …isobe/265.pdf · The E-Simulator is a parallel finite...

COMPDYN 2013 4th ECCOMAS Thematic Conference on
Computational Methods in Structural Dynamics and Earthquake Engineering M. Papadrakakis, N.D.Lagaros, V. Plevris (eds.)
Kos Island, Greece, 12–14 June 2013
DYNAMIC COLLAPSE ANALYSIS OF FOUR-STORY STEEL FRAME USING E-SIMULATOR
Tomoshi Miyamura1*, Makoto Ohsaki2, Takuzo Yamashita3, Daigoro Isobe4, Masayuki Kohiyama5
1Department of Computer Science, College of Engineering, Nihon University 1 Nakagawara, Tokusada, Tamura, Koriyama 963-8642, Japan
2Department of Architecture, Hiroshima University 1-4-1 Kagamiyama, Higashi-Hiroshima 739-8527, Japan
3Hyogo Earthquake Eng. Res. Center, National Res. Inst. for Earth Science and Disaster Prevention 1501-21 Nishikameyama, Mitsuta, Shijimi, Miki 673-0515, Japan
4Division of Engineering Mechanics and Energy, University of Tsukuba 1-1-1 Tennodai, Tsukuba-shi, Ibaraki 305-8573, Japan
5Department of System Design Engineering, Keio University 3-14-1 Hiyoshi, Kohoku, Yokohama 223-8522, Japan
Keywords: Finite Element Analysis, Steel Building Frame, Seismic Response, Parallel Com-puting.
Abstract. Dynamic collapse analyses of a 4-story steel building frame modeled by solid ele-ments are performed using the E-Simulator, which is a parallel finite element analysis soft-ware package for civil and building structures. Code verification, calculation verification, and validation of the numerical codes (V&V) are conducted by comparing the results ob-tained by the E-Simulator, those obtained by a beam element analysis code, and the experi-mental results obtained by the 3-D full-scale earthquake testing facility, the E-Defense at NIED. The seismic response analyses under 60% or 100% of the JR Takatori seismic wave of the 1995 Hyogoken-Nanbu earthquake are performed. The shear forces and interstory drift angles of the 1st story obtained by the E-Simulator simulation and the E-Defense full-scale test have good agreement. Both response of the whole frame and local deformation due to plastic buckling are simulated in the analysis using the E-Simulator.
T. Miyamura et al.
1 INTRODUCTION
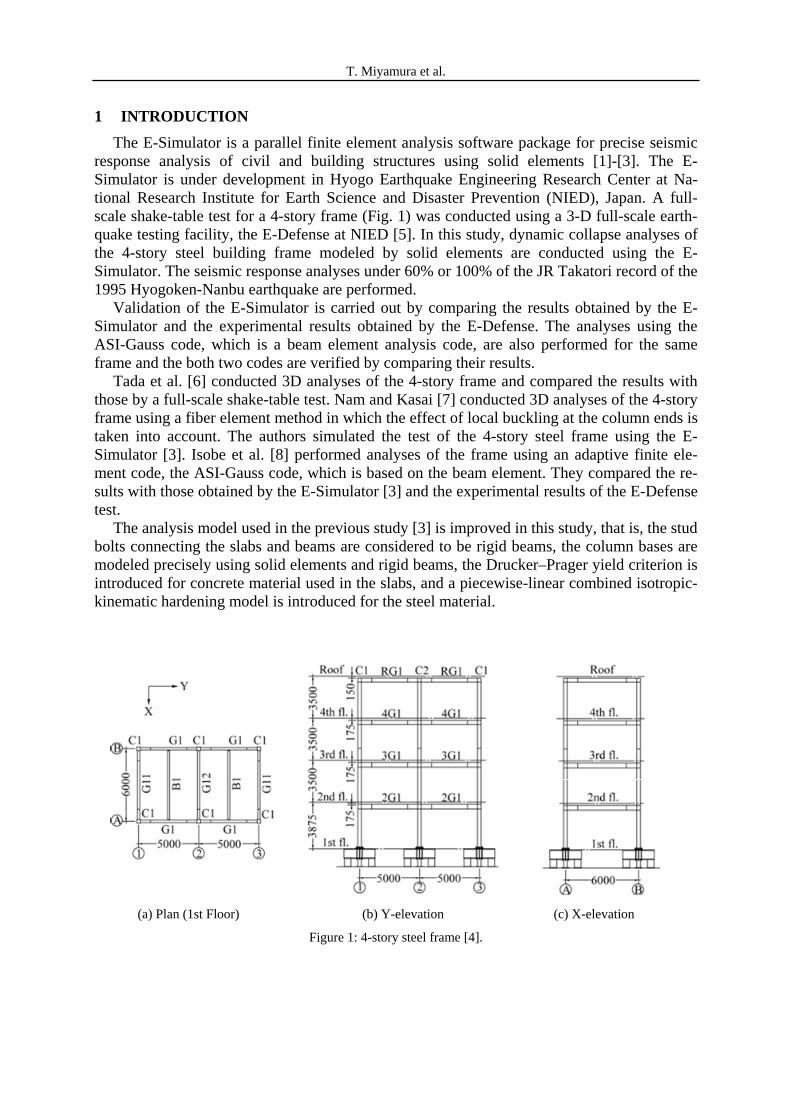
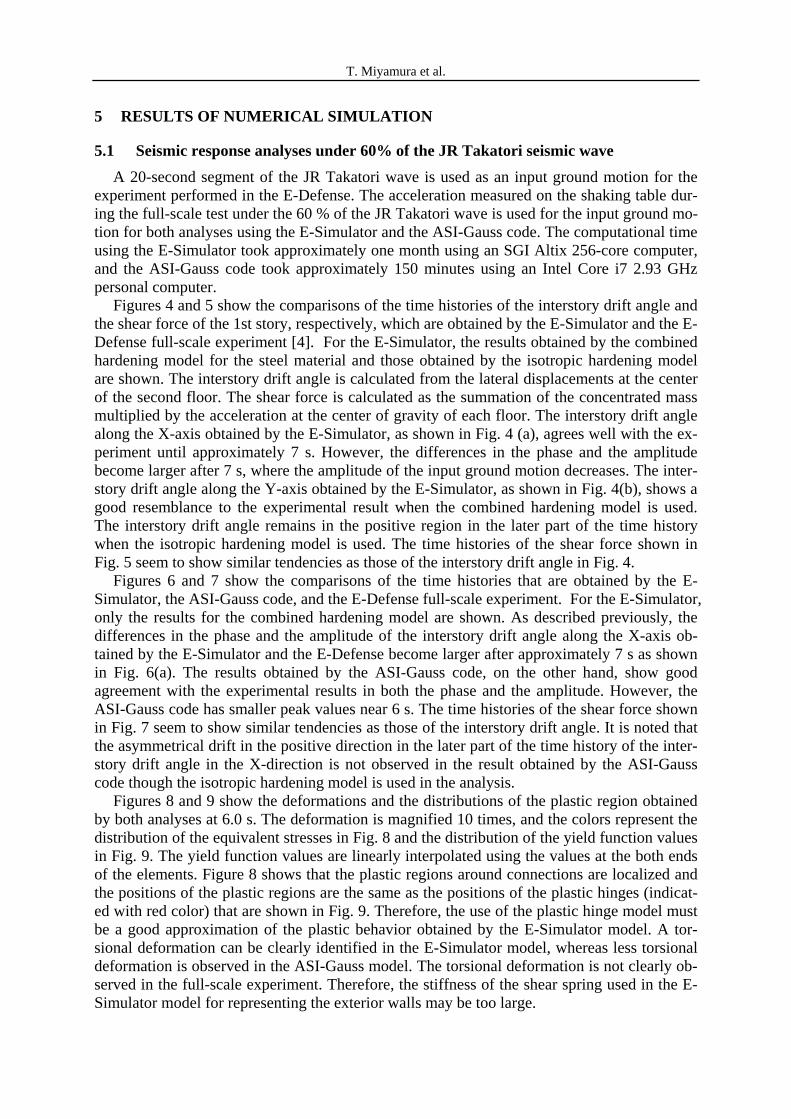
The E-Simulator is a parallel finite element analysis software package for precise seismic response analysis of civil and building structures using solid elements [1]-[3]. The E-Simulator is under development in Hyogo Earthquake Engineering Research Center at Na-tional Research Institute for Earth Science and Disaster Prevention (NIED), Japan. A full-scale shake-table test for a 4-story frame (Fig. 1) was conducted using a 3-D full-scale earth-quake testing facility, the E-Defense at NIED [5]. In this study, dynamic collapse analyses of the 4-story steel building frame modeled by solid elements are conducted using the E-Simulator. The seismic response analyses under 60% or 100% of the JR Takatori record of the 1995 Hyogoken-Nanbu earthquake are performed.
Validation of the E-Simulator is carried out by comparing the results obtained by the E-Simulator and the experimental results obtained by the E-Defense. The analyses using the ASI-Gauss code, which is a beam element analysis code, are also performed for the same frame and the both two codes are verified by comparing their results.
Tada et al. [6] conducted 3D analyses of the 4-story frame and compared the results with those by a full-scale shake-table test. Nam and Kasai [7] conducted 3D analyses of the 4-story frame using a fiber element method in which the effect of local buckling at the column ends is taken into account. The authors simulated the test of the 4-story steel frame using the E-Simulator [3]. Isobe et al. [8] performed analyses of the frame using an adaptive finite ele-ment code, the ASI-Gauss code, which is based on the beam element. They compared the re-sults with those obtained by the E-Simulator [3] and the experimental results of the E-Defense test.
The analysis model used in the previous study [3] is improved in this study, that is, the stud bolts connecting the slabs and beams are considered to be rigid beams, the column bases are modeled precisely using solid elements and rigid beams, the Drucker–Prager yield criterion is introduced for concrete material used in the slabs, and a piecewise-linear combined isotropic-kinematic hardening model is introduced for the steel material.
(a) Plan (1st Floor) (b) Y-elevation (c) X-elevation
Figure 1: 4-story steel frame [4].
T. Miyamura et al.
2 E-SIMULATOR
The E-Simulator is a parallel finite element structural analysis code for virtual shaking-table tests of civil or architectural structures. It enables large-scale analysis to be performed with a very fine mesh of solid elements. The main core of the E-Simulator is the commercial software package ADVENTURECluster [9, 10], which has been extended from the open source version, ADVENTURE [11]. These packages use the domain decomposition method for parallel implementation. The structural analysis code in the ADVENTURE system adopts the balancing domain decomposition (BDD) method, which is a substructuring-based linear iterative method with a Neumann-Neumann preconditioner combined with coarse grid correc-tion. On the other hand, the Coarse Grid Conjugate Gradient (CGCG) method [10] has been developed originally for the ADVENTURECluster. The CGCG method is a conjugate gradi-ent method combined with domain decomposition. It is preconditioned by motion of the de-composed subdomains. This idea is similar to the coarse grid correction used in the BDD method. However, the CGCG method is not a substructuring-based iterative method, and the computation cost for static condensation in each subdomain is reduced. The ADVENTURE-Cluster can be operated in a massively parallel computer; indeed, it was implemented on Blue Gene/L in 2006 and the work was selected as a finalist in the 2006 Gordon Bell Prizes [10].
3 ANALYSIS MODEL FOR E-SIMULATOR
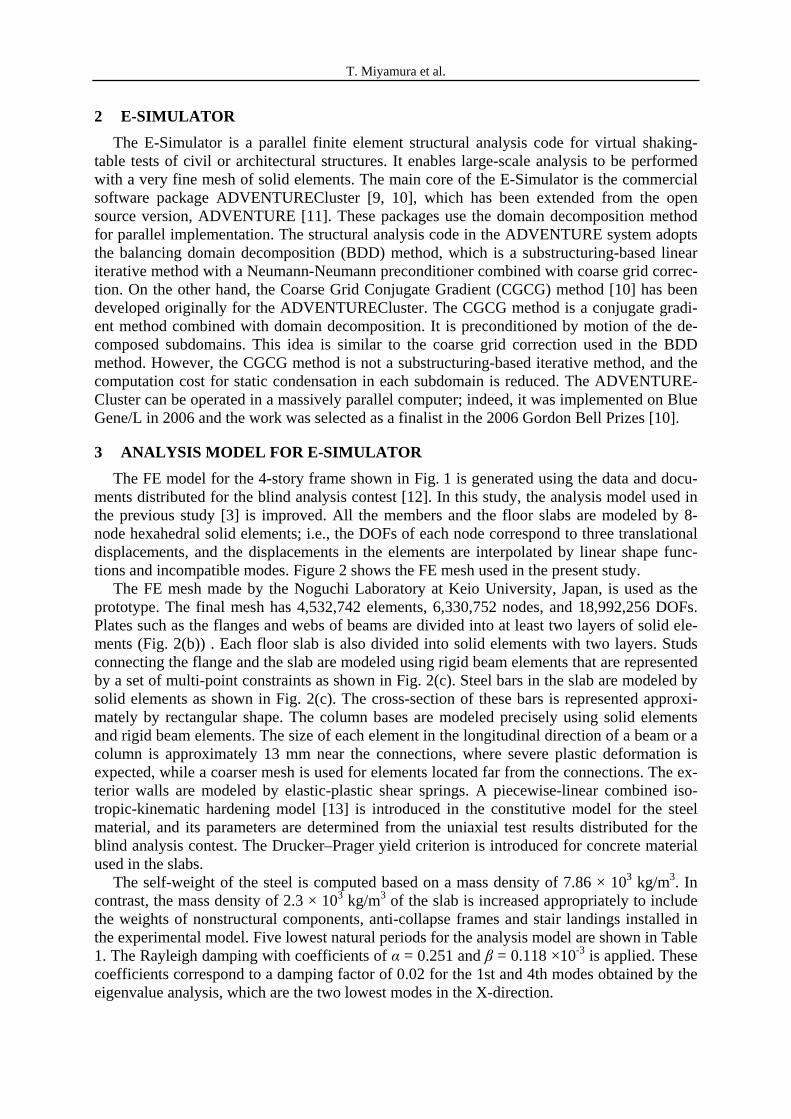
The FE model for the 4-story frame shown in Fig. 1 is generated using the data and docu-ments distributed for the blind analysis contest [12]. In this study, the analysis model used in the previous study [3] is improved. All the members and the floor slabs are modeled by 8-node hexahedral solid elements; i.e., the DOFs of each node correspond to three translational displacements, and the displacements in the elements are interpolated by linear shape func-tions and incompatible modes. Figure 2 shows the FE mesh used in the present study.
The FE mesh made by the Noguchi Laboratory at Keio University, Japan, is used as the prototype. The final mesh has 4,532,742 elements, 6,330,752 nodes, and 18,992,256 DOFs. Plates such as the flanges and webs of beams are divided into at least two layers of solid ele-ments (Fig. 2(b)) . Each floor slab is also divided into solid elements with two layers. Studs connecting the flange and the slab are modeled using rigid beam elements that are represented by a set of multi-point constraints as shown in Fig. 2(c). Steel bars in the slab are modeled by solid elements as shown in Fig. 2(c). The cross-section of these bars is represented approxi-mately by rectangular shape. The column bases are modeled precisely using solid elements and rigid beam elements. The size of each element in the longitudinal direction of a beam or a column is approximately 13 mm near the connections, where severe plastic deformation is expected, while a coarser mesh is used for elements located far from the connections. The ex-terior walls are modeled by elastic-plastic shear springs. A piecewise-linear combined iso-tropic-kinematic hardening model [13] is introduced in the constitutive model for the steel material, and its parameters are determined from the uniaxial test results distributed for the blind analysis contest. The Drucker–Prager yield criterion is introduced for concrete material used in the slabs.
The self-weight of the steel is computed based on a mass density of 7.86 × 10³ kg/m3. In contrast, the mass density of 2.3 × 10³ kg/m3 of the slab is increased appropriately to include the weights of nonstructural components, anti-collapse frames and stair landings installed in the experimental model. Five lowest natural periods for the analysis model are shown in Table 1. The Rayleigh damping with coefficients of α = 0.251 and β = 0.118 ×10⁻³ is applied. These coefficients correspond to a damping factor of 0.02 for the 1st and 4th modes obtained by the eigenvalue analysis, which are the two lowest modes in the X-direction.
T. Miyamura et al.
(a) Whole frame
(b)
(c) Close-up view
(d)
(e) Modeling of studs connecting the flange and the slab, and steel bars in the slab
Figure 2: Mesh of 4-story steel frame.
T. Miyamura et al.
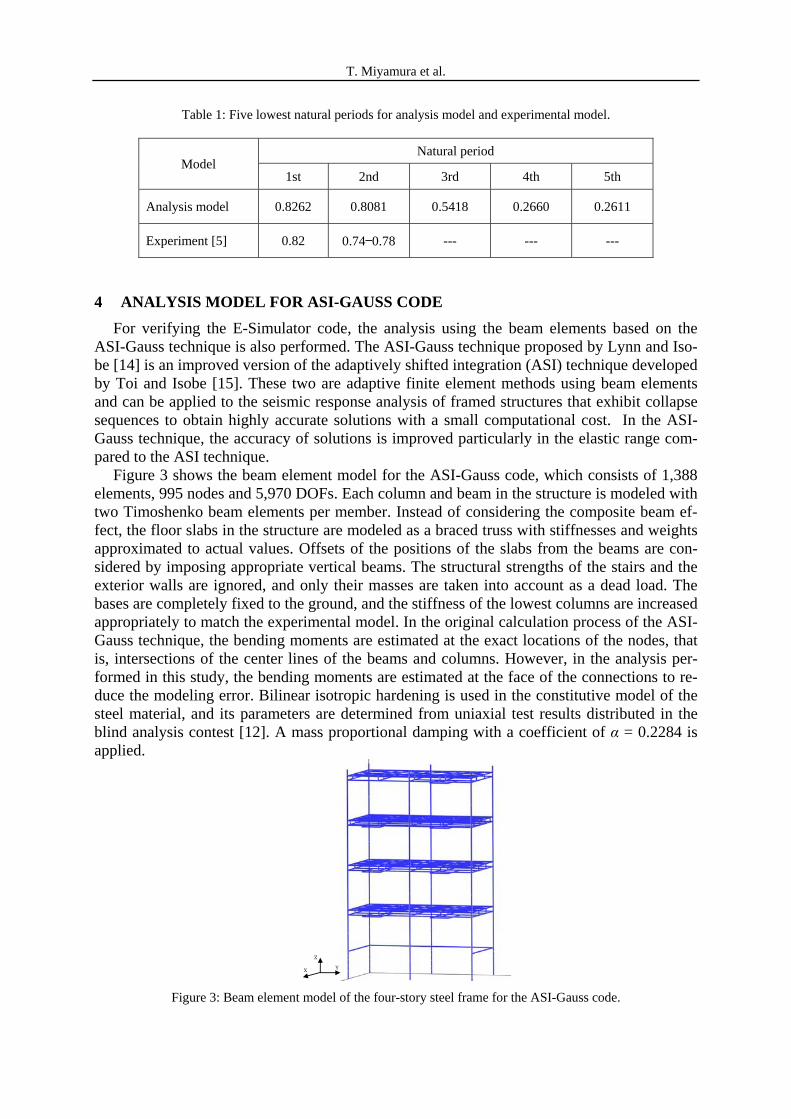
Table 1: Five lowest natural periods for analysis model and experimental model.
Model Natural period
1st 2nd 3rd 4th 5th
Analysis model 0.8262 0.8081 0.5418 0.2660 0.2611
Experiment [5] 0.82 0.74—0.78 --- --- ---
4 ANALYSIS MODEL FOR ASI-GAUSS CODE
For verifying the E-Simulator code, the analysis using the beam elements based on the ASI-Gauss technique is also performed. The ASI-Gauss technique proposed by Lynn and Iso-be [14] is an improved version of the adaptively shifted integration (ASI) technique developed by Toi and Isobe [15]. These two are adaptive finite element methods using beam elements and can be applied to the seismic response analysis of framed structures that exhibit collapse sequences to obtain highly accurate solutions with a small computational cost. In the ASI-Gauss technique, the accuracy of solutions is improved particularly in the elastic range com-pared to the ASI technique.
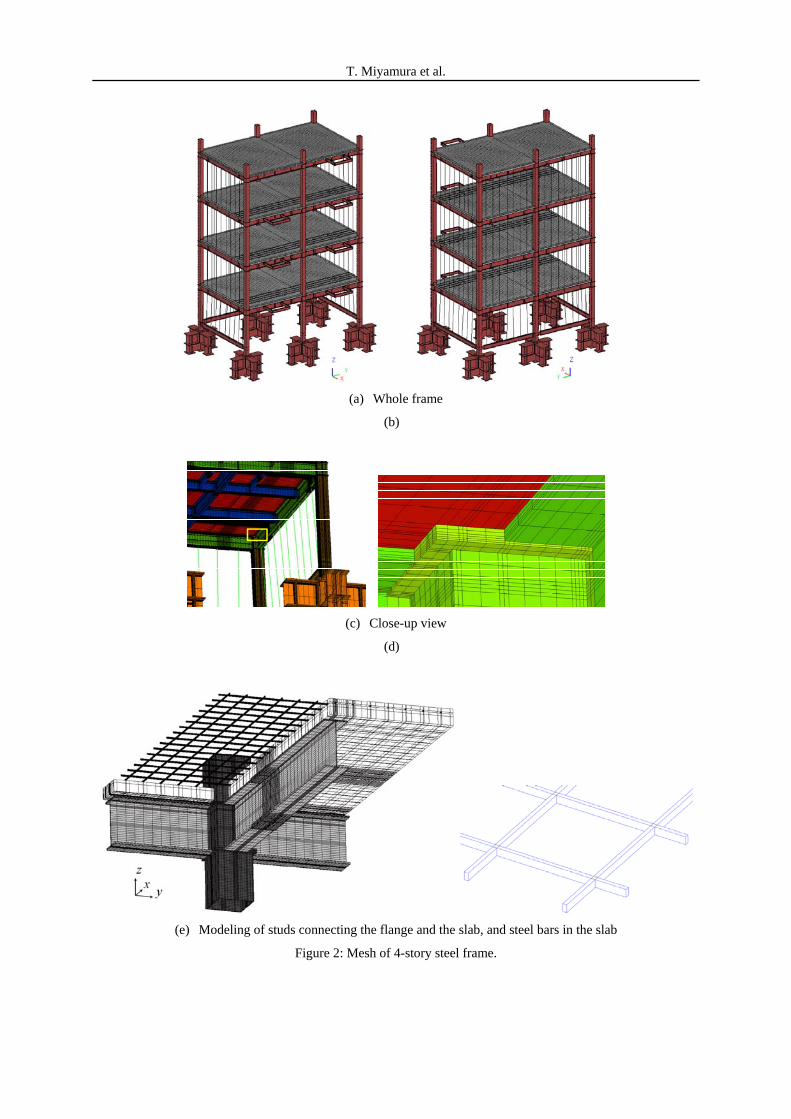
Figure 3 shows the beam element model for the ASI-Gauss code, which consists of 1,388 elements, 995 nodes and 5,970 DOFs. Each column and beam in the structure is modeled with two Timoshenko beam elements per member. Instead of considering the composite beam ef-fect, the floor slabs in the structure are modeled as a braced truss with stiffnesses and weights approximated to actual values. Offsets of the positions of the slabs from the beams are con-sidered by imposing appropriate vertical beams. The structural strengths of the stairs and the exterior walls are ignored, and only their masses are taken into account as a dead load. The bases are completely fixed to the ground, and the stiffness of the lowest columns are increased appropriately to match the experimental model. In the original calculation process of the ASI-Gauss technique, the bending moments are estimated at the exact locations of the nodes, that is, intersections of the center lines of the beams and columns. However, in the analysis per-formed in this study, the bending moments are estimated at the face of the connections to re-duce the modeling error. Bilinear isotropic hardening is used in the constitutive model of the steel material, and its parameters are determined from uniaxial test results distributed in the blind analysis contest [12]. A mass proportional damping with a coefficient of α = 0.2284 is applied.
Y
Z X
Figure 3: Beam element model of the four-story steel frame for the ASI-Gauss code.
T. Miyamura et al.
5 RESULTS OF NUMERICAL SIMULATION
5.1 Seismic response analyses under 60% of the JR Takatori seismic wave
A 20-second segment of the JR Takatori wave is used as an input ground motion for the experiment performed in the E-Defense. The acceleration measured on the shaking table dur-ing the full-scale test under the 60 % of the JR Takatori wave is used for the input ground mo-tion for both analyses using the E-Simulator and the ASI-Gauss code. The computational time using the E-Simulator took approximately one month using an SGI Altix 256-core computer, and the ASI-Gauss code took approximately 150 minutes using an Intel Core i7 2.93 GHz personal computer.
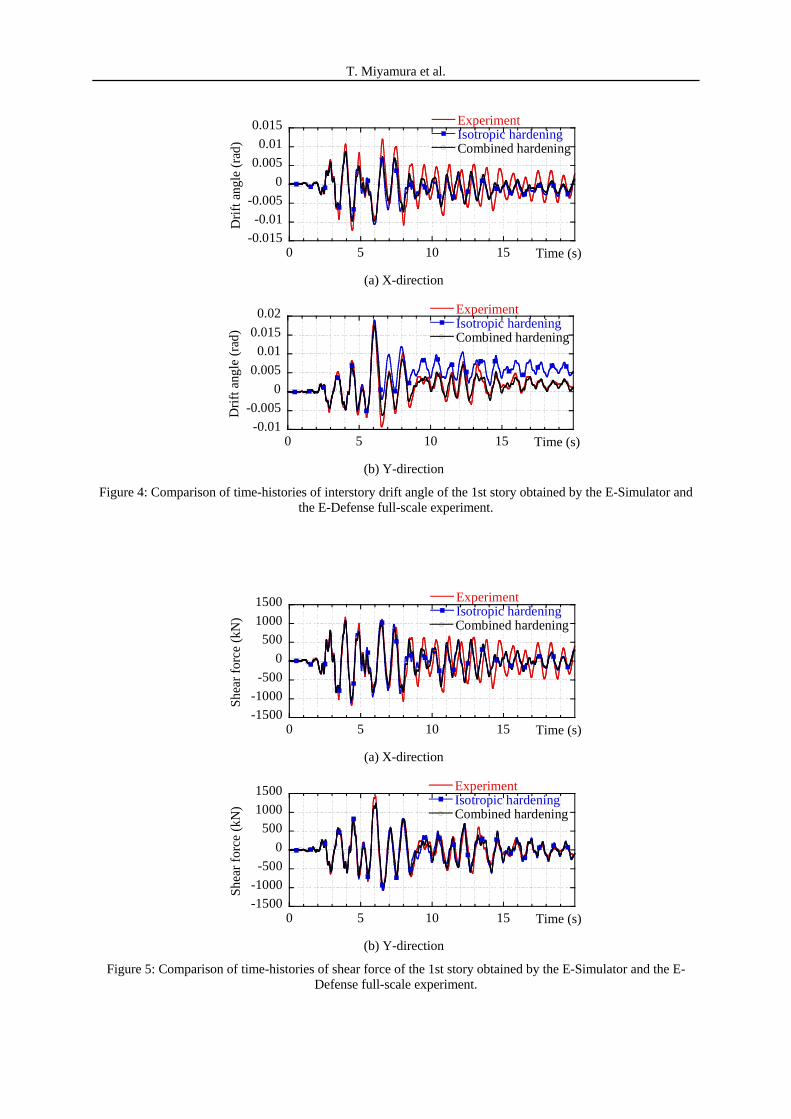
Figures 4 and 5 show the comparisons of the time histories of the interstory drift angle and the shear force of the 1st story, respectively, which are obtained by the E-Simulator and the E-Defense full-scale experiment [4]. For the E-Simulator, the results obtained by the combined hardening model for the steel material and those obtained by the isotropic hardening model are shown. The interstory drift angle is calculated from the lateral displacements at the center of the second floor. The shear force is calculated as the summation of the concentrated mass multiplied by the acceleration at the center of gravity of each floor. The interstory drift angle along the X-axis obtained by the E-Simulator, as shown in Fig. 4 (a), agrees well with the ex-periment until approximately 7 s. However, the differences in the phase and the amplitude become larger after 7 s, where the amplitude of the input ground motion decreases. The inter-story drift angle along the Y-axis obtained by the E-Simulator, as shown in Fig. 4(b), shows a good resemblance to the experimental result when the combined hardening model is used. The interstory drift angle remains in the positive region in the later part of the time history when the isotropic hardening model is used. The time histories of the shear force shown in Fig. 5 seem to show similar tendencies as those of the interstory drift angle in Fig. 4.
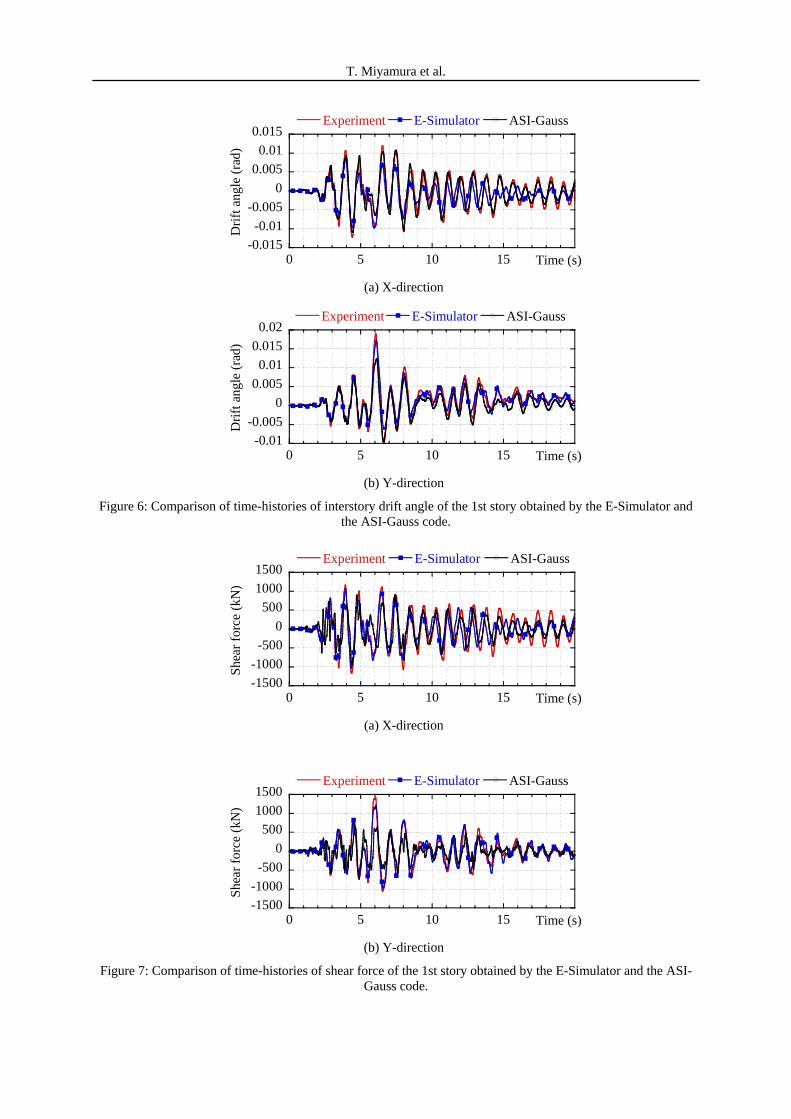
Figures 6 and 7 show the comparisons of the time histories that are obtained by the E-Simulator, the ASI-Gauss code, and the E-Defense full-scale experiment. For the E-Simulator, only the results for the combined hardening model are shown. As described previously, the differences in the phase and the amplitude of the interstory drift angle along the X-axis ob-tained by the E-Simulator and the E-Defense become larger after approximately 7 s as shown in Fig. 6(a). The results obtained by the ASI-Gauss code, on the other hand, show good agreement with the experimental results in both the phase and the amplitude. However, the ASI-Gauss code has smaller peak values near 6 s. The time histories of the shear force shown in Fig. 7 seem to show similar tendencies as those of the interstory drift angle. It is noted that the asymmetrical drift in the positive direction in the later part of the time history of the inter-story drift angle in the X-direction is not observed in the result obtained by the ASI-Gauss code though the isotropic hardening model is used in the analysis.
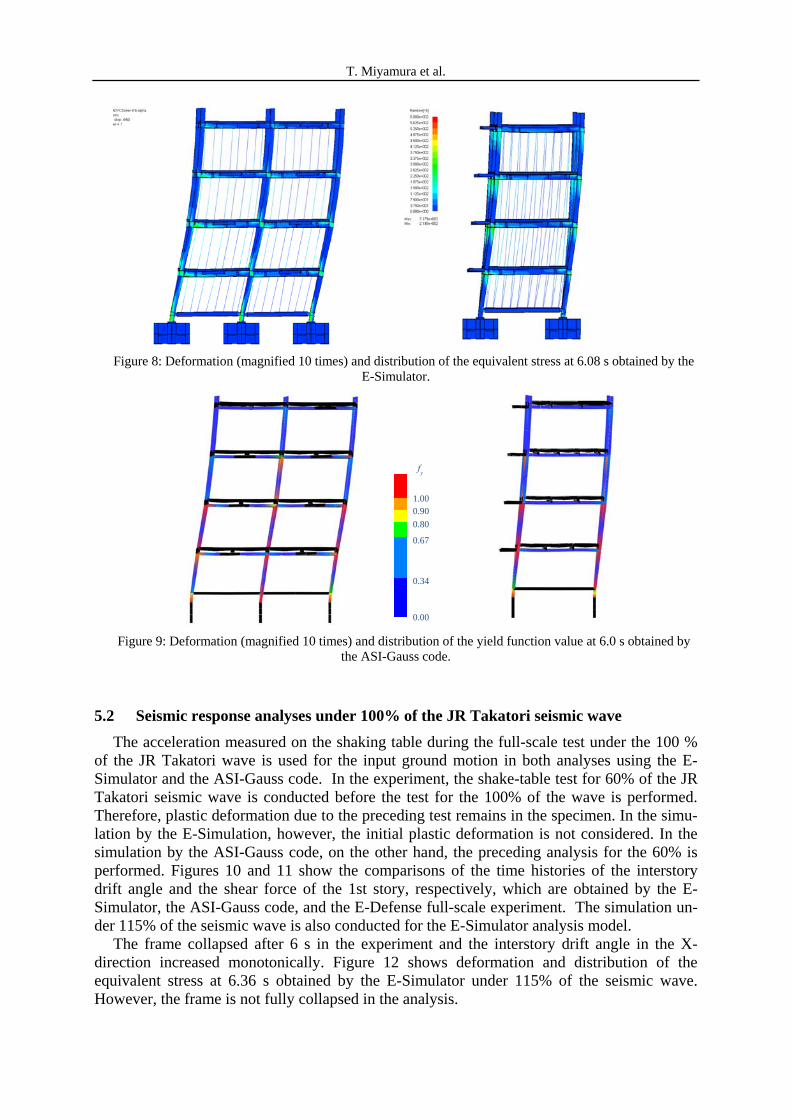
Figures 8 and 9 show the deformations and the distributions of the plastic region obtained by both analyses at 6.0 s. The deformation is magnified 10 times, and the colors represent the distribution of the equivalent stresses in Fig. 8 and the distribution of the yield function values in Fig. 9. The yield function values are linearly interpolated using the values at the both ends of the elements. Figure 8 shows that the plastic regions around connections are localized and the positions of the plastic regions are the same as the positions of the plastic hinges (indicat-ed with red color) that are shown in Fig. 9. Therefore, the use of the plastic hinge model must be a good approximation of the plastic behavior obtained by the E-Simulator model. A tor-sional deformation can be clearly identified in the E-Simulator model, whereas less torsional deformation is observed in the ASI-Gauss model. The torsional deformation is not clearly ob-served in the full-scale experiment. Therefore, the stiffness of the shear spring used in the E-Simulator model for representing the exterior walls may be too large.
T. Miyamura et al.
-0.015
-0.01
-0.005
0
0.005
0.01
0.015
0 5 10 15
ExperimentIsotropic hardeningCombined hardening
Dri
ft a
ngle
(ra
d)Time (s)
(a) X-direction
-0.01
-0.005
0
0.005
0.01
0.015
0.02
0 5 10 15
ExperimentIsotropic hardeningCombined hardening
Dri
ft a
ngle
(ra
d)
Time (s)
(b) Y-direction
Figure 4: Comparison of time-histories of interstory drift angle of the 1st story obtained by the E-Simulator and the E-Defense full-scale experiment.
-1500
-1000
-500
0
500
1000
1500
0 5 10 15
ExperimentIsotropic hardeningCombined hardening
Shea
r fo
rce
(kN
)
Time (s) (a) X-direction
-1500
-1000
-500
0
500
1000
1500
0 5 10 15
ExperimentIsotropic hardeningCombined hardening
Shea
r fo
rce
(kN
)
Time (s) (b) Y-direction
Figure 5: Comparison of time-histories of shear force of the 1st story obtained by the E-Simulator and the E-Defense full-scale experiment.
T. Miyamura et al.
-0.015
-0.01
-0.005
0
0.005
0.01
0.015
0 5 10 15
Experiment E-Simulator ASI-Gauss
Dri
ft a
ngle
(ra
d)
Time (s) (a) X-direction
-0.01
-0.005
0
0.005
0.01
0.015
0.02
0 5 10 15
Experiment E-Simulator ASI-Gauss
Dri
ft a
ngle
(ra
d)
Time (s) (b) Y-direction
Figure 6: Comparison of time-histories of interstory drift angle of the 1st story obtained by the E-Simulator and the ASI-Gauss code.
-1500
-1000
-500
0
500
1000
1500
0 5 10 15
Experiment E-Simulator ASI-Gauss
She
ar f
orce
(kN
)
Time (s) (a) X-direction
-1500
-1000
-500
0
500
1000
1500
0 5 10 15
Experiment E-Simulator ASI-Gauss
She
ar f
orce
(kN
)
Time (s) (b) Y-direction
Figure 7: Comparison of time-histories of shear force of the 1st story obtained by the E-Simulator and the ASI-Gauss code.
T. Miyamura et al.
Figure 8: Deformation (magnified 10 times) and distribution of the equivalent stress at 6.08 s obtained by the
E-Simulator.
0.00
0.34
0.67
0.80
0.90 1.00
fy
Figure 9: Deformation (magnified 10 times) and distribution of the yield function value at 6.0 s obtained by
the ASI-Gauss code.
5.2 Seismic response analyses under 100% of the JR Takatori seismic wave
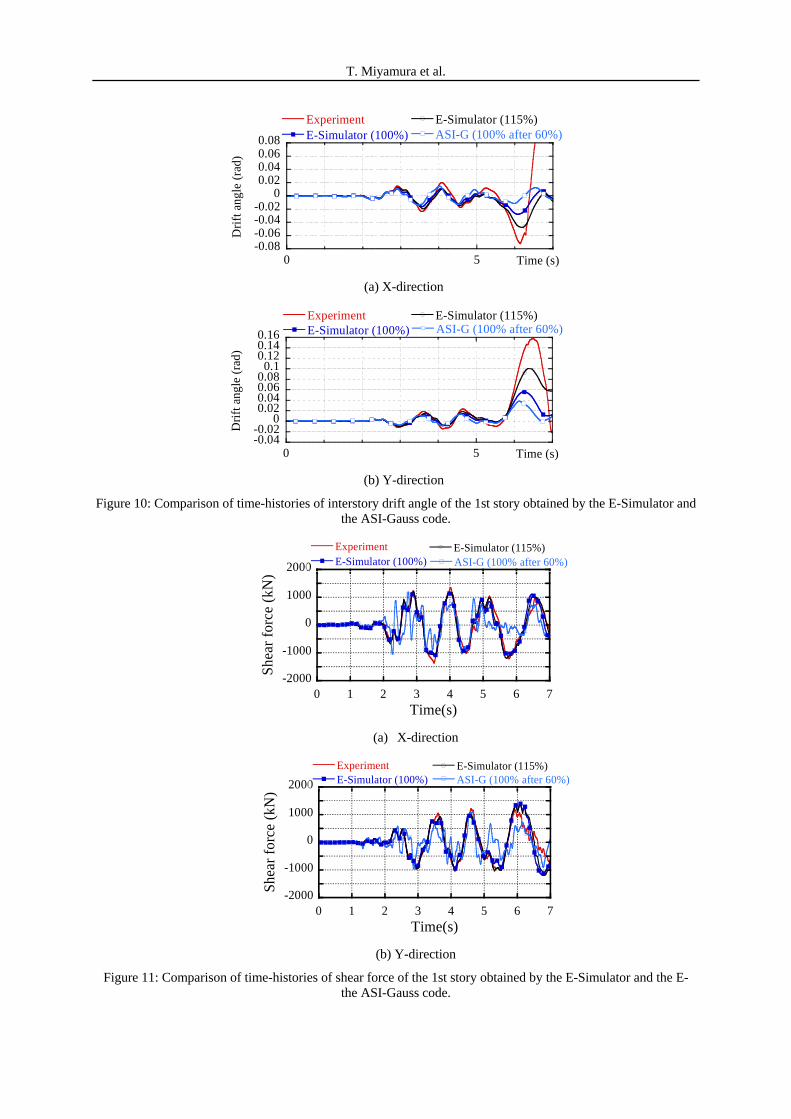
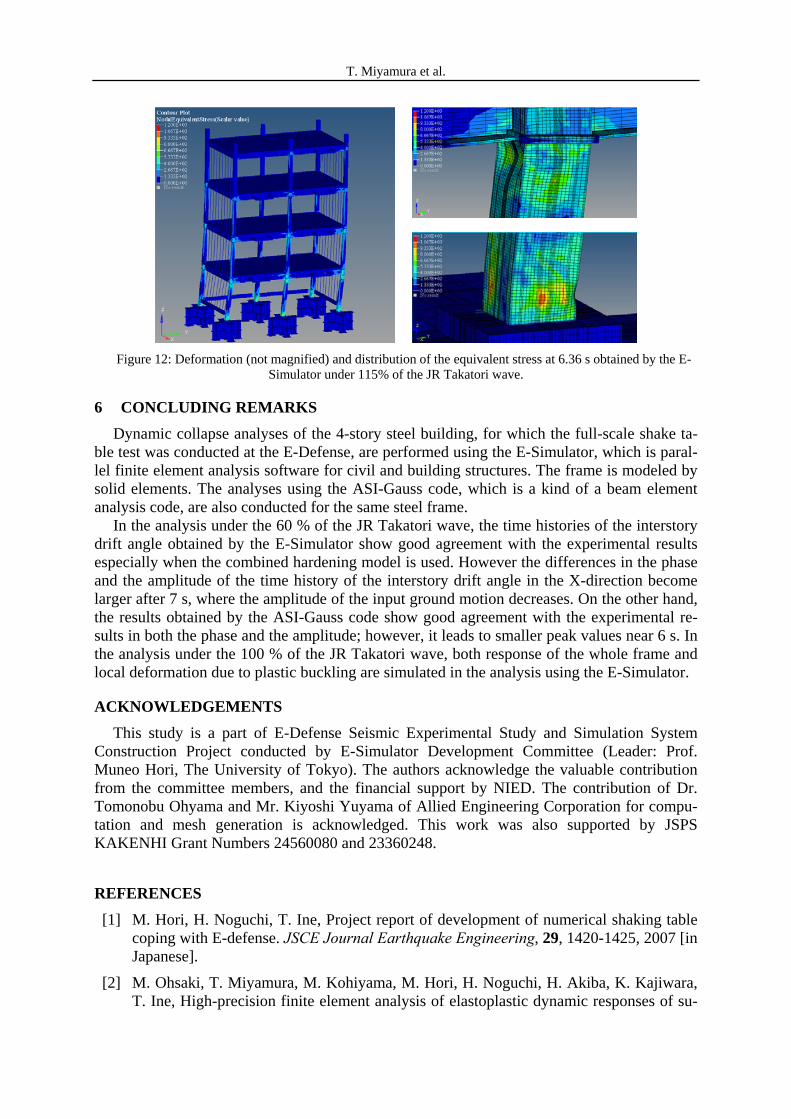
The acceleration measured on the shaking table during the full-scale test under the 100 % of the JR Takatori wave is used for the input ground motion in both analyses using the E-Simulator and the ASI-Gauss code. In the experiment, the shake-table test for 60% of the JR Takatori seismic wave is conducted before the test for the 100% of the wave is performed. Therefore, plastic deformation due to the preceding test remains in the specimen. In the simu-lation by the E-Simulation, however, the initial plastic deformation is not considered. In the simulation by the ASI-Gauss code, on the other hand, the preceding analysis for the 60% is performed. Figures 10 and 11 show the comparisons of the time histories of the interstory drift angle and the shear force of the 1st story, respectively, which are obtained by the E-Simulator, the ASI-Gauss code, and the E-Defense full-scale experiment. The simulation un-der 115% of the seismic wave is also conducted for the E-Simulator analysis model.
The frame collapsed after 6 s in the experiment and the interstory drift angle in the X-direction increased monotonically. Figure 12 shows deformation and distribution of the equivalent stress at 6.36 s obtained by the E-Simulator under 115% of the seismic wave. However, the frame is not fully collapsed in the analysis.
T. Miyamura et al.
-0.08-0.06-0.04-0.02
00.020.040.060.08
0 5
ExperimentE-Simulator (100%)
E-Simulator (115%)ASI-G (100% after 60%)
Dri
ft a
ngle
(ra
d)
Time (s) (a) X-direction
-0.04-0.02
00.020.040.060.08
0.10.120.140.16
0 5
ExperimentE-Simulator (100%)
E-Simulator (115%)ASI-G (100% after 60%)
Dri
ft a
ngle
(ra
d)
Time (s) (b) Y-direction
Figure 10: Comparison of time-histories of interstory drift angle of the 1st story obtained by the E-Simulator and the ASI-Gauss code.
-2000
-1000
0
1000
2000
0 1 2 3 4 5 6 7
ExperimentE-Simulator (100%)
E-Simulator (115%)ASI-G (100% after 60%)
She
ar f
orce
(kN
)
Time(s) (a) X-direction
-2000
-1000
0
1000
2000
0 1 2 3 4 5 6 7
ExperimentE-Simulator (100%)
E-Simulator (115%)ASI-G (100% after 60%)
Shea
r fo
rce
(kN
)
Time(s)
(b) Y-direction
Figure 11: Comparison of time-histories of shear force of the 1st story obtained by the E-Simulator and the E- the ASI-Gauss code.
T. Miyamura et al.
Figure 12: Deformation (not magnified) and distribution of the equivalent stress at 6.36 s obtained by the E-
Simulator under 115% of the JR Takatori wave.
6 CONCLUDING REMARKS
Dynamic collapse analyses of the 4-story steel building, for which the full-scale shake ta-ble test was conducted at the E-Defense, are performed using the E-Simulator, which is paral-lel finite element analysis software for civil and building structures. The frame is modeled by solid elements. The analyses using the ASI-Gauss code, which is a kind of a beam element analysis code, are also conducted for the same steel frame.
In the analysis under the 60 % of the JR Takatori wave, the time histories of the interstory drift angle obtained by the E-Simulator show good agreement with the experimental results especially when the combined hardening model is used. However the differences in the phase and the amplitude of the time history of the interstory drift angle in the X-direction become larger after 7 s, where the amplitude of the input ground motion decreases. On the other hand, the results obtained by the ASI-Gauss code show good agreement with the experimental re-sults in both the phase and the amplitude; however, it leads to smaller peak values near 6 s. In the analysis under the 100 % of the JR Takatori wave, both response of the whole frame and local deformation due to plastic buckling are simulated in the analysis using the E-Simulator.
ACKNOWLEDGEMENTS
This study is a part of E-Defense Seismic Experimental Study and Simulation System Construction Project conducted by E-Simulator Development Committee (Leader: Prof. Muneo Hori, The University of Tokyo). The authors acknowledge the valuable contribution from the committee members, and the financial support by NIED. The contribution of Dr. Tomonobu Ohyama and Mr. Kiyoshi Yuyama of Allied Engineering Corporation for compu-tation and mesh generation is acknowledged. This work was also supported by JSPS KAKENHI Grant Numbers 24560080 and 23360248.
REFERENCES
[1] M. Hori, H. Noguchi, T. Ine, Project report of development of numerical shaking table coping with E-defense. JSCE Journal Earthquake Engineering, 29, 1420-1425, 2007 [in Japanese].
[2] M. Ohsaki, T. Miyamura, M. Kohiyama, M. Hori, H. Noguchi, H. Akiba, K. Kajiwara, T. Ine, High-precision finite element analysis of elastoplastic dynamic responses of su-

T. Miyamura et al.
per-highrise steel frames. Earthquake Engineering and Structural Dynamics, 38(5), 635-654, 2009.
[3] T. Miyamura, M. Ohsaki, M. Kohiyama, D. Isobe, K. Onda, H. Akiba, M. Hori, K. Kajiwara, T. Ine, Large-scale FE analysis of steel building frames using E-Simulator. Progress in Nuclear Science and Technology, 2, 651-656, 2011.
[4] Website of ASEBI at E-Defense, NIED, Project “E-Defense Tests on Full-Scale Four-Story Steel Building”, https://www.edgrid.jp/data/, as of 28/2/2013.
[5] S. Yamada, K. Suita, M. Tada, K. Kasai, Y. Matsuoka, Y. Shimada, Collapse experi-ment on 4-story steel moment frame: Part 1 outline of test results. Proceedings of the 14th World Conference on Earthquake Engineering (DVD), Paper ID: S17.1.4, Beijing, China, 2008.
[6] M. Tada, H. Tamai, K. Ohgami, S. Kuwahara, A. Horimoto, Analytical simulation uti-lizing collaborative structural analysis system. Proceedings of the 14th World Confer-ence on Earthquake Engineering (DVD), Paper ID: S17.1.5, Beijing, China, 2008.
[7] T.T. Nam, K. Kasai, Dynamic analysis of a full-scale four-story steel building experi-mented to collapse using strong ground motions, Proceedings of International Symposi-um on Disaster Simulation and Structural Safety in the Next Generation 2011 (DS'11), 311-318, Kobe, Japan, 2011.
[8] D. Isobe, W.S. Han and T. Miyamura, Verification and validation of a seismic response analysis code for framed structures using the ASI-Gauss technique. Earthquake Engi-neering and Structural Dynamics (accepted).
[9] Website of Allied Engineering Corporation,
http://www.alde.co.jp/english/advc/index.html, as of 28/2/2013.
[10] H. Akiba et al., Large scale drop impact analysis of mobile phone using ADVC on Blue Gene/L. Proceedings of the International Conference on High Performance Computing Networking and Storage (SC06), Tampa, USA, 2006.
[11] S. Yoshimura, R. Shioya, H. Noguchi, T. Miyamura, Advanced general-purpose com-putational mechanics system for large scale analysis and design. Journal of Computa-tional and Applied Mathematics, 149(1), 279-296, 2002.
[12] M. Ohsaki, K. Kasai, Y. Matsuoka, J.Y. Zhang. Results of recent E-Defense tests on full-scale steel building: Part 2, Collapse simulation and blind analysis contest. Pro-ceedings of the Structures Congress 2008, ASCE, Vancouver, Canada, 2008.
[13] M. Ohsaki, J.Y. Zhang, T. Miyamura, A heuristic algorithm for parameter identification of steel materials under asymmetric cyclic elastoplastic deformation. Proceedings of the 7th China-Japan-Korea Joint Symposium on Optimization of Structural and Mechanical Systems (CJK-OSM7) (CD-ROM), Huangshan, China, 2012.
[14] K.M. Lynn, D. Isobe, Finite element code for impact collapse problems of framed struc-tures. International Journal for Numerical Methods in Engineering, 69(12), 2538-2563, 2007.
[15] Y. Toi, D. Isobe, Adaptively shifted integration technique for finite element collapse analysis of framed structures. International Journal for Numerical Methods in Engi-neering, 36(14), 2323-2339, 1993.