Draft 2015 Development Impact Fee Program - … · It is the intent that this report substantiates...
35
CITY OF BRENTWOOD DEVELOPMENT IMPACT FEE PROGRAM 2015
Transcript of Draft 2015 Development Impact Fee Program - … · It is the intent that this report substantiates...

CITY OF BRENTWOODDEVELOPMENT IMPACT
FEE PROGRAM2015
i
TABLE OF CONTENTS
Page Introduction ……………………………………………………………. 1 Program Overview ……………………………………………………………. 1 Fee Summary …………………………………………………………… 2 Land Use Categories and Growth Projections …………………………………. 3 Administration …………………………………………………………… 5 Community Facilities …………………………………………………………… 8 Fire Facilities …………………………………………………………... 10 Park and Trail Facilities ………………………………………………….. ………. 11 Roadway Facilities ………………………………………………….. ………. 15 Wastewater Facilities ………………………………………………….. ………. 27 Water Facilities …………………………………………………. ………. 29 Reimbursement Procedure …………………………………………………. ………. 31 Areas of Additional Fees …………………………………………………. ………. 32
1
INTRODUCTION
Development impact fees are monetary exactions charged by local agencies for the purpose of mitigating the cost of public facilities that are necessary to serve future development. California Government Code, §66000 et seq. sets guidelines for establishing impact fees, including identifying the fee’s purpose and a reasonable relationship between the need for the public facility, the amount of the fee and the type of development project on which the fee is imposed. It is the intent that this report substantiates the adoption of the City of Brentwood’s Development Impact Fee Program and Fee Schedule.
PROGRAM OVERVIEW As residential and non-residential growth increases the demand on the City’s infrastructure, the Development Fee Program is implemented to mitigate these impacts. The Program evaluates planned capital improvements, estimates costs to provide the additional infrastructure and allocates the costs proportionately based upon the demand imposed by the various types of new development. The City of Brentwood General Plan (2014) (“General Plan”) establishes guidelines for planning and development decisions within the City. The Circulation, Community Facilities and Services and Infrastructure Chapters of the General Plan include goals and policies for ensuring the facilities meet the needs of development that is identified. Infrastructure Master Plans model user demands and identify specific infrastructure that is necessary to serve the public. The City’s Capital Improvement Program further provides estimated costs and schedule of the planned facilities. The Development Fee Program augments the General Plan, Infrastructure Master Plans and Capital Improvement Program to make certain the required facilities are adequately funded and costs are apportioned to the various types of development in the form of development impact fees. Adjustment to the fees may be made annually by the Engineering News Record Construction Cost Index to ensure revenue is available when construction of the facilities are necessary. These fees are collected at issuance of building permit to new development and in the amount in effect at the time of issuance. It is important to note that this Program is NOT inclusive of all fees necessary and required during the development process and does NOT include City processing, plan checking, inspection, etc. nor does it include fees imposed by outside agencies such as Brentwood Union and Liberty Union High School Districts, East Contra Costa Regional Fee and Financing Authority and Contra Costa County Flood Control and Water Conservation District. Infrastructure within the City is developed in two ways: It is constructed by the development community in conjunction with their private development project, or it is constructed by the City as part of the Capital Improvement Program. In both situations, the costs of these public improvements are used to generate the fees called for in this document.

2
FEE SUMMARY Table 1 summarizes the City’s development impact fees for each facility category and type of land use identified in the General Plan. Subsequent chapters of the program more specifically identify the facilities, cost of facilities, demand factors by land use and cost allocation methodology to develop the fees. TABLE 1
CITY OF BRENTWOOD DEVELOPMENT FEE PROGRAM
SUMMARY OF FEES
RESIDENTIAL per Unit
NON-RESIDENTIAL per Building SF
Fee Category Single Family
Multi-Family
Active Adult Commercial Office
Industrial/ Institutional
Administration $ 615.66 $ 408.33 $ 308.84 $ 0.3626 $0.4665 $ 0.2779
Community Facilities $ 2,654.43 $ 1,760.50 $ 1,331.58 $ 0.4941 $0.6356 $ 0.3786
Fire* $ 819.25 $ 819.25 $ 819.25 $ 0.1613 $0.1613 $ 0.1613
Park and Trail $ 7,966.80 $ 5,283.84 $ 3,996.49
Roadway $11,200.60 $ 6,944.37 $ 4,928.26 $ 4.1736 $5.0067 $ 3.0914
Wastewater $ 5,555.58 $ 3,990.95 $ 4,535.17 $ 1.8584 $1.8584 $ 1.2906
Water $ 8,481.99 $ 3,641.15 $ 7,626.31 $ 1.0288 $1.2860 $ 1.1163
TOTAL $37,294.32 $22,848.39 $23,545.90 $ 8.08 $ 9.41 $ 6.32
*1998 EDFPD & 2004 City of Brentwood Fire Fee Studies

3
LAND USE CATEGORIES AND PROJECTIONS
Land use, dwelling unit density, dwelling unit occupancy and service population assumptions are based upon the City of Brentwood General Plan (2014). Land use categories are described below: Land Use Categories
Single-Family Residential (SFR) The single-family residential category includes residential development with a mid-range density of 8 units or less per acre. This category also includes single dwellings on individual legal parcels.
Multi-Family Residential (MFR) The multi-family residential category generally includes residential development with a mid-range density greater than 8 units per acre. This category is applicable to multiple unit dwellings on an individual legal parcel.
Active Adult Residential (AAR) The active adult residential category includes residential development with age-restricted occupancy. Such occupancy is restricted, among other methods, through land use entitlement and/or covenants.
Secondary Housing Unit (SHU)
The secondary housing unit category includes residential development as specifically defined in the City of Brentwood Municipal Code § 17.100.005.
Commercial
The commercial category includes non-residential development with retail and service activities, including, but not limited to, restaurants, gas stations and convenience centers.
Office
The office category includes non-residential development with professional and administrative office activities, including, but not limited to legal, financial, medical and dental activities.
Industrial The industrial category includes industrial and manufacturing activities that tend to have measurable impacts on the environment, i.e. generating truck traffic, noise and odors. This category also includes institutional and semi-public facilities.
Individual Circumstances Some development may include a combination of the above land use and/or activities. In such cases, fees will be calculated and imposed for each land use category included as a part of the development. Development or land uses that do not clearly fall within the previously listed categories may apply for an individual circumstance fee calculation. Individual circumstance fees shall be calculated through a reasonable interpretation of the Mitigation Fee Act and the City’s Fee program by the City Engineer using standard engineering factors and must mitigate the specific development’s impacts to the City’s infrastructure.
4
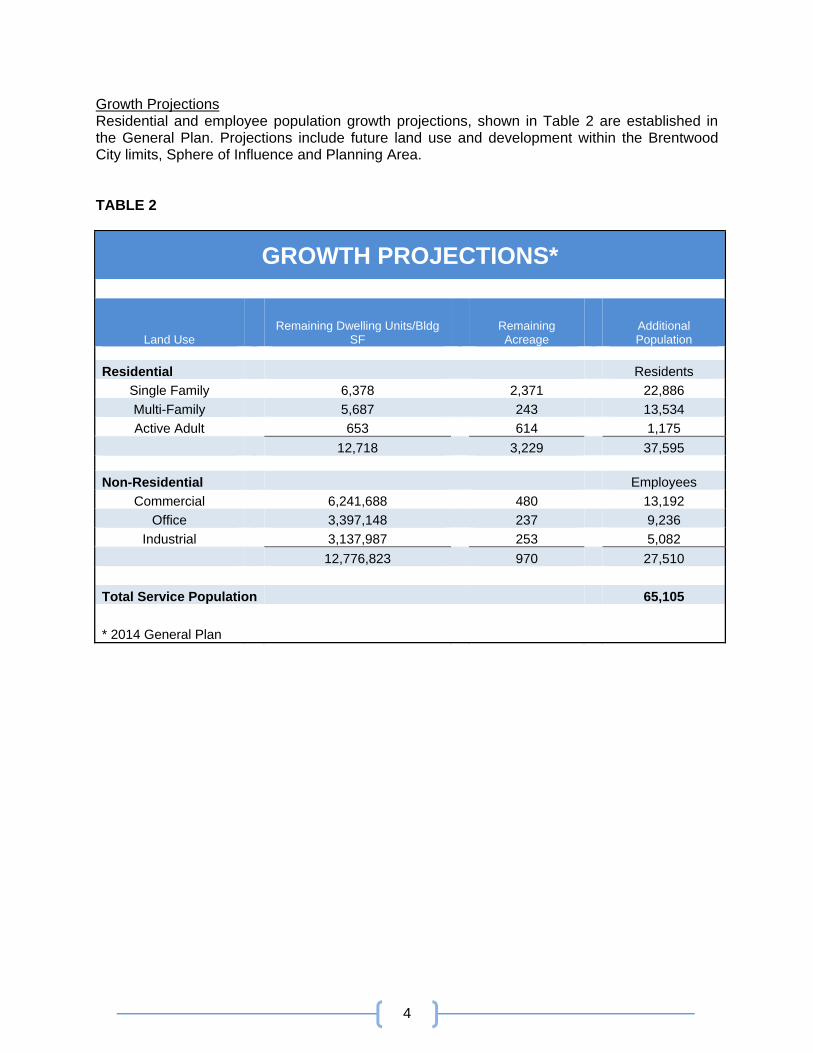
Growth Projections Residential and employee population growth projections, shown in Table 2 are established in the General Plan. Projections include future land use and development within the Brentwood City limits, Sphere of Influence and Planning Area. TABLE 2
GROWTH PROJECTIONS*
Land Use Remaining Dwelling Units/Bldg
SF Remaining Acreage
Additional Population
Residential Residents
Single Family 6,378 2,371 22,886
Multi-Family 5,687 243 13,534
Active Adult 653 614 1,175
12,718 3,229 37,595
Non-Residential Employees
Commercial 6,241,688 480 13,192
Office 3,397,148 237 9,236
Industrial 3,137,987 253 5,082
12,776,823 970 27,510
Total Service Population 65,105
* 2014 General Plan

5
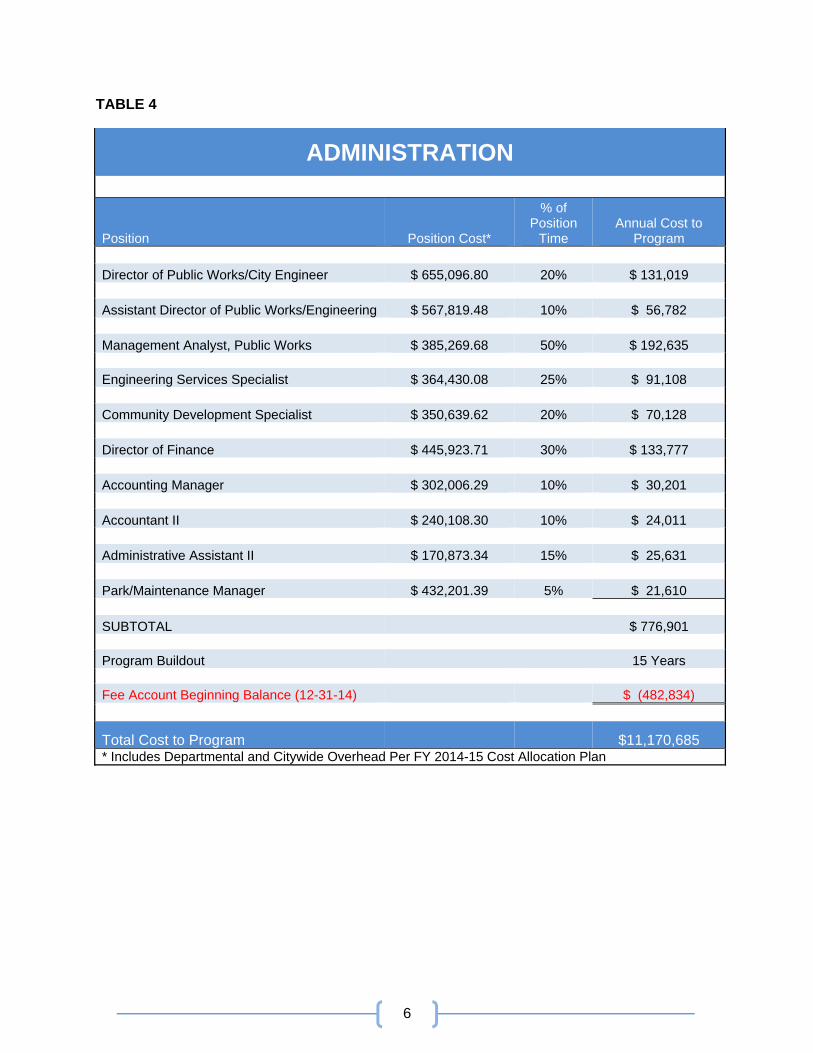
ADMINISTRATION City staff time and resources are necessary to administer the Development Fee Program, in addition to managing the planning, design and construction of the Capital Improvement Program and facilities identified in this report. Staff positions assigned to the Capital Improvement Program (Table 5) and Development Fee Program (Table 4) management are identified, along with allotted time. Position rates are as outlined in the City of Brentwood 2014-15 Cost Allocation Plan and include city-wide and departmental overheard expenses. Total Development Fee Program administrative expenses are allocated proportionately to future development on a service population basis. Occupancy per residential unit and estimated future employee population are pursuant to the General Plan. Table 3 summarizes the Administration Fee per residential dwelling unit and per non-residential building square footage. Capital Improvement Program management expenses are distributed to the individual fee categories proportionate to each category’s share of total program facility costs (Table 6).
TABLE 3
ADMINISTRATION COST SHARE
Land Use Service
Population % of Program Administration
Share of Program Administration
Cost per DU/ Bldg SF
Residential
Single Family 22,886 35% $ 3,926,700 $ 615.66
Multi-Family 13,534 21% $ 2,322,157 $ 408.33
Active Adult 1,175 2% $ 201,675 $ 308.84
Non-Residential
Commercial 13,192 20% $ 2,263,477 $ 0.3626
Office 9,236 14% $ 1,584,708 $ 0.4665
Industrial 5,082 8% $ 871,967 $ 0.2779
65,105
Total Cost to Program $ 11,170,685
6
TABLE 4
ADMINISTRATION
Position Position Cost*
% of Position
Time Annual Cost to
Program Director of Public Works/City Engineer $ 655,096.80 20% $ 131,019
Assistant Director of Public Works/Engineering $ 567,819.48 10% $ 56,782
Management Analyst, Public Works $ 385,269.68 50% $ 192,635
Engineering Services Specialist $ 364,430.08 25% $ 91,108
Community Development Specialist $ 350,639.62 20% $ 70,128
Director of Finance $ 445,923.71 30% $ 133,777
Accounting Manager $ 302,006.29 10% $ 30,201
Accountant II $ 240,108.30 10% $ 24,011
Administrative Assistant II $ 170,873.34 15% $ 25,631
Park/Maintenance Manager $ 432,201.39 5% $ 21,610
SUBTOTAL $ 776,901
Program Buildout 15 Years
Fee Account Beginning Balance (12-31-14) $ (482,834)
Total Cost to Program $11,170,685 * Includes Departmental and Citywide Overhead Per FY 2014-15 Cost Allocation Plan

TABLE 5
Position Position Cost* % of Position Time Annual Cost to Program
Director of Public Works/City Engineer 655,096.80$ 30% 196,529$
Assistant Director of Public Works/Engineering 567,819.48$ 30% 170,346$
Assistant Director of Public Works/Operations 567,819.48$ 30% 170,346$
Engineering Manager - 2X 504,675.67$ 20% each 201,870$
Operations Manager - 2X 432,144.45$ 20% each 172,858$
Project Services Specialist, Public Works 338,019.24$ 100% 338,019$
Administrative Secretary, Public Works 270,813.12$ 50% 135,407$
Senior Construction Inspector, Public Works 377,992.22$ 50% 188,996$
Construction Inspector II, Public Works 350,461.45$ 50% 175,231$
Engineering Technician 326,598.50$ 10% 32,660$
Geographic Information Systems Coordinator 427,690.71$ 10% 42,769$
Chief Building Official 517,407.40$ 5% 25,870$
Building Inspector II 353,397.02$ 5% 17,670$
Principal Planner 472,242.68$ 5% 23,612$
Park/Maintenance Supervisor 335,007.49$ 10% 33,501$
Construction Inspector I, Parks and Recreation 319,006.37$ 50% 159,503$
SUBTOTAL 2,085,187$
Years to Program Buildout 15$
Total Cost to Program 31,277,799$
Facility Category Total Facility Cost % of Project Management Share of Project Management
Community Facilitiespublic safety component 6,832,486.00$ 3% 913,831$
community amenity component 10,136,790.00$ 4% 1,355,775$
Parks and Trails 37,699,147.98$ 16% 5,042,185$
Roadway 85,455,336.64$ 37% 11,429,478$
Wastewater 52,761,786.75$ 23% 7,056,782$
Water 40,970,694.00$ 18% 5,479,747$
233,856,241.37$
Total Cost to Program 31,277,799$ * Includes Departmental and Citywide Overhead Per FY 2014-15 Cost Allocation Plan
CAPITAL IMPROVEMENT PROGRAM MANAGEMENT
CAPITAL IMPROVEMENT PROGRAM MANAGEMENT DISTRIBUTION
TABLE 6
‐ 7 ‐
8
COMMUNITY FACILITIES Various facilities are identified in the Capital Improvement Program to implement goals included within the General Plan, specifically:
Community Services and Facilities Goal 3: Maintain a safe community through the provision of high quality police services and crime prevention measures.
Community Services and Facilities Goal 5: Enhance the quality of life for all city residents through the provision of cultural and social resources including quality schools, libraries, medical and other community services and facilities.
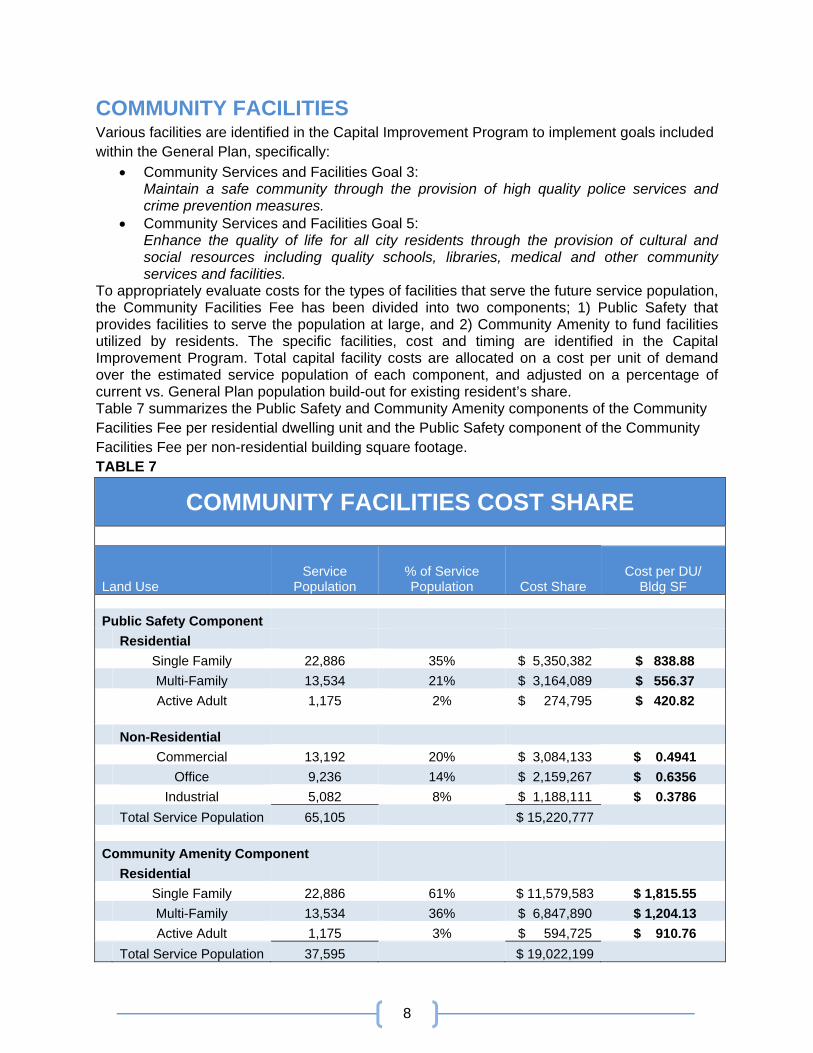
To appropriately evaluate costs for the types of facilities that serve the future service population, the Community Facilities Fee has been divided into two components; 1) Public Safety that provides facilities to serve the population at large, and 2) Community Amenity to fund facilities utilized by residents. The specific facilities, cost and timing are identified in the Capital Improvement Program. Total capital facility costs are allocated on a cost per unit of demand over the estimated service population of each component, and adjusted on a percentage of current vs. General Plan population build-out for existing resident’s share. Table 7 summarizes the Public Safety and Community Amenity components of the Community Facilities Fee per residential dwelling unit and the Public Safety component of the Community Facilities Fee per non-residential building square footage. TABLE 7
COMMUNITY FACILITIES COST SHARE
Land Use Service
Population % of Service Population Cost Share
Cost per DU/ Bldg SF
Public Safety Component
Residential
Single Family 22,886 35% $ 5,350,382 $ 838.88
Multi-Family 13,534 21% $ 3,164,089 $ 556.37
Active Adult 1,175 2% $ 274,795 $ 420.82
Non-Residential
Commercial 13,192 20% $ 3,084,133 $ 0.4941
Office 9,236 14% $ 2,159,267 $ 0.6356
Industrial 5,082 8% $ 1,188,111 $ 0.3786
Total Service Population 65,105 $ 15,220,777
Community Amenity Component
Residential
Single Family 22,886 61% $ 11,579,583 $ 1,815.55
Multi-Family 13,534 36% $ 6,847,890 $ 1,204.13
Active Adult 1,175 3% $ 594,725 $ 910.76
Total Service Population 37,595 $ 19,022,199

TABLE 8
Public Safety Component
Community Amenity Component
Facility Description Cost Cost
Maintenance Service and Emergency Operations Center 12,404,480$
Library 14,627,500$
Event Center 6,814,475$
Entry Monuments/Community Beautification 3,000,000$
Data/Communication Network 900,000$ existing residents share (7,442,688.00)$ (15,205,185)$
Dispatch Center 1,870,694$
Subtotal Construction Costs 6,832,486$ 10,136,790$
Administration Cost
Land Acquisition 2.0 Acres $150,000 per Acre 300,000.00$
Engineering Design and Plan Check 25% 1,708,121.50$ 2,534,198$
Financing 10% 683,248.60$ 1,013,679$
Construction Contingency 10% 683,248.60$ 1,013,679$
CIP Project Management 913,831$ 1,355,775.16$
Public Information 0.25% 17,081$ 25,342$
General Plan Update 5,000.00$ 5,000.00$ Previous construction projects under paymentPolice Station 7,313,801$
Civic Center Plaza 1,115,035$
City Hall 2,249,334$ 3,337,150$
City Data Center 306,028$ 454,028$
Communication Tower 258,159$ 383,009$
existing residents share (6,076,393.30)$ (3,173,533)$
Existing Civic Center Bond Debt Service 1,046,860$ 1,553,140$
Outstanding Reimbursement Obligations (12-31-14) 37,155$
Fee Account Beginning Balance (1-1-15) (720,029)$ (1,068,247)$
TOTAL FACILITY COSTS 15,220,777$ 19,022,199$
COMMUNITY FACILITIES
‐ 9 ‐

10
FIRE
The Fire Facility Fee was calculated on the per capita existing facility standard of the East Contra Costa Fire Protection District, formerly East Diablo Fire Protection District (Hausrath Economics Group Study 1998). The City of Brentwood Fire Mitigation Fee Study (2004) further identified the need for an additional fire station to serve new development and increased the existing Fire Fee by a factor necessary to provide adequate funds. These studies and fees have been previously approved and adopted by City Council Resolutions 98-85 (5-26-1998) and 2004-32 (2-10-2004), are not a part of this study and are listed for reference only.

11
PARK AND TRAIL FACILITIES
The General Plan outlines goals and policies to ensure high quality parks, trails and recreation facilities city wide. The following specific policies set forth park acreage standards for new development:
Community Services and Facilities Policy 2-2: Achieve and maintain overall citywide ratio of 5 acres of park land per 1,000 residents.
Community Services and Facilities Policy 2-3: Park acreage should be provided in accordance with the following standards: Neighborhood Park – 3 acres per 1,000 residents Community Park – 2 acres per 1,000 residents
Through this facility demand standard, future park acreage has been identified pursuant to the General Plan new development population (Table 10). Park acreage construction costs are determined by park design standards and amenities as required by the Parks and Recreation Commission during park design review (Tables 11A and 11B). Future trail segments are identified in the Parks, Trails and Recreation Master Plan. Table 9 summarizes the Park and Trail Facilities Fee per residential dwelling unit. Park and trail total facility costs are allocated proportionately to future residential development on a population volume basis. Non-residential development is not allocated a cost share as they do not contribute to the facility demand standard of 5 acres per 1,000 residents. TABLE 9
PARKS AND TRAIL COST SHARE
Land Use Remaining
Dwelling Units* Additional Population
% of Additional Population Cost Share
Cost per DU/ Bldg SF
Residential Single Family 6,378 22,886 61% $ 50,812,282 $ 7,966.80
Multi-Family 5,687 13,534 36% $ 30,049,176 $ 5,283.84
Active Adult 653 1,175 3% $ 2,609,709 $ 3,996.49
Total Additional Population 37,595 100% $ 83,471,167
* 2014 General Plan
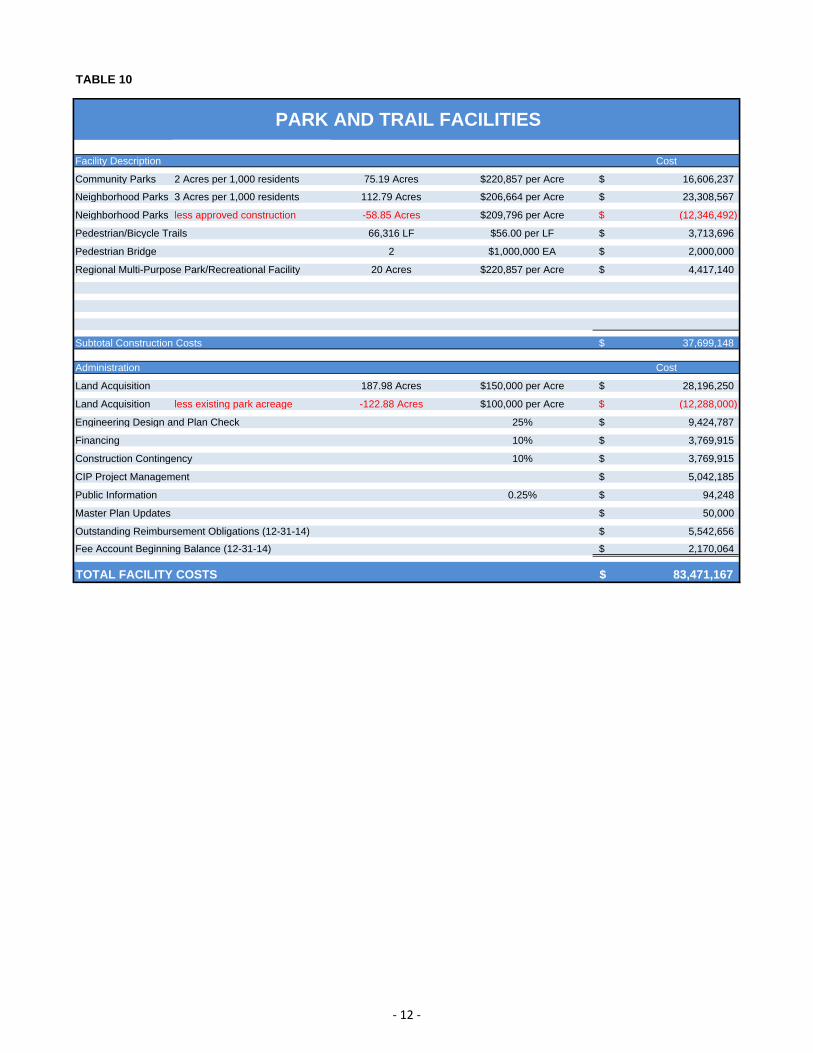
TABLE 10
Facility Description Cost
Community Parks 2 Acres per 1,000 residents 75.19 Acres $220,857 per Acre 16,606,237$
Neighborhood Parks 3 Acres per 1,000 residents 112.79 Acres $206,664 per Acre 23,308,567$
Neighborhood Parks less approved construction -58.85 Acres $209,796 per Acre (12,346,492)$
Pedestrian/Bicycle Trails 66,316 LF $56.00 per LF 3,713,696$
Pedestrian Bridge 2 $1,000,000 EA 2,000,000$
Regional Multi-Purpose Park/Recreational Facility 20 Acres $220,857 per Acre 4,417,140$
Subtotal Construction Costs 37,699,148$
Administration Cost
Land Acquisition 187.98 Acres $150,000 per Acre 28,196,250$
Land Acquisition less existing park acreage -122.88 Acres $100,000 per Acre (12,288,000)$
Engineering Design and Plan Check 25% 9,424,787$
Financing 10% 3,769,915$
Construction Contingency 10% 3,769,915$
CIP Project Management 5,042,185$
Public Information 0.25% 94,248$
Master Plan Updates 50,000$
Outstanding Reimbursement Obligations (12-31-14) 5,542,656$
Fee Account Beginning Balance (12-31-14) 2,170,064$
TOTAL FACILITY COSTS 83,471,167$
PARK AND TRAIL FACILITIES
‐ 12 ‐
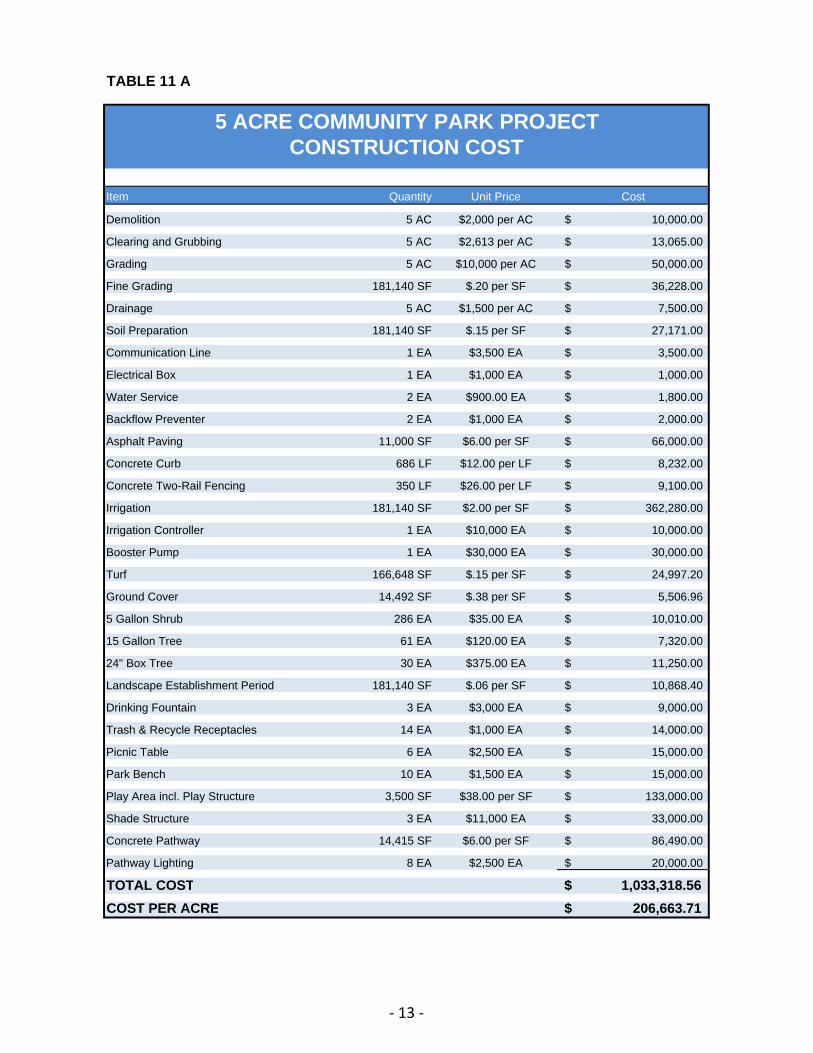
TABLE 11 A
Item Quantity Unit Price Cost
Demolition 5 AC $2,000 per AC 10,000.00$
Clearing and Grubbing 5 AC $2,613 per AC 13,065.00$
Grading 5 AC $10,000 per AC 50,000.00$
Fine Grading 181,140 SF $.20 per SF 36,228.00$
Drainage 5 AC $1,500 per AC 7,500.00$
Soil Preparation 181,140 SF $.15 per SF 27,171.00$
Communication Line 1 EA $3,500 EA 3,500.00$
Electrical Box 1 EA $1,000 EA 1,000.00$
Water Service 2 EA $900.00 EA 1,800.00$
Backflow Preventer 2 EA $1,000 EA 2,000.00$
Asphalt Paving 11,000 SF $6.00 per SF 66,000.00$
Concrete Curb 686 LF $12.00 per LF 8,232.00$
Concrete Two-Rail Fencing 350 LF $26.00 per LF 9,100.00$
Irrigation 181,140 SF $2.00 per SF 362,280.00$
Irrigation Controller 1 EA $10,000 EA 10,000.00$
Booster Pump 1 EA $30,000 EA 30,000.00$
Turf 166,648 SF $.15 per SF 24,997.20$
Ground Cover 14,492 SF $.38 per SF 5,506.96$
5 Gallon Shrub 286 EA $35.00 EA 10,010.00$
15 Gallon Tree 61 EA $120.00 EA 7,320.00$
24" Box Tree 30 EA $375.00 EA 11,250.00$
Landscape Establishment Period 181,140 SF $.06 per SF 10,868.40$
Drinking Fountain 3 EA $3,000 EA 9,000.00$
Trash & Recycle Receptacles 14 EA $1,000 EA 14,000.00$
Picnic Table 6 EA $2,500 EA 15,000.00$
Park Bench 10 EA $1,500 EA 15,000.00$
Play Area incl. Play Structure 3,500 SF $38.00 per SF 133,000.00$
Shade Structure 3 EA $11,000 EA 33,000.00$
Concrete Pathway 14,415 SF $6.00 per SF 86,490.00$
Pathway Lighting 8 EA $2,500 EA 20,000.00$
TOTAL COST 1,033,318.56$
COST PER ACRE 206,663.71$
5 ACRE COMMUNITY PARK PROJECT CONSTRUCTION COST
‐ 13 ‐
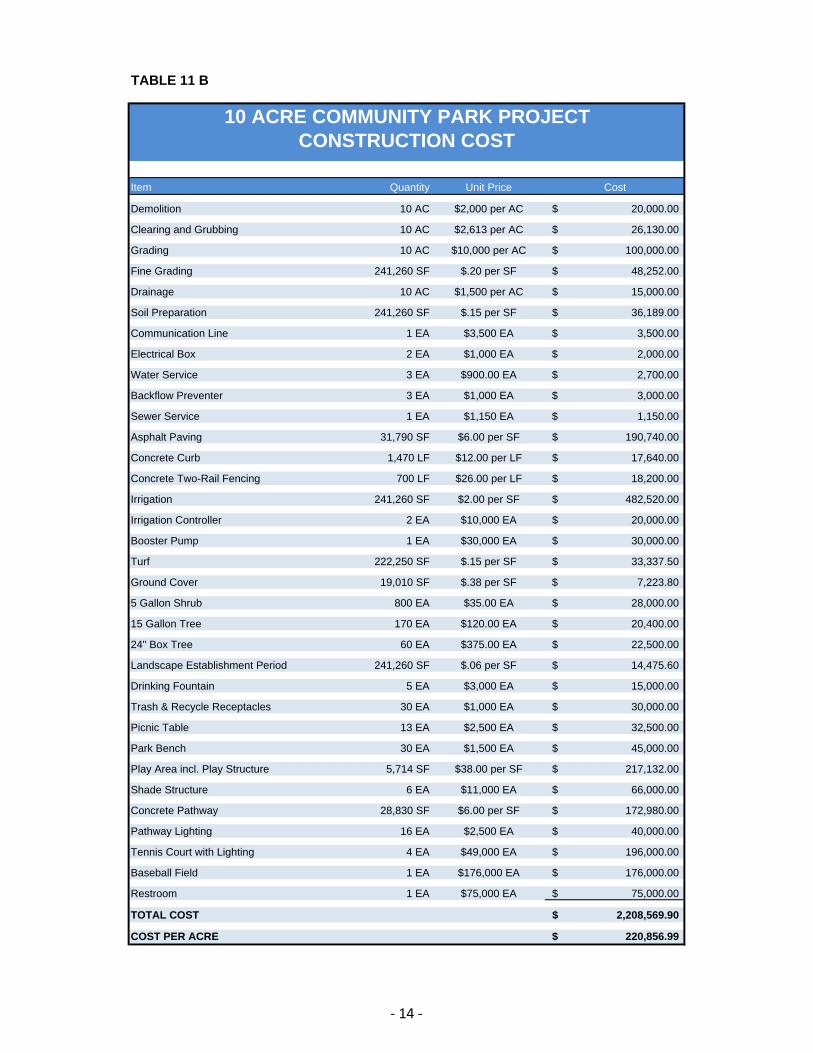
TABLE 11 B
Item Quantity Unit Price Cost
Demolition 10 AC $2,000 per AC 20,000.00$
Clearing and Grubbing 10 AC $2,613 per AC 26,130.00$
Grading 10 AC $10,000 per AC 100,000.00$
Fine Grading 241,260 SF $.20 per SF 48,252.00$
Drainage 10 AC $1,500 per AC 15,000.00$
Soil Preparation 241,260 SF $.15 per SF 36,189.00$
Communication Line 1 EA $3,500 EA 3,500.00$
Electrical Box 2 EA $1,000 EA 2,000.00$
Water Service 3 EA $900.00 EA 2,700.00$
Backflow Preventer 3 EA $1,000 EA 3,000.00$
Sewer Service 1 EA $1,150 EA 1,150.00$
Asphalt Paving 31,790 SF $6.00 per SF 190,740.00$
Concrete Curb 1,470 LF $12.00 per LF 17,640.00$
Concrete Two-Rail Fencing 700 LF $26.00 per LF 18,200.00$
Irrigation 241,260 SF $2.00 per SF 482,520.00$
Irrigation Controller 2 EA $10,000 EA 20,000.00$
Booster Pump 1 EA $30,000 EA 30,000.00$
Turf 222,250 SF $.15 per SF 33,337.50$
Ground Cover 19,010 SF $.38 per SF 7,223.80$
5 Gallon Shrub 800 EA $35.00 EA 28,000.00$
15 Gallon Tree 170 EA $120.00 EA 20,400.00$
24" Box Tree 60 EA $375.00 EA 22,500.00$
Landscape Establishment Period 241,260 SF $.06 per SF 14,475.60$
Drinking Fountain 5 EA $3,000 EA 15,000.00$
Trash & Recycle Receptacles 30 EA $1,000 EA 30,000.00$
Picnic Table 13 EA $2,500 EA 32,500.00$
Park Bench 30 EA $1,500 EA 45,000.00$
Play Area incl. Play Structure 5,714 SF $38.00 per SF 217,132.00$
Shade Structure 6 EA $11,000 EA 66,000.00$
Concrete Pathway 28,830 SF $6.00 per SF 172,980.00$
Pathway Lighting 16 EA $2,500 EA 40,000.00$
Tennis Court with Lighting 4 EA $49,000 EA 196,000.00$
Baseball Field 1 EA $176,000 EA 176,000.00$
Restroom 1 EA $75,000 EA 75,000.00$
TOTAL COST 2,208,569.90$
COST PER ACRE 220,856.99$
10 ACRE COMMUNITY PARK PROJECT CONSTRUCTION COST
‐ 14 ‐

15
ROADWAY FACILITIES
The Circulation Element of the General Plan provides a framework for roadway transportation facilities (Tables 13-15) and guides development of the City’s transportation system. Once identified, roadway design standards are further guided by The City of Brentwood Standard Plans and Specifications (Tables 16, 17A-G), with street sections necessary to serve additional traffic demand. Table 12 summarizes traffic demand generated as a result of additional development and allocates the cost of roadway facilities proportionately, based upon total peak hour trip generation volume, for each land use. Commercial trip generation volume is adjusted for traffic trips that were not originated by the commercial development and are a result of pass-by traffic. Commercial, Office and Industrial trip generation volume serving local residential development is allocated to residential traffic volume. TABLE 12
ROADWAY COST SHARE
Land Use
Remaining Dwelling
Units/Bldg SF*
Peak Hour
Trips** % of Traffic Generation Cost Share
Cost per DU/Bldg SF
Residential
Single Family 6,378 6,378 43% $ 71,437,425 $ 11,200.60
Multi-Family 5,687 3,526 24% $ 39,492,642 $ 6,944.37
Active Adult 653 287 2% $ 3,218,156 $ 4,928.26
Non-Residential
Commercial 6,241,688 2,326 16% $ 26,050,456 $ 4.17
Office 3,397,148 1,519 10% $ 17,008,390 $ 5.01
Industrial 3,137,987 866 6% $ 9,700,665 $ 3.09
Total Traffic Trips 14,902 100% $ 166,907,736
* 2014 General Plan
**ITE Trip Generation 9th Edition

TABLE 13
Facility Description Unit Cost Cost
New Roadways
Residential 2-Lane Collector (60' RoW) 2,605 LF 453$
Industrial/Commercial Street (64' RoW) 1,835 LF 105$ 192,600$
Modified 2-Lane Collector (96' RoW) 8,845 LF 298$ 2,631,395$
4-Lane Arterial (140' RoW) 21,160 LF 531$ 11,243,239$
Widened Roadways
Residential 2-Lane Collector (60' RoW) 39,179 LF 370$ -$
4-Lane Arterial (140' RoW) 28,600 LF 523$ 14,966,952$
4-Lane Arterial (140' RoW) CIP 12,907 LF 893$ 11,528,042$
6-Lane Arterial (164' RoW) CIP 3,162 LF 947$ 2,994,304$
Crossings with other Utility Districts/Agencies/CreeksRailroad Undercrossing 2 $12,000,000 per xing 24,000,000$ Railroad At-Grade Crossing 1 $2,000,000 per xing 2,000,000$ Structures over EBMUD/CCWC 3 $75,000 per xing 225,000$ Structures Bridges 5 $1,500,000 per xing 7,500,000$
Traffic Signals3-way 2.5 $240,000 each 600,000$ 4-way 6.5 $300,000 each 1,950,000$
Overhead to Underground Utility Conversion - CIP Only 16,069 LF $325.00 per LF 5,222,425$
Soundwall - CIP Only 16,069 LF $20.00 per LF 321,380$
Bus Turnout and Shelter 5 $16,000 EA 80,000$
Subtotal Construction Costs 85,455,337$
Administration Cost
Land Acquisition 122.57 Acres $185,000 per Acre 22,675,326$
Engineering Design and Plan Check 25% 21,363,834$
Financing 10% 8,545,534$
Traffic Control 2% 1,709,107$
Construction Contingency 10% 8,545,534$
CIP Project Management 11,429,478$
Public Information 0.25% 213,638$
General Plan Update 10,000$
Existing Roadway Bond Debt Service 4,884,500$
Outstanding Reimbursement Obligations (12-31-14) 5,279,187$
Fee Account Beginning Balance (12-31-14) (3,203,739.00)$
TOTAL FACILITY COSTS 166,907,736$
ROADWAY FACILITIES
‐ 16 ‐
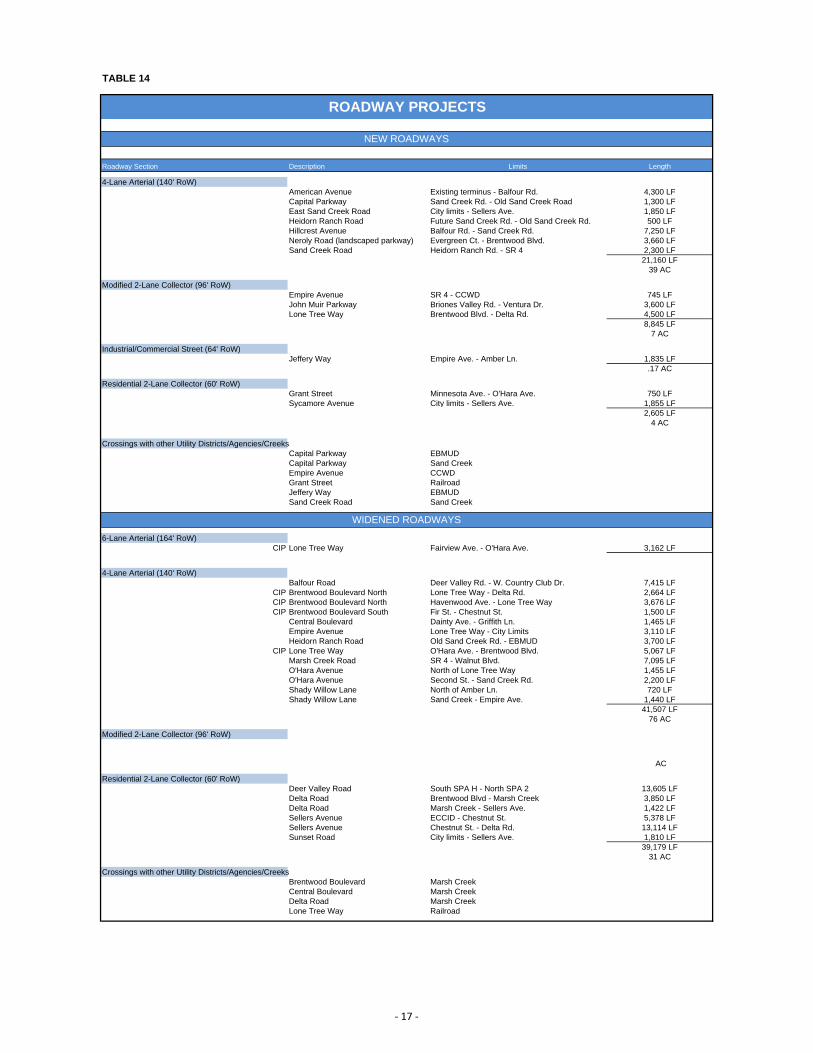
TABLE 14
Roadway Section Description Limits Length
4-Lane Arterial (140' RoW)American Avenue Existing terminus - Balfour Rd. 4,300 LFCapital Parkway Sand Creek Rd. - Old Sand Creek Road 1,300 LFEast Sand Creek Road City limits - Sellers Ave. 1,850 LFHeidorn Ranch Road Future Sand Creek Rd. - Old Sand Creek Rd. 500 LFHillcrest Avenue Balfour Rd. - Sand Creek Rd. 7,250 LFNeroly Road (landscaped parkway) Evergreen Ct. - Brentwood Blvd. 3,660 LFSand Creek Road Heidorn Ranch Rd. - SR 4 2,300 LF
21,160 LF39 AC
Modified 2-Lane Collector (96' RoW)Empire Avenue SR 4 - CCWD 745 LFJohn Muir Parkway Briones Valley Rd. - Ventura Dr. 3,600 LFLone Tree Way Brentwood Blvd. - Delta Rd. 4,500 LF
8,845 LF7 AC
Industrial/Commercial Street (64' RoW)Jeffery Way Empire Ave. - Amber Ln. 1,835 LF
.17 AC
Residential 2-Lane Collector (60' RoW)Grant Street Minnesota Ave. - O'Hara Ave. 750 LFSycamore Avenue City limits - Sellers Ave. 1,855 LF
2,605 LF4 AC
Crossings with other Utility Districts/Agencies/CreeksCapital Parkway EBMUDCapital Parkway Sand CreekEmpire Avenue CCWDGrant Street RailroadJeffery Way EBMUDSand Creek Road Sand Creek
6-Lane Arterial (164' RoW)CIP Lone Tree Way Fairview Ave. - O'Hara Ave. 3,162 LF
4-Lane Arterial (140' RoW)Balfour Road Deer Valley Rd. - W. Country Club Dr. 7,415 LF
CIP Brentwood Boulevard North Lone Tree Way - Delta Rd. 2,664 LFCIP Brentwood Boulevard North Havenwood Ave. - Lone Tree Way 3,676 LFCIP Brentwood Boulevard South Fir St. - Chestnut St. 1,500 LF
Central Boulevard Dainty Ave. - Griffith Ln. 1,465 LFEmpire Avenue Lone Tree Way - City Limits 3,110 LFHeidorn Ranch Road Old Sand Creek Rd. - EBMUD 3,700 LF
CIP Lone Tree Way O'Hara Ave. - Brentwood Blvd. 5,067 LFMarsh Creek Road SR 4 - Walnut Blvd. 7,095 LFO'Hara Avenue North of Lone Tree Way 1,455 LFO'Hara Avenue Second St. - Sand Creek Rd. 2,200 LFShady Willow Lane North of Amber Ln. 720 LFShady Willow Lane Sand Creek - Empire Ave. 1,440 LF
41,507 LF76 AC
Modified 2-Lane Collector (96' RoW)
AC
Residential 2-Lane Collector (60' RoW)Deer Valley Road South SPA H - North SPA 2 13,605 LFDelta Road Brentwood Blvd - Marsh Creek 3,850 LFDelta Road Marsh Creek - Sellers Ave. 1,422 LFSellers Avenue ECCID - Chestnut St. 5,378 LFSellers Avenue Chestnut St. - Delta Rd. 13,114 LFSunset Road City limits - Sellers Ave. 1,810 LF
39,179 LF31 AC
Crossings with other Utility Districts/Agencies/CreeksBrentwood Boulevard Marsh CreekCentral Boulevard Marsh CreekDelta Road Marsh CreekLone Tree Way Railroad
ROADWAY PROJECTS
NEW ROADWAYS
WIDENED ROADWAYS
‐ 17 ‐

TABLE 15
Intersection Location Signal Type Cost Share Fee Program Share
Balfour Road/Deer Valley Road 3-way City/Antioch 50%Balfour Road/Hillcrest Avenue 4-way City 100%Balfour Road/Sellers Avenue 4-way City 100%Brentwood Boulevard/Guthrie Lane 4-way City 100%Brentwood Boulevard/Neroly Road/Delta Road 4-way City/Oakley 50%Central Boulevard/Dainty Avenue 3-way City 100%East Sand Creek Road/Sellers Avenue 3-way City 100%Oak Street/Garin Parkway 4-way City 50%Sand Creek Road/Capital Parkway/Bridle Gate Drive 4-way City 100%Sand Creek Road/Heidorn Ranch Road 4-way City/Antioch 50%Shady Willow Lane/Amber Lane 4-way City 100%
ROADWAY PROJECTS
TRAFFIC SIGNALS
‐ 18 ‐
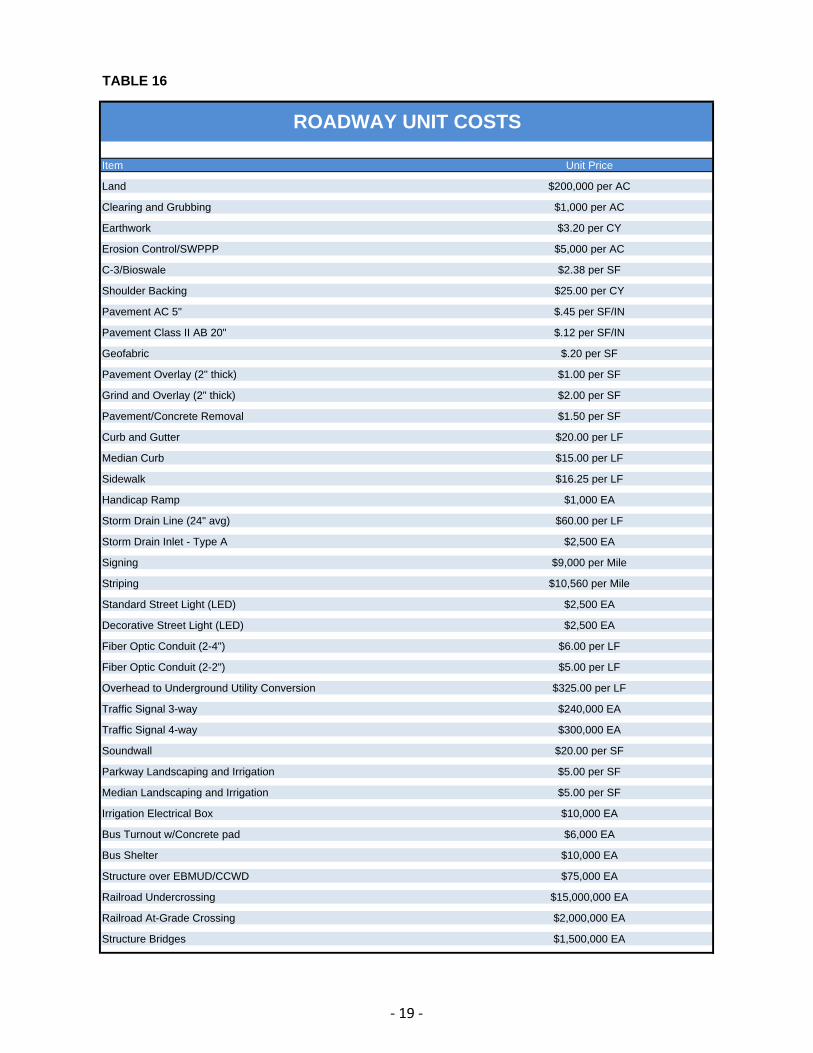
TABLE 16
Item Unit Price
Land $200,000 per AC
Clearing and Grubbing $1,000 per AC
Earthwork $3.20 per CY
Erosion Control/SWPPP $5,000 per AC
C-3/Bioswale $2.38 per SF
Shoulder Backing $25.00 per CY
Pavement AC 5" $.45 per SF/IN
Pavement Class II AB 20" $.12 per SF/IN
Geofabric $.20 per SF
Pavement Overlay (2" thick) $1.00 per SF
Grind and Overlay (2" thick) $2.00 per SF
Pavement/Concrete Removal $1.50 per SF
Curb and Gutter $20.00 per LF
Median Curb $15.00 per LF
Sidewalk $16.25 per LF
Handicap Ramp $1,000 EA
Storm Drain Line (24" avg) $60.00 per LF
Storm Drain Inlet - Type A $2,500 EA
Signing $9,000 per Mile
Striping $10,560 per Mile
Standard Street Light (LED) $2,500 EA
Decorative Street Light (LED) $2,500 EA
Fiber Optic Conduit (2-4") $6.00 per LF
Fiber Optic Conduit (2-2") $5.00 per LF
Overhead to Underground Utility Conversion $325.00 per LF
Traffic Signal 3-way $240,000 EA
Traffic Signal 4-way $300,000 EA
Soundwall $20.00 per SF
Parkway Landscaping and Irrigation $5.00 per SF
Median Landscaping and Irrigation $5.00 per SF
Irrigation Electrical Box $10,000 EA
Bus Turnout w/Concrete pad $6,000 EA
Bus Shelter $10,000 EA
Structure over EBMUD/CCWD $75,000 EA
Railroad Undercrossing $15,000,000 EA
Railroad At-Grade Crossing $2,000,000 EA
Structure Bridges $1,500,000 EA
ROADWAY UNIT COSTS
‐ 19 ‐

TABLE 17 A
Item Unit Cost
Quantity Cost Quantity Cost
Clearing and Grubbing $1,000 per AC 0.69 690.00$ 0.39 390.00$
Earthwork $3.20 per CY 1,667.00 5,334.40$ 1,025.00 3,280.00$
Erosion Control/SWPPP $5,000 per AC 0.69 3,450.00$ 0.69 3,450.00$
Pavement AC $.45 per SF/IN 18,500.00 41,625.00$ 7,500.00 16,875.00$
Pavement Class II AB $.12 per SF/IN 18,500.00 44,400.00$ 7,500.00 18,000.00$
Geofabric $.20 per SF 20,000.00 4,000.00$ 9,000.00 1,800.00$
Pavement Overlay (2" thick) $1.00 per SF - -$ 11,000.00 11,000.00$
Pavement/Concrete Removal $1.50 per SF - -$ 2,000.00 3,000.00$
Curb and Gutter $20.00 per SF 1,000.00 20,000.00$ 1,000.00 20,000.00$
Sidewalk $16.25 per LF 1,000.00 16,250.00$ 1,000.00 16,250.00$
Handicap Ramp $1,000 EA 4.00 4,000.00$ 4.00 4,000.00$
Storm Drain Line (24" avg) $60.00 per LF 582.00 34,920.00$ 582.00 34,920.00$
Storm Drain Inlet - Type A $2,500 EA 4.00 10,000.00$ 4.00 10,000.00$
Signing $9,000 per Mile 0.10 900.00$ 0.10 900.00$
Striping $10,560 per Mile 0.10 1,056.00$ 0.10 1,056.00$
Decorative Street Light (LED) $2,500 EA 2.00 5,000.00$ 2.00 5,000.00$
Fiber Optic Conduit (2-2") $5.00 per LF 500.00 2,500.00$ 500.00 2,500.00$
Parkway Landscaping and Irrigation $5.00 per SF 4,500.00 22,500.00$ 4,500.00 22,500.00$
Irrigation Electrical Box $10,000 EA 1.00 10,000.00$ 1.00 10,000.00$
TOTAL COST 226,625.40$ 184,921.00$
LINEAR FOOT PRICE 453$ 370$
DEVELOPMENT RESPONSIBILITY 453$ 370$
ROADWAY CONSTRUCTION COSTS
RESIDENTIAL COLLECTOR STREET STANDARD ST-4 60' RIGHT-OF-WAY - 500 LINEAR FEET
New Road Widen Road
‐ 20 ‐

TABLE 17B
Item Unit Cost
Quantity Cost Quantity Cost
Clearing and Grubbing $1,000 per AC 0.73 730.00$ 0.44 440.00$
Earthwork $3.20 per CY 1,778.00 5,689.60$ 1,056.00 3,379.20$
Erosion Control/SWPPP $5,000 per AC 0.73 3,650.00$ 0.44 2,200.00$
Pavement AC $.45 per SF/IN 20,500.00 46,125.00$ 7,500.00 16,875.00$
Pavement Class II AB $.12 per SF/IN 20,500.00 49,200.00$ 7,500.00 18,000.00$
Geofabric $.20 per SF 22,000.00 4,400.00$ 9,000.00 1,800.00$
Pavement/Concrete Removal $1.50 per SF - -$ 2,000.00 3,000.00$
Curb and Gutter $20.00 per LF 1,000.00 20,000.00$ 1,000.00 20,000.00$
Sidewalk $16.25 per LF 1,000.00 16,250.00$ 1,000.00 16,250.00$
Handicap Ramp $1,000 EA 4.00 4,000.00$ 4.00 4,000.00$
Storm Drain Line (24" avg) $60.00 per LF 590.00 35,400.00$ 590.00 35,400.00$
Storm Drain Inlet - Type A $2,500 EA 4.00 10,000.00$ 4.00 10,000.00$
Signing $9,000 per Mile 0.10 900.00$ 0.10 900.00$
Striping $10,560 per Mile 0.10 1,056.00$ 0.10 1,056.00$
Standard Street Light (LED) $2,500 EA 2.00 5,000.00$ 2.00 5,000.00$
Fiber Optic Conduit (2-2") $5.00 per LF 500.00 2,500.00$ 500.00 2,500.00$
Parkway Landscaping and Irrigation $5.00 per SF 4,500.00 22,500.00$ 4,500.00 22,500.00$
Irrigation Electrical Box $10,000 EA 1.00 10,000.00$ 1.00 10,000.00$
TOTAL COST 237,400.60$ 173,300.20$
LINEAR FOOT PRICE 475$ 347$
DEVELOPMENT RESPONSIBILITY 370$ 370$
LINEAR FOOT REIMBURSEMENT PRICE 105$ (23)$
ROADWAY CONSTRUCTION COSTS
INDUSTRIAL/COMMERCIAL STREET STANDARD ST-3 64' RIGHT-OF-WAY - 500 LINEAR FEET
New Road Widen Road
‐ 21 ‐
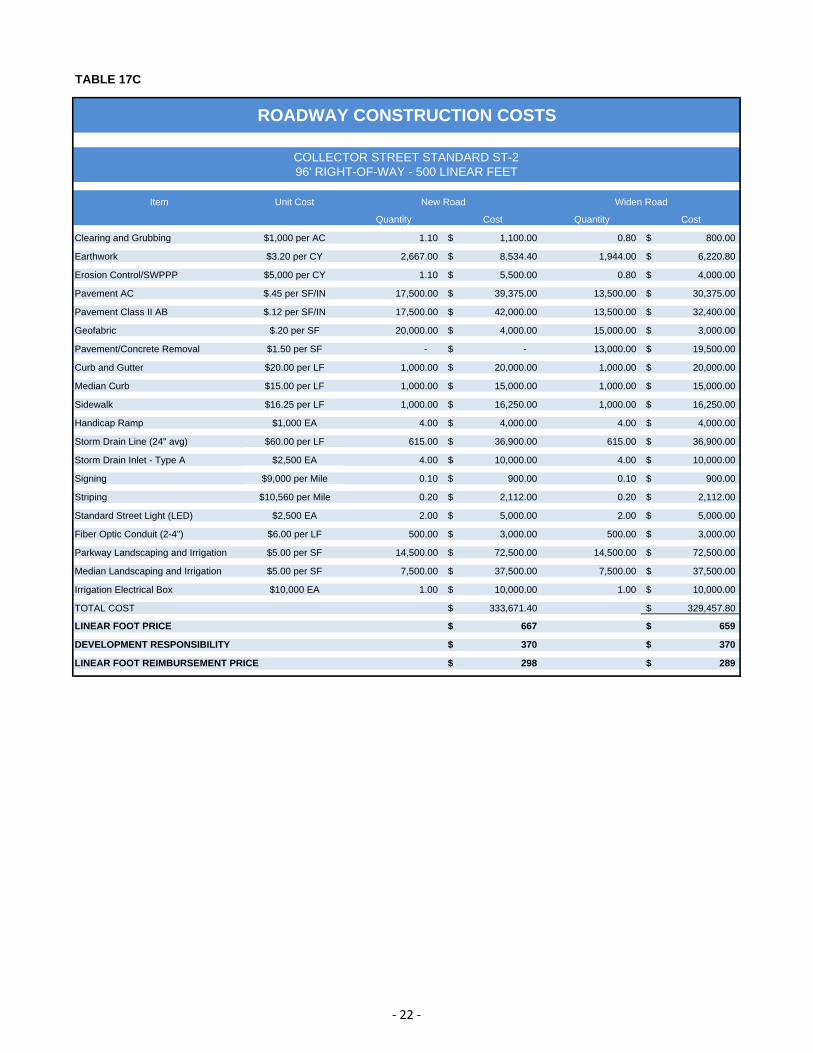
TABLE 17C
Item Unit Cost
Quantity Cost Quantity Cost
Clearing and Grubbing $1,000 per AC 1.10 1,100.00$ 0.80 800.00$
Earthwork $3.20 per CY 2,667.00 8,534.40$ 1,944.00 6,220.80$
Erosion Control/SWPPP $5,000 per CY 1.10 5,500.00$ 0.80 4,000.00$
Pavement AC $.45 per SF/IN 17,500.00 39,375.00$ 13,500.00 30,375.00$
Pavement Class II AB $.12 per SF/IN 17,500.00 42,000.00$ 13,500.00 32,400.00$
Geofabric $.20 per SF 20,000.00 4,000.00$ 15,000.00 3,000.00$
Pavement/Concrete Removal $1.50 per SF - -$ 13,000.00 19,500.00$
Curb and Gutter $20.00 per LF 1,000.00 20,000.00$ 1,000.00 20,000.00$
Median Curb $15.00 per LF 1,000.00 15,000.00$ 1,000.00 15,000.00$
Sidewalk $16.25 per LF 1,000.00 16,250.00$ 1,000.00 16,250.00$
Handicap Ramp $1,000 EA 4.00 4,000.00$ 4.00 4,000.00$
Storm Drain Line (24" avg) $60.00 per LF 615.00 36,900.00$ 615.00 36,900.00$
Storm Drain Inlet - Type A $2,500 EA 4.00 10,000.00$ 4.00 10,000.00$
Signing $9,000 per Mile 0.10 900.00$ 0.10 900.00$
Striping $10,560 per Mile 0.20 2,112.00$ 0.20 2,112.00$
Standard Street Light (LED) $2,500 EA 2.00 5,000.00$ 2.00 5,000.00$
Fiber Optic Conduit (2-4") $6.00 per LF 500.00 3,000.00$ 500.00 3,000.00$
Parkway Landscaping and Irrigation $5.00 per SF 14,500.00 72,500.00$ 14,500.00 72,500.00$
Median Landscaping and Irrigation $5.00 per SF 7,500.00 37,500.00$ 7,500.00 37,500.00$
Irrigation Electrical Box $10,000 EA 1.00 10,000.00$ 1.00 10,000.00$
TOTAL COST 333,671.40$ 329,457.80$
LINEAR FOOT PRICE 667$ 659$
DEVELOPMENT RESPONSIBILITY 370$ 370$
LINEAR FOOT REIMBURSEMENT PRICE 298$ 289$
ROADWAY CONSTRUCTION COSTS
COLLECTOR STREET STANDARD ST-2 96' RIGHT-OF-WAY - 500 LINEAR FEET
New Road Widen Road
‐ 22 ‐

TABLE 17D
Item Unit Cost
Quantity Cost Quantity Cost
Clearing and Grubbing $1,000 per AC 1.61 1,610.00$ 1.31 1,310.00$
Earthwork $3.20 per CY 3,555.00 11,376.00$ 2,895.00 9,264.00$
Erosion Control/SWPPP $5,000 per AC 1.61 8,050.00$ 1.31 6,550.00$
Pavement AC $.45 per SF/IN 29,500.00 66,375.00$ 25,500.00 57,375.00$
Pavement Class II AB $.12 per SF/IN 29,500.00 70,800.00$ 25,500.00 61,200.00$
Geofabric $.20 per SF 32,000.00 6,400.00$ 27,000.00 5,400.00$
Pavement/Concrete Removal $1.50 per SF - -$ 13,000.00 19,500.00$
Curb and Gutter $20.00 per LF 1,000.00 20,000.00$ 1,000.00 20,000.00$
Median Curb $15.00 per LF 1,000.00 15,000.00$ 1,000.00 15,000.00$
Sidewalk $16.25 per LF 1,000.00 16,250.00$ 1,000.00 16,250.00$
Handicap Ramp $1,000 EA 4.00 4,000.00$ 4.00 4,000.00$
Storm Drain Line (24" avg) $60.00 per LF 662.00 39,720.00$ 662.00 39,720.00$
Storm Drain Inlet - Type A $2,500 EA 4.00 10,000.00$ 4.00 10,000.00$
Signing $9,000 per Mile 0.10 900.00$ 0.10 900.00$
Striping $10,560 per Mile 0.20 2,112.00$ 0.20 2,112.00$
Standard Street Light (LED) $2,500 EA 2.00 5,000.00$ 2.00 5,000.00$
Fiber Optic Conduit (2-4") $6.00 per LF 500.00 3,000.00$ 500.00 3,000.00$
Parkway Landscaping and Irrigation $5.00 per SF 24,500.00 122,500.00$ 24,500.00 122,500.00$
Median Landscaping and Irrigation $5.00 per SF 7,500.00 37,500.00$ 7,500.00 37,500.00$
Irrigation Electrical Box $10,000 EA 1.00 10,000.00$ 1.00 10,000.00$
TOTAL COST 450,593.00$ 446,581.00$
LINEAR FOOT PRICE 901$ 893$
DEVELOPMENT RESPONSIBILITY 370$ 370$
LINEAR FOOT REIMBURSEMENT PRICE 531$ 523$
ROADWAY CONSTRUCTION COSTS
ARTERIAL STREET STANDARD ST-1 140' RIGHT-OF-WAY - 500 LINEAR FEET
New Road Widen Road
‐ 23 ‐

TABLE 17E
Item Unit Cost
Quantity Cost Quantity Cost
Clearing and Grubbing $1,000 per AC 1.61 1,610.00$ 1.31 1,310.00$
Earthwork $3.20 per CY 3,555.00 11,376.00$ 2,895.00 9,264.00$
Erosion Control/SWPPP $5,000 per AC 1.61 8,050.00$ 1.31 6,550.00$
Pavement AC $.45 per SF/IN 29,500.00 66,375.00$ 25,500.00 57,375.00$
Pavement Class II AB $.12 per SF/IN 29,500.00 70,800.00$ 25,500.00 61,200.00$
Geofabric $.20 per SF 32,000.00 6,400.00$ 27,000.00 5,400.00$
Pavement/Concrete Removal $1.50 per SF - -$ 13,000.00 19,500.00$
Curb and Gutter $20.00 per LF 1,000.00 20,000.00$ 1,000.00 20,000.00$
Median Curb $15.00 per LF 1,000.00 15,000.00$ 1,000.00 15,000.00$
Sidewalk $16.25 per LF 1,000.00 16,250.00$ 1,000.00 16,250.00$
Handicap Ramp $1,000 EA 4.00 4,000.00$ 4.00 4,000.00$
Storm Drain Line (24" avg) $60.00 per LF 662.00 39,720.00$ 662.00 39,720.00$
Storm Drain Inlet - Type A $2,500 EA 4.00 10,000.00$ 4.00 10,000.00$
Signing $9,000 per Mile 0.10 900.00$ 0.10 900.00$
Striping $10,560 per Mile 0.20 2,112.00$ 0.20 2,112.00$
Standard Street Light (LED) $2,500 EA 2.00 5,000.00$ 2.00 5,000.00$
Fiber Optic Conduit (2-4") $6.00 per LF 500.00 3,000.00$ 500.00 3,000.00$
Parkway Landscaping and Irrigation $5.00 per SF 24,500.00 122,500.00$ 24,500.00 122,500.00$
Median Landscaping and Irrigation $5.00 per SF 7,500.00 37,500.00$ 7,500.00 37,500.00$
Irrigation Electrical Box $10,000 EA 1.00 10,000.00$ 1.00 10,000.00$
TOTAL COST 450,593.00$ 446,581.00$
LINEAR FOOT PRICE 901$ 893$
ROADWAY CONSTRUCTION COSTS
ARTERIAL STREET STANDARD ST-1 140' RIGHT-OF-WAY - 500 LINEAR FEET
CITY CAPITAL IMPROVEMENT PROGRAM CONSTRUCTED
New Road Widen Road
‐ 24 ‐

TABLE 17F
Item Unit Cost
Quantity Cost Quantity Cost
Clearing and Grubbing $1,000 per AC 1.88 1,880.00$ 1.58 1,580.00$
Earthwork $3.20 per CY 4,556.00 14,579.20$ 3,833.00 12,265.60$
Erosion Control/SWPPP $5,000 per AC 1.88 9,400.00$ 1.58 7,900.00$
Pavement AC $.45 per SF/IN 41,500.00 93,375.00$ 29,500.00 66,375.00$
Pavement Class II AB $.12 per SF/IN 41,500.00 99,600.00$ 29,500.00 70,800.00$
Geofabric $.20 per SF 44,000.00 8,800.00$ 31,000.00 6,200.00$
Pavement/Concrete Removal $1.50 per SF - -$ 13,000.00 19,500.00$
Curb and Gutter $20.00 per LF 1,000.00 20,000.00$ 1,000.00 20,000.00$
Median Curb $15.00 per LF 1,000.00 15,000.00$ 1,000.00 15,000.00$
Sidewalk $16.25 per LF 1,000.00 16,250.00$ 1,000.00 16,250.00$
Handicap Ramp $1,000 EA 4.00 4,000.00$ 4.00 4,000.00$
Storm Drain Line (24" avg) $60.00 per LF 710.00 42,600.00$ 710.00 42,600.00$
Storm Drain Inlet - Type A $2,500 EA 4.00 10,000.00$ 4.00 10,000.00$
Signing $9,000 per Mile 0.10 900.00$ 0.10 900.00$
Striping $10,560 per Mile 0.20 2,112.00$ 0.20 2,112.00$
Standard Street Light (LED) $2,500 EA 2.00 5,000.00$ 2.00 5,000.00$
Fiber Optic Conduit (2-4") $6.00 per LF 500.00 3,000.00$ 500.00 3,000.00$
Parkway Landscaping and Irrigation $5.00 per SF 24,500.00 122,500.00$ 24,500.00 122,500.00$
Median Landscaping and Irrigation $5.00 per SF 7,500.00 37,500.00$ 7,500.00 37,500.00$
Irrigation Electrical Box $10,000 EA 1.00 10,000.00$ 1.00 10,000.00$
TOTAL COST 516,496.20$ 473,482.60$
LINEAR FOOT PRICE 1,033$ 947$
DEVELOPMENT RESPONSIBILITY 370$ 370$
LINEAR FOOT REIMBURSEMENT PRICE 663$ 577$
ROADWAY CONSTRUCTION COSTS
ARTERIAL STREET 164' RIGHT-OF-WAY - 500 LINEAR FEET
New Road Widen Road
‐ 25 ‐

TABLE 17G
Item Unit Cost
Quantity Cost Quantity Cost
Clearing and Grubbing $1,000 per AC 1.88 1,880.00$ 1.58 1,580.00$
Earthwork $3.20 per CY 4,556.00 14,579.20$ 3,833.00 12,265.60$
Erosion Control/SWPPP $5,000 per AC 1.88 9,400.00$ 1.58 7,900.00$
Pavement AC $.45 per SF/IN 41,500.00 93,375.00$ 29,500.00 66,375.00$
Pavement Class II AB $.12 per SF/IN 41,500.00 99,600.00$ 29,500.00 70,800.00$
Geofabric $.20 per SF 44,000.00 8,800.00$ 31,000.00 6,200.00$
Pavement/Concrete Removal $1.50 per SF - -$ 13,000.00 19,500.00$
Curb and Gutter $20.00 per LF 1,000.00 20,000.00$ 1,000.00 20,000.00$
Median Curb $15.00 per LF 1,000.00 15,000.00$ 1,000.00 15,000.00$
Sidewalk $16.25 per LF 1,000.00 16,250.00$ 1,000.00 16,250.00$
Handicap Ramp $1,000 EA 4.00 4,000.00$ 4.00 4,000.00$
Storm Drain Line (24" avg) $60.00 per LF 710.00 42,600.00$ 710.00 42,600.00$
Storm Drain Inlet - Type A $2,500 EA 4.00 10,000.00$ 4.00 10,000.00$
Signing $9,000 per Mile 0.10 900.00$ 0.10 900.00$
Striping $10,560 per Mile 0.20 2,112.00$ 0.20 2,112.00$
Standard Street Light (LED) $2,500 EA 2.00 5,000.00$ 2.00 5,000.00$
Fiber Optic Conduit (2-4") $6.00 per LF 500.00 3,000.00$ 500.00 3,000.00$
Parkway Landscaping and Irrigation $5.00 per SF 24,500.00 122,500.00$ 24,500.00 122,500.00$
Median Landscaping and Irrigation $5.00 per SF 7,500.00 37,500.00$ 7,500.00 37,500.00$
Irrigation Electrical Box $10,000 EA 1.00 10,000.00$ 1.00 10,000.00$
TOTAL COST 516,496.20$ 473,482.60$
LINEAR FOOT PRICE 1,033$ 947$
ROADWAY CONSTRUCTION COSTS
ARTERIAL STREET 164' RIGHT-OF-WAY - 500 LINEAR FEET
CITY CAPITAL IMPROVEMENT PROGRAM CONSTRUCTED
New Road Widen Road
‐ 26 ‐

27
WASTEWATER FACILITIES
Wastewater and non-potable water facilities that are necessary to serve new development through build-out of the City are identified in the Wastewater Collection System Master Plan Update (2010) and the Recycled Water Feasibility Study (2013), including facilities that are necessary to meet the California State Water Resources Control Board regulatory requirements. Facility costs (Table 19) and timing are outlined in the City’s Capital Improvement Program. Table 18 allocates the cost of the facilities by demand (daily wastewater generation) volume of the various land uses. TABLE 18
WASTEWATER COST SHARE
Land Use
Remaining Dwelling
Units/Bldg SF* Wastewater Generation**
% of Wastewater Generation Cost Share
Cost per DU/Bldg SF
Residential
Single Family 6,378 1,562,610 43% $ 35,433,512 $ 5,555.58
Multi-Family 5,687 1,000,912 27% $ 22,696,531 $ 3,990.95
Active Adult 653 130,600 4% $ 2,961,466 $ 4,535.17
Non-Residential
Commercial 6,241,688 511,543 14% $ 11,599,680 $ 1.86
Office 3,397,148 278,416 8% $ 6,313,328 $ 1.86
Industrial 3,137,987 178,595 5% $ 4,049,791 $ 1.29
Total Wastewater Generation 3,662,677 100% $ 83,054,310
* 2014 General Plan
**Engineering Procedures Manual
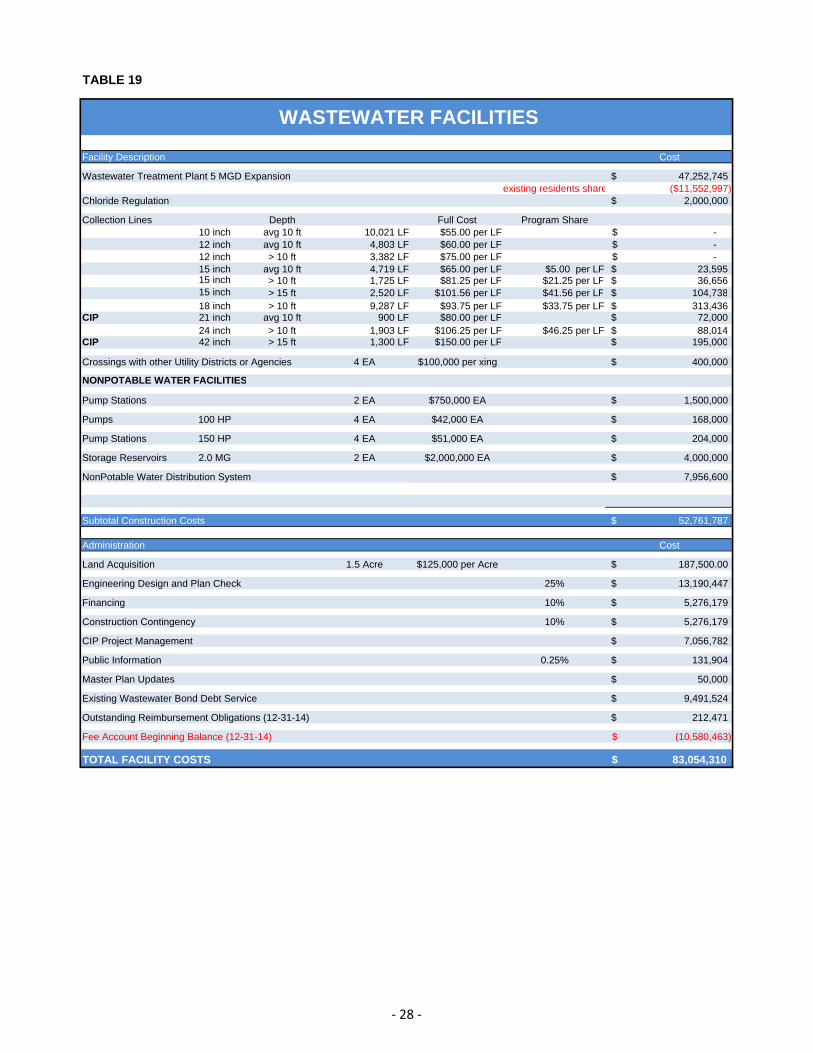
TABLE 19
Facility Description Cost
Wastewater Treatment Plant 5 MGD Expansion 47,252,745$ existing residents share ($11,552,997)
Chloride Regulation 2,000,000$
Collection Lines Depth Full Cost Program Share10 inch avg 10 ft 10,021 LF $55.00 per LF -$ 12 inch avg 10 ft 4,803 LF $60.00 per LF -$ 12 inch > 10 ft 3,382 LF $75.00 per LF -$ 15 inch avg 10 ft 4,719 LF $65.00 per LF $5.00 per LF 23,595$ 15 inch > 10 ft 1,725 LF $81.25 per LF $21.25 per LF 36,656$ 15 inch > 15 ft 2,520 LF $101.56 per LF $41.56 per LF 104,738$ 18 inch > 10 ft 9,287 LF $93.75 per LF $33.75 per LF 313,436$
CIP 21 inch avg 10 ft 900 LF $80.00 per LF 72,000$ 24 inch > 10 ft 1,903 LF $106.25 per LF $46.25 per LF 88,014$
CIP 42 inch > 15 ft 1,300 LF $150.00 per LF 195,000$
Crossings with other Utility Districts or Agencies 4 EA $100,000 per xing 400,000$
NONPOTABLE WATER FACILITIES
Pump Stations 2 EA $750,000 EA 1,500,000$
Pumps 100 HP 4 EA $42,000 EA 168,000$
Pump Stations 150 HP 4 EA $51,000 EA 204,000$
Storage Reservoirs 2.0 MG 2 EA $2,000,000 EA 4,000,000$
NonPotable Water Distribution System 7,956,600$
Subtotal Construction Costs 52,761,787$
Administration Cost
Land Acquisition 1.5 Acre $125,000 per Acre 187,500.00$
Engineering Design and Plan Check 25% 13,190,447$
Financing 10% 5,276,179$
Construction Contingency 10% 5,276,179$
CIP Project Management 7,056,782$
Public Information 0.25% 131,904$
Master Plan Updates 50,000$
Existing Wastewater Bond Debt Service 9,491,524$
Outstanding Reimbursement Obligations (12-31-14) 212,471$
Fee Account Beginning Balance (12-31-14) (10,580,463)$
TOTAL FACILITY COSTS 83,054,310$
WASTEWATER FACILITIES
‐ 28 ‐
29
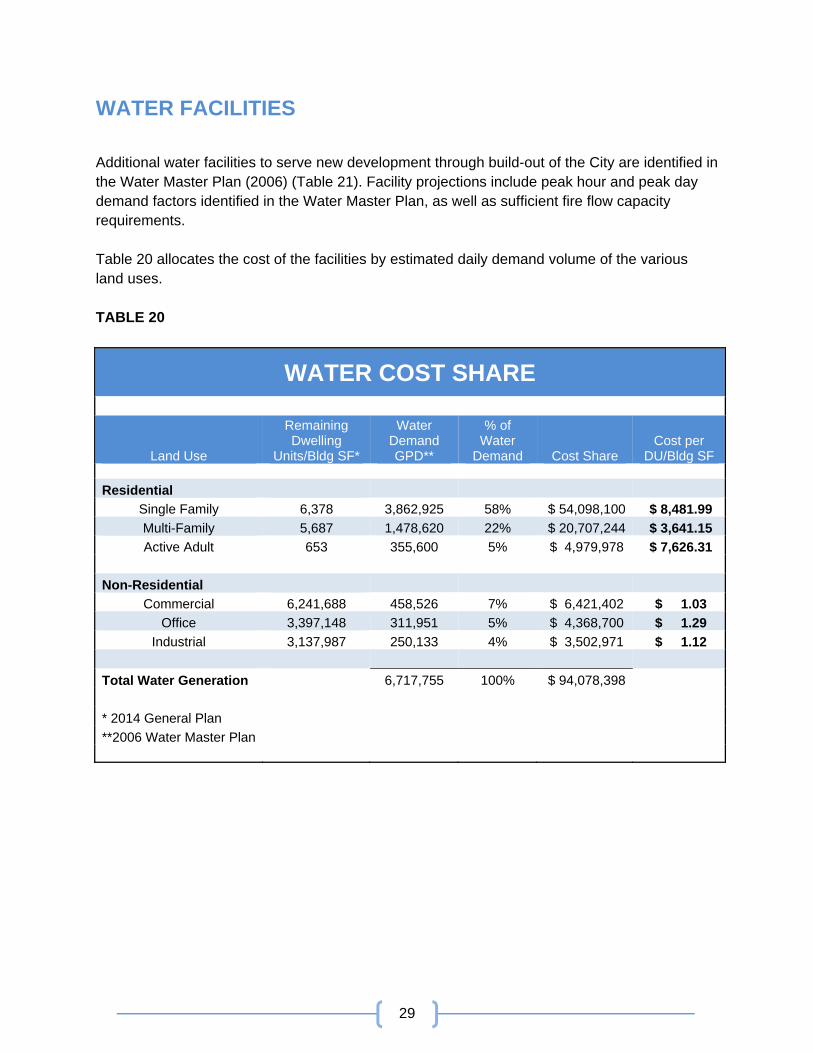
WATER FACILITIES
Additional water facilities to serve new development through build-out of the City are identified in the Water Master Plan (2006) (Table 21). Facility projections include peak hour and peak day demand factors identified in the Water Master Plan, as well as sufficient fire flow capacity requirements. Table 20 allocates the cost of the facilities by estimated daily demand volume of the various land uses. TABLE 20
WATER COST SHARE
Land Use
Remaining Dwelling
Units/Bldg SF*
Water Demand GPD**
% of Water
Demand Cost Share Cost per
DU/Bldg SF
Residential
Single Family 6,378 3,862,925 58% $ 54,098,100 $ 8,481.99
Multi-Family 5,687 1,478,620 22% $ 20,707,244 $ 3,641.15
Active Adult 653 355,600 5% $ 4,979,978 $ 7,626.31
Non-Residential
Commercial 6,241,688 458,526 7% $ 6,421,402 $ 1.03
Office 3,397,148 311,951 5% $ 4,368,700 $ 1.29
Industrial 3,137,987 250,133 4% $ 3,502,971 $ 1.12
Total Water Generation 6,717,755 100% $ 94,078,398
* 2014 General Plan
**2006 Water Master Plan
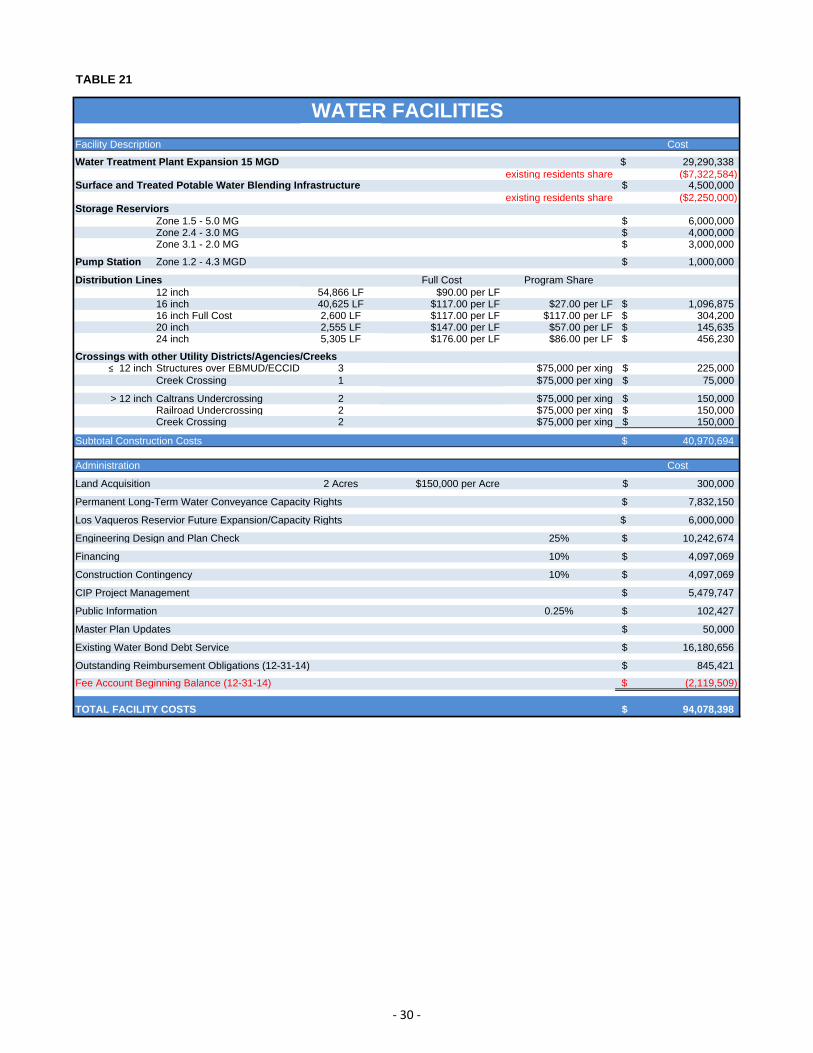
TABLE 21
Facility Description Cost
Water Treatment Plant Expansion 15 MGD 29,290,338$ existing residents share ($7,322,584)
Surface and Treated Potable Water Blending Infrastructure 4,500,000$ existing residents share ($2,250,000)
Storage ReserviorsZone 1.5 - 5.0 MG 6,000,000$ Zone 2.4 - 3.0 MG 4,000,000$ Zone 3.1 - 2.0 MG 3,000,000$
Pump Station Zone 1.2 - 4.3 MGD 1,000,000$
Distribution Lines Full Cost Program Share12 inch 54,866 LF $90.00 per LF16 inch 40,625 LF $117.00 per LF $27.00 per LF 1,096,875$ 16 inch Full Cost 2,600 LF $117.00 per LF $117.00 per LF 304,200$ 20 inch 2,555 LF $147.00 per LF $57.00 per LF 145,635$ 24 inch 5,305 LF $176.00 per LF $86.00 per LF 456,230$
Crossings with other Utility Districts/Agencies/Creeks≤ 12 inch Structures over EBMUD/ECCID 3 $75,000 per xing 225,000$
Creek Crossing 1 $75,000 per xing 75,000$
> 12 inch Caltrans Undercrossing 2 $75,000 per xing 150,000$ Railroad Undercrossing 2 $75,000 per xing 150,000$ Creek Crossing 2 $75,000 per xing 150,000$
Subtotal Construction Costs 40,970,694$
Administration Cost
Land Acquisition 2 Acres $150,000 per Acre 300,000$
Permanent Long-Term Water Conveyance Capacity Rights 7,832,150$
Los Vaqueros Reservior Future Expansion/Capacity Rights 6,000,000$
Engineering Design and Plan Check 25% 10,242,674$
Financing 10% 4,097,069$
Construction Contingency 10% 4,097,069$
CIP Project Management 5,479,747$
Public Information 0.25% 102,427$
Master Plan Updates 50,000$
Existing Water Bond Debt Service 16,180,656$
Outstanding Reimbursement Obligations (12-31-14) 845,421$
Fee Account Beginning Balance (12-31-14) (2,119,509)$
TOTAL FACILITY COSTS 94,078,398$
WATER FACILITIES
‐ 30 ‐

31
REIMBURSEMENT PROCEDURE
Reimbursement, in the form of credits applied to facility fees, shall be provided to new development that is conditioned to construct a public facility which exceeds the need for the facility that is attributable to and related to the development. Credits provided will be at an equivalent value to the cost of the facility, or portion of, as identified in the Program and are specific to the fee category for which the additional improvements have been constructed (i,e, roadway credits cannot be applied to water fees). New Development construction and financial responsibility, for which reimbursement will not be provided, includes the portion of facilities and infrastructure necessary to serve their development and is specifically referenced as the following:
Roadway Frontage: Residential Collector Street (Standard ST-4) 60’ width Wastewater: 12” or smaller collection line Water: 12” or smaller distribution line Parks: ½ Acre or smaller and/or less than 100’ in width
In the event frontage improvements that are a development’s responsibility have been previously constructed, either through the City’s Capital Improvement Program or earlier development, the new development’s responsibility shall be contributed as payment at a value as identified in this Program, or actual costs incurred, whichever is greater.
32
AREAS OF ADDITIONAL FEES
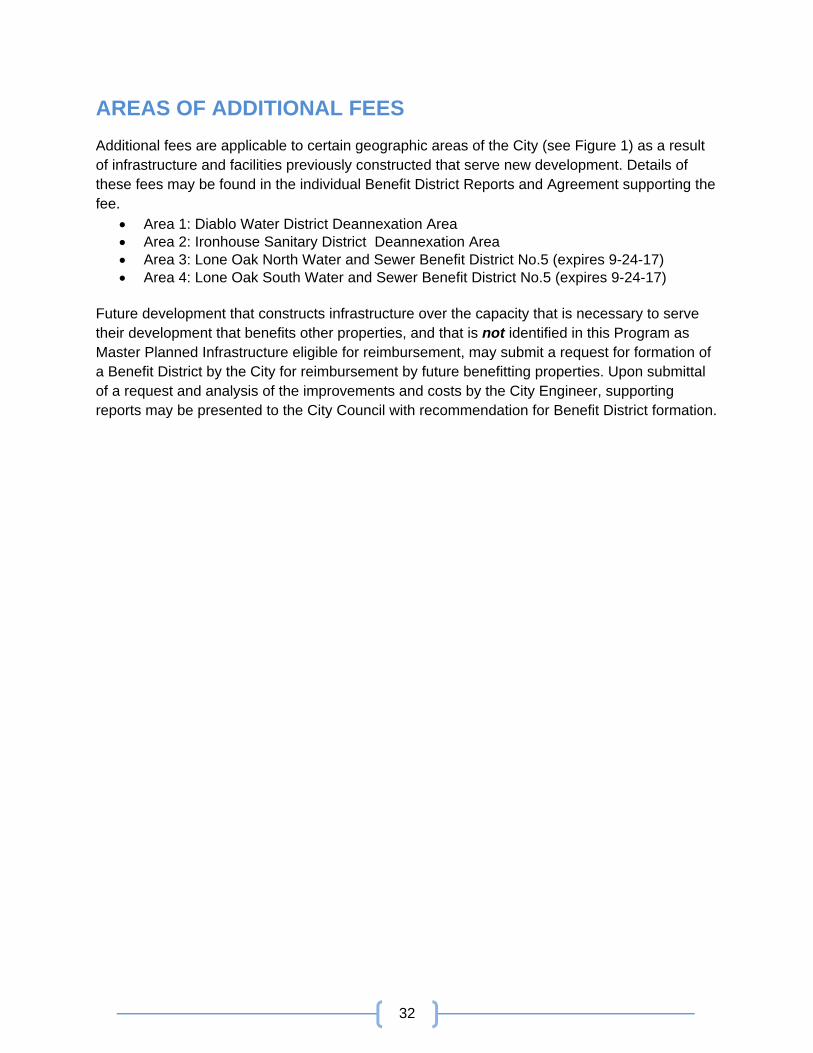
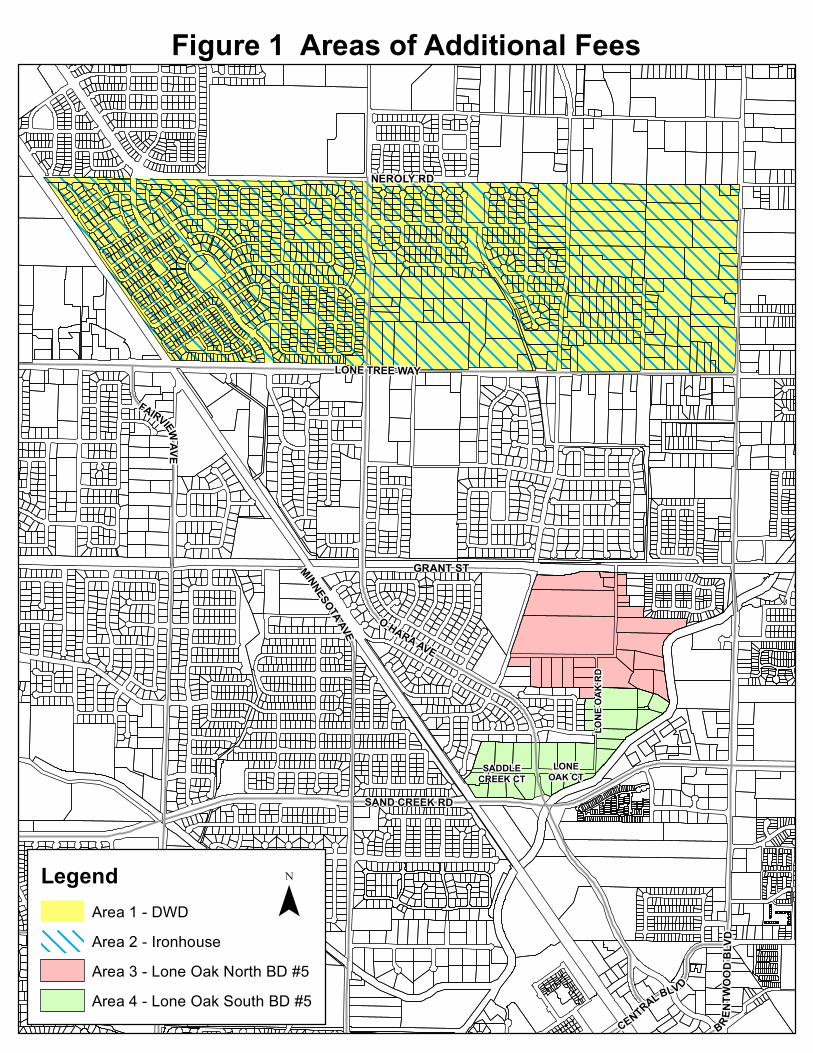
Additional fees are applicable to certain geographic areas of the City (see Figure 1) as a result of infrastructure and facilities previously constructed that serve new development. Details of these fees may be found in the individual Benefit District Reports and Agreement supporting the fee.
Area 1: Diablo Water District Deannexation Area Area 2: Ironhouse Sanitary District Deannexation Area Area 3: Lone Oak North Water and Sewer Benefit District No.5 (expires 9-24-17) Area 4: Lone Oak South Water and Sewer Benefit District No.5 (expires 9-24-17)
Future development that constructs infrastructure over the capacity that is necessary to serve their development that benefits other properties, and that is not identified in this Program as Master Planned Infrastructure eligible for reimbursement, may submit a request for formation of a Benefit District by the City for reimbursement by future benefitting properties. Upon submittal of a request and analysis of the improvements and costs by the City Engineer, supporting reports may be presented to the City Council with recommendation for Benefit District formation.
NEROLY RD
GRANT ST
LONE
OAK
RD
LONEOAK CT
SADDLECREEK CT
LONE TREE WAY
SAND CREEK RD
SAN JOSE AVE
MINNESOTAAVE
CENTRALBLVD
BRENTW
OOD
B LV D
FAIRVIEWAVE
O HARA AVE
LegendArea 1 - DWDArea 2 - IronhouseArea 3 - Lone Oak North BD #5Area 4 - Lone Oak South BD #5
¯
Figure 1 Areas of Additional Fees


![Global Impact Modeling...Global impact modeling of AIM and surrounding research projects Development of AIM/Adaptation[Policy] Integrated research on climate change scenarios to increase](https://static.fdocument.pub/doc/165x107/60e34df57b2bb47e5e233398/global-impact-modeling-global-impact-modeling-of-aim-and-surrounding-research.jpg)