
RFI Impact at candidate remote station sites - AUS 1€¦ · · 2013-08-20MsWord Word 2007 RFI...
36
Name Designation Affiliation Date Signature Submitted by: R P Millenaar Chief Site Engineer SPDO 16/11/11 Accepted by: R T Schilizzi Director SPDO 16/11/11 Approved by: R T Schilizzi Director SPDO 16/11/11 RFI IMPACT AT CANDIDATE SKA REMOTE STATION SITES AUSTRALIA EDITION Document number ................................................................. WP3‐050.020.010‐TR‐005 Revision ....................................................................................................................... A2 Author ........................................................................................................ R.P. Millenaar Date ............................................................................................................... 16‐11‐2011 Status .................................................................................................... Final Confidential
-
Upload
trannguyet -
Category
Documents
-
view
214 -
download
1
Transcript of RFI Impact at candidate remote station sites - AUS 1€¦ · · 2013-08-20MsWord Word 2007 RFI...
Name Designation Affiliation Date Signature
Submittedby:
RPMillenaar ChiefSiteEngineer
SPDO 16/11/11
Acceptedby:
RTSchilizzi Director SPDO 16/11/11
Approvedby:
RTSchilizzi Director SPDO 16/11/11
RFIIMPACTATCANDIDATESKAREMOTESTATIONSITESAUSTRALIAEDITION
Documentnumber ................................................................. WP3‐050.020.010‐TR‐005Revision ....................................................................................................................... A2Author........................................................................................................ R.P.MillenaarDate ............................................................................................................... 16‐11‐2011Status ....................................................................................................FinalConfidential

WP3‐050.020.010‐TR‐005 Revision:A2
Page2of36
DOCUMENTHISTORY
Revision DateOfIssue EngineeringChange
Number
Comments
‐ 14‐11‐2011 ‐ Firstdraft
A 16‐11‐2011 ‐ Final
A1 23‐11‐2011 ‐ InformationforSouthernAfricaonly,nofurherchanges
A2 23‐11‐2011 ‐ InformationforAustraliaonly,nofurherchanges
DOCUMENTSOFTWARE Package Version Filename
Wordprocessor MsWord Word2007 RFIImpactatcandidateremotestationsites‐AUS1.0.docx
Blockdiagrams
Other
ORGANISATIONDETAILSName SKAProgramDevelopmentOffice
Physical/PostalAddress
JodrellBankCentreforAstrophysics
AlanTuringBuilding
TheUniversityofManchester
OxfordRoad
Manchester,UK
M139PLFax. +44(0)1612754049
Website www.skatelescope.org

WP3‐050.020.010‐TR‐005 Revision:A2
Page3of36
TABLEOFCONTENTS
1 INTRODUCTION............................................................................................. 6
2 SCOPE ........................................................................................................ 6
3 METHOD .................................................................................................... 6
4 REMOTESTATIONCONFIGURATION ................................................................... 74.1 Site‐specificconfigurationAustralasia ..................................................................................... 7
5 INFORMATIONSUPPLIED ................................................................................. 95.1 Australasia................................................................................................................................ 9
6 RESULTS ................................................................................................... 106.1 Australasia.............................................................................................................................. 11
7 REFERENCES............................................................................................... 36
FIGURESFigure 1: Locations of 25 remote stations (red) in the Australian configuration. The inner 180km
spirals inblue.Thewhitegrid is5degreesonaside,correspondingtoa fixedN‐S lengthof560km and an E‐W dimension (which varies with latitude) of 510km along the Tropic ofCapricorn(Yellowline). ............................................................................................................... 8
Figure2:AUSTRALIA,Site1 ................................................................................................................. 11Figure3:AUSTRALIA,Site2 ................................................................................................................. 12Figure4:AUSTRALIA,Site3 ................................................................................................................. 13Figure5:AUSTRALIA,Site4 ................................................................................................................. 14Figure6:AUSTRALIA,Site5 ................................................................................................................. 15Figure7:AUSTRALIA,Site6 ................................................................................................................. 16Figure8:AUSTRALIA,Site7 ................................................................................................................. 17Figure9:AUSTRALIA,Site8 ................................................................................................................. 18Figure10:AUSTRALIA,Site9 ............................................................................................................... 19Figure11:AUSTRALIA,Site10 ............................................................................................................. 20Figure12:AUSTRALIA,Site11 ............................................................................................................. 21Figure13:AUSTRALIA,Site12 ............................................................................................................. 22Figure14:AUSTRALIA,Site13 ............................................................................................................. 23Figure15:AUSTRALIA,Site14 ............................................................................................................. 24Figure16:AUSTRALIA,Site15 ............................................................................................................. 25Figure17:AUSTRALIA,Site16 ............................................................................................................. 26Figure18:AUSTRALIA,Site17 ............................................................................................................. 27Figure19:AUSTRALIA,Site18 ............................................................................................................. 28Figure20:AUSTRALIA,Site19 ............................................................................................................. 29Figure21:AUSTRALIA,Site20 ............................................................................................................. 30Figure22:AUSTRALIA,Site21 ............................................................................................................. 31Figure23:AUSTRALIA,Site22 ............................................................................................................. 32Figure24:AUSTRALIA,Site23 ............................................................................................................. 33
WP3‐050.020.010‐TR‐005 Revision:A2
Page4of36
Figure25:AUSTRALIA,Site24 ............................................................................................................. 34Figure26:AUSTRALIA,Site25 ............................................................................................................. 35
TABLESTable1:ThelocationsoftheAustralasianremotestations .................................................................. 7
WP3‐050.020.010‐TR‐005 Revision:A2
Page5of36
Glossary
EMI ElectroMagneticInterferenceITU InternationalTelecommunicationsUnionFoM FigureofMeritPFD PowerFluxDensity(indBWm‐2Hz‐1)PSD PowerSpectralDensity(indBWHz‐1)RAS RadioAstronomyServiceRFI RadioFrequencyInterferenceRQZ RadioQuietZoneSKA SquareKilometreArraySPDO SKAProgramDevelopmentOffice
WP3‐050.020.010‐TR‐005 Revision:A2
Page6of36
1 Introduction
Atanearlystageinthedevelopmentofsite‐specificconfigurationsfortheSKA,theresultofwhichhasbeendescribed in [1], itwasagreedamongst thetwositeproponentsandSPDOtodevelopaFigureofMerit(FoM)forspectrumcrowdingatremotestationlocations.Ofthesethereare25andallofthemaresituatedoutsidetheRadioQuietZone(RQZ)thatwillbeimplementedatthecentrallocation,and thereforedonotbenefit fromoptimal radio interferenceconditions.The locationofeach remote station is a compromise in radio quietness (away from human presence), andaccessibility intermsofroads, fibrehook‐upandpowerdelivery (closetohumanpresence),whilealsooptimisingforscienceimagingquality.Inaprocessstartingfromgenericspecificationstofinallocations the SPDO has worked with the site proponents to design the course locations of theremote stations. Final adjustments of these locations were done by the proponents on theirconfiguration to find thebestcompromise.Partof thisprocesswasadesktopanalysis,evaluatingtheimpactoflicensedradiotransmittersaroundeachofthetargetstationsbycalculatingthepowerspectraldensity(PSD)ofreceivedsignalsatthatlocationoriginatingfromtransmittersinthatarea.The informationgained in thesecalculations ispresented in this report.Thepurpose is toprovideevaluatorsanddesignengineersanoverviewofexpectedRFIimpactattheremotestations.Thiswork is tobecomplementedbyasurveyof theradio interferenceenvironmentatall remotestationsoncesiteselectionhasbeendone.Already,aspartoftheinvestigationsinthesiteselectionprocess, four of these remote site locations for each candidate host have been visited by a localteamtoperformmeasurements,usingtheequipmentdevelopedbytheSPDOandsiteproponentsfortheRFImeasurementcampaignin2010/11.Theresultsfortheseremotesitesarereportedin[2]and[3],inananonymousfashion.Thisreportconnectsthesemeasurementswiththeresultsofthedesktopanalysisforthesefourcaseseach.
2 Scope
ThisdocumentreportsonthespectrumcrowdingFoMresultsintheformofplotsofreceivedsignallevelsateachofthe25proposedremotestationlocations.Thisreporthastwoeditions:
• Fullreport(thisreportedition,RevisionA)• SpecificreportforSouthAfrica(RevisionA1)• SpecificreportforAustralia(RevisionA2)• Anonymous version (Revision B), where all references to country/countries and specific
locations have been removed. It uses X and Y to distinguish between proponents andsequencenumbersforremotestations.
3 Method
ThefollowingmethodwasdiscussedandagreedamongstSPDOandsiteproponents:Foreachofthe25remotestationlocations,
• collect information on transmitters in databases selected to provide a complete andaccurate overview of transmitter frequencies, EIRP, bandwidth, antenna height andradiationpattern,distance,
• collectinformationoninterveningterrainfromtransmittertoremotestation,• calculatepropagationattenuation,usingtheterrain informationandantennadistanceand
heightintheITU‐RP.526‐11model,• findreceivedPSD levelsat theremotestation,byapplyingthepropagationattenuationto
theemittedlevelinthedirectionofthestation.
WP3‐050.020.010‐TR‐005 Revision:A2
Page7of36
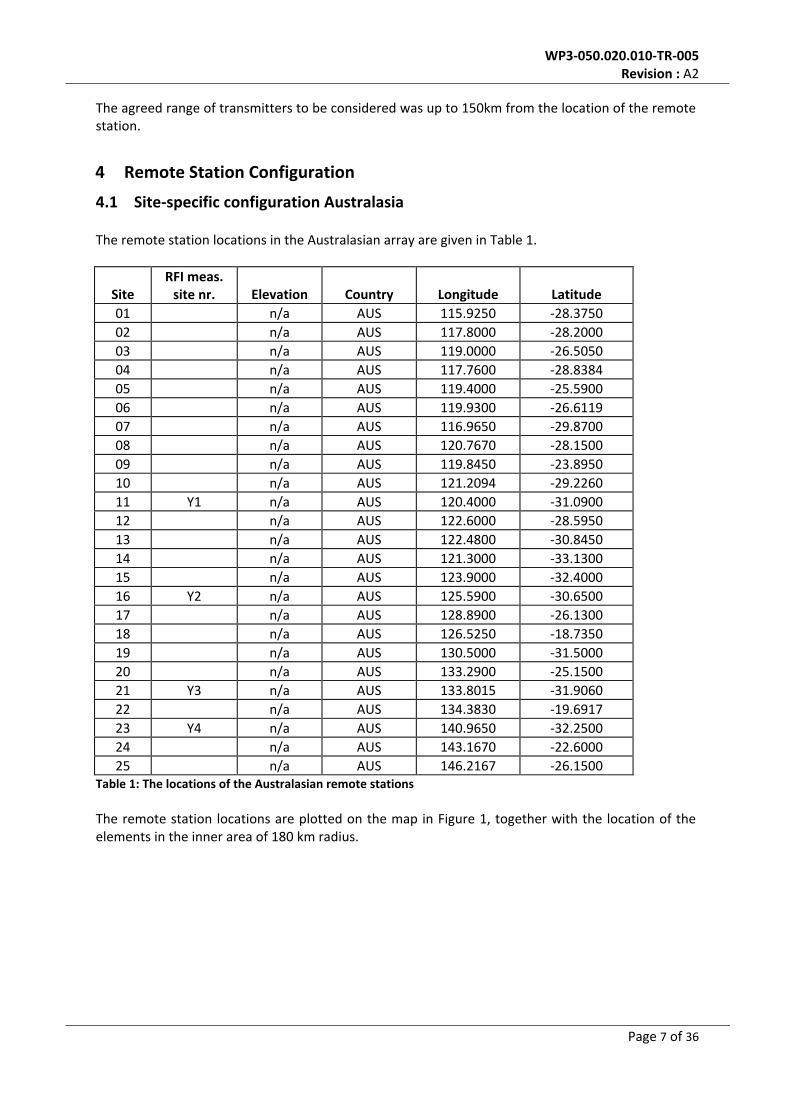
Theagreedrangeoftransmitterstobeconsideredwasupto150kmfromthelocationoftheremotestation.
4 RemoteStationConfiguration
4.1 Site‐specificconfigurationAustralasia
TheremotestationlocationsintheAustralasianarrayaregiveninTable1.
SiteRFImeas.sitenr. Elevation Country Longitude Latitude
01 n/a AUS 115.9250 ‐28.375002 n/a AUS 117.8000 ‐28.200003 n/a AUS 119.0000 ‐26.505004 n/a AUS 117.7600 ‐28.838405 n/a AUS 119.4000 ‐25.590006 n/a AUS 119.9300 ‐26.611907 n/a AUS 116.9650 ‐29.870008 n/a AUS 120.7670 ‐28.150009 n/a AUS 119.8450 ‐23.895010 n/a AUS 121.2094 ‐29.226011 Y1 n/a AUS 120.4000 ‐31.090012 n/a AUS 122.6000 ‐28.595013 n/a AUS 122.4800 ‐30.845014 n/a AUS 121.3000 ‐33.130015 n/a AUS 123.9000 ‐32.400016 Y2 n/a AUS 125.5900 ‐30.650017 n/a AUS 128.8900 ‐26.130018 n/a AUS 126.5250 ‐18.735019 n/a AUS 130.5000 ‐31.500020 n/a AUS 133.2900 ‐25.150021 Y3 n/a AUS 133.8015 ‐31.906022 n/a AUS 134.3830 ‐19.691723 Y4 n/a AUS 140.9650 ‐32.250024 n/a AUS 143.1670 ‐22.600025 n/a AUS 146.2167 ‐26.1500
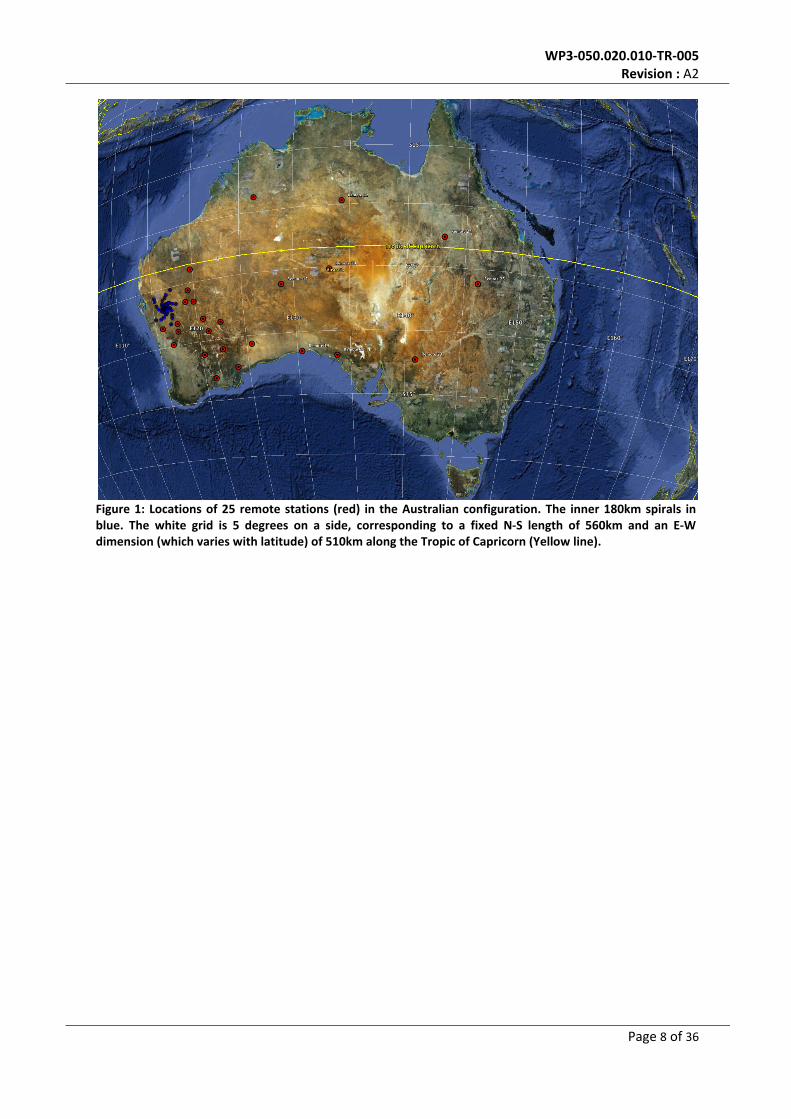
Table1:ThelocationsoftheAustralasianremotestationsTheremotestationlocationsareplottedonthemapinFigure1,togetherwiththelocationoftheelementsintheinnerareaof180kmradius.
WP3‐050.020.010‐TR‐005 Revision:A2
Page8of36
Figure1: Locationsof25 remotestations (red) in theAustralianconfiguration.The inner180kmspirals inblue. The white grid is 5 degrees on a side, corresponding to a fixed N‐S length of 560km and an E‐Wdimension(whichvarieswithlatitude)of510kmalongtheTropicofCapricorn(Yellowline).
WP3‐050.020.010‐TR‐005 Revision:A2
Page9of36
5 Informationsupplied
The site proponents have carried out the collection of transmitter details and have done thecalculations for received PSD levels. The information was supplied to the SPDO in either of twoforms,describedinthefollowingsections.
5.1 Australasia
A document [5] was supplied, which describes the work done, the information used and theresultingplotsofreceivedPSDlevels.Thefollowingdetailshavebeenprovidedin[5]:“TransmitterdatabaseThe source for the transmitter information is the Register of Radio communications Licensesmaintained by theAustralian Communications andMedia Authority (ACMA), and issuedmonthly.ThisanalysisusestheFebruary2011data.Itmustbenotedthat:a)Thepowerlevelinthedatabaseisthemaximumallowedbytheservice,notnecessarilytheactualpowertransmitted.b) Some of the licensed services may not be in operation any longer; others may only transmitintermittently.c) Fordirectional transmitters, anantennagain,3dBbeamwidth, front‐to‐back ratioandazimuthdirectionareprovided,sothesidelobelevelinthedirectionoftheproposedsiteisestimatedfromthesevalues.Forthesereasons,thelevelsintheplotsarebasedonaworst‐casetransmittedpowerlevelandmayoverestimatethespectralcrowdingatthesite.”
WP3‐050.020.010‐TR‐005 Revision:A2
Page10of36
6 Results
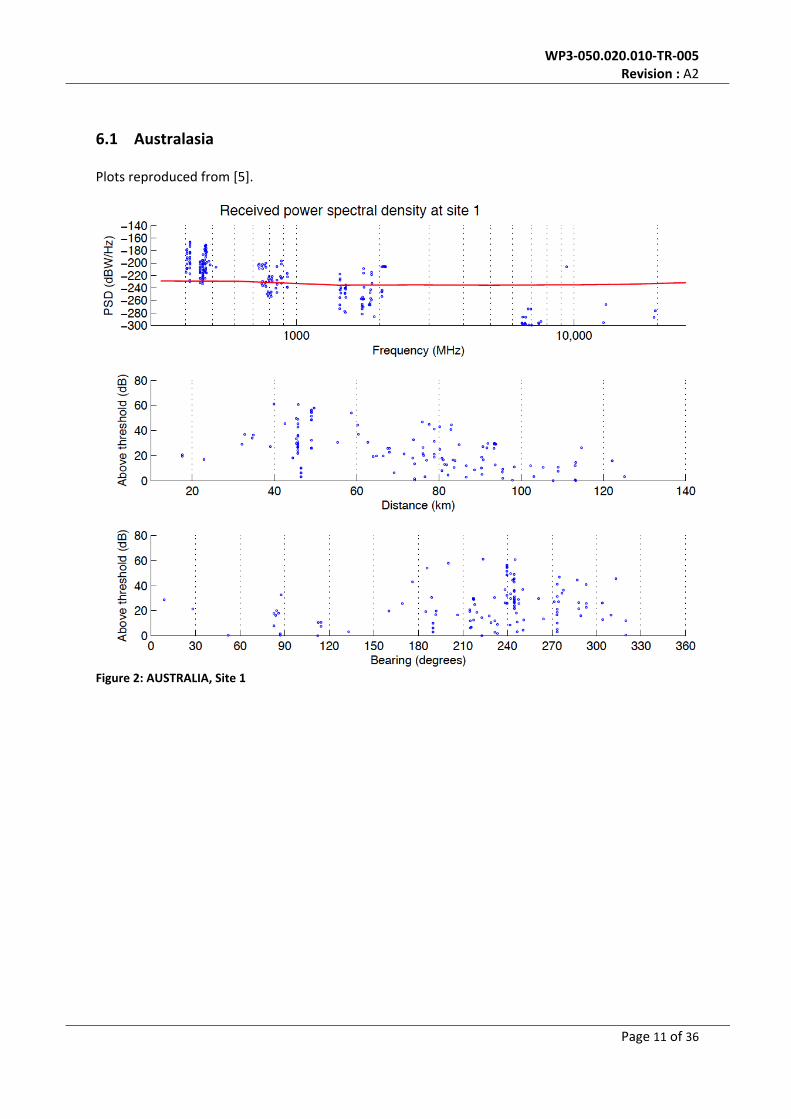
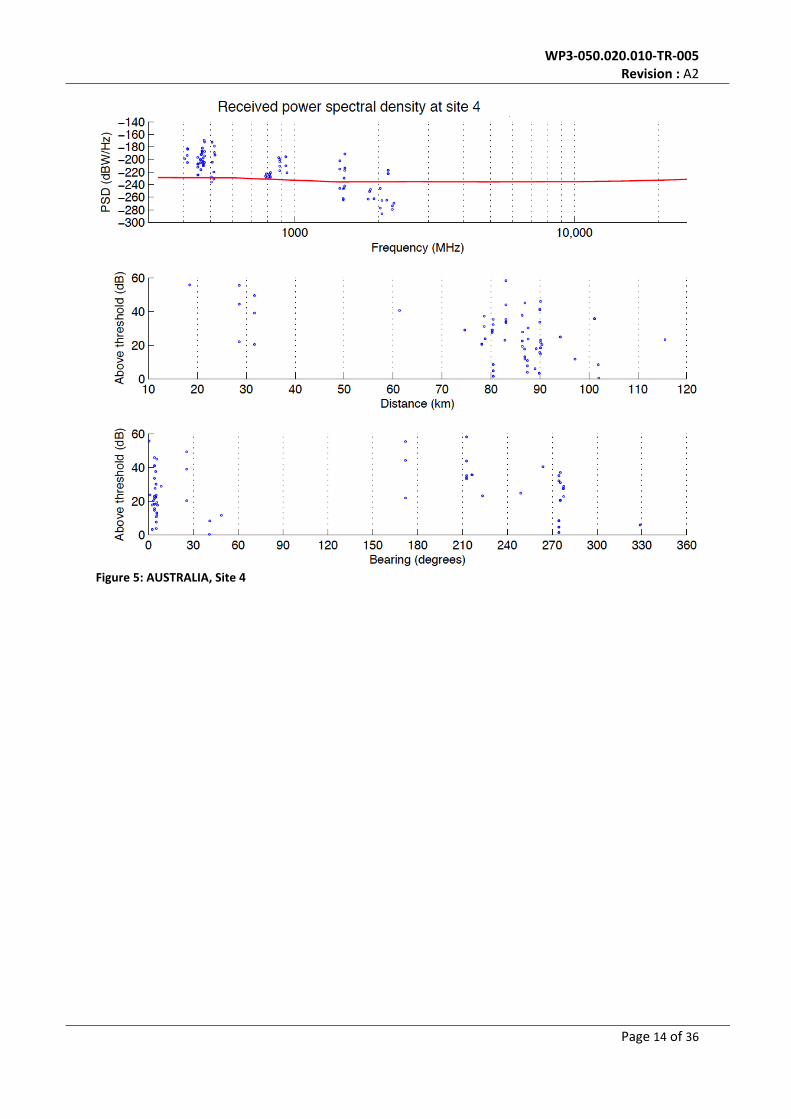
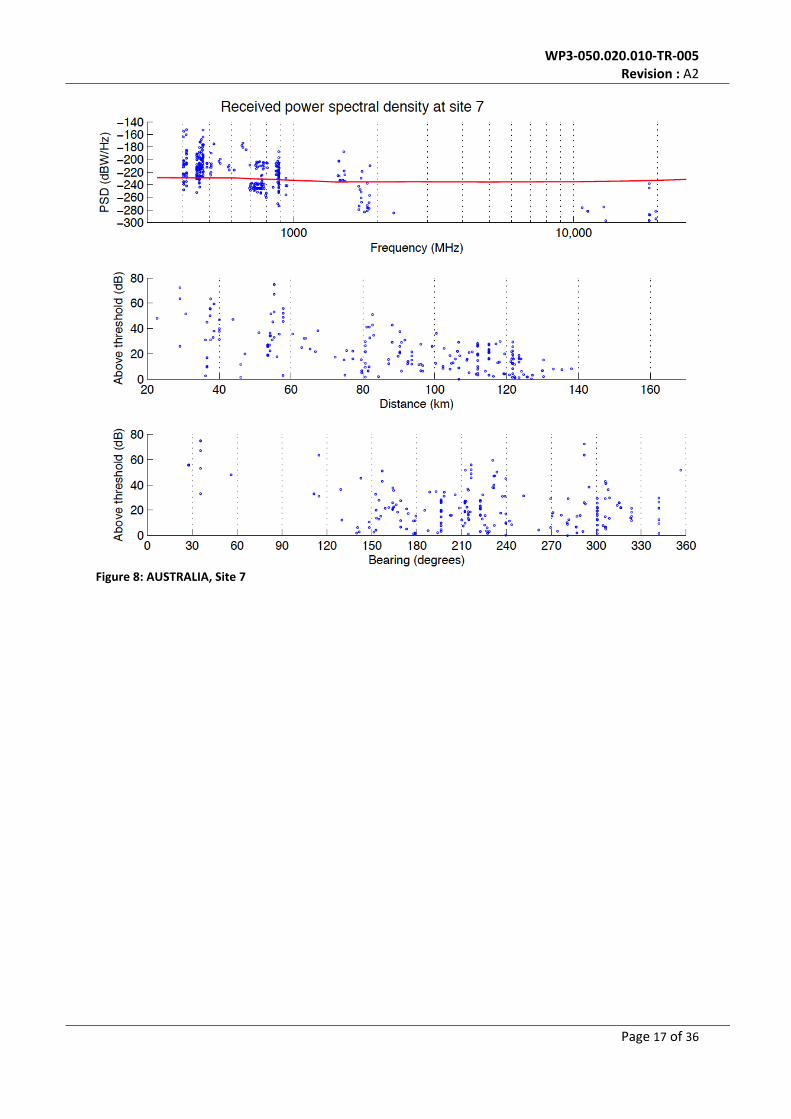
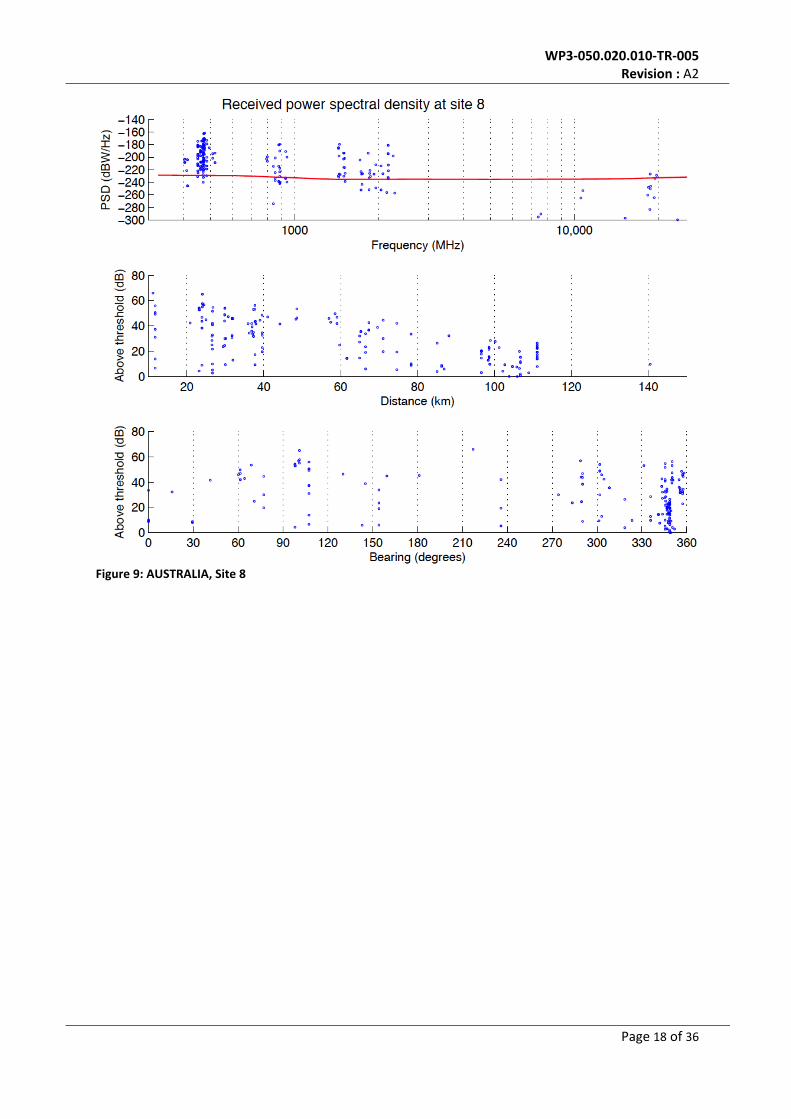
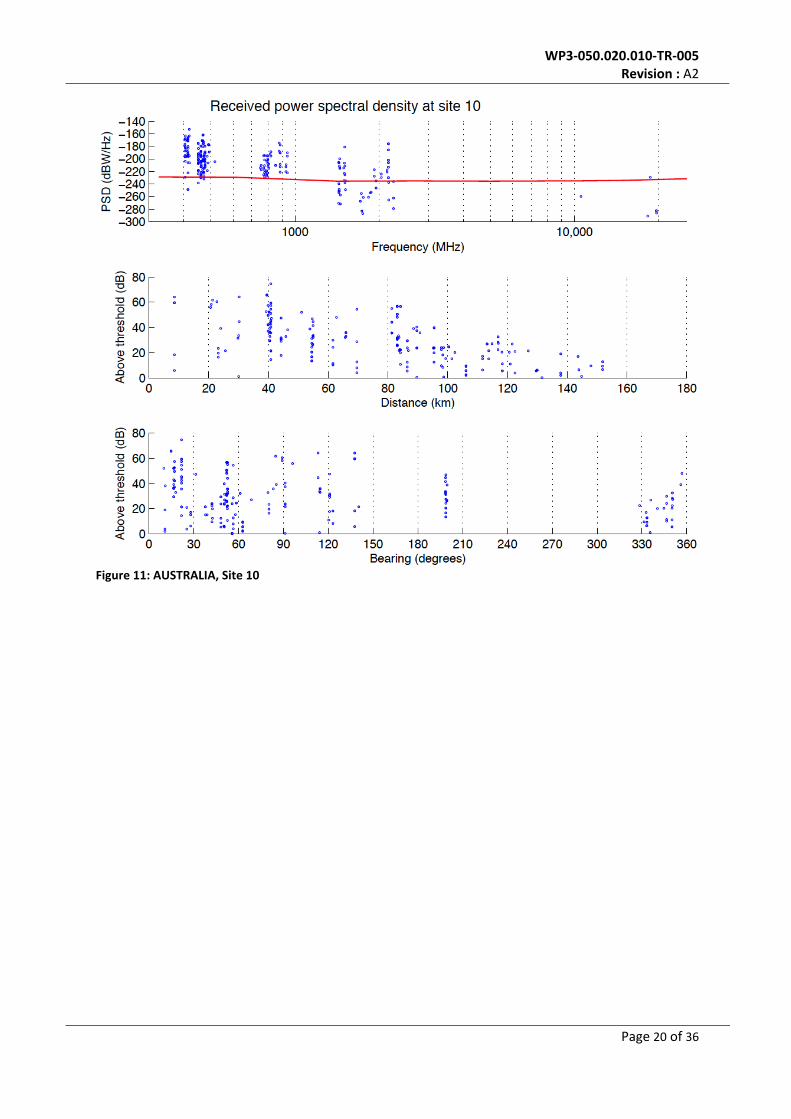
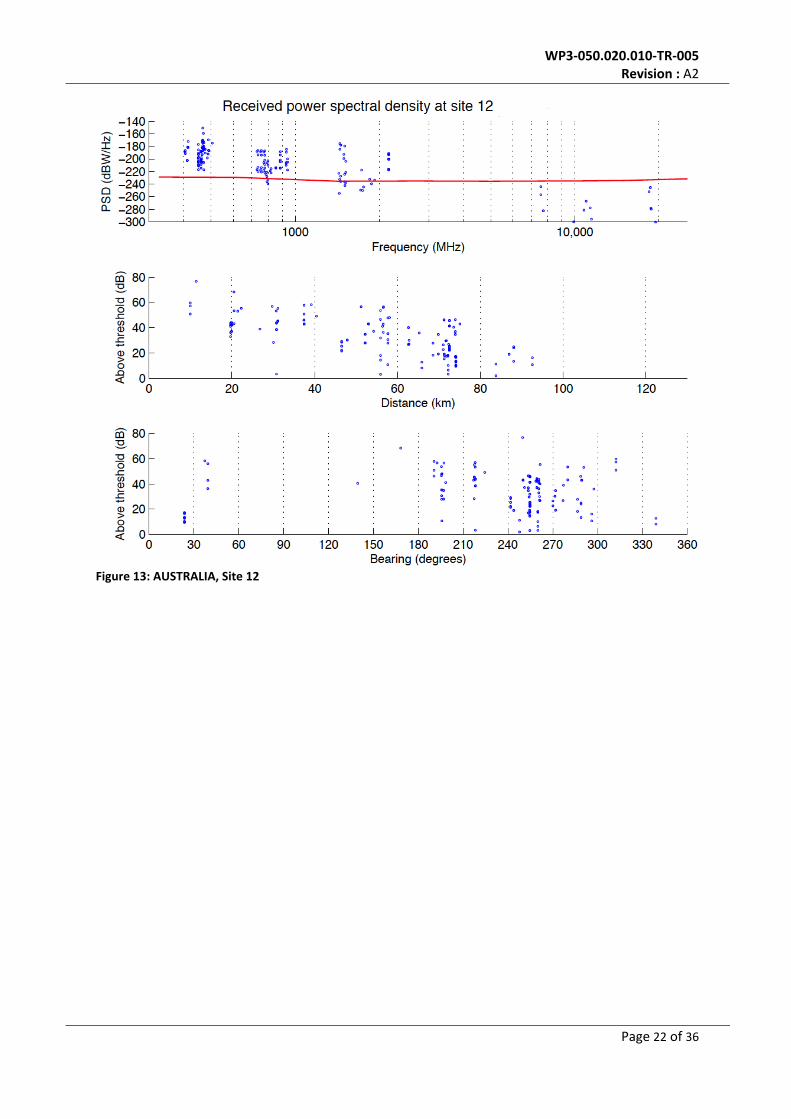
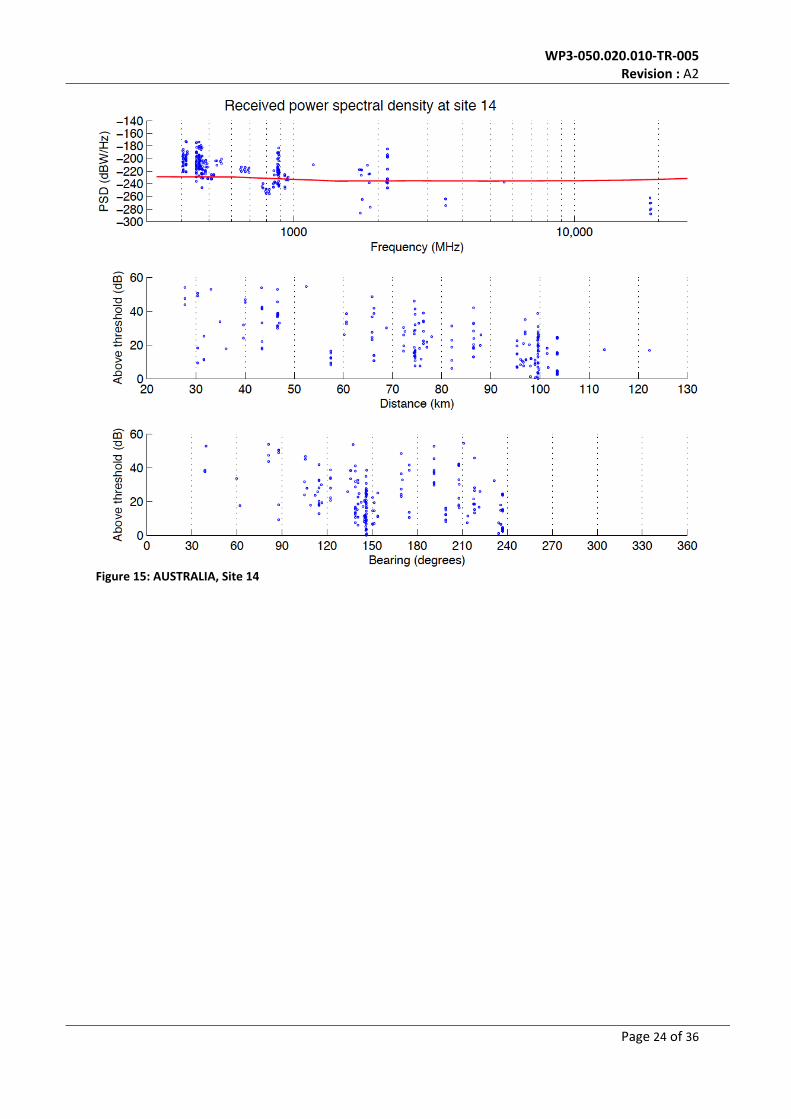
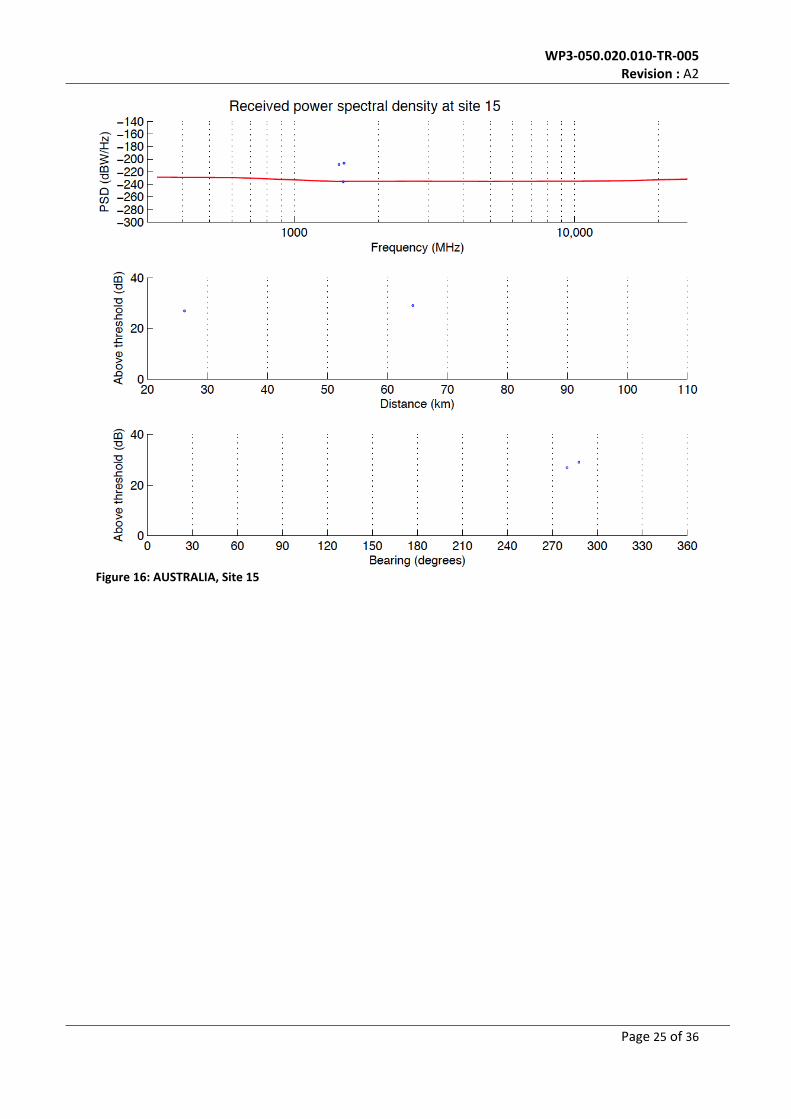
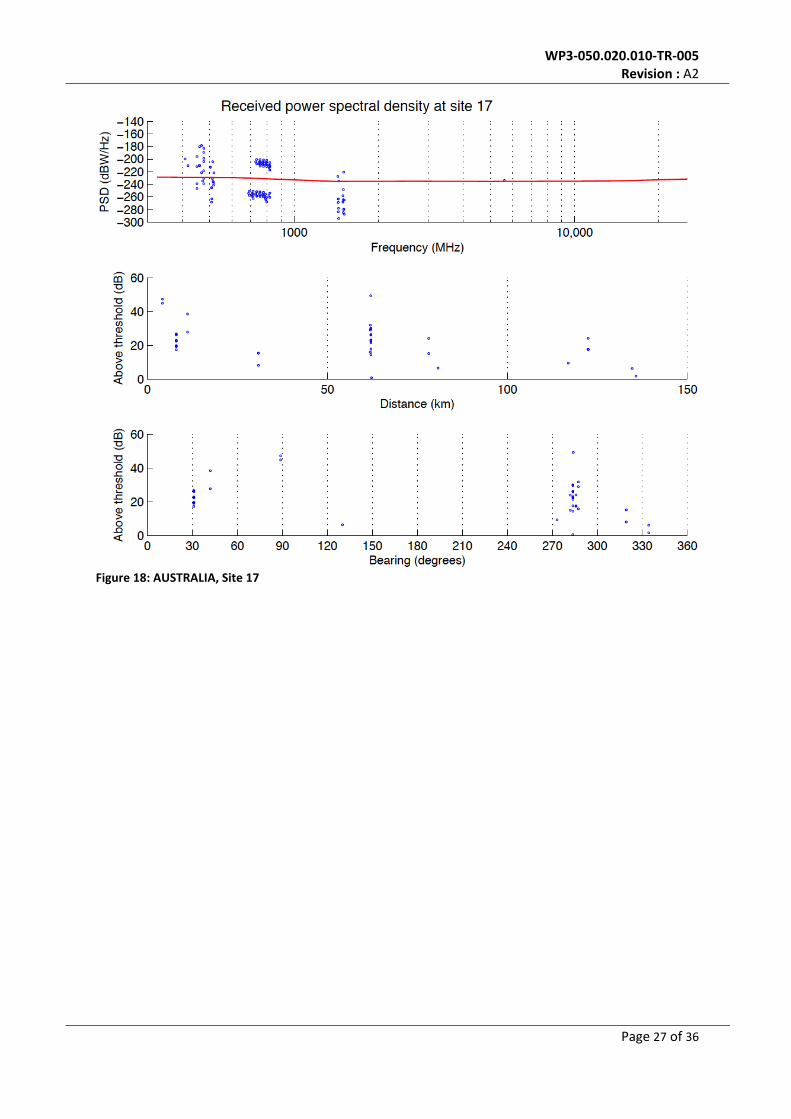
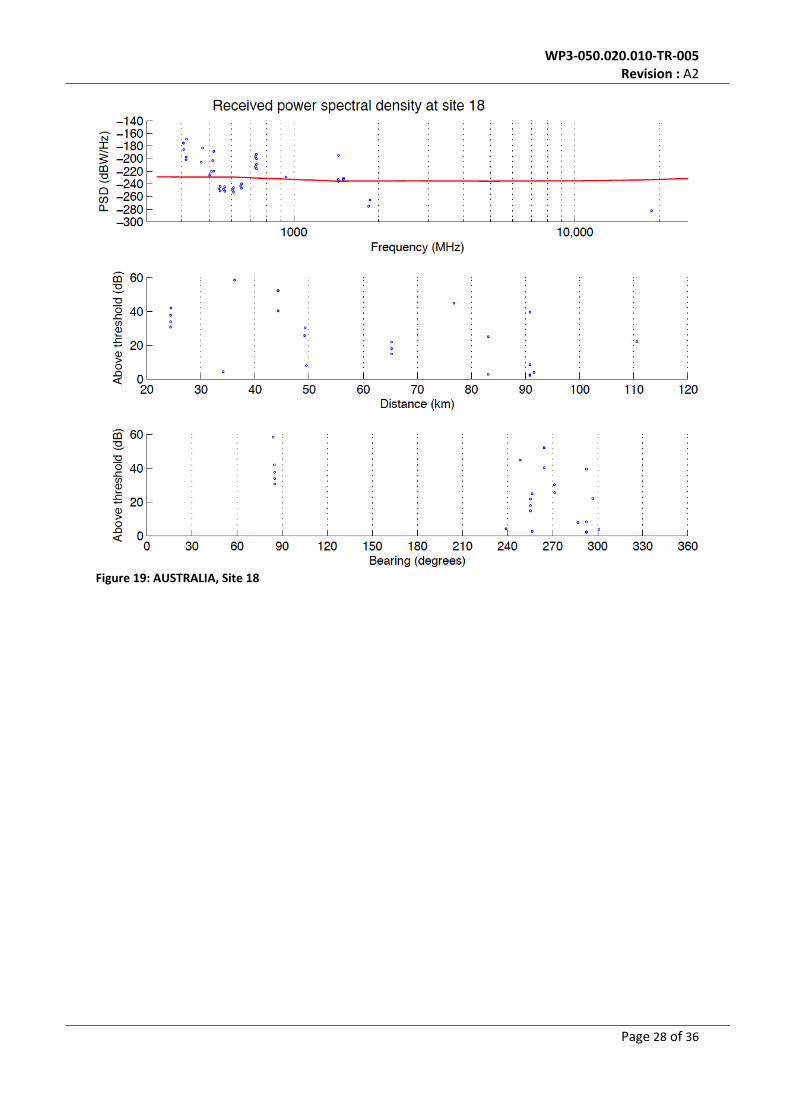
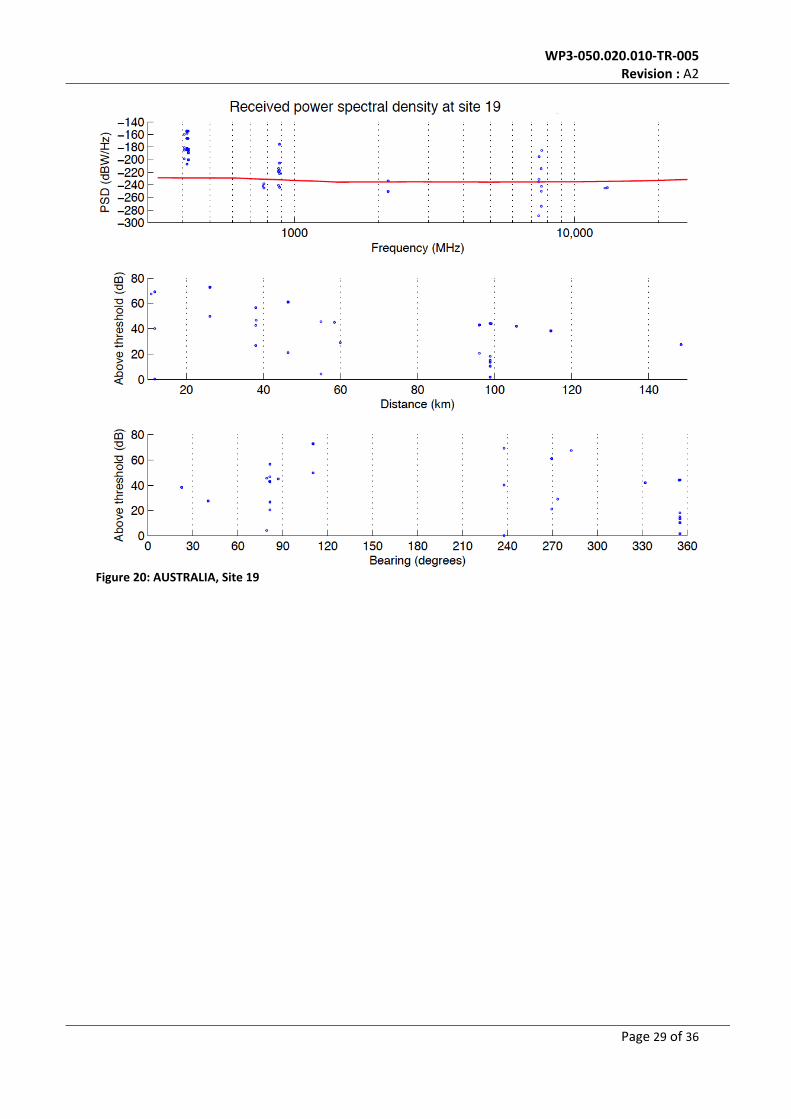
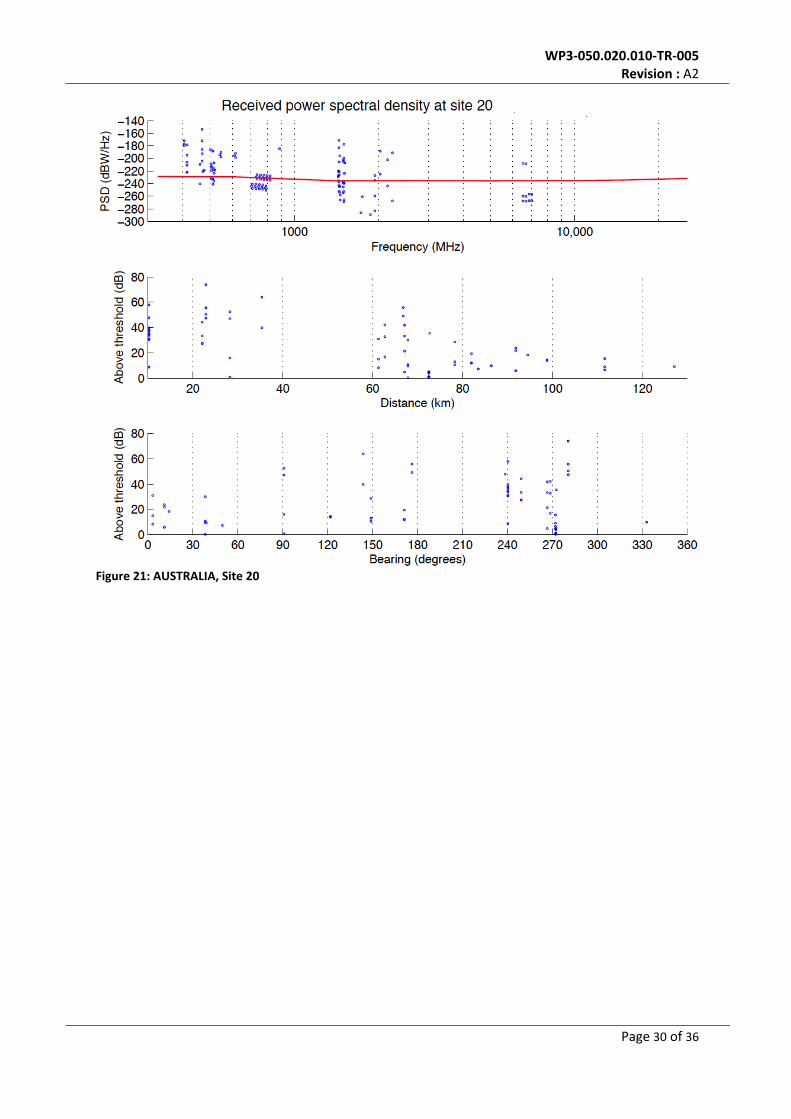
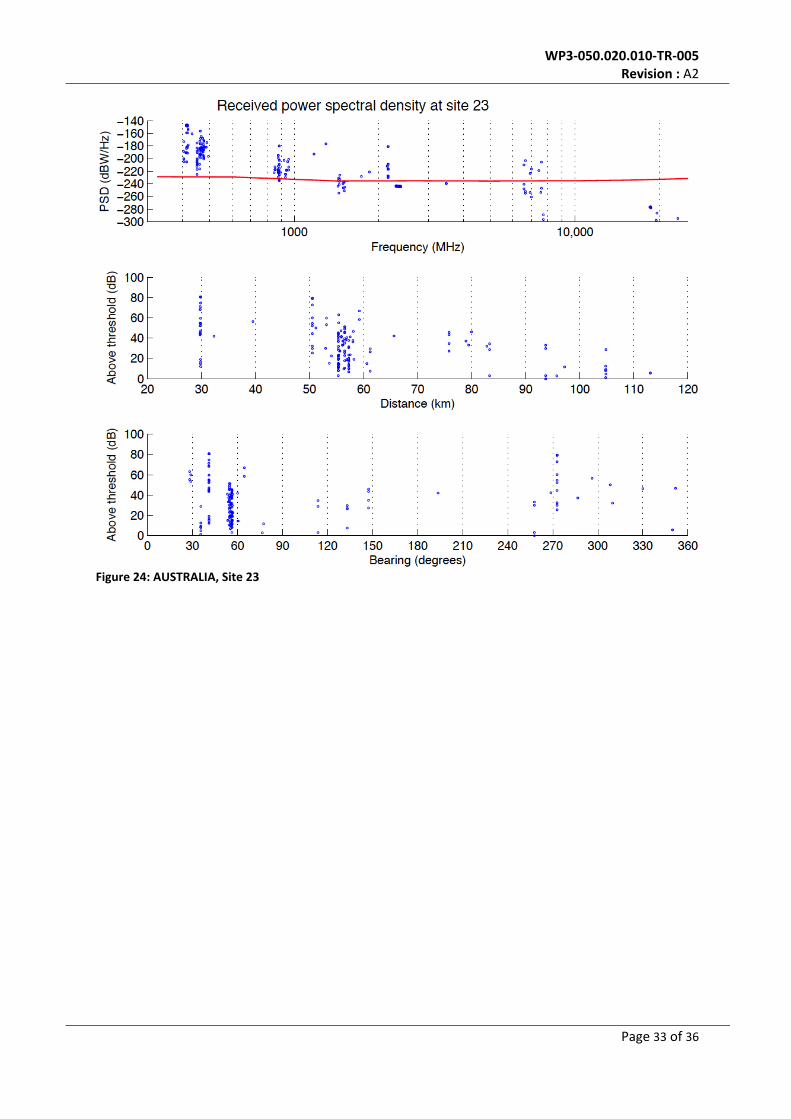
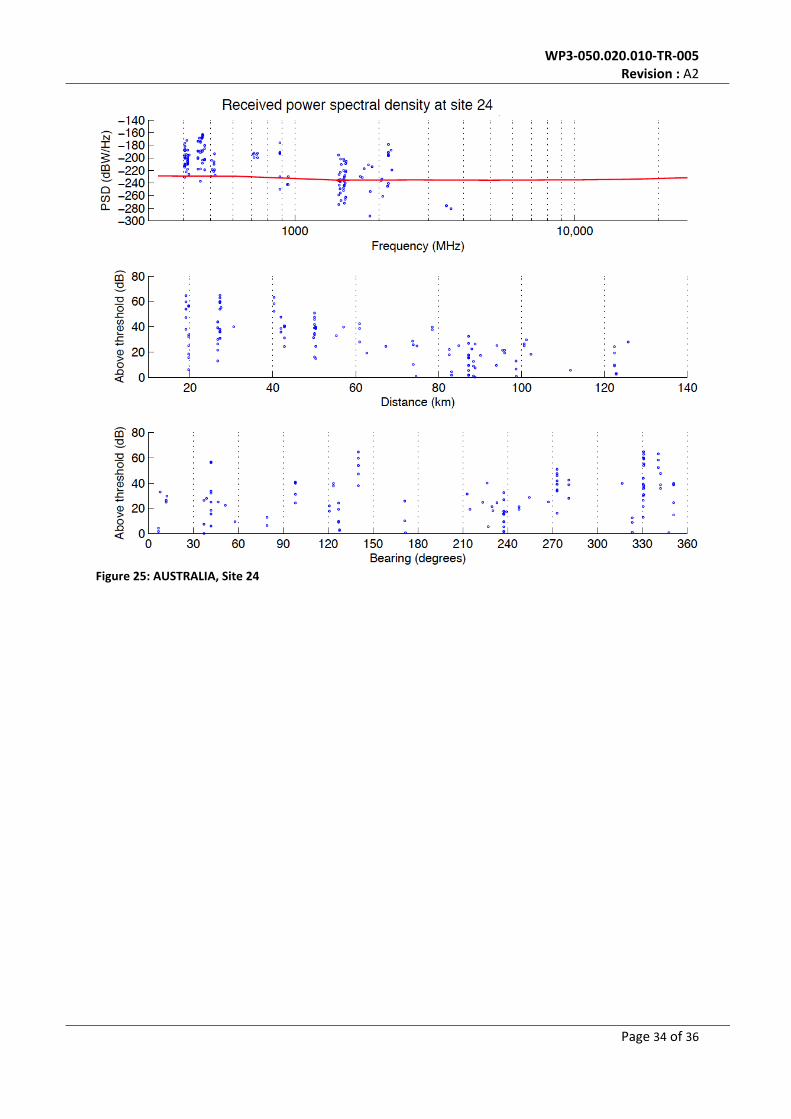
Theresultsarepresentedintwoseriesof25plots,eachwiththreesubpanels,fromthetop:1.ReceivedPSDlevelsindBW/Hzforthefrequencyrangeof300to25000MHz.Thelowerboundaryissetto300MHzbecausethisisthelowestforeseeablefrequencyinuseattheremotestations(dishonly).ThiswastheagreedlowerfrequencyforthisFoManalysis.Itmustbenotedinfactthatintheplots provided by Australia the lower boundary appears to be at 400MHz. The informationprovided by South Africa included much lower frequencies (<100MHz) but the plots that wereproducedbySPDOandpresentedhere,duplicatethefrequencyscale.Evaluatorsshouldthereforedisregardsignalsbelow400MHzwhenmakingcomparisons.Thesubpanelalsodisplays,inred,thethresholdPSDlevel(ΔPindBW/Hz)specifiedbyITU‐RRA.769‐2forVLBI,see[4],alsoreferredtoas‘Recommendation769’.InthisreferencethethresholdinterferencelevelsforVLBIobservationsaregivenasspectralpfd levels (SH indBWm‐2Hz‐1) inTable3.Toconvertthese levelstothesamePSDunitsasusedforthereceivedlevelsthefollowingexpressionisused(asperexpression5in[4]):
ΔP769VLBI = SH − 20 log( f ) −10 log( c2
4π) = SH − 20 log( f ) −158.5(dBWHz−1) ,
wherefistheobservingfrequencyinRec.769Table3.Thisequationfollowsfromtherelationshipofantennagainandeffectivearea,wherethegainissetto0dBi,asspecifiedinRec.769.Itisusefultoplotthisthresholdleveltoassessthereceivedinterferencefromlicensedtransmitters,but it should be noted that Rec. 769 sets protection levels for the bands reserved for the ‘RadioAstronomy Service’ (RAS) only. Here a plot with linearly interpolated levels between specifiedobservingfrequenciesisused.ReceivedlevelshigherthantheRec.769levelsaretobeexpectedforfrequenciesoutsidetheprotectedbands,asisdemonstratedintheseplots.2.ReceivedPSDlevelsindBabovetheRA.769‐2thresholdlevelforVLBIunder1,versusdistanceinkm.3.ReceivedPSDlevelsindBabovetheRA.769‐2thresholdlevelforVLBIasdescribedunder1,versusbearingindegrees,where0°isNorth.
WP3‐050.020.010‐TR‐005 Revision:A2
Page11of36
6.1 Australasia
Plotsreproducedfrom[5].
Figure2:AUSTRALIA,Site1

WP3‐050.020.010‐TR‐005 Revision:A2
Page12of36
Figure3:AUSTRALIA,Site2

WP3‐050.020.010‐TR‐005 Revision:A2
Page13of36
Figure4:AUSTRALIA,Site3
WP3‐050.020.010‐TR‐005 Revision:A2
Page14of36
Figure5:AUSTRALIA,Site4

WP3‐050.020.010‐TR‐005 Revision:A2
Page15of36
Figure6:AUSTRALIA,Site5

WP3‐050.020.010‐TR‐005 Revision:A2
Page16of36
Figure7:AUSTRALIA,Site6
WP3‐050.020.010‐TR‐005 Revision:A2
Page17of36
Figure8:AUSTRALIA,Site7
WP3‐050.020.010‐TR‐005 Revision:A2
Page18of36
Figure9:AUSTRALIA,Site8

WP3‐050.020.010‐TR‐005 Revision:A2
Page19of36
Figure10:AUSTRALIA,Site9
WP3‐050.020.010‐TR‐005 Revision:A2
Page20of36
Figure11:AUSTRALIA,Site10

WP3‐050.020.010‐TR‐005 Revision:A2
Page21of36
Figure12:AUSTRALIA,Site11
WP3‐050.020.010‐TR‐005 Revision:A2
Page22of36
Figure13:AUSTRALIA,Site12

WP3‐050.020.010‐TR‐005 Revision:A2
Page23of36
Figure14:AUSTRALIA,Site13
WP3‐050.020.010‐TR‐005 Revision:A2
Page24of36
Figure15:AUSTRALIA,Site14
WP3‐050.020.010‐TR‐005 Revision:A2
Page25of36
Figure16:AUSTRALIA,Site15

WP3‐050.020.010‐TR‐005 Revision:A2
Page26of36
Figure17:AUSTRALIA,Site16
WP3‐050.020.010‐TR‐005 Revision:A2
Page27of36
Figure18:AUSTRALIA,Site17
WP3‐050.020.010‐TR‐005 Revision:A2
Page28of36
Figure19:AUSTRALIA,Site18
WP3‐050.020.010‐TR‐005 Revision:A2
Page29of36
Figure20:AUSTRALIA,Site19
WP3‐050.020.010‐TR‐005 Revision:A2
Page30of36
Figure21:AUSTRALIA,Site20

WP3‐050.020.010‐TR‐005 Revision:A2
Page31of36
Figure22:AUSTRALIA,Site21

WP3‐050.020.010‐TR‐005 Revision:A2
Page32of36
Figure23:AUSTRALIA,Site22
WP3‐050.020.010‐TR‐005 Revision:A2
Page33of36
Figure24:AUSTRALIA,Site23
WP3‐050.020.010‐TR‐005 Revision:A2
Page34of36
Figure25:AUSTRALIA,Site24

WP3‐050.020.010‐TR‐005 Revision:A2
Page35of36
Figure26:AUSTRALIA,Site25
WP3‐050.020.010‐TR‐005 Revision:A2
Page36of36
7 References
[1] ArrayConfigurationsforCandidateSKASites:DesignandAnalysis,R.P.Millenaar,R.C.Bolton,J.
Lazio,Rev.C,SPDO,4‐11‐2011[2] SKA Site SpectrumMonitoring Sites: X1‐X4 and Y1‐Y4,MeasurementMode:MaxHoldMode
(MH),Rev.1.0,A.J.Boonstra,R.P.Millenaar,30‐9‐2011[3] SKASiteSpectrumMonitoringSites:X1‐X4andY1‐Y4,MeasurementMode:RuralMode(RM),
Rev.1.0,A.J.Boonstra,R.P.Millenaar,28‐9‐2011[4] Protectioncriteriausedforradioastronomicalmeasurements,RecommendationITU‐RRA.769‐
2,2003[5] Australian Remote Sites – Power Spectral Density estimation to assess spectral crowding, C.
Wilson,CSIRO,3‐06‐2011