Diversity of preferred nucleotide sequences around the ...
11
Published online 17 December 2007 Nucleic Acids Research, 2008, Vol. 36, No. 3 861–871 doi:10.1093/nar/gkm1102 Diversity of preferred nucleotide sequences around the translation initiation codon in eukaryote genomes So Nakagawa 1 , Yoshihito Niimura 2 , Takashi Gojobori 3,4 , Hiroshi Tanaka 1,2, * and Kin-ichiro Miura 5 1 Department of Systems Biology, School of Biomedical Science, 2 Department of Bioinformatics, Medical Research Institute, Tokyo Medical and Dental University, Yushima, Tokyo, 3 Center for Information Biology and DNA Data Bank of Japan, National Institute of Genetics, Mishima, Shizuoka, 4 Biological Information Research Center, National Institute of Advanced Industrial Science and Technology, Aomi, Tokyo and 5 Department of Medical Genome Science, Graduate School of Frontier Science, University of Tokyo, Kashiwa, Chiba, Japan Received August 21, 2007; Revised November 2, 2007; Accepted November 27, 2007 ABSTRACT Understanding regulatory mechanisms of protein synthesis in eukaryotes is essential for the accu- rate annotation of genome sequences. Kozak reported that the nucleotide sequence GCCGCC (A/G)CC AUGG ( AUG is the initiation codon) was frequently observed in vertebrate genes and that this ‘consensus’ sequence enhanced translation initiation. However, later studies using invertebrate, fungal and plant genes reported different ‘con- sensus’ sequences. In this study, we conducted extensive comparative analyses of nucleotide sequences around the initiation codon by using genomic data from 47 eukaryote species including animals, fungi, plants and protists. The analyses revealed that preferred nucleotide sequences are quite diverse among different species, but differ- ences between patterns of nucleotide bias roughly reflect the evolutionary relationships of the species. We also found strong biases of A/G at position 23, A/C at position 22 and C at position +5 that were commonly observed in all species examined. Genes with higher expression levels showed stronger signals, suggesting that these nucleotides are responsible for the regulation of translation initiation. The diversity of preferred nucleotide sequences around the initiation codon might be explained by differences in relative contributions from two distinct patterns, GCCGCC AUG and AAAAAA AUG, which implies the presence of multiple molecular mecha- nisms for controlling translation initiation. INTRODUCTION The control of translation initiation is one of the most fundamental processes in the regulation of gene expression. In 1978, Kozak (1,2) proposed the scanning model for translation initiation in eukaryotes. According to this model, the 40S ribosomal subunit with several initiation factors binds the 7-methyl guanosine cap at the 5 0 end of an mRNA and moves along the mRNA until it encounters an AUG codon. It was also proposed that when the AUG codon is in the context of GCCGCC(A/G)CC AUGG (A/G represents A or G and AUG represents the translation initiation codon), which is called the ‘Kozak consensus sequence’, the efficiency of translation initiation is enhanced. However, the detailed molecular mechanism of translation initiation in eukaryotes is still unclear. Moreover, although the sequence is described as a ‘con- sensus’ sequence, the extent of conservation is quite low. It was reported that only 0.2% of vertebrate genes contain precisely the sequence GCCGCC(A/G)CC AUGG (3). We therefore avoid using the word ‘consensus’ in this context, and instead refer to the sequence as ‘preferred’ sequence. Kozak compiled 211 genes (4) and 699 genes (5) primarily from vertebrates and obtained the above sequence. This sequence was initially thought to be essential for all eukaryotes (4). Later, however, it was revealed that a preferred nucleotide sequence around the initiation codon varies considerably among different species. The preferred sequences are GCGGC(A/C) (A/G)(A/C)C AUGGCG for Monocots (1127 genes), AAAAAAA(A/C)A AUGGCU for Dicots (derived from 3643 genes) (6), ACAACCAAA AUGGC for Drosophila melanogaster (192 genes), UAAAT(A/C)AAC AUG (A/G)C for other invertebrates (155 genes), and *To whom correspondence should be addressed. Tel: +81 3 5803 5839; Fax: +81 3 5803 0247; Email: [email protected] ß 2007 The Author(s) This is an Open Access article distributed under the terms of the Creative Commons Attribution Non-Commercial License (http://creativecommons.org/licenses/ by-nc/2.0/uk/) which permits unrestricted non-commercial use, distribution, and reproduction in any medium, provided the original work is properly cited.
Transcript of Diversity of preferred nucleotide sequences around the ...
Published online 17 December 2007 Nucleic Acids Research, 2008, Vol. 36, No. 3 861–871doi:10.1093/nar/gkm1102
Diversity of preferred nucleotide sequencesaround the translation initiation codon ineukaryote genomesSo Nakagawa1, Yoshihito Niimura2, Takashi Gojobori3,4, Hiroshi Tanaka1,2,* and
Kin-ichiro Miura5
1Department of Systems Biology, School of Biomedical Science, 2Department of Bioinformatics, Medical ResearchInstitute, Tokyo Medical and Dental University, Yushima, Tokyo, 3Center for Information Biology and DNA DataBank of Japan, National Institute of Genetics, Mishima, Shizuoka, 4Biological Information Research Center,National Institute of Advanced Industrial Science and Technology, Aomi, Tokyo and 5Department of MedicalGenome Science, Graduate School of Frontier Science, University of Tokyo, Kashiwa, Chiba, Japan
Received August 21, 2007; Revised November 2, 2007; Accepted November 27, 2007
ABSTRACT
Understanding regulatory mechanisms of proteinsynthesis in eukaryotes is essential for the accu-rate annotation of genome sequences. Kozakreported that the nucleotide sequence GCCGCC(A/G)CCAUGG (AUG is the initiation codon) wasfrequently observed in vertebrate genes and thatthis ‘consensus’ sequence enhanced translationinitiation. However, later studies using invertebrate,fungal and plant genes reported different ‘con-sensus’ sequences. In this study, we conductedextensive comparative analyses of nucleotidesequences around the initiation codon by usinggenomic data from 47 eukaryote species includinganimals, fungi, plants and protists. The analysesrevealed that preferred nucleotide sequences arequite diverse among different species, but differ-ences between patterns of nucleotide bias roughlyreflect the evolutionary relationships of the species.We also found strong biases of A/G at position 23,A/C at position 22 and C at position +5 that werecommonly observed in all species examined. Geneswith higher expression levels showed strongersignals, suggesting that these nucleotides areresponsible for the regulation of translation initiation.The diversity of preferred nucleotide sequencesaround the initiation codon might be explained bydifferences in relative contributions from two distinctpatterns, GCCGCCAUG and AAAAAAAUG, whichimplies the presence of multiple molecular mecha-nisms for controlling translation initiation.
INTRODUCTION
The control of translation initiation is one of the mostfundamental processes in the regulation of gene expression.In 1978, Kozak (1,2) proposed the scanning model fortranslation initiation in eukaryotes. According to thismodel, the 40S ribosomal subunit with several initiationfactors binds the 7-methyl guanosine cap at the 50 end of anmRNA and moves along the mRNA until it encountersan AUG codon. It was also proposed that when the AUGcodon is in the context of GCCGCC(A/G)CCAUGG(A/G represents A or G and AUG represents thetranslation initiation codon), which is called the ‘Kozakconsensus sequence’, the efficiency of translation initiationis enhanced. However, the detailed molecular mechanismof translation initiation in eukaryotes is still unclear.Moreover, although the sequence is described as a ‘con-sensus’ sequence, the extent of conservation is quite low.It was reported that only 0.2% of vertebrate genes containprecisely the sequence GCCGCC(A/G)CCAUGG (3). Wetherefore avoid using the word ‘consensus’ in this context,and instead refer to the sequence as ‘preferred’ sequence.Kozak compiled 211 genes (4) and 699 genes (5)
primarily from vertebrates and obtained the abovesequence. This sequence was initially thought to beessential for all eukaryotes (4). Later, however, it wasrevealed that a preferred nucleotide sequence around theinitiation codon varies considerably among differentspecies. The preferred sequences are GCGGC(A/C)(A/G)(A/C)CAUGGCG for Monocots (1127 genes),AAAAAAA(A/C)AAUGGCU for Dicots (derived from3643 genes) (6), ACAACCAAAAUGGC for Drosophilamelanogaster (192 genes), UAAAT(A/C)AACAUG(A/G)C for other invertebrates (155 genes), and
*To whom correspondence should be addressed. Tel: +81 3 5803 5839; Fax: +81 3 5803 0247; Email: [email protected]
� 2007 The Author(s)
This is an Open Access article distributed under the terms of the Creative Commons Attribution Non-Commercial License (http://creativecommons.org/licenses/
by-nc/2.0/uk/) which permits unrestricted non-commercial use, distribution, and reproduction in any medium, provided the original work is properly cited.

AAAAAAAAAAUGTC for Saccharomyces cerevisiae(461 genes) (3). Kozak also reported that replacement ofA/G at position �3 (three bases before the initiationcodon) and G at position +4 (one base after the initiationcodon) strongly impaired translation initiation in mam-mals (7,8). However, in S. cerevisiae nucleotide substitu-tions at position �3 did not substantially affect the rate oftranslation initiation (9,10), although there is a nucleotidebias towards A at this position (3). It therefore appearsthat the molecular mechanisms for recognizing theinitiation codon vary among species.There have been two limitations to previous studies
aimed at identifying preferred sequences around theinitiation codon. First, the number of species and genesexamined was limited. In this study, we used whole-genome expression data and gene sequences from diverseeukaryote species. The second issue has been that the GCcontents in genomes are known to differ from species tospecies. The preference for A before the initiation codon inDicots and S. cerevisiae can be partially explained by theAT-richness of their genomes. To compare nucleotidesequences responsible for translation initiation amongvarious species, differences in the usage of nucleotides ineach genome must be considered. We previously inventeda method of graphically representing nucleotide appear-ance biases at each position in a gene on the basis of thedeviation from the expected values that are calculated fora given genome sequence (11,12). Application of thismethod to bacterial genomic data led to the successfulidentification of the Shine-Dalgarno (SD) sequence, awell-characterized signal for translation initiation inprokaryotes (11). We have also reported that thenucleotides appearing at the second codon (the codonnext to the initiation codon) are highly biased in eukaryotegenes and that a preferred second codon is characteristicof each species (e.g. GCG for mammals and plants) (12).To obtain additional insight into the molecular mecha-
nisms of translation initiation in eukaryotes, we exten-sively examined the nucleotide sequences around theinitiation codon by using the method introduced above.We conducted comparative analyses of the biases innucleotides located in positions proximal to the initiationcodon among 47 eukaryote species including animals,fungi, plants and protists. We thereby were able to identifyboth universal and species-specific features, and thesefeatures possibly reflect the evolution of the mechanism oftranslation initiation.
MATERIALS AND METHODS
Data
We used cDNA or genome sequence data from 47eukaryote species including 22 metazoans, eight plants,nine fungi and eight protists. Species names and thedatabase used are shown in Table 1. We used only protein-coding genes that start from the AUG codon and end witha stop codon. As for human genes, we used genes incategories I–IV provided by the H-Invitational Database(13). When information about alternative splicing variantswas available, only one representative sequence with the
longest coding sequence (CDS) was used. Otherwise, all ofthe protein-coding genes were used [for UniGene database(14)]. The amount of expressed mRNAs in humans andS. cerevisiae, obtained by serial analysis of gene expression(SAGE), were downloaded from H-ANGEL (http://jbirc.jbic.or.jp/hinv/h-angel/) (15) and Holstege’s website (http://www.wi.mit.edu/young/expression.html) (16),respectively.
Evaluation of nucleotide frequency bias
To examine biases in nucleotide appearance around theinitiation codon, all genes from each species were alignedat the initiation codons without any alignment gaps. Thenumber of each nucleotide [A, U (T), G and C] wascounted at each position in the alignment. The observednumbers of nucleotides were compared with the expectednumbers using the likelihood-ratio statistic or theG-statistic, which is used for a test for goodness-of-fit(17). The expectations were calculated for each species infour separate categories, namely, the 50 untranslatedregions (UTRs) and the first, second and third positionsin a codon in CDSs, because nucleotide frequencies aredifferent among these categories. The G-value at position iwas calculated by the formula:
G ið Þ ¼ 2Xn
O ið Þn
O ið Þn
Eið Þn
� �1
where O ið Þn is the observed number of nucleotide n (A, U, G
and C) at position i, and E ið Þn is the expected number of
nucleotide n in the category to which position i belongs(50 UTRs or the first, second or third positions in acodon). As regards the genomic data [RefSeq, MIPS andGeneDB (14,18,19)], 100 base-pair (bp) regions upstreamfrom the initiation codon were regarded as the 50 UTRsand data from these regions were used for the computa-tion of the expectations. It is known that the distributionof the G-statistic is approximated by the �2-distributionwith f� 1 degrees of freedom when the sample size is large,where f is the number of different classes (f=4). Eachterm in Formula 1 represents the contribution of eachnucleotide to the bias. When O ið Þ
n is larger and smaller thanE ið Þn , the values of 2O ið Þ
n lnðO ið Þn =E
ið Þn Þ become positive and
negative, respectively. For this reason, we regarded eachterm in Formula 1 as a measure of the bias for eachnucleotide at a given position. G-values are proportionalto the number of genes (N) when the fractions of observedand expected numbers of nucleotides are the same. Tocompare nucleotide biases among different species withdifferent numbers of genes, we defined a value that is notaffected by the number of genes, gin ¼ 2o ið Þ
n lnðo ið Þn =e
ið Þn Þ,
where o ið Þn and e ið Þ
n are the fractions of the observed andexpected numbers of nucleotide n at position i. When o ið Þ
n iszero, g ið Þ
n is defined to be zero. The G-value divided by N isequal to the sum of g ið Þ
n ðGið Þ=N ¼
Pn g
ið Þn Þ.
Cluster analysis of the patterns in nucleotide biases
We quantified similarities between the patterns in nucleo-tide bias around initiation codons by using the Pearson’scorrelation coefficient. The correlation coefficient rXY
862 Nucleic Acids Research, 2008, Vol. 36, No. 3
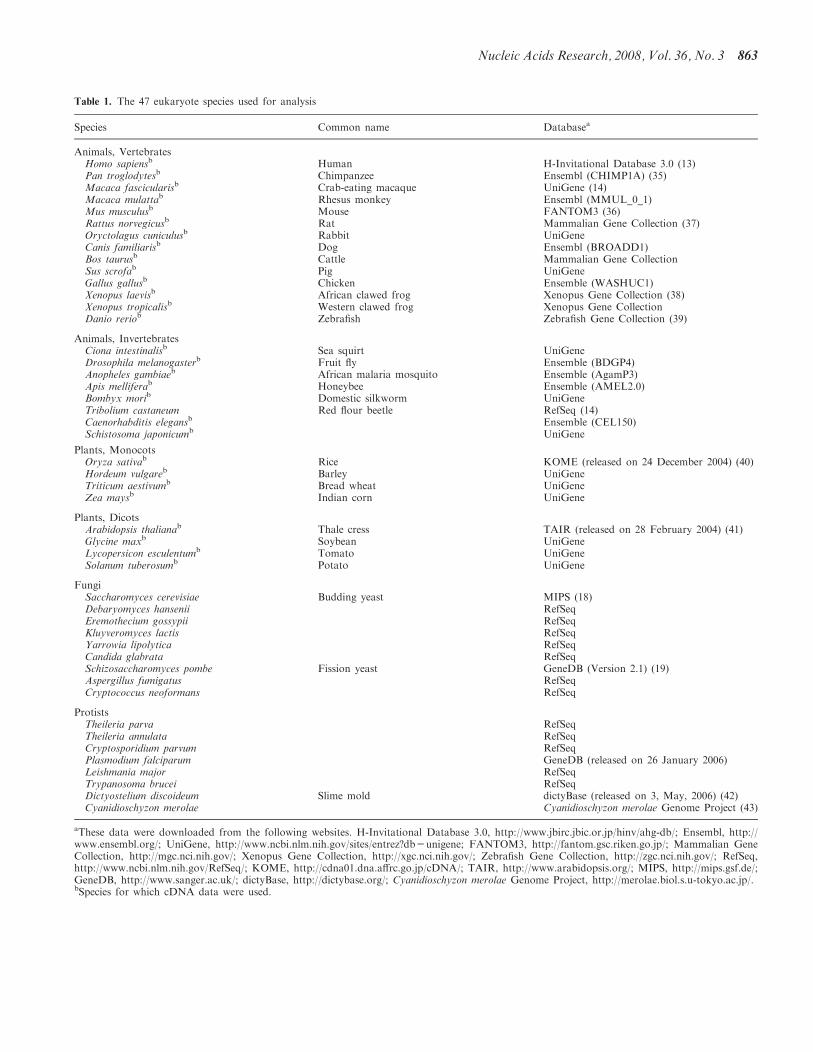
Table 1. The 47 eukaryote species used for analysis
Species Common name Databasea
Animals, VertebratesHomo sapiensb Human H-Invitational Database 3.0 (13)Pan troglodytesb Chimpanzee Ensembl (CHIMP1A) (35)Macaca fascicularisb Crab-eating macaque UniGene (14)Macaca mulattab Rhesus monkey Ensembl (MMUL_0_1)Mus musculusb Mouse FANTOM3 (36)Rattus norvegicusb Rat Mammalian Gene Collection (37)Oryctolagus cuniculusb Rabbit UniGeneCanis familiarisb Dog Ensembl (BROADD1)Bos taurusb Cattle Mammalian Gene CollectionSus scrofab Pig UniGeneGallus gallusb Chicken Ensemble (WASHUC1)Xenopus laevisb African clawed frog Xenopus Gene Collection (38)Xenopus tropicalisb Western clawed frog Xenopus Gene CollectionDanio reriob Zebrafish Zebrafish Gene Collection (39)
Animals, InvertebratesCiona intestinalisb Sea squirt UniGeneDrosophila melanogasterb Fruit fly Ensemble (BDGP4)Anopheles gambiaeb African malaria mosquito Ensemble (AgamP3)Apis melliferab Honeybee Ensemble (AMEL2.0)Bombyx morib Domestic silkworm UniGeneTribolium castaneum Red flour beetle RefSeq (14)Caenorhabditis elegansb Ensemble (CEL150)Schistosoma japonicumb UniGene
Plants, MonocotsOryza sativab Rice KOME (released on 24 December 2004) (40)Hordeum vulgareb Barley UniGeneTriticum aestivumb Bread wheat UniGeneZea maysb Indian corn UniGene
Plants, DicotsArabidopsis thalianab Thale cress TAIR (released on 28 February 2004) (41)Glycine maxb Soybean UniGeneLycopersicon esculentumb Tomato UniGeneSolanum tuberosumb Potato UniGene
FungiSaccharomyces cerevisiae Budding yeast MIPS (18)Debaryomyces hansenii RefSeqEremothecium gossypii RefSeqKluyveromyces lactis RefSeqYarrowia lipolytica RefSeqCandida glabrata RefSeqSchizosaccharomyces pombe Fission yeast GeneDB (Version 2.1) (19)Aspergillus fumigatus RefSeqCryptococcus neoformans RefSeq
ProtistsTheileria parva RefSeqTheileria annulata RefSeqCryptosporidium parvum RefSeqPlasmodium falciparum GeneDB (released on 26 January 2006)Leishmania major RefSeqTrypanosoma brucei RefSeqDictyostelium discoideum Slime mold dictyBase (released on 3, May, 2006) (42)Cyanidioschyzon merolae Cyanidioschyzon merolae Genome Project (43)
aThese data were downloaded from the following websites. H-Invitational Database 3.0, http://www.jbirc.jbic.or.jp/hinv/ahg-db/; Ensembl, http://www.ensembl.org/; UniGene, http://www.ncbi.nlm.nih.gov/sites/entrez?db=unigene; FANTOM3, http://fantom.gsc.riken.go.jp/; Mammalian GeneCollection, http://mgc.nci.nih.gov/; Xenopus Gene Collection, http://xgc.nci.nih.gov/; Zebrafish Gene Collection, http://zgc.nci.nih.gov/; RefSeq,http://www.ncbi.nlm.nih.gov/RefSeq/; KOME, http://cdna01.dna.affrc.go.jp/cDNA/; TAIR, http://www.arabidopsis.org/; MIPS, http://mips.gsf.de/;GeneDB, http://www.sanger.ac.uk/; dictyBase, http://dictybase.org/; Cyanidioschyzon merolae Genome Project, http://merolae.biol.s.u-tokyo.ac.jp/.bSpecies for which cDNA data were used.
Nucleic Acids Research, 2008, Vol. 36, No. 3 863

between species X and Y was calculated from the gn valuesfrom positions�9 to�1 in the 50 UTRs, and from positions+4 to +6 in the CDSs (the second codon) as follows:
rXY ¼
Pi
Pn
gið ÞXn � gX
� �g
ið ÞYn � gY
� �ffiffiffiffiffiffiffiffiffiffiffiffiffiffiffiffiffiffiffiffiffiffiffiffiffiffiffiffiffiffiffiffiffiffiffiffiffiPi
Pn
gið ÞXn � gX
� �2s ffiffiffiffiffiffiffiffiffiffiffiffiffiffiffiffiffiffiffiffiffiffiffiffiffiffiffiffiffiffiffiffiffiffiffiffiffiPi
Pn
gið ÞYn � gY
� �2s
where gið ÞXn and g
ið ÞYn represent gn values of nucleotide n
(A, U, G or C) at position i in species X and Y,respectively, and gX and gY represent the average of gnvalues among all positions (from –9 to �1 and from+4 to+6) and nucleotides in species X and Y, respectively. Wecalculated r-values for all combinations among the 47species examined and defined the similarity score D as1� r. Using the similarity scores, the cluster analysis wasconducted by the group average method (Figure 3), thecentroid method and the Ward method (Figure S1). Notethat D is free from the absolute values of gn. When thenumber of genes used is small, the gn values tend tobecome large, apparently because highly expressed genesare more likely to be contained in a small gene set than aregenes expressed at low levels. Therefore, although the gnvalues are affected by the number of genes, the values of Dare expected to be robust against the difference in thenumber of genes for each species.
Evaluation of hexanucleotide biases
We evaluated the deviation of the observed number of aparticular combination of nucleotides from the expectednumber by using the Z-value (Tables 3 and 4 and Table S1that is available as Supplementary Data). The Z-value wascalculated by Z=(O�E)/[E (1�E/N )]1/2, where N is thenumber of genes, and O and E are observed and expectednumbers of a particular combination of nucleotides,respectively. The expected number was calculated byassuming that a nucleotide at each position appearsindependently (see the legend of Table 3). We calculatedthe Z-values for all possible combinations of six nucleo-tides (46=4096 combinations) in the region upstream ofthe initiation codon (from positions �6 to �1) and rankedthem according to the Z-value. To see whether a sequencethat is a mixture of GCCGCCAUG and AAAAAAAUGis suppressed in genes or not, we examined hexanucleotidesequences generated by combining three nucleotides fromGCCGCCAUG and three nucleotides from AAAAAAAUG (e.g. GAAACCAUG or ACAGACAUG). Thereare 20 (6C3) such combinations (Table 4). From them, weexcluded AAAGCCAUG and GCCAAAAUG, becauseGCCAUG and AAAAUG were observed much morefrequently than the expectations (Table S1). We regardedthe remaining 18 sequences as ‘mixed sequences’. Weconducted the Wilcoxon rank sum test to see whether theranks of the 18 mixed sequences are significantly lowamong the 4096 sequences or not.
RESULTS
We evaluated biases in nucleotide appearance at eachposition around the initiation codon by using the
G-statistic (see Materials and Methods section). Figure 1shows the results obtained for 10 012 human genes. Asshown in the upper diagram of this figure, the fractions ofnucleotides A, T, G and C vary considerably in a position-dependent manner. The largest deviation of nucleotidefrequencies from the expected values was observed atposition �3, which is indicated by the largest G-value atthis position (middle diagram). At this position, the valuesof gn are positive for A and G (lower diagram), whichindicates that A and G appear more frequently than theexpectations (see Materials and Methods section). In fact,the fractions of A and G at position �3 are 39.3% and34.6%, respectively, which are much larger than those inthe entire 50 UTRs of 10 012 human genes (23.7% and26.6%, respectively). The results depicted in the lowerdiagram suggest that the preferred sequence in humans isGCCGCC(A/G)(C/A)CAUGGCG, which is nearly thesame as the sequence reported by Kozak (4,5). Note thatthe bias of GCG at the second codon is also quite strong,as we previously reported (12).
Figure 1. Biases in nucleotide appearance for 10 012 human genes. Top,fractions of nucleotides appearing at each position in 24 base-pair (bp)regions in 50 UTRs and CDSs. A, U, G and C are shown in green,magenta, yellow and blue, respectively. Middle, G-values divided by thenumber of genes (N=10012), showing the deviation from the expectedvalues. Bottom, the values of gn for n=A, U, G or C at each position.The color scheme is the same as that used in the diagram at the top.Colored bars above and below the horizontal line indicate positive andnegative gn values, respectively, and these bars were drawn withoutoverlapping. In the middle and bottom diagrams, the values for theinitiation codon (AUG) are omitted. Note that the biases shown inthis figure are statistically highly significant (P<< 10�10 from positions�9 to +6) because of the large sample size.
864 Nucleic Acids Research, 2008, Vol. 36, No. 3

We applied the method described here to investigate thegenes of 47 eukaryote species for which full-length cDNAor whole-genome data are available (Figure 2). Thesespecies included a wide variety of eukaryotes such as thesoil-dwelling social amoeba Dictyostelium discoideum andthe unicellular red alga Cyanidioschyzon merolae (Table 1).We used cDNA data when they are available, becausegene annotation based on expression data is expected tobe more accurate than that predicted from genomesequences. For most of the animal and plant speciesexamined, cDNA data were used (Table 1). In Figure 2,only the region from positions �9 to +6 is shown, inwhich the G-values are relatively large. This figure revealsthat the preferred nucleotide sequences around theinitiation codon, as well as the extent of deviation fromthe expectations, vary among species. However, severalfeatures were commonly observed among species. Forexample, A is preferred at position �3 in all speciesexamined. To compare the patterns of bias in nucleotidefrequencies among different species, we quantified thesimilarity of gn values in the region from positions �9 to+6 between two species (see Materials and Methodssection). By using a similarity score (D), we conducted thecluster analysis (Figure 3). The results showed thatvertebrates, Monocots and Dicots each formed a cluster,thus indicating that the patterns of nucleotide bias aresimilar within each of these groups of organisms.Although the cluster dendrogram changed depending onthe method of cluster analysis used, the clustering ofvertebrates, Monocots and Dicots was robust (Figure S1).Fungi, invertebrates (containing urochordates, arthro-pods, nematodes and platyhelminithes) and each taxo-nomic group of protists also tended to form a cluster.These observations suggest that the patterns of nucleotidebias around the initiation codon roughly reflect theevolutionary relationships of eukaryote species.
Figure 4 shows the preferred sequences for eachtaxonomic group of eukaryotes. These sequences wereobtained by taking the average of the patterns ofnucleotide bias for all species belonging to each group.The sequences obtained here are similar to thosepreviously reported. For example, for Monocots thepreferred sequence obtained is G(A/C)(G/A)GC(A/C/G)(G/A)(C/A)(G/C)AUGGCG, which is similar to thatreported in Joshi et al. (6) (see Introduction section). Thefollowing biases in nucleotide appearance were commonlyobserved among all taxonomic groups examined: �6G(G at position �6), �3A/G, �2A/C and +5C. Of thesebiases, �3A is the most remarkable. Moreover, a generaltendency toward the under-representation of U aroundthe initiation codon was observed. The biases in protistsare relatively weak, reflecting highly variable patterns ofnucleotide bias in these species (Figure 2).
Figure 4 also suggests that A-rich biases are present inthe region from positions �4 to �1 in almost all speciesexamined. These biases are clearly observed even inspecies with very low GC content. For example, thefraction of A in the D. discoideum genome is 38.8% (theGC content is 22.4%) (20), while the fraction of A atposition �3 is as high as 85.9% (Figure S2). Moreover, weidentified signals that had not been reported to date.
Monocots showed a signal of GC(C/G)GC(C/G)AUG asmentioned above, but a similar pattern was also observedin Dicots. Furthermore, a relatively weak but clear signalof GCCGCCAUG was detected from invertebrates andfungi, which is similar to the sequence for vertebrates.It therefore appears that the preferred sequences ineukaryotes can be regarded as a summation of therepetition of GCC and that of A (see Discussion section).To determine whether the biases described above are
responsible for the efficiency of translation initiation, weexamined the correlation of the strengths of the biaseswith gene expression levels. It is reasonable to assume thatthe translation rates would be high for highly expressedgenes and low for genes expressed at low levels. In fact, wehave conducted a genome-wide microarray analysis andshown that the efficiency of translation initiation iscorrelated with the expression level of mRNAs forS. cerevisiae genes (Akiyama et al., unpublished data).Therefore, the signals for efficient translation initiation areassumed to be more conspicuous for highly expressedgenes. Figure 5A indicates the results for 1000 genes withhigh expression levels and those for 1000 genes with lowexpression levels in humans and S. cerevisiae. Table 2gives the fractions of �3A and +5G for genes expressedat high and low levels, and those for the entire set of genesin the two species. These results clearly show that thebiases identified by using an entire set of genes becamestronger when highly expressed genes were used. Theseresults suggest that some of the preferred sequencesidentified in this study are responsible for the efficiencyof translation initiation.We also identified a clear pattern of three-base
periodicity from several vertebrate and Monocot species(Figure 5B). Interestingly, a similar pattern of a GCC orGCG repeat was observed in both 50 UTRs and CDSregions, and the biases were more prominent in the regionsnear the initiation codon. One might suspect that thethree-base periodicity in the 50 UTRs is due to an artifact,i.e. that the CDSs are wrongly annotated as UTRsbecause of an inaccurate assignment of initiationcodons. To determine whether this observation is due toan artifact or not, we conducted the same analysis usingonly the genes containing an in-frame stop codon in the 50
UTR, but which do not contain any in-frame AUGcodons between the initiation codon and the closestupstream stop codon from the initiation codon(Figure S3A). For such genes, there are no possibilitiesthat wrongly annotated 50 UTRs used in the analysescontain CDSs. The results clearly show that the periodicpattern described above is also observed in such genes,suggesting that this pattern is not an artifact, but rather asignal for the initiation of translation (Figure S3B).As shown in Figure 5C, U- and A-rich biases were
commonly observed around positions �40 and �15,respectively, in amphibians, fishes and insects. InD. melanogaster, for example, the average fraction of Uin the region from positions �45 to �35 is 28.2%, and theaverage fraction of A from positions �20 to �10 is 35.6%.These values are considerably larger than the averages inthe entire 50 UTRs (21.4% for U and 31.5% for A).However, these biases are not clear in the other species.
Nucleic Acids Research, 2008, Vol. 36, No. 3 865

Figure 2. Nucleotide biases around the initiation codon in 47 eukaryote species. Each diagram shows gn values from positions �9 to +6 in eachspecies. The name of the species and the number of genes used are also given. The color scheme is the same as that used in Figure 1. The initiationcodon (AUG) is not shown.
866 Nucleic Acids Research, 2008, Vol. 36, No. 3
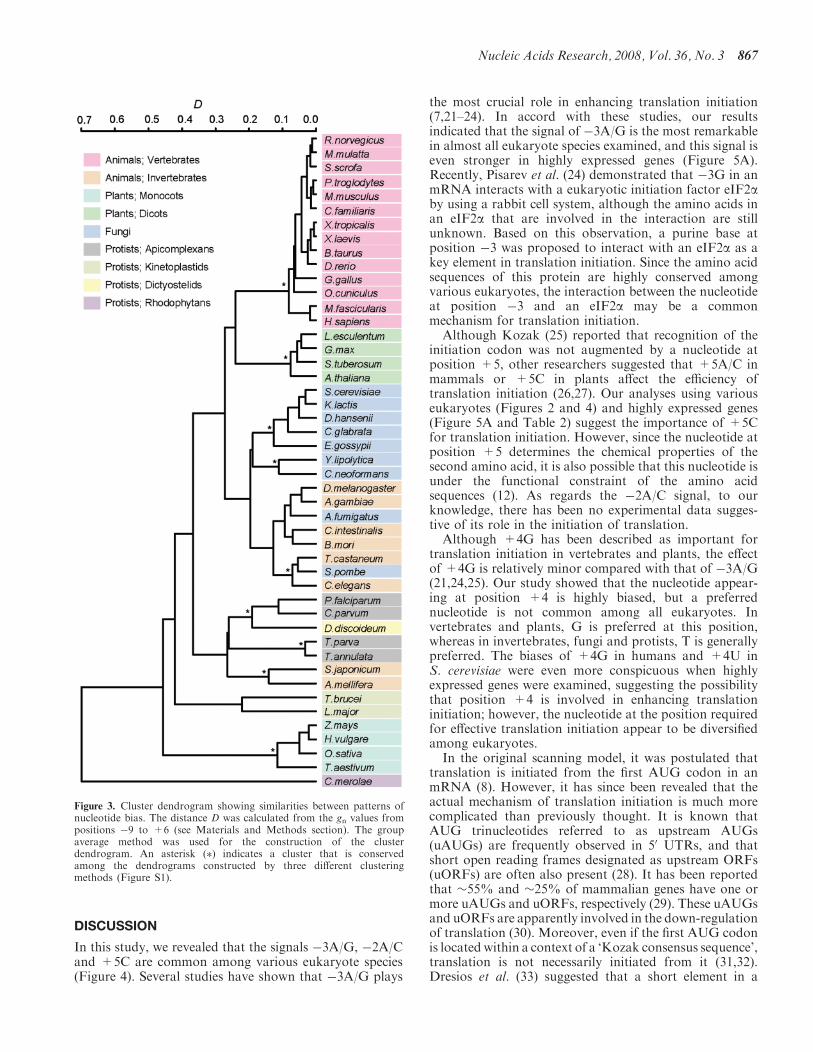
DISCUSSION
In this study, we revealed that the signals �3A/G, �2A/Cand +5C are common among various eukaryote species(Figure 4). Several studies have shown that �3A/G plays
the most crucial role in enhancing translation initiation(7,21–24). In accord with these studies, our resultsindicated that the signal of �3A/G is the most remarkablein almost all eukaryote species examined, and this signal iseven stronger in highly expressed genes (Figure 5A).Recently, Pisarev et al. (24) demonstrated that �3G in anmRNA interacts with a eukaryotic initiation factor eIF2aby using a rabbit cell system, although the amino acids inan eIF2a that are involved in the interaction are stillunknown. Based on this observation, a purine base atposition �3 was proposed to interact with an eIF2a as akey element in translation initiation. Since the amino acidsequences of this protein are highly conserved amongvarious eukaryotes, the interaction between the nucleotideat position �3 and an eIF2a may be a commonmechanism for translation initiation.Although Kozak (25) reported that recognition of the
initiation codon was not augmented by a nucleotide atposition +5, other researchers suggested that +5A/C inmammals or +5C in plants affect the efficiency oftranslation initiation (26,27). Our analyses using variouseukaryotes (Figures 2 and 4) and highly expressed genes(Figure 5A and Table 2) suggest the importance of +5Cfor translation initiation. However, since the nucleotide atposition +5 determines the chemical properties of thesecond amino acid, it is also possible that this nucleotide isunder the functional constraint of the amino acidsequences (12). As regards the �2A/C signal, to ourknowledge, there has been no experimental data sugges-tive of its role in the initiation of translation.Although +4G has been described as important for
translation initiation in vertebrates and plants, the effectof +4G is relatively minor compared with that of �3A/G(21,24,25). Our study showed that the nucleotide appear-ing at position +4 is highly biased, but a preferrednucleotide is not common among all eukaryotes. Invertebrates and plants, G is preferred at this position,whereas in invertebrates, fungi and protists, T is generallypreferred. The biases of +4G in humans and +4U inS. cerevisiae were even more conspicuous when highlyexpressed genes were examined, suggesting the possibilitythat position +4 is involved in enhancing translationinitiation; however, the nucleotide at the position requiredfor effective translation initiation appear to be diversifiedamong eukaryotes.In the original scanning model, it was postulated that
translation is initiated from the first AUG codon in anmRNA (8). However, it has since been revealed that theactual mechanism of translation initiation is much morecomplicated than previously thought. It is known thatAUG trinucleotides referred to as upstream AUGs(uAUGs) are frequently observed in 50 UTRs, and thatshort open reading frames designated as upstream ORFs(uORFs) are often also present (28). It has been reportedthat �55% and �25% of mammalian genes have one ormore uAUGs and uORFs, respectively (29). These uAUGsand uORFs are apparently involved in the down-regulationof translation (30). Moreover, even if the first AUG codonis locatedwithin a context of a ‘Kozak consensus sequence’,translation is not necessarily initiated from it (31,32).Dresios et al. (33) suggested that a short element in a
Figure 3. Cluster dendrogram showing similarities between patterns ofnucleotide bias. The distance D was calculated from the gn values frompositions �9 to +6 (see Materials and Methods section). The groupaverage method was used for the construction of the clusterdendrogram. An asterisk (�) indicates a cluster that is conservedamong the dendrograms constructed by three different clusteringmethods (Figure S1).
Nucleic Acids Research, 2008, Vol. 36, No. 3 867

Figure 5. Several features of nucleotide bias around the initiation codon. (A) Nucleotide bias around the initiation codon for genes expressed at highand low levels in humans (left) and S. cerevisiae (right). The diagram for each species shown at the left is the same as that in Figure 2. The middleand right diagrams for each species were calculated by using the top 1000 genes with higher expression levels and the bottom 1000 genes with lowerexpression levels, respectively, in each species. (B) Three-base periodicity observed in humans (left) and Oryza sativa (right). Arrows indicate everythree bases. (C) U- and A-rich biases observed at positions around �40 and around �15, respectively, which are indicated by arrows. The gn valuesare shown from positions �100 to �1 for Xenopus laevis, Danio rerio, D. melanogaster and Anopheles gambiae.
Figure 4. Nucleotide biases around the initiation codon for each taxonomic group of eukaryotes. The gn value at each position for each nucleotidewas calculated from the average of on values and that of en values among all species belonging to a given taxonomic group. The number of speciesused is shown for each group. sp., species.
868 Nucleic Acids Research, 2008, Vol. 36, No. 3

eukaryotic mRNA directly base pairs with an 18S rRNA toenhance translation initiation, which is similar to theinteraction of the SD sequence with a 16S rRNA in aprokaryotic mRNA. It should be noted that the originalscanning model cannot account for these observations.
Our results are consistent with the previous assertionthat preferred sequences around the initiation codon varyamong different eukaryote species (Figure 2) (5,6).However, Figure 4 suggests that the sequences couldgenerally be decomposed into two distinct patterns, therepetition of GCC and that of A. To examine thispossibility in more detail, we compared the observed andexpected numbers of genes containing the sequencesGCCGCCAUG and AAAAAAAUG in several species(Table 3). The expected number was calculated based onthe assumption that an observed nucleotide at eachposition will appear in a manner independent of anucleotide at another position. The results clearlyshowed that the observed numbers are significantlylarger than the expected numbers for these sequences. Itis therefore suggested that the sequence GCCGCCAUGor AAAAAAAUG, and not a particular nucleotide ateach position, may play a role as a whole in translationinitiation. We further examined the existence of genescontaining a hexanucleotide sequence that is a mixtureof these two sequences (e.g. GAAACCAUG orACAGACAUG). We then found that such mixedsequences are significantly suppressed in genes(P< 0.01), while AAAAAAAUG and GCCGCCAUGare the most and the second most over-representedpatterns, respectively, among all hexanucleotide
sequences (Table 4). These observations support the ideathat there are two distinct patterns of signals fortranslation initiation.If we assume the presence of the two distinct patterns of
signals, then the variation in preferred sequences amongdifferent species could be accounted for by differences inthe relative contribution from each pattern. In vertebratesor Monocots, the signal of GCC repeats is relativelystrong, whereas in invertebrates or Dicots, the signal ofrepetition of A is more conspicuous. What, then,determines the relative contribution of each pattern tothe preferred sequence in a given species? One factor mightbe the GC content in the genome. Figure 6A shows theGC content in 50 UTRs and that in the whole genomesequences in 25 species with data for more than 3000genes. This figure suggests that these species can beclassified into two groups, i.e. GC-rich and AT-rich. Asshown in Figure 6B, a species belonging to the GC-richgroup shows a clear signal of GCC repeats, while anAT-rich species frequently exhibits very strong signals ofA. These distinct signals might be recognized by differentmolecular mechanisms. Kozak (34) herself pointed outthat the ‘Kozak consensus sequence’ is repetitious andthat the unit of recognition may be a three-base motif. Thethree-base periodicity observed in this study might help aribosome locate the correct reading frame. However, themechanisms for recognizing the abovementioned signalsremain unknown at this stage of research. Additionalexperimental studies will be required to gain a moreprecise understanding of the molecular mechanisms oftranslation initiation in eukaryotes.
SUPPLEMENTARY DATA
Supplementary Data are available at NAR Online.
Table 3. Observed and expected numbers of genes containing a
preferred sequence
H. sapiens C. elegans O. sativa A. thaliana
Pattern O E Z O E Z O E Z O E Z
GCCGCCAUG 79 16.7 15.3� 4 0.4 5.5� 262 44.6 32.6� 20 1.5 14.9�
AAAAAAAUG 13 2.7 6.3� 62 36.3 4.3� 33 2.8 17.9� 235 73.2 19.0�
O and E represent the observed and expected numbers of genes containinga given sequence, respectively. E was calculated under the assumptionthat each nucleotide at each position appears independently. Forexample, E for AAAAAAAUG in humans was calculated asNo
ð�6ÞA o
ð�5ÞA o
ð�4ÞA o
ð�3ÞA o
ð�2ÞA o
ð�1ÞA ¼ 9857� 0:215� 0:207� 0:251� 0:393�
0:295� 0:213 ¼ 2:7, whereN is the number of human genes with 50 UTRsthat are six or more bases long, and oA
(i) is the observed fraction of A atposition i. The deviation of O from E was evaluated by the Z-value(see Materials and Methods section). An asterisk indicates P< 10�4.
Table 4. Observed and expected numbers of genes that contain a
preferred sequence or a mixed sequence
Pattern O E Z Rank
AAAAAAAUG 1725 337.3 75.6 1GCCGCCAUG 841 113.5 68.3 2ACAGCAAUG 190 142.1 4.0 523AACACCAUG 242 215.6 1.8 1008GAAGCAAUG 158 139.6 1.6 1093GCAACAAUG 274 261.9 0.7 1398ACAACCAUG 225 240.4 �1.0 2302ACAGACAUG 146 162.9 �1.3 2473GCACAAAUG 54 69.1 �1.8 2718GCAAACAUG 261 300.2 �2.3 2946GACAACAUG 226 269.4 �2.6 3113GACACAAUG 185 234.9 �3.3 3345GAAACCAUG 186 236.3 �3.3 3349ACCACAAUG 185 239.0 �3.5 3438GAAGACAUG 115 160.1 �3.6 3465ACCAACAUG 204 274.0 �4.2 3655AACGCAAUG 72 127.4 �4.9 3788AACGACAUG 67 146.1 �6.5 3972GACGAAAUG 68 159.2 �7.2 4027ACCGAAAUG 50 162.0 �8.8 4075
These numbers were obtained from 219 496 genes in all of the 47species examined.
Table 2. Fractions (%) of �3A and +5G for genes expressed at high
and low levels
H. sapiens S. cerevisiae
All Top1000
Bottom1000
All Top1000
Bottom1000
�3A 39.3 46.3 36.8 58.2 72.2 46.0+5C 35.8 41.5 34.4 38.0 50.6 29.2
Nucleic Acids Research, 2008, Vol. 36, No. 3 869

ACKNOWLEDGEMENTS
We would like to thank Tadashi Imanishi, MotohikoTanino, Kaoru Mogushi, Takeshi Fukuhara, EmilioCampos, Takeshi Hase, Yutaka Fukuoka, TadashiMasuda, Soichi Ogishima, and Fengrong Ren for theirhelpful comments and discussion. Funding for this workwas provided by the Ministry of Education, Culture,Sports, Science and Technology of Japan, the GenomeInformation Integration Project of the Ministry ofEconomy, Trade and Industry of Japan, and the JapanBiological Informatics Consortium (17710162 to Y.N.).Funding to pay the Open Access publication charges forthis article was provided by Tokyo Medical and DentalUniversity.
Conflict of interest statement. None declared.
REFERENCES
1. Kozak,M. (1978) How do eucaryotic ribosomes select initiationregions in messenger RNA? Cell, 15, 1109–1123.
2. Kozak,M. (2002) Pushing the limits of the scanning mechanism forinitiation of translation. Gene, 299, 1–34.
3. Cavener,D. and Ray,S. (1991) Eukaryotic start and stop translationsites. Nucleic Acids Res., 19, 3185–3192.
4. Kozak,M. (1984) Compilation and analysis of sequences upstreamfrom the translational start site in eukaryotic mRNAs. NucleicAcids Res., 12, 857–872.
5. Kozak,M. (1987) An analysis of 50-noncoding sequencesfrom 699 vertebrate messenger RNAs. Nucleic Acids Res., 15,8125–8148.
6. Joshi,C., Zhou,H., Huang,X. and Chiang,V. (1997) Contextsequences of translation initiation codon in plants. Plant Mol. Biol.,35, 993–1001.
7. Kozak,M. (1986) Point mutations define a sequence flanking theAUG initiator codon that modulates translation by eukaryoticribosomes. Cell, 44, 283–292.
8. Kozak,M. (1999) Initiation of translation in prokaryotes andeukaryotes. Gene, 234, 187–208.
9. Cigan,A. and Donahue,T. (1987) Sequence and structural featuresassociated with translational initiator regions in yeast – a review.Gene, 59, 1–18.
10. Yun,D., Laz,T., Clements,J. and Sherman,F. (1996) mRNAsequences influencing translation and the selection of AUG initiatorcodons in the yeast Saccharomyces cerevisiae. Mol. Microbiol., 19,1225–1239.
11. Watanabe,H., Gojobori,T. and Miura,K. (1997) Bacterial featuresin the genome of Methanococcus jannaschii in terms of genecomposition and biased base composition in ORFs and theirsurrounding regions. Gene, 205, 7–18.
12. Niimura,Y., Terabe,M., Gojobori,T. and Miura,K. (2003)Comparative analysis of the base biases at the gene terminalportions in seven eukaryote genomes. Nucleic Acids Res., 31,5195–5201.
13. Imanishi,T., Itoh,T., Suzuki,Y., O’Donovan,C., Fukuchi,S.,Koyanagi,K., Barrero,R., Tamura,T., Yamaguchi-Kabata,Y. et al.(2004) Integrative annotation of 21,037 human genes validated byfull-length cDNA clones. PLoS Biol., 2, e162.
14. Wheeler,D., Barrett,T., Benson,D., Bryant,S., Canese,K.,Chetvernin,V., Church,D., DiCuccio,M., Edgar,R. et al. (2006)Database resources of the National Center for BiotechnologyInformation. Nucleic Acids Res., 34, D173–D180.
15. Tanino,M., Debily,M., Tamura,T., Hishiki,T., Ogasawara,O.,Murakawa,K., Kawamoto,S., Itoh,K., Watanabe,S. et al. (2005)The Human Anatomic Gene Expression Library (H-ANGEL),the H-Inv integrative display of human gene expression acrossdisparate technologies and platforms. Nucleic Acids Res., 33,D567–D572.
16. Holstege,F., Jennings,E., Wyrick,J., Lee,T., Hengartner,C.,Green,M., Golub,T., Lander,E. and Young,R. (1998)Dissecting the regulatory circuitry of a eukaryotic genome. Cell, 95,717–728.
17. Sokal,R.R. and Rohlf,F.J. (1993) Biometry, 3rd edn., 689–697.18. Mewes,H., Frishman,D., Mayer,K., Munsterkotter,M.,
Noubibou,O., Pagel,P., Rattei,T., Oesterheld,M., Ruepp,A. et al.(2006) MIPS: analysis and annotation of proteins from wholegenomes in 2005. Nucleic Acids Res., 34, D169–D172.
19. Hertz-Fowler,C., Peacock,C., Wood,V., Aslett,M., Kerhornou,A.,Mooney,P., Tivey,A., Berriman,M., Hall,N. et al. (2004) GeneDB:a resource for prokaryotic and eukaryotic organisms. Nucleic AcidsRes., 32, D339–D343.
20. Eichinger,L., Pachebat,J., Glockner,G., Rajandream,M.,Sucgang,R., Berriman,M., Song,J., Olsen,R., Szafranski,K. et al.(2005) The genome of the social amoeba Dictyostelium discoideum.Nature, 435, 43–57.
21. Lukaszewicz,M., Feuermann1,M., Jerouville,B., Stas,A. andBoutry,M. (2000) In vivo evaluation of the contextsequence of the translation initiation codon in plants. Plant Sci.,154, 89–98.
22. Kochetov,A. (2005) AUG codons at the beginning ofprotein coding sequences are frequent in eukaryoticmRNAs with a suboptimal start codon context. Bioinformatics, 21,837–840.
23. Pesole,G., Gissi,C., Grillo,G., Licciulli,F., Liuni,S. and Saccone,C.(2000) Analysis of oligonucleotide AUG start codon context ineukariotic mRNAs. Gene, 261, 85–91.
24. Pisarev,A., Kolupaeva,V., Pisareva,V., Merrick,W., Hellen,C. andPestova,T. (2006) Specific functional interactions of nucleotides atkey -3 and +4 positions flanking the initiation codon withcomponents of the mammalian 48S translation initiation complex.Genes Dev., 20, 624–636.
25. Kozak,M. (1997) Recognition of AUG and alternative initiatorcodons is augmented by G in position +4 but is not generallyaffected by the nucleotides in positions +5 and +6. EMBO J., 16,2482–2492.
Figure 6. Correlation between GC contents and nucleotide bias aroundthe initiation codon. (A) Horizontal and vertical axes represent the GCcontents in the whole genome and in the 50 UTRs, respectively. Allspecies with data for >3000 genes were used. These species can beclassified into two groups, i.e. GC-rich (yellow circle) and AT-rich(green circle). We used the genomic GC contents in X. laevis (35) andSchistosoma japonicum (14) for those in Xenopus tropicalis andSchistosoma mansoni, respectively, because the genome sequences ofX. laevis and S. japonicum are not available. The name of each speciesis represented by the initial letter of the generic name and the first threeletters of the specific name (Table 1). (B) Bias in nucleotide appearancearound the initiation codon for 13 GC-rich species and for 12 AT-richspecies. These diagrams were created in the same manner as those inFigure 4.
870 Nucleic Acids Research, 2008, Vol. 36, No. 3

26. Grunert,S. and Jackson,R. (1994) The immediate downstreamcodon strongly influences the efficiency of utilization of eukaryotictranslation initiation codons. EMBO J., 13, 3618–3630.
27. Sawant,S., Kiran,K., Singh,P. and Tuli,R. (2001) Sequence archi-tecture downstream of the initiator codon enhances gene expressionand protein stability in plants. Plant Physiol., 126, 1630–1636.
28. Morris,D. and Geballe,A. (2000) Upstream open readingframes as regulators of mRNA translation. Mol. Cell. Biol., 20,8635–8642.
29. Crowe,M., Wang,X. and Rothnagel,J. (2006) Evidence for con-servation and selection of upstream open reading frames suggestsprobable encoding of bioactive peptides. BMC Genomics, 7, 16.
30. Meijer,H. and Thomas,A. (2002) Control of eukaryotic proteinsynthesis by upstream open reading frames in the 50-untranslatedregion of an mRNA. Biochem. J., 367, 1–11.
31. Rogers,G.W., Edelman,G.M. and Mauro,V.P. (2004) Differentialutilization of upstream AUGs in the beta-secretase mRNA suggeststhat a shunting mechanism regulates translation. Proc. Natl Acad.Sci. USA, 101, 2794–2799.
32. Lammich,S., Schobel,S., Zimmer,A., Lichtenthaler,S. and Haass,C.(2004) Expression of the Alzheimer protease BACE1 is suppressedvia its 50-untranslated region. EMBO Rep., 5, 620–625.
33. Dresios,J., Chappell,S.A., Zhou,W. and Mauro,V.P. (2006) AnmRNA-rRNA base-pairing mechanism for translation initiation ineukaryotes. Nat. Struct. Mol. Biol., 13, 30–34.
34. Kozak,M. (1987) At least six nucleotides preceding the AUGinitiator codon enhance translation in mammalian cells. J. Mol.Biol., 196, 947–950.
35. Birney,E., Andrews,D., Caccamo,M., Chen,Y., Clarke,L.,Coates,G., Cox,T., Cunningham,F., Curwen,V. et al. (2006)Ensembl 2006. Nucleic Acids Res., 34, D556–D561.
36. Carninci,P., Kasukawa,T., Katayama,S., Gough,J., Frith,M.,Maeda,N., Oyama,R., Ravasi,T., Lenhard,B. et al. The
transcriptional landscape of the mammalian genome. Science, 309,1559–1563.
37. Gerhard,D., Wagner,L., Feingold,E., Shenmen,C., Grouse,L.,Schuler,G., Klein,S., Old,S., Rasooly,R. et al. (2004) The status,quality, and expansion of the NIH full-length cDNA project: theMammalian Gene Collection (MGC). Genome Res., 14, 2121–2127.
38. Morin,R., Chang,E., Petrescu,A., Liao,N., Griffith,M., Chow,W.,Kirkpatrick,R., Butterfield,Y., Young,A. et al. (2006) Sequencingand analysis of 10,967 full-length cDNA clones from Xenopus laevisand Xenopus tropicalis reveals post-tetraploidization transcriptomeremodeling. Genome Res., 16, 796–803.
39. Rasooly,R., Henken,D., Freeman,N., Tompkins,L., Badman,D.,Briggs,J. and Hewitt,A.T. and The National Institutes of HealthTrans-NIH Zebrafish Coordinating Committee (2003) Genetic andgenomic tools for zebrafish research: the NIH zebrafish initiative.Dev. Dyn., 228, 490–496.
40. Rhee,S., Beavis,W., Berardini,T., Chen,G., Dixon,D., Doyle,A.,Garcia-Hernandez,M., Huala,E., Lander,G. et al. (2003) TheArabidopsis Information Resource (TAIR): a model organismdatabase providing a centralized, curated gateway to Arabidopsisbiology, research materials and community. Nucleic Acids Res., 31,224–228.
41. Kikuchi,S., Satoh,K., Nagata,T., Kawagashira,N., Doi,K.,Kishimoto,N., Yazaki,J., Ishikawa,M., Yamada,H. et al. (2003)Collection, mapping, and annotation of over 28,000 cDNA clonesfrom japonica rice. Science, 301, 376–379.
42. Chisholm,R., Gaudet,P., Just,E., Pilcher,K., Fey,P., Merchant,S.and Kibbe,W. (2006) dictyBase, the model organism database forDictyostelium discoideum. Nucleic Acids Res., 34, D423–D427.
43. Matsuzaki,M., Misumi,O., Shin-i,T., Maruyama,S., Takahara,M.,Miyagishima,S., Mori,T., Nishida,K., Yagisawa,F. et al. (2004)Genome sequence of the ultrasmall unicellular red algaCyanidioschyzon merolae 10D. Nature, 428, 653–657.
Nucleic Acids Research, 2008, Vol. 36, No. 3 871