DESIGN AND OPERATION OF A LOW SPEED TEST TURBINE FACILITY
12
1 DESIGN AND OPERATION OF A LOW SPEED TEST TURBINE FACILITY B. Paradiso – P. Gaetani - A. Mora - V. Dossena – C. Osnaghi L. Arcangeli* - F. Gerbi* - N. Maceli*- R. Quadrelli° Laboratorio di Fluidodinamica delle Macchine- Dipartimento di Energia Politecnico di Milano, Milano, Italy http://www.lfm.polimi.it/ *GE Oil&Gas °Quest Firenze, Italy Firenze, Italy ABSTRACT In order to investigate in detail the performance of steam turbine stages the Low Speed Test rig at Politecnico di Milano has been adapted. As different designs are going to be compared, very accurate measurement system is required. In order to reduce the performance measurement uncertainty, both thermodynamic and mechanic approach, respectively based on total temperature drop and torque measurement, will be applied. The setup consists of a one and an half turbine stage with an inlet guide vane. The idea is to replicate the condition of a stage for different operating points and the IGV is therefore applied to simulate the presence of an upstream rotor while the second stator provides the downstream potential field at the stage exit. The rig operates in close loop condition and the air is delivered by a centrifugal fan with a maximum pressure ratio of about 1.3; the mass flow is then measured by a Venturi tube and after passing through a plenum and a cooler, enters in the turbine section. The turbine shaft drives a two-stage axial compressor, operating as a brake and equipped with two variable pitch guide vanes (VGV). The compressor allows for an additional pressure ratio, while the fine tuning of the power shaft rotational speed is provided by an electrical motor. The maximum rotational speed for this study is limited to 3000 rpm. Depending on the operation mode and stage setup a maximum expansion ratio of about 1.5 and a maximum mass flow around 15 kg/s can be reached. Two kind of experimental approaches are planned on the rig: the first denominated “performance” will be carried out by the OGTL department of GE Oil&Gas Florence, due to their consolidated experience in global measurements. At the same time, Politecnico di Milano will perform detailed inter-stage measurement with steady probes and time resolved fast response pressure probes. Details of both measurements will be given in this paper. The paper will conclude with the presentation of the operability of the rig obtained with the flange to flange global measurement acquired in the commissioning phase of the project. NOMENCLATURE C Venturi discharge coefficient CSP Cylindrical Spherical Probe d Venturi tube throat diameter 5HP Five Hole Probe FRAPP Fast Response Pressure Probe IGV Inlet Guide Vanes K Venturi Direct Calibration Coefficient LS Low Speed m Venturi tube mass flow Proceedings of 11 th European Conference on Turbomachinery Fluid dynamics & Thermodynamics ETC11, March 23-27, 2015, Madrid, Spain OPEN ACCESS Downloaded from www.euroturbo.eu Copyright © by the Authors
Transcript of DESIGN AND OPERATION OF A LOW SPEED TEST TURBINE FACILITY

1
DESIGN AND OPERATION OF A LOW SPEED TEST TURBINE FACILITY
B. Paradiso – P. Gaetani - A. Mora - V. Dossena – C. Osnaghi L. Arcangeli* - F. Gerbi* - N. Maceli*- R. Quadrelli°
Laboratorio di Fluidodinamica delle Macchine- Dipartimento di Energia
Politecnico di Milano, Milano, Italy http://www.lfm.polimi.it/
*GE Oil&Gas °Quest Firenze, Italy Firenze, Italy
ABSTRACT In order to investigate in detail the performance of steam turbine stages the Low Speed
Test rig at Politecnico di Milano has been adapted. As different designs are going to be compared, very accurate measurement system is required. In order to reduce the performance measurement uncertainty, both thermodynamic and mechanic approach, respectively based on total temperature drop and torque measurement, will be applied.
The setup consists of a one and an half turbine stage with an inlet guide vane. The idea is to replicate the condition of a stage for different operating points and the IGV is therefore applied to simulate the presence of an upstream rotor while the second stator provides the downstream potential field at the stage exit. The rig operates in close loop condition and the air is delivered by a centrifugal fan with a maximum pressure ratio of about 1.3; the mass flow is then measured by a Venturi tube and after passing through a plenum and a cooler, enters in the turbine section. The turbine shaft drives a two-stage axial compressor, operating as a brake and equipped with two variable pitch guide vanes (VGV). The compressor allows for an additional pressure ratio, while the fine tuning of the power shaft rotational speed is provided by an electrical motor. The maximum rotational speed for this study is limited to 3000 rpm. Depending on the operation mode and stage setup a maximum expansion ratio of about 1.5 and a maximum mass flow around 15 kg/s can be reached.
Two kind of experimental approaches are planned on the rig: the first denominated “performance” will be carried out by the OGTL department of GE Oil&Gas Florence, due to their consolidated experience in global measurements. At the same time, Politecnico di Milano will perform detailed inter-stage measurement with steady probes and time resolved fast response pressure probes. Details of both measurements will be given in this paper.
The paper will conclude with the presentation of the operability of the rig obtained with the flange to flange global measurement acquired in the commissioning phase of the project.
NOMENCLATURE C Venturi discharge coefficient CSP Cylindrical Spherical Probe d Venturi tube throat diameter 5HP Five Hole Probe FRAPP Fast Response Pressure Probe IGV Inlet Guide Vanes K Venturi Direct Calibration Coefficient LS Low Speed m Venturi tube mass flow
Proceedings of
11th European Conference on Turbomachinery Fluid dynamics & Thermodynamics
ETC11, March 23-27, 2015, Madrid, Spain
OPEN ACCESS
Downloaded from www.euroturbo.eu Copyright © by the Authors

2
P pressure PR pressure ratio q Venturi Nozzle mass flow Re Reynolds number SEC measurement section (1: first stator exit, 2: rotor exit, 3: second stator exit) T temperature U peripheral speed at midspan Vax axial speed at rotor exit ΔP Venturi tube inlet to throat pressure difference ε expansibility [expansion] factor β Venturi tube throat to inlet diameter ratio Φ flow coefficient (Vax/U) λ stage load factor (2*Torque Power /( m (U2)) Subscripts act actual c compressor fan centrifugal fan in Venturi tube inlet section loss rig pressure losses m,s measured in the throat section of sonic venturi throat Venturi tube throat t turbine
INTRODUCTION Efficiency is a key parameter in turbomachines, and aerodynamics of stages and seals is one of
the most important areas of development to design high efficiency steam and gas turbines and compressors.
Continuous improvement of computational capabilities allows the extensive use of CFD, during the whole aero design process (conceptual, preliminary and detailed). In the industrial environment, this results in greater complexity of the models, as more and more geometry details and physical models are included in the analysis. At the same time, as the equipment efficiencies increase and approach their entitlement, the accuracy and the sensitivity of the numerical models are more and more important.
In this scenario, on one side, the experimental facilities provide a crucial support to validate the physical models and the performance benefit obtained from newly developed features. On the other side, CFD tools are used to design the test facilities and to plan the test campaigns, so that the minimum number of configurations can be selected. These two aspects are equally important in order to save resources and reduce the development time for new components.
In terms of complexity of the test approach, different levels are available. The simplest one is probably the cascade test, which is traditionally used to verify airfoil profile losses (Song et al. 2004) and to tune correlations used for example in 1D numerical tools as specifically done for this profile in Bellucci et al. 2014.
However, cascade tests are not representative of real machine conditions, and of limited use when looking to other main source of losses, for example endwall losses.
The most exhaustive method to validate components (stages) is by instrumented test vehicles, i.e. by prototypes machines tested with real fluid at full speed and full load conditions, directly on site or in dedicated labs (Willey et al. 2000). Usually this kind of test represents the state of the art in terms of results, but the highest level in terms of test complexity (instrumentation to be integrated in real machines) and cost. For these reasons, prototype testing is restricted to limited cases, when a performance assessment is required, or when the reliability of a new technology must be demonstrated to a customer.

3
An intermediate level of complexity between cascade test and test vehicle is represented by air turbine configurations, where the most prototypical model of the actual stage geometry is assembled and air is used to feed the test section. There are clear advantages in using an air turbine test bed: better type and larger number of sensors can be installed, measurements are more accurate, the test conditions are more controllable and replicable, and last but not least, the costs are acceptable. Using an air turbine it is possible to measure with good accuracy the component efficiencies taking into account stator-rotor interaction, leakage and real geometry effects. For this reasons, test in air turbine still represents a key-screening tool, when different design options are available.
This kind of rigs are used to provide very detailed measurements to characterize flow field downstream vanes or rotors, to verify clocking effects, to study different types of seals or cavities shapes effects. Typical limits of this type of test is the low Reynolds number that can be reached due to the limits in terms of pressure and mass flow, the small temperature drop across the stage that makes very difficult the attempt of measuring stage efficiency through temperature difference measurements and the difference in the fluid operated by the turbine. However, air turbine cannot be used when the fluid properties are expected to have a relevant impact on the performance of the machine, as in the case of a condensing LP section or with HP stages for nuclear steam turbines.
The present test campaign concerns a low Mach stage for the HP section of a fossil steam turbine. Any effect due to the different compressibility of the air with respect to the steam is therefore expected negligible, as the Mach number remains below 0.4. Reynolds effect will be accounted for using the test data collected during the cascade campaign (Bellucci et al. 2014).
The test data are then collected in terms of non-dimensional parameters, mainly the stage load factor λ and flow coefficient Φ, to ensure that the performance assessment is done in terms of “reduced parameters” (Okapuu 1987).
This paper presents the design of a low speed air turbine test facility equipped with a steam turbine model in one and an half stage configuration where two different experimental set up are assembled: a traversing system for a detailed measurements of flow field downstream vanes and rotors and a set of rakes upstream and downstream the one and an half stage test section used to measure overall efficiency.
A detailed description of the test facility and the main characteristics of the two experimental set up will be presented.
EXPERIMENTAL SETUP In order to perform accurate performance measurements on the one and an half turbine stage the
LS test rig was adapted. A Venturi tube was designed, installed and calibrated in the rig. The test section was modified in order to allow a fully rotational measurement section. A great
effort was made to control the test model leakages. A set of conventional and advanced measurement techniques have been custom designed for the purposes of the research program.
The LS Test Rig Test facility consists of a subsonic closed loop wind tunnel for turbine stages. A scheme of the
facility is reported in Figure 1. The flow rate is provided by a variable rotational speed centrifugal fan (maximum power 500 kW) equipped with IGV and allowing a maximum capacity of 15 m3/s and a maximum compression ratio of 1.3. The test section can house up to two full turbine stages with a maximum blade height of 200 mm and a maximum tip radius of 890 mm. The turbine is braked by a two stage axial compressor equipped with IGV and variables stator vanes in order to increase the operational range. Compressor and turbine are installed on different shafts, connected through a high accuracy torque-meter. The maximum rotational speed of the system depends on the model under test: for this campaign it was limited at 3000 rpm. The rotational speed of the model is imposed by an 80 kW DC Motor coupled with the compressor shaft. This electric motor provides the additional (positive or negative) power for the fine tuning of the speed (see also Figure 2). The

4
extra compression ratio provided by the axial compressor allows a maximum expansion ratio up to 2.1 on the turbine section (PRt=PRc*PRfan-PRloss)
The air leaving the fan flows in the Venturi tube before entering the plenum upstream of the test section. At the exit of the plenum the flow rate passes through a series of honeycombs and bar grids in order to improve the uniformity; further downstream, the air is cooled down into a heat exchanger before entering in the machine with a strong acceleration realized with a reduction of the cross section. At the turbine inlet it was measured for the highest flow rate a peak to peak temperature difference of maximum 3° C.
The rig setting predictor tool To study the coupling between the rig and the turbine under test, a predictor tool was designed.
The algoritm it is based on the non-dimensional performance maps of the turbine, of the compressor and of the fan. For what concerns compressor and turbine, the functional curves are coupled in terms of rotational speed and mass flow rate, while the resulting match with the fan (mounted on an indipendent shaft) it is given by the mass flow rate and the pressure ratio.
The operating curve of the turbine, in terms of the pressure ratio, as a function of the non-dimensional mass flow rate, for different non-dimensional rotational speed and IGV angles, must be provided by the manufacturer or estimated by the tool. The tool is able to perform 1D calculations or it may use an in house, CFD based, throughflow code (Persico et al. 2011, Persico et al. 2012) to model the turbine behaviour. Flow angles and profile or secondary losses are introduced by classical correlations (for example Traupel and Craig-Cox for turbines or SP36 for compressors), derived by experiments (i.e. linear cascade tests) or evaluated using 2D CFD calculations (CFX).
The predictor tool starts the calculation from the inlet of the turbine stage under test, where the total pressure and temperature are imposed. For each rotational speed and for different operating points in terms of mass flow rate the code interpolates the turbine map and gives the outlet conditions and the actual turbine power. For the selected turbine operating points the code performs an interpolation of the compressor maps and it returns the compressor outlet thermodynamic conditions and the obsorbed compressor power.
The residual power (Pwt-Pwc) is absorbed or generated by the DC Motor, if less than 80 kW, otherwise the operating point is discarded.
The compressor output conditions are assumed at the inlet of the fan, which is simulated by the set of operating curves provided by the manufacturer and reduced in terms of non-dimensional curves. The output target of the fan simulation are the thermodinamic conditions at the turbine inlet.
Figure 1 – the LS Test Rig

5
The code provides the fan rotational speed and the corresponding absorbed power. If the output values are outside the fan limits the operating point it is discarded.
This tool has been designed as a part of this project and then validated using the first experimental results.
An example of the calculation at 2500 is reported in Figure 2 where every color represents a possible set of contemporary regulations required to obtain a specific operating point of the turbine, as predicted by the tool; in the same Figure some experimental points are also presented (stars). The lower curve in black represents the input for the experimental campaign, i.e. the turbine expected operating curve for a given rotational speed. In the upper part of the graph all the possible combinations of fan rotational speed (on the right) with the corresponding absorbed power (on the left) are reported. Moving toward the graph center, all the possible axial compressor IGV regulations are reported together with the expected compressor absorbed power. Moving further to the bottom the power consumption (>0)/contribution (<0) of the DC motor is also depicted. The last mentioned regulation represents one of the most limiting constrains of the rig functionality. A second limit is the compressor proper operation (avoidance of stall and surge) while a further condition is the maximum fan power consumption limited to 650 kW and its rotational speed limited to 2300 rpm.
The Venturi tube To provide accurate mass flow rate measurement a Venturi tube was installed in the loop. The
device has been designed according to the standard ISO 5167-4 and its geometry is consistent with the so called “as cast” design, characterized by a final uncertainty of the discharge coefficient C equal to 0.7%. However being this value too high for an accurate turbine efficiency characterization, the device has been calibrated by a Venturi nozzle (designed according to ISO
flow coefficent
Pow
er(k
W)
RP
Mv
-200
-100
0
100
200
300
400
-7000-6500-6000-5500-5000-4500-4000-3500-3000-2500-2000-1500-1000-50005001000150020002500
turbineWc - IGV=-30W_brake - IGV=-30Wc - IGV=-20W_brake - IGV=-20Wc - IGV=-10W_brake - IGV=-10Wc - IGV=0W_brake - IGV=0Wc - IGV=10W_brake - IGV=10Wc - IGV=20W_brake - IGV=20Wc - IGV=30W_brake - IGV=30Wc - IGV=40W_brake - IGV=40RPMv - IGV=-30RPMv - IGV=-20RPMv - IGV=-10RPMv - IGV=0RPMv - IGV=10RPMv - IGV=20RPMv - IGV=30RPMv - IGV=40
@RPM2500
0.05
igv= -30
turbine
rpm FAN-------------->
80 kW motorelectric power<---------------
compressor power<-----------------------
FAN power<---------------
igv= 40
Figure 2 - Predictor tool results for 2500 rpm, stars represents experimental validation points.
6
9300) operated in chocked condition and mounted in line with the Venturi tube; a final extended uncertainty of 0.33% in the whole operating range was achieved.
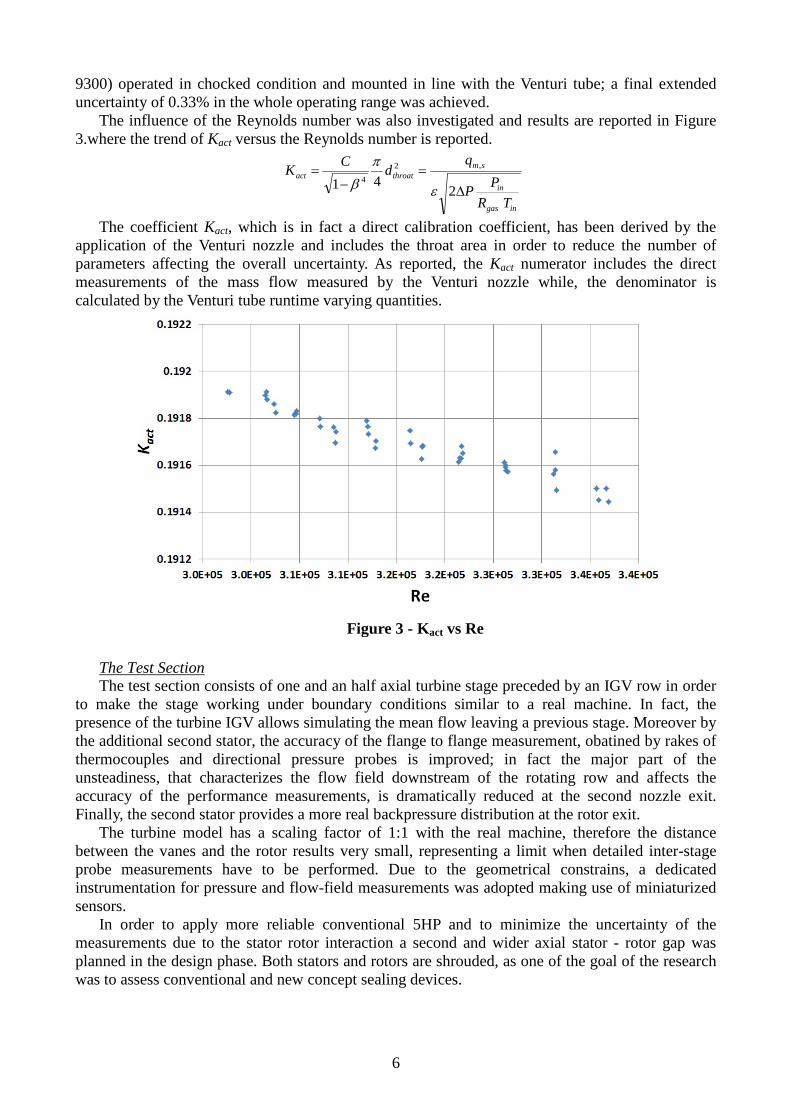
The influence of the Reynolds number was also investigated and results are reported in Figure 3.where the trend of Kact versus the Reynolds number is reported.
The coefficient Kact, which is in fact a direct calibration coefficient, has been derived by the application of the Venturi nozzle and includes the throat area in order to reduce the number of parameters affecting the overall uncertainty. As reported, the Kact numerator includes the direct measurements of the mass flow measured by the Venturi nozzle while, the denominator is calculated by the Venturi tube runtime varying quantities.
The Test Section The test section consists of one and an half axial turbine stage preceded by an IGV row in order
to make the stage working under boundary conditions similar to a real machine. In fact, the presence of the turbine IGV allows simulating the mean flow leaving a previous stage. Moreover by the additional second stator, the accuracy of the flange to flange measurement, obatined by rakes of thermocouples and directional pressure probes is improved; in fact the major part of the unsteadiness, that characterizes the flow field downstream of the rotating row and affects the accuracy of the performance measurements, is dramatically reduced at the second nozzle exit. Finally, the second stator provides a more real backpressure distribution at the rotor exit.
The turbine model has a scaling factor of 1:1 with the real machine, therefore the distance between the vanes and the rotor results very small, representing a limit when detailed inter-stage probe measurements have to be performed. Due to the geometrical constrains, a dedicated instrumentation for pressure and flow-field measurements was adopted making use of miniaturized sensors.
In order to apply more reliable conventional 5HP and to minimize the uncertainty of the measurements due to the stator rotor interaction a second and wider axial stator - rotor gap was planned in the design phase. Both stators and rotors are shrouded, as one of the goal of the research was to assess conventional and new concept sealing devices.
Figure 3 - Kact vs Re
ingas
in
smthroatact
TRPP
qdCK
∆=
−=
241
,2
4ε
πβ

7
The rotor shaft is mounted on three rolling bearings: a combination of two angular contact ball bearings for the axial thrust load in the front part of the shaft and a roller bearing for the radial load in the rear part are used. The bearing shields are carried by two rigid struts guiding the bearing force into the machine foundation.
The stator and the IGV, are mounted in-built with the inner part of the machine and not overhung to the casing, that has been designed as rotating. In this way it is possible to perform the tangential traversing of probes in different machine test sections simultaneously keeping the same IGV – stator 1 and stator 2 clocking position.
The rotation of the casing over 360 deg is obtained by a rotatable gear ring: this solution permits to investigate the flow field over the entire section. On the other side, this solution requires a very accurate study of the leakages in the machine. The leakage between the stator outer diameter and the casing is prevented with a special NBR gasket. Furthermore it was necessary to model the region between the rotor platform and the stator inner diameters. If the seals between the stator and the rotor have to be replicated a mass flow should be provided in this gap. So far, in the present design this feature is obtained by a circumferential slot placed on the hub surface at the stator inlet. The gap area was designed by CFD calculations and correlations in order to properly simulate the exact amount of leakage below the stator hub and its merging with the main flow in front of the rotor blades, as it occurs in real machine. Detailed measurements with miniaturized cobra probes are planned in this region and close to the tip in order to detect the leakage flow rate. The amount of leakage depends on the specific operating condition, and it is expected to be around 1% on the average. During the preliminary commissioning phase, the dimensional values of the gaps were verified. The second stator replicates the same design. Figure 4 shows the meridional section of the machine for the small gap configuration, and highlights the sealing flow path above described.
Performance measurements The scope of the measurements is the validation of the aero-thermodynamic performance of
axial turbine stages, in terms of global stage efficiency (also called “flange-to-flange”) in the whole operating range. Performance measurements are integrated by inter-stage measurements.
air in
air out
S S
R
ROTABLE CASING
CASING
IGV
Figure 4 – The Test Section

8
Acquisition setup The instrumentation applied by OGTL for the flange to flange measurement campaign is
essentially made up of stationary rake probes mounted on the casing. Each rake mounts six measurement points along the stem and, thanks to the possibility to rotate the casing of 360 deg, the entire section of the annular flow passage can be investigated.
As showed in Figure 4, rake probes are mounted in two sections: in each section 3 rakes of total temperature kiel sensors, one rake of total pressure kiel sensor and one rake of three hole probes are located. The total temperature readings are corrected taking into account the thermal conduction along the stem, which temperature is also monitored (Bianchini et al. 2012). The overall performance is then calculated on the basis of a mass flow rate averaging procedure. A total amount of 20 static pressure readings are also acquired on the two measurement sections. Overall, the system provides a total of 168 acquisition channels.
At the same time the torque provided by the turbine is directly measured by a torquemeter flanged between the turbine and the compressor shaft. The measured torque is then corrected to take into account the bearing losses and the friction on the wheel disk. The bearing losses are estimated using the data sheet provided by the bearing supplier: data include the effect of the bearing temperature and of the shaft speed. As for the effect of the friction on the wheel disk, a correlation was used (Nece et al. 1960). The overall effect is estimated to be lower than 0.5 points.
The results obtained by these experimental approaches allow the computation of the thermodynamics quantities averaged on the two measuring planes; by them the turbine characteristic operating range, in terms of work and flow coefficient can be calculated. Two values of the stage global performance are also deduced: the first one is derived from the work of the stage in terms of enthalpy drop and the second one from torque, rpm and flow rate measurements; in both cases the reference isentropic enthalpy drop is derived by the averaged thermodynamic quantities provided by the probes.
A detailed analysis of the uncertainty was also carried out by OGTL. In Table 1 the uncertainty for the main measured quantities are reported.
Quantity uncertainty 95% n° samples for a test point Total temperature 0.2 °C 86400 Total pressure 50 Pa 28800 Rake yaw angle <1.5 deg 28800 Mass flow 0.33% 10800 Torque 0.065% FS 10800
Table 1: performance measurement uncertainty
Measurement setup The final measurement setup is the result of the wide measurement campaign conducted in the
commissioning phase. In a preliminary measurement procedure it was planned a measurement grid over only three
vane pitches with a resolution of 10 points for each vane. Since the rakes tangential traversing is achieved by rotating the turbine casing and keeping the stators at a fixed position, and given the number of blades (about 90), for each vane row only a rotation of 12 deg was required.
Assuming a good spatial periodicity and a negligible temporal fluctuation of the stage boundary conditions, a proper resolution of the pitch-wise gradient together with a reasonable data statistic was expected. This choice was the tradeoff between the accuracy of the performance evaluation and the not marginal target - sought in the test campaigns - of measuring the entire machine performance curve in a single working day.
This acquisition approach was then validated, but unexpected results were observed. In fact, depending on the angular position of the rake traversing, differences between the two efficiency

9
values were found. To overcome this problem, the entire inlet and outlet flow field was measured by rotating the casing over 360 deg. This is possible thanks to the rig ability to keep the same operating conditions during the entire test.
The test was conducted by keeping the same spatial resolution of the preliminary data acquisition setup (10 point for stator pitch) over the whole rotation with a measuring grid over 360 deg for an amount of 860 acquisition points. Results evidenced an important distortion of the boundary condition in the region of the bearing struts. The effect of this geometric constraint resulted to be underestimated during the design phase. The obvious conclusion was that to perform global performance experimental studies, a complete knowledge of the flow field over the whole upstream and downstream section is necessary.
As this requirement can be fulfilled in the present rig, a new measurements procedure has been chosen consisting of 90 tangential position over 360 deg. This represents the best tradeoff between data acquisition duration and spatial sampling. The selected pitch-wise grid was designed in order to place all measurement points in different positions with respect to the vane pitch. The final reconstruction in term of averaged pitch-wise flow field distribution, allows capturing the spatial gradients imposed by the vanes, such as wakes and secondary flow structures. The results highlighted a good agreement with the reference acquisition grid characterized by a circumferential definition of 1 deg over the whole measurement sections.
Inter-stage measurements Besides the flange to flange global measurement, to improve the understanding of the machine
fluid dynamic features, detailed inter-stage data acquisition are requested. Due to the two different axial gaps tested, distinct traversing setups have been designed.
Referring to the small gap configuration (Figure 5a) in section 1 a virtual 4 hole cylindrical-spherical probe (CSP) was used, in section 2 the same probe with an additional integrated thermocouple was applied while in section 3, where the geometrical constraints are different, the measurement are performed with a conventional five hole probe (5HP).
For the large axial gap configuration (Figure 5b) it was possible to install a five hole probe instead of the CSP in section 1.
The Cylindrical-Spherical Probe Since the turbine tested presents a high aspect ratio and a great number of blades, it is therefore
necessary to reduce the blockage induced by the probes in the channel. To match this requirement, in section 2 a five hole probe with a 30 mm over-hung head was applied, while in in SEC1 (and in SEC2 for the small gap configuration) a miniaturized pressure probe with a hemispherical shape
Figure 5a (left) small gap and large gap 5b (right) configurations
CSP CSP+T 5HP 5HP CSP+T 5HP
SEC
1
SEC
2
SEC
3
SEC
1
SEC
2
SEC
3

10
Figure 6 – The CSP probe head
sensor element was designed and built. Figure 6 shows the geometry of the CSP head: the
probe presents two radial pressure taps on the hemispherical cap and it is an evolution of a previous cylindrical probe with one hole designed for fast response measurements (Persico et al. 2012). In the present application, the probe was designed for steady measurement and therefore it was possible to minimize the probe head up to the fluid-dynamic limit of a hemispherical geometry. The limit is represented by the ratio between the head curvature and the holes diameter both imposed by the manufacture process.
One hole lies with its axis on the equatorial plane while the second hole, inclined by 30 deg with respect to the equatorial plane and located on the hemispherical cap, provides the additional sensitivity to the pitch angle and hence allows for the complete 3D resolution of the flow-field. The cylindrical tap and the hemispherical tap are located in the same circumferential position.
During the design process, a new algorithm for the flow reconstruction has been developed; the algorithm allows the decoupling between the velocity angles and the pressure field resolution and provides a normalization of the pressure readings during the rotation of the probe with the local Mach number for the three rotation chosen for the “virtual four hole probe” reconstruction. Moreover the establishment of a new normalization process of the quantities measured during the calibration process, allowed a substantial improvement in the accuracy and in the application of the probe calibration coefficients. In Figure 7 the errors of the probe for a Mach = 0.4 are reported. The total and static pressure error are normalized on the kinetic head
The Cylindrical-Spherical Probe with thermocouple To get a full stage data set in terms of flow coefficient and work coefficients, a temperature
measurement is required in SEC2. For this purpose, a thermocouple was integrated into the hemispherical probe (CSP+T in figure 5). It has to be remarked that the performance measurements
Figure 7 – CSP errors at Mach = 0.4
-3.00
-2.00
-6.00
-1.00
-1.00-1.00
-4.00
-1.00
0.00
0.00
0.00
0.00
0.00 0.00
0.00
0.00
0.00 0.00
-3.50 0.000.00
0.00
0.00 0.00
0.00
0.00
1.00
yaw
pitc
h
-20 -10 0 10 20
-10
-5
0
5
10
static pressure error * 100
-9.00-7.50-8.00
-1.0
0
-5.00
-1.00 -1.00
-1.00
0.00
0.00
0.000.00
0.00 0.00
0.00
0.00
1.00
1.002.00
yaw
pitc
h
-20 -10 0 10 20
-10
-5
0
5
10
total pressure error * 100
-0.20-0.20
0.00
0.00
0.000.00
0.00
0.00
0.00
0.000.00
0.00
0.00
0.000 00
0.00
0.000.00 0.00
0.00
0.00
0.00 0.00 0 00
0.00
0.000.20 0.20
yaw
pitc
h
-20 -10 0 10 20
-10
-5
0
5
10
yaw angle error
-0.50
0.50 -0.50
-0.50-0.50
-0.50
0.10
0.10
0.10
0.100.10
0.100.100.10
0.50
0.10 0.10
0.10 0.10
0.10
0.700.70
5.206.10
yaw
pitc
h
-20 -10 0 10 20
-10
-5
0
5
10
pitch angle error

11
over the 360 deg and the inter-stage probe acquisitions are performed in two successive instants due to the different required measurement grid. The operating condition is always matched by keeping constant the work coefficient λ by means of the instantaneous torquemeter measurement. All global results are then correlated with the value of λ. The λ value can be computed on the basis of both torquemeter and thermodynamic measurements. In a second step, once the inter stage measurements are available, the λ vs Φ curve can be exactly defined. The turbine power vs λ, obtained by global flange to flange measurements and the λ vs Φ are reported In Figure 8a and Figure 8b respectively.
The fast response pressure probe At a later stage of the project phase-resolved pressure measurements are also planned in section
2. To reduce the blockage effects, the miniaturized cylindrical pressure probe (FRAPP) developed at Politecnico di Milano is applied. The probe aerodynamic accuracy was evaluated in a calibrated nozzle, resulting in an extended uncertainty equal to ±0.5% of the dynamic head for the pressure measurements and equal to ±0.3° for the flow angle. Specific tests showed that the pressure reading of the probe is insensitive to the pitch flow angles in the range ±10 deg. The transfer function of the line-cavity system connecting the external environment to the pressure sensor was determined by means of tests in a low-pressure shock tube (Persico et al., 2005). The probe bandwidth is up to 50 kHz. In the test rig application the instantaneous pressure signal is acquired at 1 MHz for one second, to achieve good statistical reliability. The raw pressure data are phase-locked and then phase-averaged to obtain 42 intervals on a single rotor blade passing period, corresponding to a physical sample rate of about 120 kHz. An estimation of the turbulence will be also proposed using the methodology presented in Lengani et al. 2012.
CONCLUSIONS In order to perform detailed steady and phase locked flow field measurement and together with
flange to flange accurate performance measurements, the close loop Low Speed test rig at Politecnico di Milano was adapted. Two different approaches for the evaluation of the turbine performance have been described: a first one is based on thermodynamic measurements and a second one on turbine torque direct measurement. During the commissioning phase of the project, the influence of the traversing grid was evaluated and a measurement grid over the entire flow section was found to provide the best results in terms of comparison between the two approaches. The operability of the rig in terms of flow coefficient was estimated using a predictor tool which reliability was confirmed by several tests. The repeatability of all the performed measurements
Figure 8a (left) Turbine power vs lambda and 8b (right) phi vs lambda @2000 rpm

12
resulted within the expected uncertainty band of not additional errors due to the variability of the rig boundary conditions in time and in space were found.
At the meantime, dedicated instrumentation for the detailed measurement of the inter-stage flow-field was developed and applied in the rig.
At the end of the commissioning all the objective of the preliminary measurement campaign were positively achieved. After the validation of the measurement setup, rig operability and operating procedure, tests proficiently started with the characterization of the first turbine stage.
ACKNOWLEDGEMENTS The present research was carried out in the framework of a joint activity involving both industry
and university members. The authors acknowledge all the staff of the Laboratorio di Fluidodinamica delle Macchine in particular Ing. A. Fusetti and C. Deponti for the great help during the setup of the rig. The authors also thank GE Oil&Gas for permission to publish this work.
REFERENCES Bellucci J., Rubechini F., Marconcini M., Arnone A., Arcangeli L., Maceli N., Dossena V., “The
Influence of Roughness on a High-Pressure Steam Turbine Stage: An Experimental and Numerical Study”, J. Eng. Gas Turbines Power. 2014; 137(1):012602-012602-9.
Bianchini A., Ferrara G., Ferrari L., Ballarini V., Bianchi L., Tapinassi L., Toni L., “Effects Due to the Temperature Measurement Section on the Performance Estimation of a Centrifugal Compressor Stage”, J. Eng. Gas Turbines Power. 2012; 134(3):032402-032402-8.
Lengani, D., Paradiso, B., Marn, A., “A method for the determination of turbulence intensity by means of a fast response pressure probe and its application in a LP turbine”, Journal of Thermal Science, Volume 21, Issue 1, February 2012, Pages 21-31.
Nece, R. E., Daily, J. W., “Chamber Dimension Effects on Induced Flow and Frictional Resistance of Enclosed Rotating Disks”, ASME J. Fluids Eng., 1960; 82(1): 217-230.
Okapuu, U. , “Aerodynamic testing of small turbines”, VKI Lecture Series: Small High Pressure Ratio Turbines, 1987.
Persico G., Gaetani P., Guardone A., 2005, “Design and analysis of new concept fast-response pressure probes”, Meas. Sci. Technol., Vol. 16, pp. 1741-1750.
Persico, G., Rebay, S., and Osnaghi, C., 2011, “A Novel Package for Turbomachinery Throughflow Analysis”. Proceedings of the 9th European Turbomachinery.
Persico G., Mora A., Gaetani P., Savini M., "Unsteady Aerodynamics of a Low Aspect Ratio Turbine Stage: Modeling Issues and Flow Physics", 2012, ASME Journal of Turbomachinery, Vol. 134, Issue 6 (November), 061030 (10 pages).
Persico, G., and Rebay, S., 2012, “A Penalty Formulation for the Throughflow Modeling of Turbomachinery,” Computers and Fluids, Vol. 60, pp. 86–98.
Song B., Wing F., Cotroneo J., Hofer D.C., Siden G., “Aerodynamic Design and Testing of Three Low Solidity Steam Turbine Nozzle Cascades”, J. Turbomach. 2004; 129,(1):62-71.
Willey L.D. , Maughan J.R., Hill M.J., Walsh D.J., New Steam Turbine Test Vehicle for the Verification of Improved Efficiency Power Generation Steam Turbines, ASME IMECE 2000, Orlando, Florida, 2000.