De ontwikkeling van een beoordelingssysteem voor het beoordelen
43
ix ABSTRACT Air traffic delay is not only a source of inconvenience to the aviation passenger, but also a major deterrent to the optimisation of airport utility, especially in the developing countries. Many developing countries do less to abate this otherwise seemingly invincible constraint to development. The overall objective of this study was to investigate the dynamics of air traffic delays and to develop stochastic optimisation models that mitigate delays and facilitate efficient air traffic management. Aviation and meteorological data sources at Entebbe International Airport for the period 2004 to 2008 on daily basis were used for exploratory data analysis, modelling and simulation purposes. Exploratory data analysis involved logistic modeling for which post-logistic model analysis estimated the average probability of departure delay to be 49 percent while that for arrival delay was 36 percent. These computations were based on a delay threshold level at 60 percent which had more representative significant number of predicators of nine and ten for departure and arrival respectively. The proportion of the number of aircrafts that delay was established to follow an autoregressive integrated moving average, ARIMA (1,1,1) time series. The stochastic frontier model estimated the average inefficiencies of aircraft operations over the period to be 15 percent and 20 percent at departure and arrival respectively. Three stochastic optimisation models were developed to create a relationship between the airport utility and the proportions of delay. The three models measure airport utility at aircraft departures, at aircraft arrivals and the third one for aggregated aircraft departures and arrivals. In this formulation, the proportion of aircraft delay was treated as a plummeting element of the airport utility. Stochastic frontier model inefficiency estimates and the post-logistic delay probability estimates were used as inputs into the stochastic optimisation models to enforce the models’ theoretical underpinning. Model sensitivity analysis adduced that the utility level for a given time period at the airport with higher levels of inefficiency was less than the utility level with lower levels of inefficiency. Furthermore, lower estimates of probabilities for departure and arrival delay resulted into a lower operational utility level of the airport. Further analysis suggested that at this airport, proportion of daily delay is greater for aircraft departures than during arrivals. Thus to maximise airport utility over a time period, measures have to be developed to improve overall timeliness of aircraft operations so as to attract accelerated sustainable development. Therefore, more investments are required in human resources, equipment and automatic weather monitoring systems in order to reduce on the likelihood of aircraft delay and the related technical inefficiency parameters. Keywords: Arrival delay, departure delay, proportions, stochastic optimisation models
Transcript of De ontwikkeling van een beoordelingssysteem voor het beoordelen

ix
ABSTRACT
Air traffic delay is not only a source of inconvenience to the aviation passenger, but also a major
deterrent to the optimisation of airport utility, especially in the developing countries. Many
developing countries do less to abate this otherwise seemingly invincible constraint to
development. The overall objective of this study was to investigate the dynamics of air traffic
delays and to develop stochastic optimisation models that mitigate delays and facilitate efficient
air traffic management.
Aviation and meteorological data sources at Entebbe International Airport for the period 2004 to
2008 on daily basis were used for exploratory data analysis, modelling and simulation purposes.
Exploratory data analysis involved logistic modeling for which post-logistic model analysis
estimated the average probability of departure delay to be 49 percent while that for arrival delay
was 36 percent. These computations were based on a delay threshold level at 60 percent which
had more representative significant number of predicators of nine and ten for departure and
arrival respectively. The proportion of the number of aircrafts that delay was established to
follow an autoregressive integrated moving average, ARIMA (1,1,1) time series.
The stochastic frontier model estimated the average inefficiencies of aircraft operations over the
period to be 15 percent and 20 percent at departure and arrival respectively. Three stochastic
optimisation models were developed to create a relationship between the airport utility and the
proportions of delay. The three models measure airport utility at aircraft departures, at aircraft
arrivals and the third one for aggregated aircraft departures and arrivals. In this formulation, the
proportion of aircraft delay was treated as a plummeting element of the airport utility. Stochastic
frontier model inefficiency estimates and the post-logistic delay probability estimates were used
as inputs into the stochastic optimisation models to enforce the models’ theoretical underpinning.
Model sensitivity analysis adduced that the utility level for a given time period at the airport with
higher levels of inefficiency was less than the utility level with lower levels of inefficiency.
Furthermore, lower estimates of probabilities for departure and arrival delay resulted into a lower
operational utility level of the airport. Further analysis suggested that at this airport, proportion
of daily delay is greater for aircraft departures than during arrivals. Thus to maximise airport
utility over a time period, measures have to be developed to improve overall timeliness of
aircraft operations so as to attract accelerated sustainable development. Therefore, more
investments are required in human resources, equipment and automatic weather monitoring
systems in order to reduce on the likelihood of aircraft delay and the related technical
inefficiency parameters.
Keywords: Arrival delay, departure delay, proportions, stochastic optimisation models
x
Table of Contents
ABSTRACT .................................................................................................................................................................ix
CHAPTER ONE ............................................................................................................................................................ 1
INTRODUCTION ......................................................................................................................................................... 1
1.1 Background to the Study .............................................................................................................................. 1
1.2 Motivation for the Study .............................................................................................................................. 9
1.3 Problem Statement ..................................................................................................................................... 10
1.4 Research Objectives ................................................................................................................................... 11
1.5 Research Questions .................................................................................................................................... 11
1.6 Significance of the Study ........................................................................................................................... 12
1.7 Delimitations of the study .......................................................................................................................... 13
1.8 Limitations of the study ............................................................................................................................. 13
1.9 Ethics .......................................................................................................................................................... 14
1.10 Structure of the Thesis ............................................................................................................................... 14
CHAPTER THREE ..................................................................................................................................................... 43
METHODOLOGY ...................................................................................................................................................... 43
3.1 Data Description: Sources and Preparation ................................................................................................ 43
3.1.1 Aviation Data Logs .................................................................................................................................... 43
3.1.2 Meteorological Data Logs .......................................................................................................................... 44
3.2 Data Management and Analysis ................................................................................................................. 47
3.2.1 Data Systems Design and Modeling .......................................................................................................... 48
3.2.2 Logistic Modelling ..................................................................................................................................... 51
3.2.3 The ARIMA Stochastic Process of Aircraft Delay .................................................................................... 53
3.2.4 Aircraft Delay Stochastic Frontier modeling ............................................................................................. 56
3.3 Aircraft Delay Stochastic Optimisation Model .......................................................................................... 62
3.3.1 Underlying Principle to Model Development ............................................................................................ 62
3.3.2 Aircraft Delay by Two or More Processes ................................................................................................. 63
3.3.3 Model Notation .......................................................................................................................................... 64
3.3.4 Decision Variables ..................................................................................................................................... 65
3.3.5 Auxiliary variables ..................................................................................................................................... 65
3.3.6 R Statistical Computing Language ............................................................................................................. 66
3.3.7 The C# Programming Language ................................................................................................................ 66
3.4 Ethics .......................................................................................................................................................... 67
3.5 Limitations ................................................................................................................................................. 67
1
CHAPTER ONE
INTRODUCTION
In this chapter, a discussion of the background to the study is made from which the motivation
and problem statement are derived. Consequently, the objectives of the study are stated
including its scope. However, it is important to note that achievement of millennium
development goals, MDGs, especially for the developing countries relies entirely on the extent to
which global partnership is developed and sustained. Sustainability of the global partnership,
MDG eight of the UN declaration in the year 2000 cannot be successful if infrastructural
development in the partnering states is still under-developed. About 50 percent of the annual
financial budgets in the developing countries especially in Africa are funded by the developed
countries in form of financial and in-kind funding. The continued level of inefficiency in the air
transport sector especially in Uganda has created the need for more robust solutions in averting
the situation through developing appropriate approaches to abate the inefficiency in order to
promote a sustainable global partnership by the year 2015 according to the MFPED & UNDP
(2003), (2007); UN Devinfo Team (2009) .
1.1 Background to the Study
Air traffic has greatly increased over the last decade and is predicted to continue to increase at a
rate of 15 to 20 percent over the next decade Civil Aviation Authority (2007) . This great
increase in air traffic relates to an increase in the demand for airport and airspace resources.
Unfortunately, airspace and airport capacities in Africa region as a whole and in particular
Uganda are not increasing at a rate adequate to meet its rising demand. It is vital that new
methodologies and tools be developed to address the inevitable likely effects associated with
2
general high traffic rates as recommended Kakooza et al. (2005) for road traffic flow
management. Given this tendency in air traffic flow and the ever growing demand for aviation
services in the country, there is need to develop tools that optimise the available resources so as
to edge towards effective air traffic flow management.
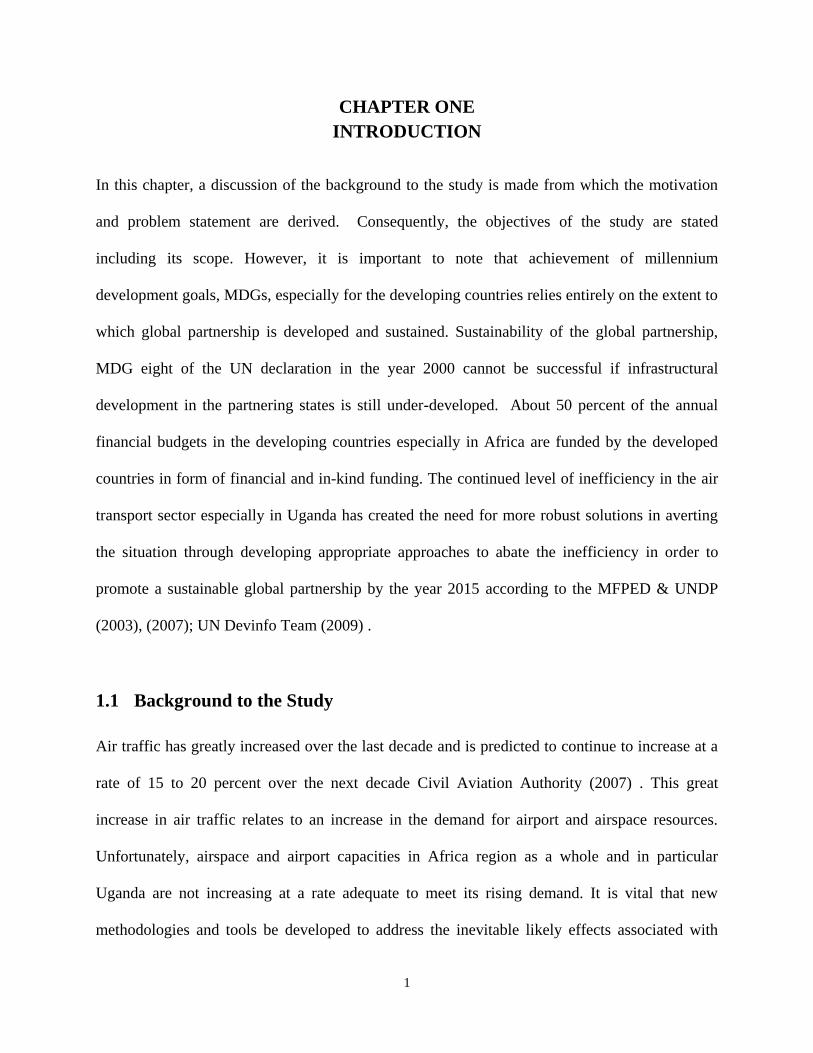
Figure 1.1 Map of Uganda showing the location of Entebbe International Airport1
1 Map of Uganda, Courtesy of Google Imagery as at the 25th October, 2009

3
Figure 1.1 is the map of Uganda showing the location of Entebbe International Airport. Uganda
is a landlocked country, bordered by Sudan to the North, Democratic Republic of Congo to the
west, Rwanda and Tanzania to the south, Kenya in the East. The country lies astride the equator
between latitudes 4 degrees 0’ North and 1 degree 30’ south of the equator and longitudes 30
degrees 0’ and 35 degrees 0’ east of the Greenwich, covering an area of 242,554 square
kilometres. Kampala, the capital city is built on twenty hills. The airport is located at Entebbe on
the shores of Lake Victoria 32 km from Kampala city centre. The Civil Aviation Authority
(CAA), in partnership with Government is mandated to manage Entebbe International Airport
including the thirteen airfields in the country. Given that the five East African countries of
Kenya, Tanzania, Uganda, Rwanda and Burundi are in the process of establishing a federation, it
is expected that there will be even more increased air traffic flow causing a surge in air traffic at
Entebbe International Airport.
Figure 1.2 shows an aerial view of the exact location of Entebbe International Airport. It is
clearly evident that the airport is surrounded by Lake Victoria. There are two runways namely;
runway 12/30 (2,408 metres) and runway 17/35 (3,658m). However, only runway 17/35 is
operational because it has the Instrument Landing System (ILS). The ILS refers to a ground-
based instrument approach system that provides precision guidance to an aircraft approaching
and landing on a runway, using a combination of radio signals and, in many cases, high-intensity
lighting arrays to enable a safe landing during instrument meteorological conditions (IMC), such
as low ceilings or reduced visibility due to fog or rain.

4
Figure 1.2 Aerial view of the location of Entebbe International Airport2
At present, sixteen international airlines have scheduled operations to and from Entebbe
International Airport, serving fourteen different destinations. The airlines also offer connection
to the rest of the world. Uganda's geographical location in the heart of Africa, has given Entebbe
International Airport greater advantage for hub and spoke operations in the Eastern and Southern
2 Location of Entebbe International Airport, courtesy of Google Imagery as at the 25th October,
2009

5
African region according to the website of civil aviation authority of Uganda website Air
Operations (2007) accessed on the 25th
October, 2007.
During instances of capacity-demand imbalances, air traffic management (ATM) in achieving
efficiency and safety is of prime importance as noted by Brooker (2005) . Any given airspace is
composed of flight paths, control facilities, sectors and airports. The overall goal of traffic flow
management, TFM, is to strategically plan and manage entire flows of air traffic, provide the
greatest and most equitable access to airspace resources, mitigate congestion effects from severe
weather and ensure the overall efficiency of the system without compromising safety. In the
United States' National Airspace System (NAS), for example, there are 21,000 daily commercial
flights that are monitored and controlled by 21 Air Route Traffic Control Centers (ARTCCs),
462 airport towers and 197 Terminal Radar Approach Control Facilities (TRACONs). The entire
United States airspace is monitored by a central Federal Administration Agency (FAA) facility
known as the Air Traffic Control System Command Center (ATCSCC) located in Herndon,
Virginia. Therefore, a fundamental capability of all TFM centers globally is the ability to
monitor airspace for potential capacity-demand imbalances.
It is also demonstrated at Oliver Tambo International Airport, one of the busiest airports in
Africa located at Johannesburg, South Africa, see Figure 1.3. The airspace capacity demand
imbalance although constantly monitored by the Air Traffic Control System, at certain times
requires human intervention. However, in order to facilitate the human input, sufficient and
timely statistical information has to be availed.
6
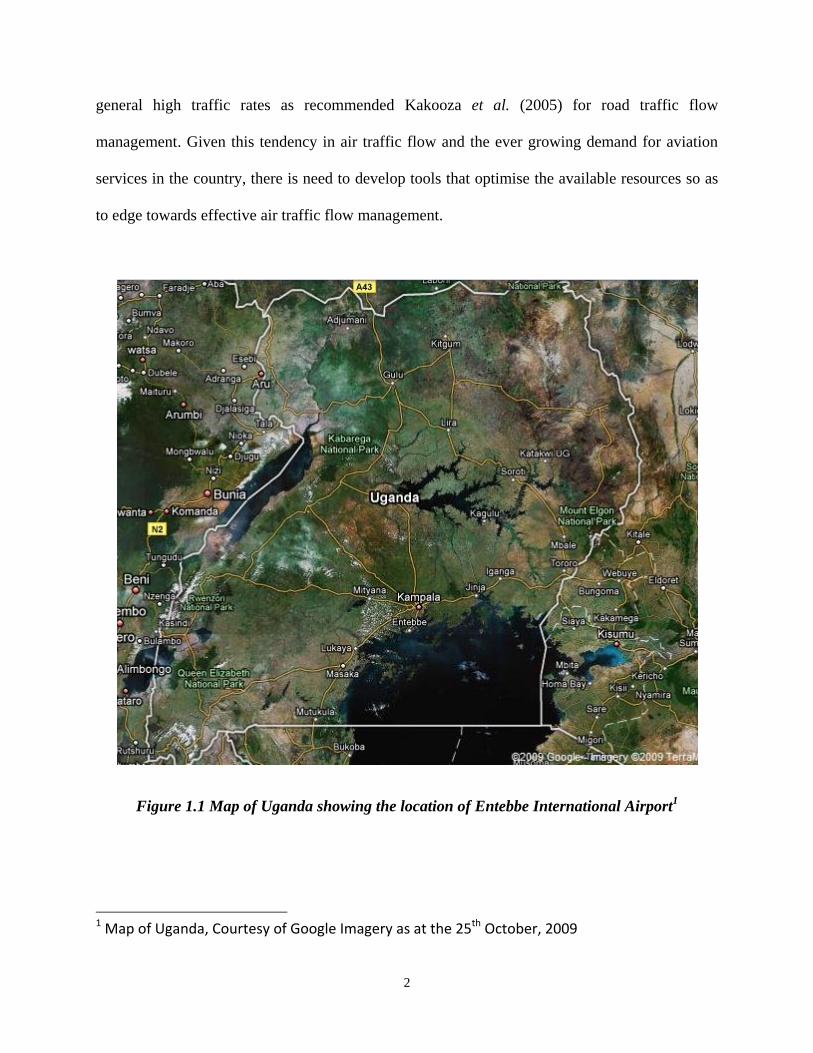
Figure 1.3 Aircrafts at an airport waiting to depart at their scheduled time3
The traffic flow management problem (TFMP) can be defined as managing traffic flow during
capacity-demand imbalances. As observed by Hansen (2004) , the TFMP has become
increasingly more important and difficult as the amount of air traffic has increased. Thus, the
seriousness of this problem has resulted into a steady increase in delays. Ground holding
procedures are a principal tool used to address TFMP. The two main ground holding procedures
employed are ground stops and ground delay programs (GDPs). A ground stop is an extreme
FAA initiative taken when arrival capacity drastically drops suddenly or when it is greatly
underestimated. In a ground stop, flights are held on the ground at their airports until it is
determined that the capacity-demand imbalance has abated.
3 Photograph taken at OR Tambo International Airport, Johannesburg, South Africa, Courtesy of
South African Civil Aviation Authority

7
Collaborative Decision Making (CDM), now known as Collaborative Traffic Flow Management
(CTFM), was motivated by a need for increased information sharing and distributed decision-
making Hoffman R et al. (1999) . They further noted a desirable shift from a central planning
paradigm to a collaborative TFM paradigm in which airlines, through their airline operational
control centers (AOCs), would have more control, flexibility and input into the air traffic flow
management decision-making processes. The philosophy of CDM is that with increased data
exchange and collaboration comes better and more effective decisions on the part of the traffic
flow managers. Collaborative decision making goes hand-in-hand with the air traffic control,
ATC concept of Free Flight Architecture (FFA) in which more responsibility for flight
maneuvering and aircraft separation is given to the aircraft and pilot.
Figure 1.2: Departure delay due to equipment
failure4
Figure 1.3 Arrival delay due to adverse weather5
4 The photography was taken at Entebbe International Airport, courtesy of CAA Uganda. 5 The photography was taken by the researcher in sky between South African and Uganda.

8
Air traffic delays are broadly categorized as terminal or en route delays as shown in Figure 1.2
and Figure 1.3 respectively. Terminal delays are incurred as a result of conditions at the
departure or arrival airport, and are charged to the appropriate airport. En route delays occur
when an aircraft incurs airborne delays of 15 minutes or more as a result of an initiative imposed
by a facility to manage traffic. The delays are recorded by the facility where the delay occurred
and charged to the facility that imposed the restriction.
The study was guided by five general impacting conditions to air traffic flow management
Bauerle N. et al. (2007) namely:
i. Weather: the presence of adverse weather conditions affecting operations. This includes
wind, rain, snow/ice, low cloud ceilings, low visibility, and tornado/
hurricane/thunderstorm.
ii. Equipment: an equipment failure or outage causing reduced capacity. Equipment failures
are identified as to whether they are FAA or non-FAA equipment, and whether the
outage was scheduled or unscheduled.
iii. Runway/Taxiway: reductions in facility capacity due to runway or taxiway closure or
configuration changes.
iv. Traffic Management Initiatives (TMI): national or local traffic management imposed
initiatives, including ground stops/delays, departure/en route spacing, fuel advisory,
mile/minutes in trail, arrival programs, and airport volume.
v. Other: emergency conditions or other special non-recurring activities such as an air show,
VIP movement or radio interference. International delays are also included in this
category.

9
1.2 Motivation for the Study
No research has so far been done about air traffic delay at Entebbe International Airport and
none has so far published about the same subject at airports in the Southern and Eastern Africa
region. It was therefore found incumbent upon the researcher first to assess the extent of air
traffic delays. In the process, it was further established that more revelations would be made if an
in-depth assessment of delay was first done separately for departure and arrival delay dynamics.
In view of this analysis, a stochastic model was developed to mitigate air traffic flow
management through optimising the aggregated air traffic delay.
Furthermore, the systematic and persistent aircraft delays at most airports in the world ignited the
researcher into a dynamical solution finding study (see Appendix A). Information
Communication Technology automation is a welcome idea in the management of air traffic, but
human innovation and inputs into the management information systems of air traffic at an airport
create a management information gap at most International Airports globally and particularly at
Entebbe International Airport.
In order to improve the management of air traffic flow at Entebbe International Airport, it was
important to analyse the performance of aircraft delay over a period of time. Billy (2009) argued
that air traffic delay are not only a source of inconvenience, but also cost New York City $2.6
billion a year. Ehrlich (2008) estimated the total cost due to domestic air traffic delays in the
United States of America to be $41 billion for the year 2007 that included higher airline
operating costs, lost passenger productivity and time and losses to other industries. Evans et al.

10
(2008) agreed that to improve air traffic management during severe convective weather, model
need to be applied to facilitate timely decision-making in difficult environments.
1.3 Problem Statement
Optimization of air traffic flow at airports is one of the fundamental ways through which airlines
maintain operational and economic efficiency. However, weather, equipment, runway and other
anomalous conditions disrupt air traffic flow leading to significant costs as a result of aircraft
delays. The occurrence of these conditions creates unpredictable situations that require stochastic
approach to solve. Automated systems for optimizing air traffic flows are unable to effectively
reconfigure when path planning must account for dynamic conditions such as moving weather
systems and unpredictable movements of very important persons. Human intervention is needed
and could be provided to enhance the automated decision making for aircraft route planning and
reconfiguration. Specifically, there is lack of such intervention at Entebbe International Airport
that can mitigate delays so as to enhance Air traffic flow Management to boost efficiency of
aircraft operations. Statistics are the basic ingredients of human interventions and these are
derived mainly from operational data and data simulations where necessary to facilitate modeling
for problem solving. Although, some operational data are available at the Entebbe International
Airport, they are not maximally being utilized to abate air traffic delays for sustained efficient air
traffic flow management. Subsequently, there are not enough tools to inform the human
intervention into air traffic management automation process in order to lead to sustainable air
traffic efficiency.
11
1.4 Research Objectives
The main objective of this research study was to investigate the dynamics of aircraft delays and
hence develop stochastic optimisation models that mitigate delays and facilitate timeliness of
aircrafts for efficient air traffic management.
The specific objectives of the study were the following:
1. To analyse the air traffic delay at Entebbe International Airport;
2. To assess the dynamics of air traffic delay;
3. To determine air traffic operational inefficiency;
4. To develop stochastic models for aircraft operational utility optimisation;
5. To develop algorithms for sensitivity analysis so as validate the model
1.5 Research Questions
The study addresses the following research questions that dictated the direction of this research:
i) Is there a trend in the proportion of aircraft delays at Entebbe International Airport?
ii) How significant do the factors associated with aircraft delays actually determine air
traffic delays at Entebbe International Airport?
iii) Can we determine air traffic operational efficiency using the available data?
iv) How is aircraft operational utility related to departure and arrival delays?

12
1.6 Significance of the Study
The study produced outputs that are very important to the aviation industry including. Firstly, the
study derived departure delay determinants of aircrafts at Entebbe International Airport and those
with similar characteristics especially in Eastern and Southern Africa region. Similar
determinants were derived for evaluating the dynamics of aircraft arrival at the airport. Secondly,
a model for aircraft operational technical inefficiency at the airport was determined using
stochastic frontier model approach. The significance of these two major study outputs, one and
two is to empower the decision making process of air traffic flow management by filling the
knowledge gap and emphasizing the need for integration in the decision making process of air
traffic flow management. The knowledge gap is informed through evaluating the determinants of
aircraft delays and the ability to forecast the delay based on aggregated daily historical data.
Thirdly, the stochastic optimisation models developed recognise the negative effects of delays in
the daily operations of aircraft flow and also based on the knowledge, established an optimal
aircraft operational level over time. In these models, the number of aircrafts that delay per day
are minimised, without necessarily compromising the lives of passengers, the crew board and
machinery losses.
Fourthly, computer algorithms have been developed for the stochastic models that render them
easy to adapt for implementation through computer programming and automation. Sensitivity
tests performed show that the models are adaptable to different scenarios both in the known very
busy and moderately busy airports in the world. Furthermore, because of the aggregation of the
number of aircrafts delaying to depart or arrive per day, these model are geared towards
performing better than the previous models even for the worst case scenario where the inputs are
13
practically too large. The previous models have always considered the duration of time delayed,
however, the number of aircrafts that delay either to depart or to arrive was the primary
parameter used in this study.
1.7 Delimitations of the study
The empirical study does not focus on the Civil Aviation Authority in its entirety, but only on
one Department under the Directorate of Air Navigation Services that specifically handles air
traffic management. It does not analyze the technical details for example, the construction and
materials of the runways, but rather focuses on the process of managing and improving air traffic
flow efficiency at the airport. It analyses the dynamics of the aircraft delay at zero tolerance
performance of Entebbe International Airport. The study does not analyze aircraft delay based on
the length of duration of the delay as a unit of measurement; rather the daily proportion of
aircraft delay was used in the analysis. The stochastic optimisation models presented in the
thesis related proportions of daily aircraft delays to aircraft utility. It identifies existing
opportunities and threats, all with the purpose of exploring how the air traffic flow efficiency can
be improved.
1.8 Limitations of the study
The research had a number of limitations that either acted to slow down its progress or deviate
the methodology to the research approach. Nevertheless, the research proceeded to the
fulfillment of the researcher’s expectations. Some of the research limitations included; firstly,
security limitations to access the case study area, Entebbe International Airport; secondly, the
high level of data confidentiality attached to the data at the case study; thirdly the unexpected

14
data incompleteness for the proposed time duration and lastly the uncertainty of data
compatibility since dual sources of data were used for this study. However, it is worth to note
that in no significant way did these limitations affect the research output because each of those
limitations mentioned was appropriately overcome. The first limitation was overcome by getting
a security pass to enable me access necessary offices at the airport. This research did not require
use of identity names for airlines and aircrafts; hence dropping those variables did not affect the
output of this research in anyway. Although, the study aimed at using all the available delay data
at the airport, the daily hourly data collected from both the airport and the meteorological
briefing office for five years resulted into 1827 daily aggregated records that formed a
sufficiently large data set for this research to meet its specific objectives. Finally, the experience
of the researcher in data management played a big role in aptly managing and handling data from
different data sources, hence this limitation was overcome hustle free.
1.9 Ethics
The nature of this research required that operational data of Entebbe International Airport were
used. As such issues pertaining data confidentiality and integrity were treated with high ethical
regard. All variables that tended to identify and classify individuals, airlines or aircrafts involved
were dropped. Aircraft registrations and countries where they are registered from were also
dropped for the purpose of maintaining high ethics and confidentiality.
1.10 Structure of the Thesis
The thesis has six chapters. Chapter 1 is an introduction to the research outlining the research
problem and the objectives of the research. Chapter 2 is literature review and a theoretical and
15
conceptual framework in order to understand the research context and to identify relevant
theories and concepts. Chapter 3 is devoted to the statistical models for air traffic delay, detailed
exploratory data management approach, data parameters from two sources, statistical analyses,
the R statistical computing language and other customized code for statistical model
development and sensitivity analysis. Models presented under different sections include:
sequence charts, ARIMA models and Logistic models for aircraft delays and the stochastic
frontier model for aggregated aircraft delay. Chapter 4 presents the stochastic optimization
models deriving from this study. The stochastic optimisation model for maximizing aircraft
utility is presented. Sensitivity analysis based on the available data at the Civil Aviation
Authority at Entebbe International Airport and data simulations are used to ascertain the
resilience of the model. Chapter 5 provides a discussion based on the results from the study.
Chapter 6 comprises of the conclusions and recommendations as generated from the preceding
chapters.

43
CHAPTER THREE
METHODOLOGY
This chapter presents data sources, specific variables collected, data management process
followed by data analysis and challenges encountered both in data collection and during data
management process. Specifically, the chapter gives the process of computation of the number of
aircrafts that delay both to depart and arrive and also aggregation of the variables on a daily
basis. Subsequently, a review of methodologies used in this study is done and the basis of
development of the stochastic optimization models to be presented in chapter six is initiated.
3.1 Data Description: Sources and Preparation
The data for the study were collected from the Civil Aviation Authority (CAA) and the National
Meteorological Centre (NMC). Specifically, data collected came from the Statistics Department
of the Civil Aviation Authority and the Briefing Office of the Department of Meteorology in
Entebbe, Uganda. The reliability of the models is strongly dependant on the amount and quality
of data used for model formulation and calibration. Models were formulated using aircraft delay
program parameters and weather conditions at Entebbe International Airport.
3.1.1 Aviation Data Logs
On a daily basis, specialists record all facility operations from the beginning of the day until the
end of the day on a twenty four hour basis. The main components of these records were the
actual and expected times of arrival and departure respectively recorded for every incoming and
outgoing flight at the airport. These data commonly referred to as manifest data are then entered
and stored in a database and only referred to whenever there is for example an investigation of

44
aircraft accident or incidence. Following are the main variables for the data of interest for this
study. The departure delay duration was then computed by obtaining the difference between
actual and expected departure time while arrival delay duration was estimated by computing the
difference between actual and expected arrival time.
Variable Definition
Year Year of data collection
Month Month of data collection
Day Day of data collection
Hour Hour of data collection
M-Type Type of movement
Category category of aircraft
ETA Expected time of arrival
ATA Actual time of arrival
POBI Persons on board of an incoming aircraft
ETD Expected time of departure
ATD Actual time of departure
POBO Persons on board a departing aircraft
3.1.2 Meteorological Data Logs
Weather related data is of immense application and one of the main uses is to support the
aviation industry in maintaining high and reliable aircraft flow for sustainable development.
Actually, in Uganda the most sustained beneficiary of meteorological data is the aviation
industry. The weather data logs comprise of a number of parameters referred to as either
METAR or SYNOP. In this study, METAR data for Entebbe International Airport were used. A
METAR, French abbreviation for MÉTéorologique Aviation Régulière, is used to report specific
weather data on an hourly basis while a SYNOP is used to store data every six hours throughout

45
the day. A typical METAR report contains information on temperature, dew point, wind speed
and direction, precipitation, cloud cover and heights, visibility and barometric pressure. The data
in METAR report is coded as a way of international standardization such that it may be
understood by anyone irrespective of the language barrier. A typical METAR report may take
the following coded form:
METAR HUEN 041600Z 12003MPS 1400 R01/P1500N R22/P1500U +SN BKN022 OVC050
M04/M07 Q1020 NOSIG =
Where:
METAR indicates that the following is a standard hourly observation
HUEN is the ICAO airport code for Entebbe International Airport
041600Z indicates the time of the observation. It is the day of the month followed by the
time of day.
12003 indicates the wind direction is from 120° true at a speed of 3 metres per second
(5.8 knots)
1400 indicates the prevailing visibility is 1,400 metres (4,600 ft)
R01/P1500N indicates the Runway visual range (RVR) along Runway 01 is 1,500 metres
(4,900 ft) and not changing significantly
R22/P1500U indicates RVR along Runway 22 is 1,500 metres (4,900 ft) and rising
+SN indicates snow is falling at a heavy intensity
BKN022 indicates a broken cloud layer at 2,200 feet (670 m) above ground level. It
defines the cloud ceiling.
OVC050 indicates an unbroken cloud layer (overcast) at 5,000 feet (1,500 m) above
ground level.
M04/M07 indicates the temperature is −4 °C (25 °F) and the dew point is −7 °C (19 °F).
Q1020 indicates the current altimeter setting (QNH) is 1020 millibars.
NOSIG is an example of a TREND forecast which is appended to METARs at stations
while a forecaster is on watch. NOSIG means that no significant change is
expected to the reported conditions within the next 2 hours.

46
CAVOK (abbreviation for Ceiling And Visibility OKay) indicating no cloud below
5,000 feet (1,500 m) and no cumulonimbus at any level, a visibility of 6 statute
miles (10 km) or more and no significant weather.
= indicates the end of the METAR report.
Weather conditions and runway configurations play a major role in determining airport
capacities and the smooth flow of aircrafts at an airport. It was imperative, therefore to consider
weather parameters in this study. Data at the National Meteorological Centre are collected using
the semi-automated method that was designed primarily for national weather forecasting.
However, the forecasts are enhanced using radar information and satellite data generated by the
Meteosat Second Generation, MSG meteorological satellite, launched by the European Union to
collect satellite data over the African continent. Weather variables were mainly used to
determine distributions of Instrument Flight Rule conditions that included ceiling height and
visibility. A ceiling below 1000 feet or a visibility less than 3 miles marks Instrument Flight Rule
conditions according to ICAO regulations. Below are key variables of interest to this study.
Variables Description
Year Year of data collection
Month Month of data collection
Day Day of data collection
Hour Hour of data collection
CLHGT height of cloud ceiling in hundreds of feet
VISIB visibility in miles
TEMP temperature in whole degrees Fahrenheit
DWPT dew point temperature in whole degrees Fahrenheit
WINDD wind direction in whole degrees
WINDS velocity of wind in knots
47
3.2 Data Management and Analysis
To achieve objectives of the research, a number of tools were applied to the data collected from
both National Meteorological Center and Civil Aviation Authority of Entebbe International
Airport. Aviation data were obtained in an excel format with many files each storing daily data
for a specific month. On the other hand weather data were extracted from records stored on
hardcopies. Given the fact that data were collected from two different sources, they had to
undergo thorough data processing and cleaning after merging based on date as a key field. The
researcher synchronized data from the two sources to obtain uniformity of daily data for the
period of five years ranging from 2004 to 2008. The earlier years were not considered because
their data either lacked uniformity or were grossly missing vital parameters. The data was further
aggregated into daily averages. In the absence of aircraft delay logs in terms of time at the
Entebbe International Airport, the number of flights delayed in a day and those on time, both at
departure and arrival were computed. By so doing, the number of aircrafts that experienced delay
at departure and during arrival at Entebbe International airport was obtained. From the same
variable transformations, other variables were obtained, among which is the dichotomous
variable indicating two categories which are 0 = ‘no delay registered’ and 1 = ‘delay is
registered’.
Given that the data came from two different sources, the process of generating the data set
therefore involved data aggregation and merging. Under data aggregation, a number of statistical
techniques were applied, including those which aided data imputation of the missing values
Glance et al. (2009) and Yongsong et al. (2009)
48
The research methodology regarded three basic ingredients which are systems analysis and
design, statistical modelling and stochastic optimization modelling. These formed the basis for
presentation of results of the study in the proceeding chapters four.
3.2.1 Data Systems Design and Modeling
The core dependent variable of aircraft delay was derived from the aviation data. Thus, to obtain
dependent variable of aircraft delay, the expected time of departure was subtracted from the
actual time of departure. Similarly, to obtain arrival delay the expected time of arrival was
subtracted from the actual time of arrival at Entebbe International Airport. Data was further
aggregated on a daily level of operation by classifying them as incurring a delay or on-time
aircraft performance based on whether the departure delay and arrival delay were positive or
negative. The data aggregation process into a daily basis was also done for the variables of type
of aircraft movement and category of aircraft, where counts were done for scheduled versus non-
scheduled flights and international versus domestic passenger aircrafts. As for Persons on board
of the departing and arriving aircrafts, total number of passengers was obtained on a daily basis.
The following schema shows the operation of the stochastic optimisation model. Post-analyses
are done after determining the significance of aircraft delay determinants to obtain the
probability of an aircraft operating on time. This probability is further used as an input into the
stochastic optimisation model so as to obtain the scenario with the highest utility value as
demonstrated in Chapter Four. It should be noted the level of stochastic tendency of the predictor
variables tends to determine the probability of an aircraft operating on-time, hence the variability
of model scenarios.

49
Figure 3.1 Logical flow of information in a stochastic optimisation system
On-time departure
On-time arrival
Delayed departure
Delayed arrival
Operational
Aircraft
Utility
Aggregated
Effect on
Aircraft
Utility
Airport
Estimated
Utility
Independent parameters Dependent parameter
Wind direction
Wind speed
Visibility
QNH
Number of
Operations
Type of flight
movement
Persons on board
Passengers
embarked
Aircraft
delay
on-time
Probability
on-time
Wea
ther
par
amet
ers
Av
iati
on
par
amet
ers

50
Table 3.1: Data dictionary for the model variables
Field name Type Upper
limit
Lower
limit
Continuous
/Discrete
Description
Date Date Dec.
2008
Jan.
2004
Discrete Date of aircraft operation
Scheduled Integer Dec.
2008
Jan.
2004
Scale
discrete
Number of daily scheduled flights
Non-scheduled Integer Dec.
2008
Jan.
2004
Scale
discrete
Number of daily non-scheduled
flights
domestic Integer Dec.
2008
Jan.
2004
Scale
discrete
Number of daily domestic flights
International Integer Dec.
2008
Jan.
2004
Scale
discrete
Number of daily domestic flights
POBin Integer Dec.
2008
Jan.
2004
Scale
discrete
Number of daily persons on board
on the incoming aircrafts
POBout Integer Dec.
2008
Jan.
2004
Scale
discrete
Number of persons on board on the
outgoing aircraft
GDP Integer Dec.
2008
Jan.
2004
Scale
discrete
Number of aircrafts that have
delayed to depart on a daily basis
AHP Integer Dec.
2008
Jan.
2004
Scale
discrete
Number of aircrafts that have
delayed to arrive on a daily basis
Visibility Float Dec.
2008
Jan.
2004
Scale
continuous
Average daily visibility
Windrecn Float Dec.
2008
Jan.
2004
Scale
Continuous
Average daily visibility
Windsped Float Dec.
2008
Jan.
2004
Scale
Continuous
Average wind speed
QNH Float Dec.
2008
Jan.
2004
Scale
Continuous
Queen’s Nautical Height
Table 3.1 is a data dictionary showing various characteristics of the variables used in this study,
their data types and general description. This table is relevant as a benchmark in the
appropriateness of the methodology used in analysis and modelling of air traffic flow to
subsequently inform the air traffic management timely decision making.

51
3.2.2 Logistic Modelling
Logistic regression model used in the case that the dependent variable is a dummy variable with
value ‘0’ if the observation has a characteristic that the aircraft did not delay and ‘1’ if the
aircraft incurred a delay Konishi et al. (2007) and Nerlove & Press (1973) . An aircraft is said to
have delayed if the difference between the actual time and the scheduled time of arrival or
departure respectively is positive. Logistic analysis is deemed as useful for the investigation as
the study intends to assess the dynamics of factors that determine aircraft delay at Entebbe
International Airport (Eq. 3.01). Furthermore, a logistic regression model estimates the
probability with which a certain event will happen or the probability of a sample unit with certain
characteristics expressed by the categories of the predictor variables, to have the property
expressed by the value 1 representing aircraft delay of variable. The estimation of this
probability is performed by using the cumulative logistic distribution (Eq. 3.02), where are
the regression coefficients of the categories to which the sample unit belongs. Logistic regression
is more general because the dependent variable is not restricted to two categories. In the case that
the dependent variable is measured in an ordinal scale, the ordinal regression model is used. The
logistic models were fitted for the daily operational data collected at Entebbe International
Airport over the years 2004 to 2008.
The following formulation was deemed appropriate:
( ) …… (3.01)
Where:
are coefficients of the logistic model
= Number of Operations
= AHP/GDP

52
= Number of flights scheduled
= Number of flights chartered
= Number of flights of other types
= Passengers on board outgoing/incoming
= Number of passengers embarked/disembarked
= Visibility
= Wind direction
= Wind speed
= Temperature
= QNH/QFE
The logit, ( ) on the left hand side represents an independent variable which measures
whether there was an aircraft delay or not over the years and its determinants are subsequently
tested for significance of the causal relationship.
and
…………… (3.02)
Where Prob is the probability of occurrence of one category of the dependent variable given the
influence of the independent variables
( ) .
/ ………. (3.03)
Where R = restricted model
F = full model
LL = log likelihood

53
3.2.3 The ARIMA Stochastic Process of Aircraft Delay
Stochastic process is a statistical phenomenon that evolves in time according to probabilistic
laws. Mathematically, it is referred to as a collection of random variables that are ordered in time
and defined at a set of time points, which may be continuous or discrete.
The first two moments of the stochastic process are the mean and the auto-covariance function
(acv.f) respectively. They are given as;
The mean , - ………………………………………………… (3.04)
The variance , - ……………………………………………….… (3.05)
The auto-covariance ( ) *, -, -+ ……………..…………… (3.06)
Stationary process is an important class of stochastic process whereby a time series is said to be
strictly stationary if the joint distribution of is the same as the joint distribution
of for all . Implying that for finite first two moments,
and .
If k=2, the joint distribution of and depends only on the time difference
which is also called the lag. Thus the auto-covariance function ( ) also depends on .
Thus,
( ) *, -, -+ , - ………………………..……… (3.07)
This is referred to as the auto-covariance coefficient at lag .

54
The size of an auto-covariance coefficient depends on the units in which is measured. Thus,
for interpretative purposes, it is helpful to standardize the acv.f to produce a function called the
autocorrelation function (ac.f) defined by:
…………………………………………………………………..… (3.08)
This quantity, then measures the correlation between and .
A process is called second order stationary or weakly stationary if it’s mean is constant and its
acv.f depends only on the lag so that
, - …………………………………………………….……….. (3.09)
, - …………………………………………………………..…. (3.10)
One important class of processes where the joint distribution of is multivariate
normal for all . The multivariate normal distribution is completely characterized by its 1st
and 2nd
order moments and hence by and ( ), and so it follows that the 2nd
order
stationarity implies strict stationarity for normal processes. However, and may not
adequately describe stationary processes which are very ‘non-normal’.
Two useful models may be considered for both aircraft departure and arrival delay model fitting.
They are the purely random process and the autoregressive process. However, a discrete-time
process is called purely random process if it consists of a sequence of random variables {Zt},
which are mutually independent and identically distributed. Further assumptions are made that
the random variables are normally distributed with mean zero and variance . From definition
above, it follows that the process must have a constant mean and variance and yet the
independence assumption means that

55
( ) {
………………………………………. (3.11)
Based on the available information about the aircraft delay at Entebbe International airport, this
modelling approach given its binding characteristics is rendered less plausible, thus unsuitable to
apply.
On the other hand, under the autoregressive process, suppose that * + is a purely random
process with mean zero and variance
, then a process * + is said to be an autoregressive
process of order p, ( ) if
…………………………………………… (3.12)
This is rather a multiple regression model, but is regressed on past values of rather than on
separate predictor variables, hence the prefix auto. Examining the first order case, assuming p=1,
then the AR (1) equation, sometimes referred to as the Markov process becomes
…………………………………………… (3.13)
Successive substitution into the equation yields
( ) …………………………………………… (3.14)
( ) …………………………………… (3.15)
Eventually, we find that may be expressed as an infinite order moving average, MA process
of the form
…………………………………… (3.16)
To allow convergence of the sum, .
56
The possibility that AR processes may be written in MA form and vice versa means that there is
a duality between AR and MA processes which is useful for modelling aircraft delay both at
departure and arrival at the airport.
Emphasis was based upon the autoregressive integrated moving averages, ARIMA modelling to
time series following three phases: identification, estimation and diagnostic checking as
developed by Box & Jenkins (1994) . The ARIMA models combine three types of processes:
auto regression (AR); differencing to strip off the integration (I) of the series and moving
averages (MA). All the three processes are based on the concept of random disturbances each of
which with its own characteristic way of responding to random disturbances. The difference
between an autoregressive process and a moving average process is that each value in a moving
average series is a weighted average of the most recent random disturbances, while each value in
auto-regression is a weighted average of the recent values of the series.
Time series analysis helped to explain the chronological occurrence of proportion of departure
and arrival delays at Entebbe International Airport and pointed to the direction of the drift of the
delay with respect to time. The trend can thus be positive, negative or non-existent, also known
as stationary.
3.2.4 Aircraft Delay Stochastic Frontier modeling
This section measures and analyses the timeliness of aircrafts at Entebbe International Airport in
Uganda. Stochastic production frontier model is applied to measure the relative technical
efficiency in a consistent way while also shedding light on the factors associated with these
57
efficiency differences based on a framework that has been used in other related studies Cheng &
Caves (2000); Pels et al. (2001) and Good et al. (1995) . The availability of such knowledge can
be valuable aid in designing policies to improve the overall aircraft flow efficiency and hence
contribute to the national economic development.
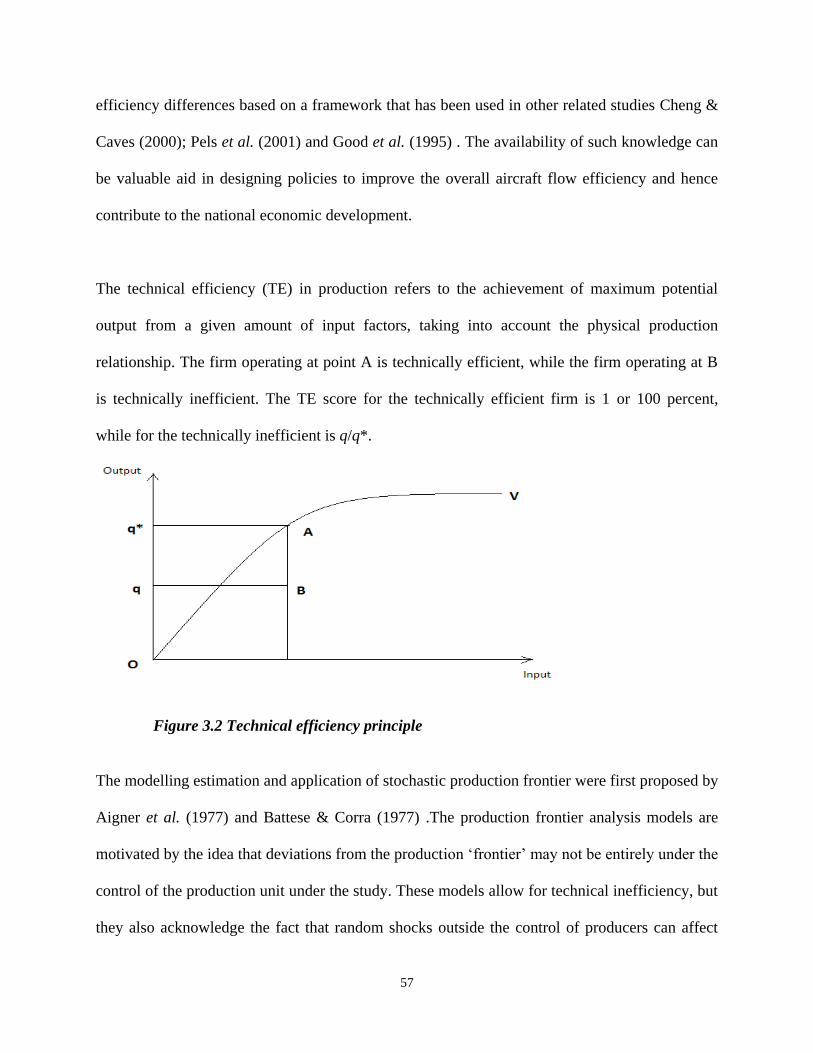
The technical efficiency (TE) in production refers to the achievement of maximum potential
output from a given amount of input factors, taking into account the physical production
relationship. The firm operating at point A is technically efficient, while the firm operating at B
is technically inefficient. The TE score for the technically efficient firm is 1 or 100 percent,
while for the technically inefficient is q/q*.
Figure 3.2 Technical efficiency principle
The modelling estimation and application of stochastic production frontier were first proposed by
Aigner et al. (1977) and Battese & Corra (1977) .The production frontier analysis models are
motivated by the idea that deviations from the production ‘frontier’ may not be entirely under the
control of the production unit under the study. These models allow for technical inefficiency, but
they also acknowledge the fact that random shocks outside the control of producers can affect

58
output. They account for measurement errors and other factors, such as weather conditions,
diseases and other anomalous events on the value of output variables, together with the effects of
unspecified input variables in the production function. The main virtue of the model is that, at
least in principle these effects can be separated from the contribution of variation in technical
efficiency. The stochastic frontier approach is preferred for assessing efficiency in aircraft flow
management at the airports because of the inherent stochastic inclination Sarkis (2001) .
However, the distribution to be used for the inefficiency error has been source of contention
Griffin & Steel (2004) . For this scenario, aircrafts in developing countries typically fall below
the maximum that is possible, the deviation from actual maximum output becomes the measure
of inefficiency and is the focus of interest for most empirical work. Increasing the technical
efficiency for an aircraft at an airport with due consideration of others would result in overall
technical efficiency of a given airport. This way all aircrafts would be competing to be on time
so that passengers who are connecting to other destinations using other aircrafts are not delayed.
At the same time, pressure on the air traffic management would be held constant. In addition, as
more aircrafts tend to be more efficient, more income is realized as well as a boost in the
sustainability of national economic development. Increasing technical efficiency thus supports
all three pillars of sustainability.
The stochastic frontier model proposed by Aigner et al. (1977) and then extended by Huang &
Liu (1994) and Battese & Coelli (1995) is a good approach to identify the significance of
improving the timeliness of aircrafts. Consider departing aircraft on a certain day denoted by i
whose operational output is determined by the following production function:
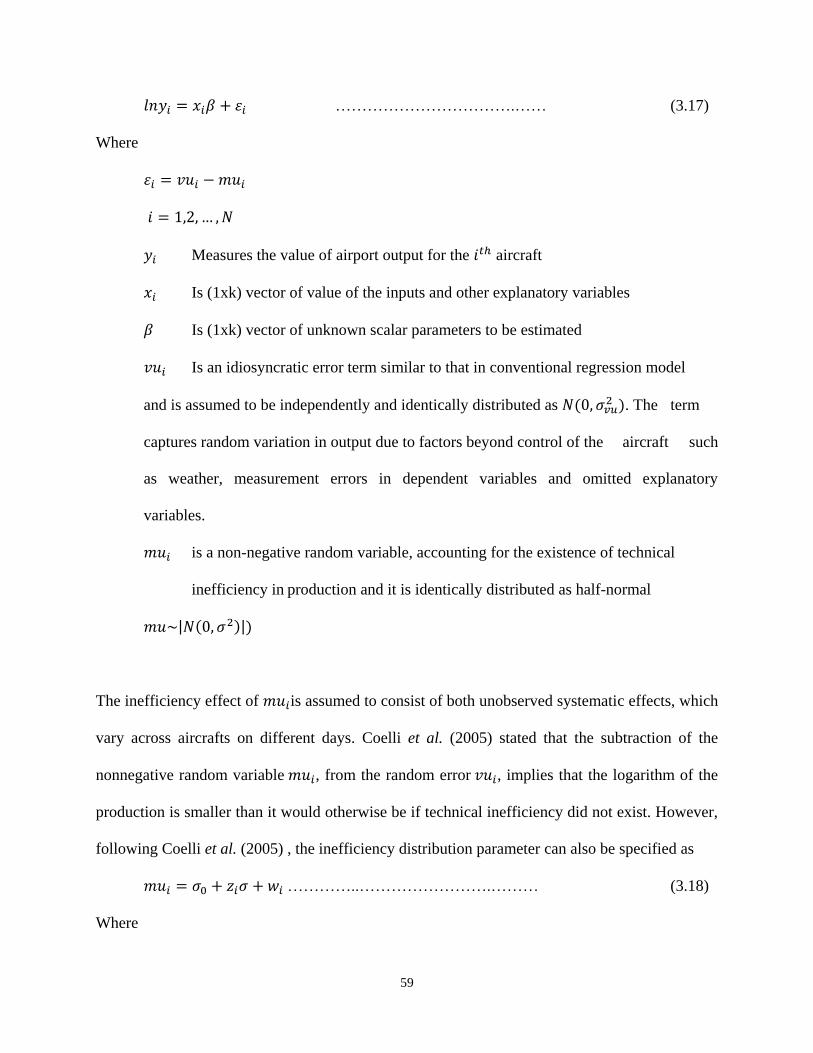
59
…………………………….…… (3.17)
Where
Measures the value of airport output for the aircraft
Is (1xk) vector of value of the inputs and other explanatory variables
Is (1xk) vector of unknown scalar parameters to be estimated
Is an idiosyncratic error term similar to that in conventional regression model
and is assumed to be independently and identically distributed as ( ). The term
captures random variation in output due to factors beyond control of the aircraft such
as weather, measurement errors in dependent variables and omitted explanatory
variables.
is a non-negative random variable, accounting for the existence of technical
inefficiency in production and it is identically distributed as half-normal
| ( )|)
The inefficiency effect of is assumed to consist of both unobserved systematic effects, which
vary across aircrafts on different days. Coelli et al. (2005) stated that the subtraction of the
nonnegative random variable , from the random error , implies that the logarithm of the
production is smaller than it would otherwise be if technical inefficiency did not exist. However,
following Coelli et al. (2005) , the inefficiency distribution parameter can also be specified as
…………..…………………….……… (3.18)
Where
60
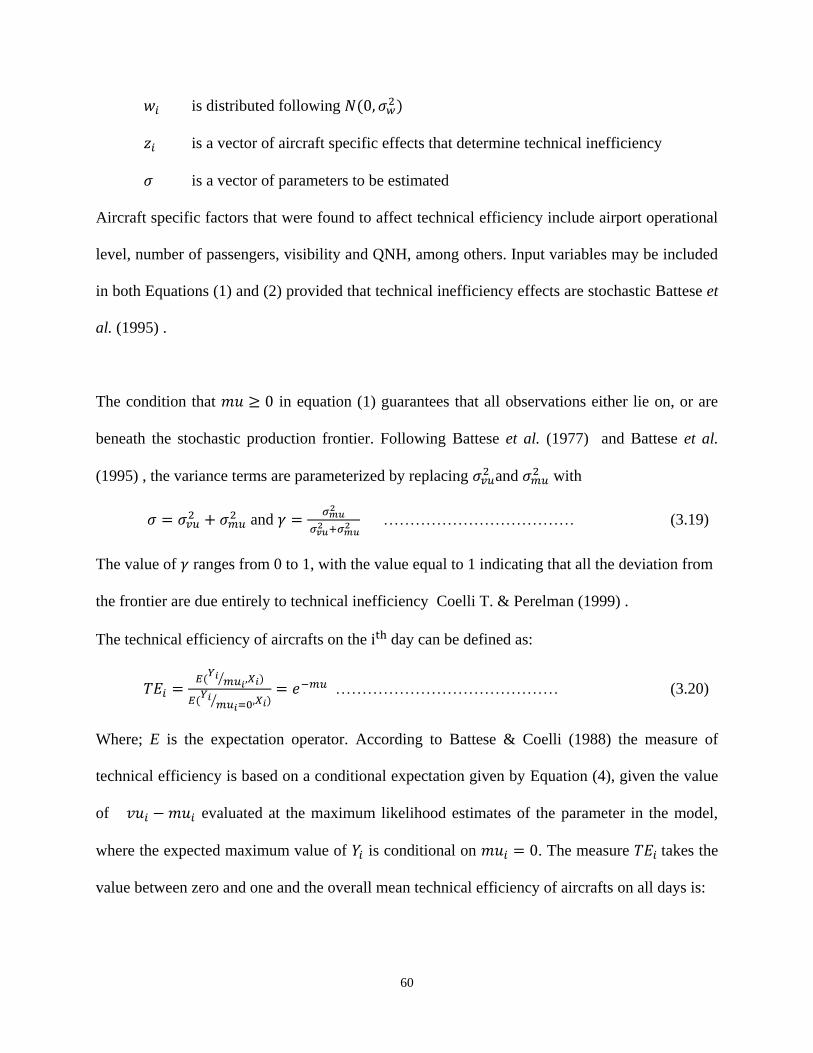
is distributed following ( )
is a vector of aircraft specific effects that determine technical inefficiency
is a vector of parameters to be estimated
Aircraft specific factors that were found to affect technical efficiency include airport operational
level, number of passengers, visibility and QNH, among others. Input variables may be included
in both Equations (1) and (2) provided that technical inefficiency effects are stochastic Battese et
al. (1995) .
The condition that in equation (1) guarantees that all observations either lie on, or are
beneath the stochastic production frontier. Following Battese et al. (1977) and Battese et al.
(1995) , the variance terms are parameterized by replacing and
with
and
……………………………… (3.19)
The value of ranges from 0 to 1, with the value equal to 1 indicating that all the deviation from
the frontier are due entirely to technical inefficiency Coelli T. & Perelman (1999) .
The technical efficiency of aircrafts on the day can be defined as:
( ⁄ )
( ⁄ )
…………………………………… (3.20)
Where; E is the expectation operator. According to Battese & Coelli (1988) the measure of
technical efficiency is based on a conditional expectation given by Equation (4), given the value
of evaluated at the maximum likelihood estimates of the parameter in the model,
where the expected maximum value of is conditional on . The measure takes the
value between zero and one and the overall mean technical efficiency of aircrafts on all days is:

61
{ , .
/-
(
)
}
…………………… (3.21)
Where;
( ) represents the density function for the standard normal variable
A variety of distributions for example exponential, truncated-normal and gamma are used to
characterize the technical efficiency term in the existing literature that apply the stochastic
production frontier. While models that involve two-distributional parameters for example gamma
and truncated normal can accommodate a wider range of possible distributional shape, their
application appears to come at a potential cost of increased difficulty in identifying parameters
Ritter & Simar (1997) . Different simulations exercises carried out by Greene (2003) indicated
that the most straightforward model, that is, half normal is more appropriate from an econometric
point of view. Hence, analysis on the factors affecting aircrafts’ efficiency in this study is based
on the half-normal model.
62
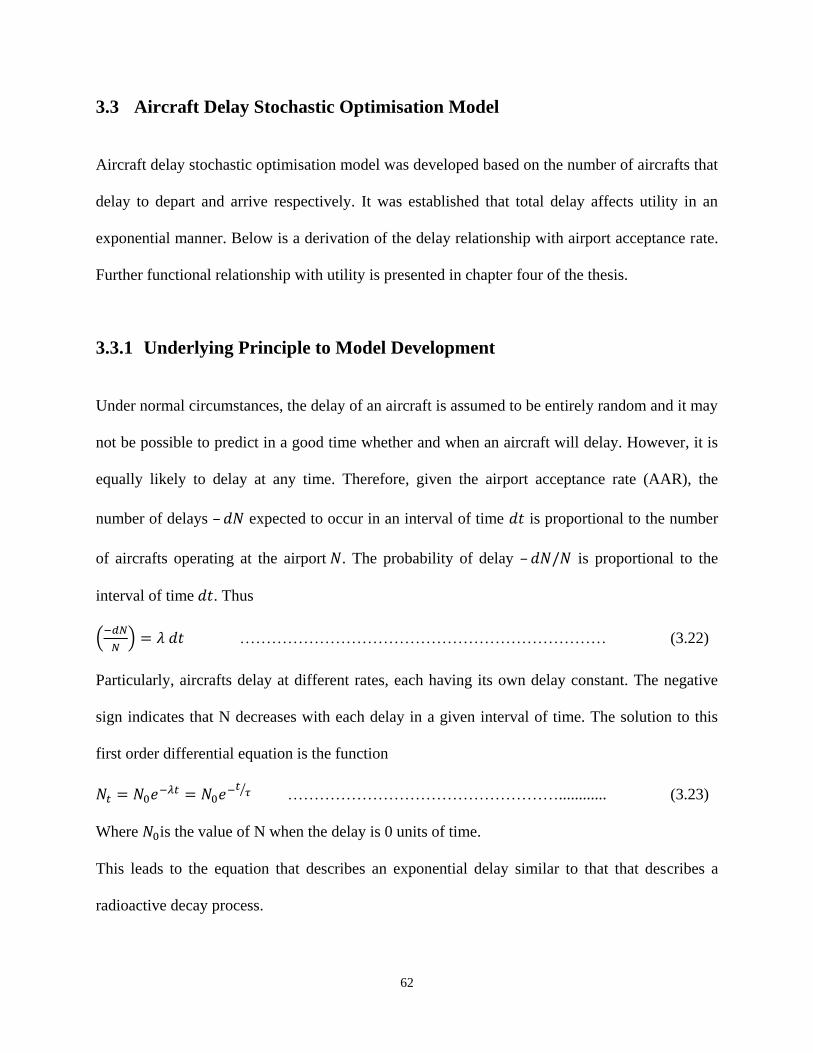
3.3 Aircraft Delay Stochastic Optimisation Model
Aircraft delay stochastic optimisation model was developed based on the number of aircrafts that
delay to depart and arrive respectively. It was established that total delay affects utility in an
exponential manner. Below is a derivation of the delay relationship with airport acceptance rate.
Further functional relationship with utility is presented in chapter four of the thesis.
3.3.1 Underlying Principle to Model Development
Under normal circumstances, the delay of an aircraft is assumed to be entirely random and it may
not be possible to predict in a good time whether and when an aircraft will delay. However, it is
equally likely to delay at any time. Therefore, given the airport acceptance rate (AAR), the
number of delays – expected to occur in an interval of time is proportional to the number
of aircrafts operating at the airport . The probability of delay – is proportional to the
interval of time . Thus
.
/ …………………………………………………………… (3.22)
Particularly, aircrafts delay at different rates, each having its own delay constant. The negative
sign indicates that N decreases with each delay in a given interval of time. The solution to this
first order differential equation is the function
⁄ ……………………………………………............ (3.23)
Where is the value of N when the delay is 0 units of time.
This leads to the equation that describes an exponential delay similar to that that describes a
radioactive decay process.

63
…………………………………………………………... (3.24)
Or
∫
∫ …………………………………………………………… (3.25)
…………………………………………………………… (3.26)
Where c is a constant of integration
Hence,
…………………………………………………………… (3.27)
…………………………………………………………… (3.28)
Where is a delay constant.
3.3.2 Aircraft Delay by Two or More Processes
At airport level, we consider delay via basically two processes simultaneously. In general these
processes or delay modes have different probabilities of occurring and thus occur at different
rates. The total delay rate of the number of aircrafts N is given by the sum of the delay modes,
thus,
( ) ………………………………………… (3.29)
Hence
( ) ………………………………………………………… (3.30)
Or
( ) ………………………………………………………… (3.31)
Where
Since, the average delay rate

64
………………………………………… (3.32)
Therefore
………………………………………………………… (3.33)
Thus the mean number of aircraft delays at a given airport when both departure and arrival
delays are considered is the harmonic mean of the mean delay rates associated with the
individual delay category and divided by the total number of delay categories. Therefore,
…………………………………………………………… (3.34)
Or
…………………………………………………………… (3.35)
3.3.3 Model Notation
The following notation was assumed in the development of stochastic optimization model. We
assumed * + to be a set of finite flights and * + to be a set of finite
time periods. Given that flight then and . We let where is the
unit cost for airborne and ground delays assumed for all flights. We then assumed is a set of
capacity scenarios where and is the unconditional probability of occurrence of scenario
Furthermore, was used as scenario-specific time varying arrival capacity of the airport where
and which set upper bounds on the number of flights that can land during each time
period. Therefore,
was the arrival capacity of the last time period.

65
3.3.4 Decision Variables
Decision variables are important conjugates in evaluating a scenario, thereby leading to a near
acceptable and reliable decision. The time periods were for duration of an hour resulting into
twenty four time periods per day. Hence, given a particular time period, a flight was expected to
arrive or not to arrive in the given time period. Thus,
{
……………………………………………………………… (3.36)
Where;
q
{ }
3.3.5 Auxiliary variables
Below are some auxiliary variables that were used in model formulation on the assumption that
the system is empty at the beginning of the planning period and that all flights arrive by the end
of period T+1.
{
………………………………… (3.37)
Where;
q
{ }
is number of aircrafts in the arrival queue at the end of time period t under scenario q
66
3.3.6 R Statistical Computing Language
R was inspired by the S environment which was principally developed by John Chambers, with
substantial input from Douglas Bates, Rick Becker, Bill Cleveland, Trevor Hastie, Daryl
Pregibon and Allan Wilks R Development Core Team (2009) . A number of statistical software
exists for data analysis, some of which fairly attempt to provide modeling environment, but R
was used in this study because of the more convenient programming environment it provides. R
is an integrated suite of software facilities for data manipulation, calculation and graphical
display. It includes an effective data handling and storage facility, a suite of operators for
calculations on arrays, in particular matrices, a large, coherent, integrated collection of
intermediate tools for data analysis, graphical facilities for data analysis and display either on-
screen or on hardcopy, and a well-developed, simple and effective programming language which
includes conditionals, loops, user-defined recursive functions and input and output facilities.
Furthermore, for computationally-intensive tasks, C, C++ and FORTRAN code can be linked to
R and called at run time.
3.3.7 The C# Programming Language
The programming language C# was preferred in this study to complement the R computing
language because of its ability to create a friendlier User-Interface. Model development is a good
idea, but it is better only when there is an easier way the targeted users can access the
functionality of the model without much hustle. Other advantages of C# include the fact that it is
the first component oriented language in the C/C++ family, everything really for it is an object
and it is the next generation robust and durable software.

67
3.4 Ethics
The nature of this research required that operational data of Entebbe International Airport were
used. As such issues pertaining data confidentiality and integrity were treated with high ethical
regard. All variables that tended to identify and classify individuals, airlines or aircrafts involved
were dropped. Aircraft registrations and countries where they are registered from were also
dropped for the purpose of maintaining high ethics and confidentiality.
3.5 Limitations
The research had a number of limitations that either acted to slow down its progress or deviate
the methodology to the research approach. Nevertheless, the research proceeded to the
fulfillment of the researcher’s expectations. Some of the research limitations included; firstly,
security limitations to access the case study area, Entebbe International Airport; secondly, the
high level of data confidentiality attached to the data at the case study; thirdly the unexpected
data incompleteness for the proposed time duration and lastly the uncertainty of data
compatibility since dual sources of data were used for this study. However, it is worth to note
that in no significant way did these limitations affect the research output because each of those
limitations mentioned was appropriately overcome. The first limitation was overcome by getting
a security pass to enable me access necessary offices at the airport. This research did not require
use of identity names for airlines and aircrafts; hence dropping those variables did not affect the
output of this research in anyway. Although, the study aimed at using all the available delay data
at the airport, the daily hourly data collected from both the airport and the meteorological
briefing office for five years resulted into 1827 daily aggregated records that formed a

68
sufficiently large data set for this research to meet its specific objectives. Finally, the experience
of the researcher in data management played a big role in aptly managing and handling data from
different data sources, hence this limitation was overcome hustle free.