Creating Lasting Value - sunpharma.com · 5th Largest Global Specialty Generic Company ......
56
Creating Lasting Value Investor Presentation – May 2018 NSE:SUNPHARMA | BSE:524715 | Bloomberg:SUNP IN | Reuters:SUN.BO WWW.SUNPHARMA.COM
Transcript of Creating Lasting Value - sunpharma.com · 5th Largest Global Specialty Generic Company ......

Creating Lasting Value
Investor Presentation – May 2018
NSE:SUNPHARMA | BSE:524715 | Bloomberg:SUNP IN | Reuters:SUN.BO
WWW.SUNPHARMA.COM

Except for the historical information contained herein, statements in this presentation and
the subsequent discussions, which include words or phrases such as “will”, “aim”, “will likely
result”, “would”, “believe”, “may”, “expect”, “will continue”, “anticipate”, “estimate”, “intend”,
“plan”, “contemplate”, “seek to”, “future”, “objective”, “goal”, “likely”, “project”, “should”,
“potential”, “will pursue” and similar expressions or variations of such expressions may
constitute "forward-looking statements". These forward-looking statements involve a
number of risks, uncertainties and other factors that could cause actual results to differ
materially from those suggested by the forward-looking statements. These risks and
uncertainties include, but are not limited to our ability to successfully implement our
strategy, our growth and expansion plans, obtain regulatory approvals, our provisioning
policies, technological changes, investment and business income, cash flow projections, our
exposure to market risks as well as other risks. Sun Pharmaceutical Industries Limited does
not undertake any obligation to update forward-looking statements to reflect events or
circumstances after the date thereof.
Disclaimer
© Sun Pharmaceutical Industries Limited. All Rights Reserved. 2
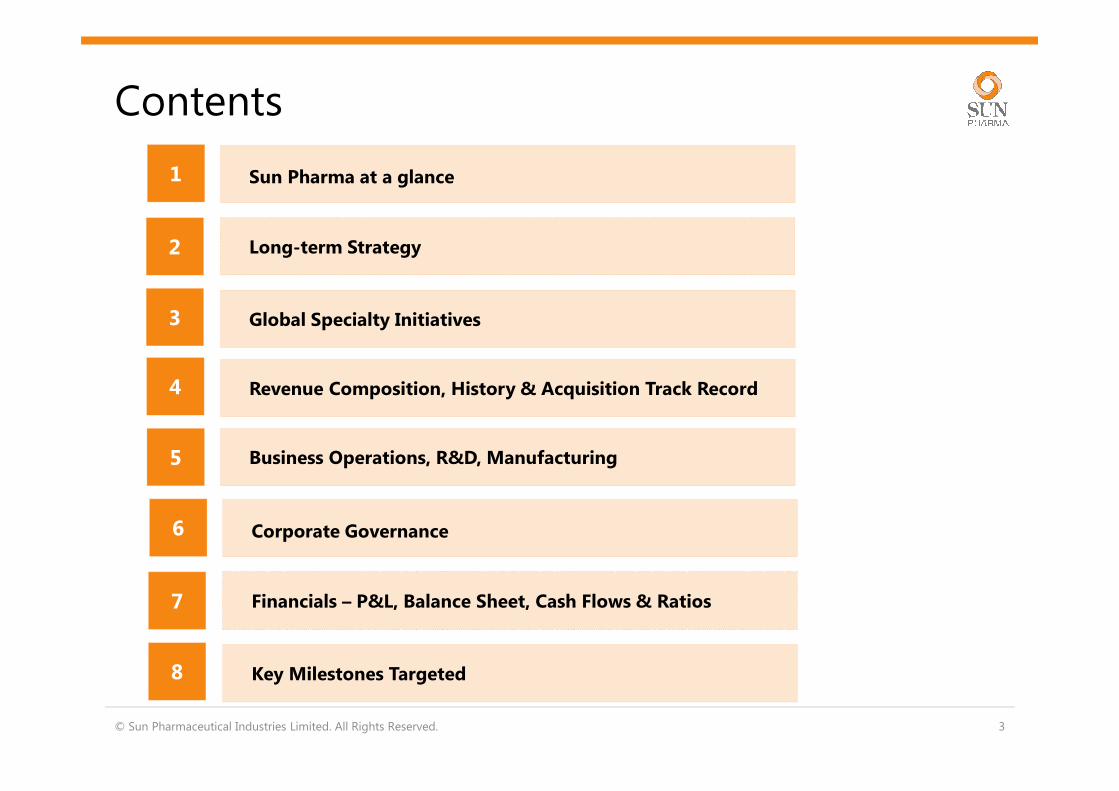
Contents
© Sun Pharmaceutical Industries Limited. All Rights Reserved. 3
Sun Pharma at a glance1
Long-term Strategy2
Global Specialty Initiatives3
Revenue Composition, History & Acquisition Track Record4
Business Operations, R&D, Manufacturing5
Corporate Governance6
Financials – P&L, Balance Sheet, Cash Flows & Ratios7
Key Milestones Targeted8

© Sun Pharmaceutical Industries Limited. All Rights Reserved. 4
Sun Pharma at a glance5th Largest Global Specialty Generic Company5th Largest Global Specialty Generic Company
• Ranked 5th in US* / Largest Indian Pharma Company in USUSUS
• No. 1 Pharma Company in IndiaIndiaIndia
• Amongst the largest Indian Pharma Company in Emerging Markets
Emerging MarketsEmerging Markets
• Expanding presence in EuropeEurope Europe
• 41 manufacturing sites across the worldManufacturing FootprintManufacturing Footprint
• Presence in more than 150 countries across branded and generic markets
Market PresenceMarket Presence
• Portfolio of more than 2,000 products across the worldProduct PortfolioProduct Portfolio
• 30,000+ global employee baseEmployeesEmployees
• Multiple facilities approved by various regulatory authorities across the world including USFDA
Quality ComplianceQuality Compliance
• Capabilities across dosage forms like injectables, sprays, ointments, creams, liquids, tablets and capsules
R&D and ManufacturingR&D and Manufacturing
• Specialty products, branded generics, complex generics, pure generics & APIs
Addressable SegmentsAddressable Segments
* Source: Evaluate Pharma Estimates for 12 months ended Dec 2017
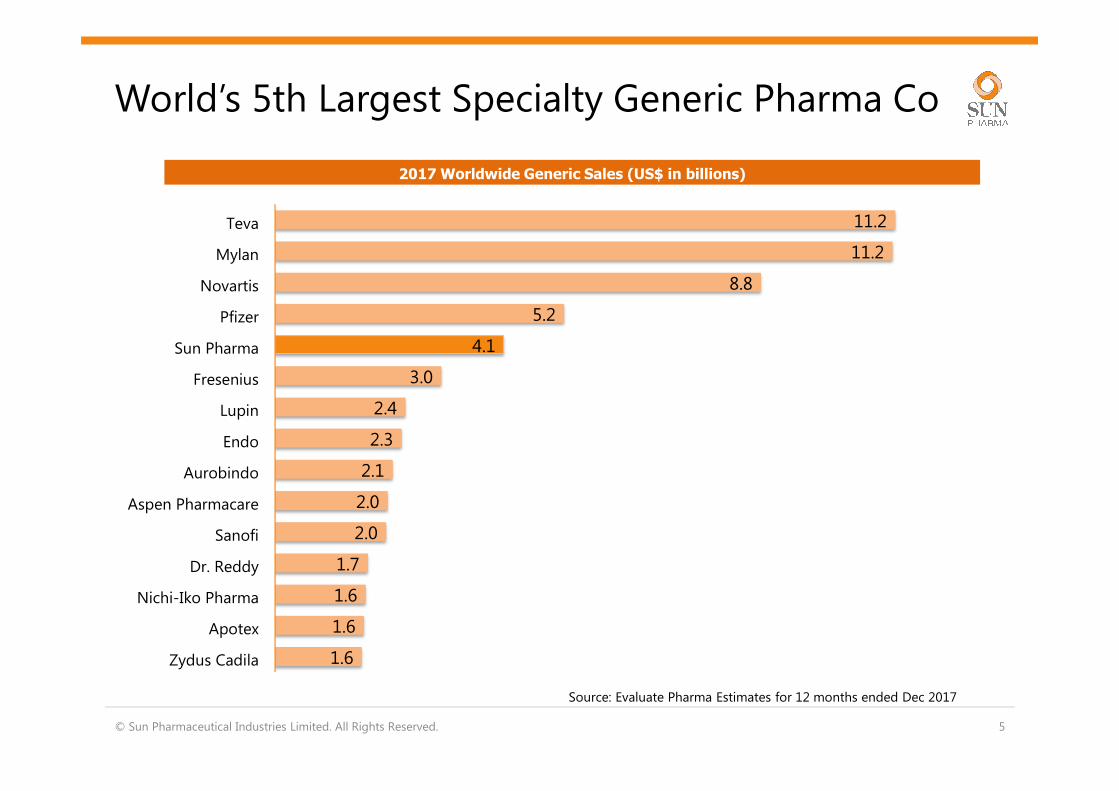
World’s 5th Largest Specialty Generic Pharma Co
1.6
1.6
1.6
1.7
2.0
2.0
2.1
2.3
2.4
3.0
4.1
5.2
8.8
11.2
11.2
0.0 2.0 4.0 6.0 8.0 10.0 12.0
Zydus Cadila
Apotex
Nichi-Iko Pharma
Dr. Reddy
Sanofi
Aspen Pharmacare
Aurobindo
Endo
Lupin
Fresenius
Sun Pharma
Pfizer
Novartis
Mylan
Teva
© Sun Pharmaceutical Industries Limited. All Rights Reserved. 5
2017 Worldwide Generic Sales (US$ in billions)
Source: Evaluate Pharma Estimates for 12 months ended Dec 2017

US
Formulation
33%
India
Branded
Generics
31%
Emerging
Markets
19%
Western
Europe &
Other
Markets #
11%
API & Others
6%FY18
India
32%
International
68%
FY18
Western Europe, Canada, Japan ANZ & others
� 5th largest generics company in US* with a strong pipeline (139 ANDAs & 3 NDAs awaiting approval)
� Presence in generics, Specialty and branded segments with more than 422 approved products
� FY18 sales: US$ 1,357 mn (2)
© Sun Pharmaceutical Industries Limited. All Rights Reserved. 6
Sun Pharma today
• Market cap: US$ 17 bn (1)
• Gross Sales: US$ 4,044 mn (2)
• EBITDA: US$ 804 (21% margin) (2)
• R&D Investment: 8.6% of Sales
• Globalized supply chain
• 54% owned by promoter group
• Strong balance sheet, low debt
• Strong product pipeline
Note:(1) As of May, 31, 2018 using spot exchange rate of INR /USD = 67.62(2) Using average exchange rate for FY17 of INR /USD = 64.46# Includes Western Europe, Canada, Australia & New Zealand, Japan and other markets.
All sales numbers in US$ for 12 months ended March 31, 2018.* Source: Evaluate Pharma Estimates for 12 months ended Dec 2017
� Presence in over 100 countries across Africa, Americas, Asia and Eastern & Central Europe
� Key focus markets – Brazil, Mexico, Russia, Romania, South Africa, and complementary & affiliated markets
� FY18 sales: US$ 751 mn (2)
� Presence across majority of markets in Western Europe, Canada, Japan and A&NZ
� Product portfolio includes differentiated offerings for hospitals, injectables and generics for retail market
� FY18 sales: US$ 461 mn (2)
� No.1 ranked with 13 classes of doctor categories� Leading position in high growth chronic therapies� Specializes in technically complex products� FY18 sales: US$ 1,246 mn (2)
Geo
gra
ph
ical
sa
les
split
Reve
nu
e
Bre
ak-up
India Branded GenericsUS Formulations
Emerging Markets
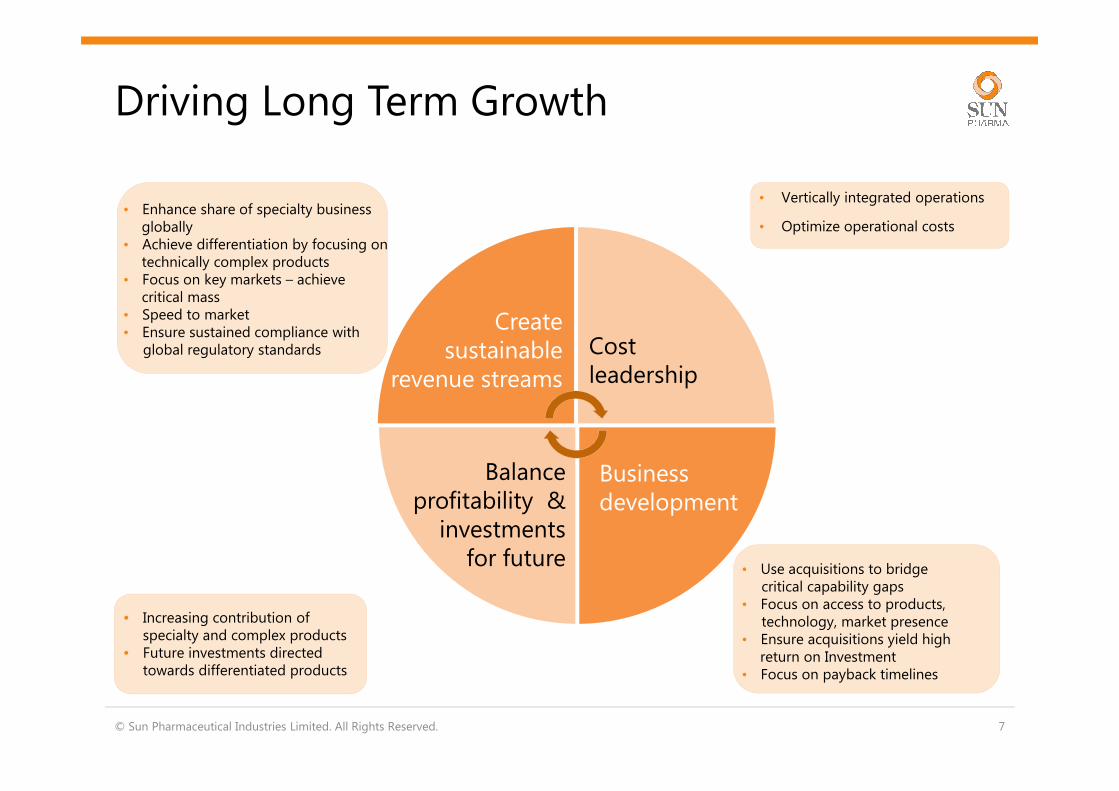
• Increasing contribution of specialty and complex products
• Future investments directed towards differentiated products
Cost leadership
Create sustainable
revenue streams
Driving Long Term Growth
© Sun Pharmaceutical Industries Limited. All Rights Reserved. 7
Business development
• Enhance share of specialty business globally
• Achieve differentiation by focusing on technically complex products
• Focus on key markets – achieve critical mass
• Speed to market• Ensure sustained compliance with
global regulatory standards
• Vertically integrated operations
• Optimize operational costs
• Use acquisitions to bridgecritical capability gaps
• Focus on access to products,technology, market presence
• Ensure acquisitions yield high return on Investment
• Focus on payback timelines
Balance profitability &
investments for future

Our Specialty Initiatives
© Sun Pharmaceutical Industries Limited. All Rights Reserved. 8
• In-licensed Ilumya (a monoclonal antibody targeting IL-23) from MSD for treating chronic plaque psoriasis- Biologics License Application (BLA) Filed with US FDA and EMA for European market. USFDA approval received in March 2018. Launch preparations are ongoing.
• Acquired Ocular Technologies – Gives access to global rights for OTX-101 – for treating Dry Eye Disease. Announced positive results from confirmatory Phase-3 trials in Jan’17. Filed NDA with USFDA in Q3 FY18. Evaluate other markets for filing OTX-101.
• Acquired branded oncology product – Odomzo – in Dec’16. Product is approved in 30 countries globally including US, Europe and Australia. Currently marketed in US and Germany.
• Launched BromSite – first specialty ophthalmology product in US in Nov’16
• Acquired Dusa Pharma in US – Access to patented drug-device combination useful for treating Actinic Keratosis, a dermatology ailment
• Acquired InSite Vision - Focuses on developing new specialty ophthalmic products, has three late stage programs.
• In-licensed Xelpros (ophthalmology) and Elepsia (CNS) products from SPARC
Ramping up Specialty Pipeline
Ramping up Specialty Pipeline

© Sun Pharmaceutical Industries Limited. All Rights Reserved. 9
Highly Diversified Revenue Base
US Formulations
34%
India Branded
Formulations
31%
Emerging Markets
19% Western Europe &
Other Markets #
11%
API & Others
5%
# Includes Western Europe, Canada, Japan , Australia, New Zealand and other markets.
FY18 SalesRs 261 billion
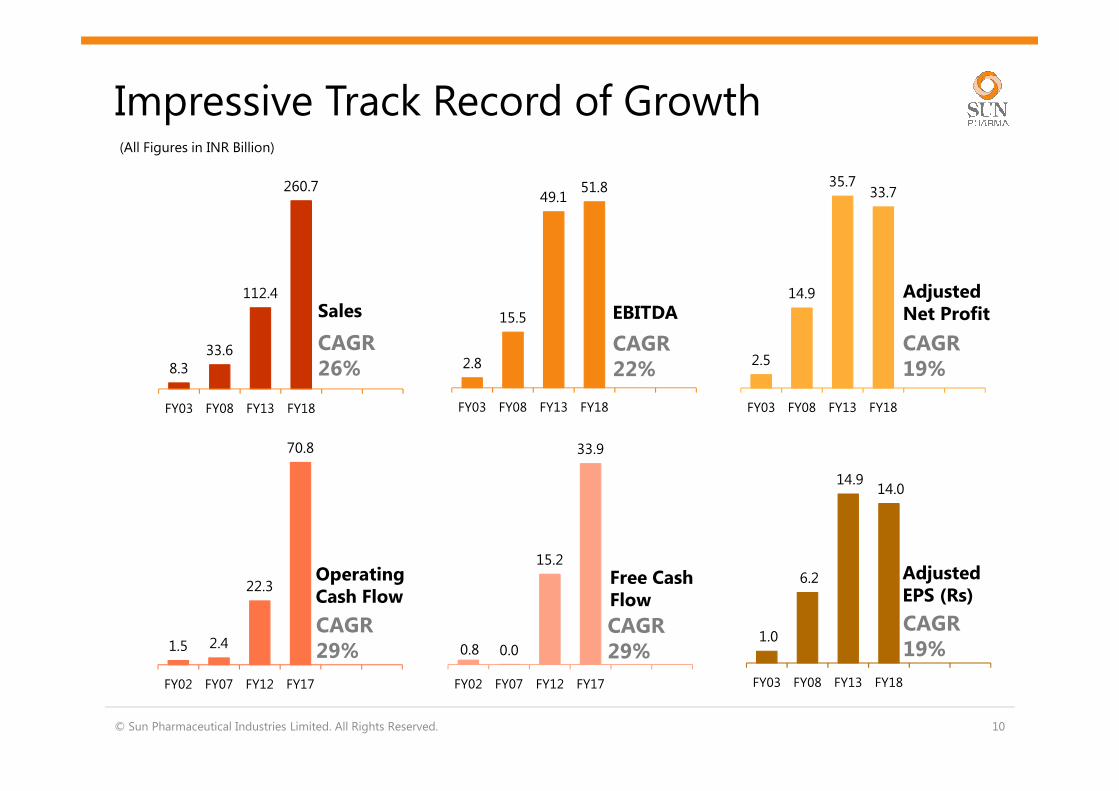
0.8 0.0
15.2
33.9
FY02 FY07 FY12 FY17
1.5 2.4
22.3
70.8
FY02 FY07 FY12 FY17
8.333.6
112.4
260.7
FY03 FY08 FY13 FY18
1.0
6.2
14.9 14.0
FY03 FY08 FY13 FY18
© Sun Pharmaceutical Industries Limited. All Rights Reserved. 10
Impressive Track Record of Growth
Sales
2.8
15.5
49.151.8
FY03 FY08 FY13 FY18
2.5
14.9
35.733.7
FY03 FY08 FY13 FY18
CAGR26%
CAGR19%
CAGR22%
CAGR29%
CAGR29%
CAGR19%
EBITDAAdjusted Net Profit
Operating Cash Flow
Free Cash Flow
Adjusted EPS (Rs)
(All Figures in INR Billion)
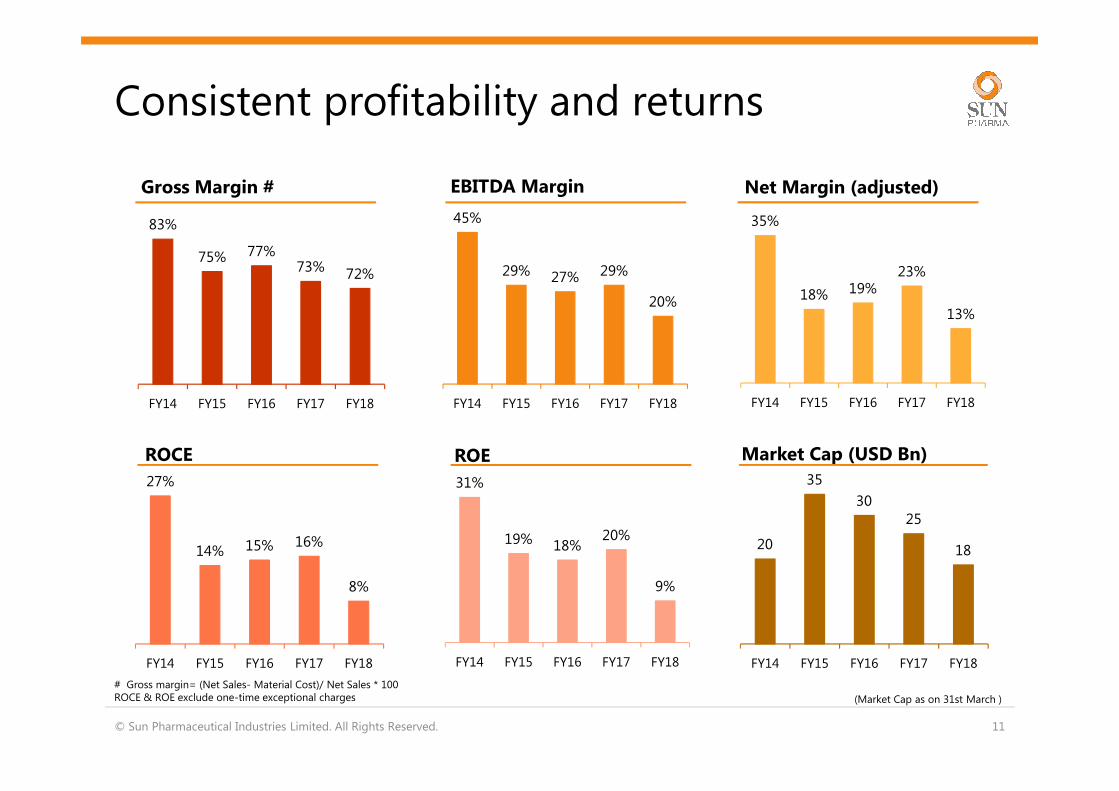
83%
75% 77%73% 72%
FY14 FY15 FY16 FY17 FY18
20
35
3025
18
FY14 FY15 FY16 FY17 FY18
© Sun Pharmaceutical Industries Limited. All Rights Reserved. 11
Consistent profitability and returns
45%
29% 27% 29%
20%
FY14 FY15 FY16 FY17 FY18
35%
18% 19%23%
13%
FY14 FY15 FY16 FY17 FY18
Gross Margin # EBITDA Margin Net Margin (adjusted)
ROCE ROE Market Cap (USD Bn)
# Gross margin= (Net Sales- Material Cost)/ Net Sales * 100ROCE & ROE exclude one-time exceptional charges (Market Cap as on 31st March )
27%
14% 15% 16%
8%
FY14 FY15 FY16 FY17 FY18
31%
19% 18%20%
9%
FY14 FY15 FY16 FY17 FY18

32%35%
18%19%
23%
14%14%12% 13%
14%
10%
8%
44% 45%
29%28%
29%
20%22%
19% 19%
23%
19%
18%
FY13 FY14 FY15 FY16 FY17 FY18
82%83%
75%77%
73%72%
62% 62%63% 63%
66%64%
FY13 FY14 FY15 FY16 FY17 FY18
Gross margin= (Net Sales – Material Cost) / Net Sales * 100
#Top 10 Indian Pharma company include Aurobindo, Cadila Healthcare, Cipla, DRL, Ranbaxy, Glenmark, Ipca, Lupin, Torrent and Wockhardt.
Sustained Profitability Vs. PeersSuperior business model
Margins consistently higher than peers#
Sun Pharma Range of Top 10 Indian Pharma Cos. Average
Net Margin
12
EBITDA Margin
© Sun Pharmaceutical Industries Limited. All Rights Reserved.
FY13 FY14 FY15 FY16 FY17 FY18
Gross Margin
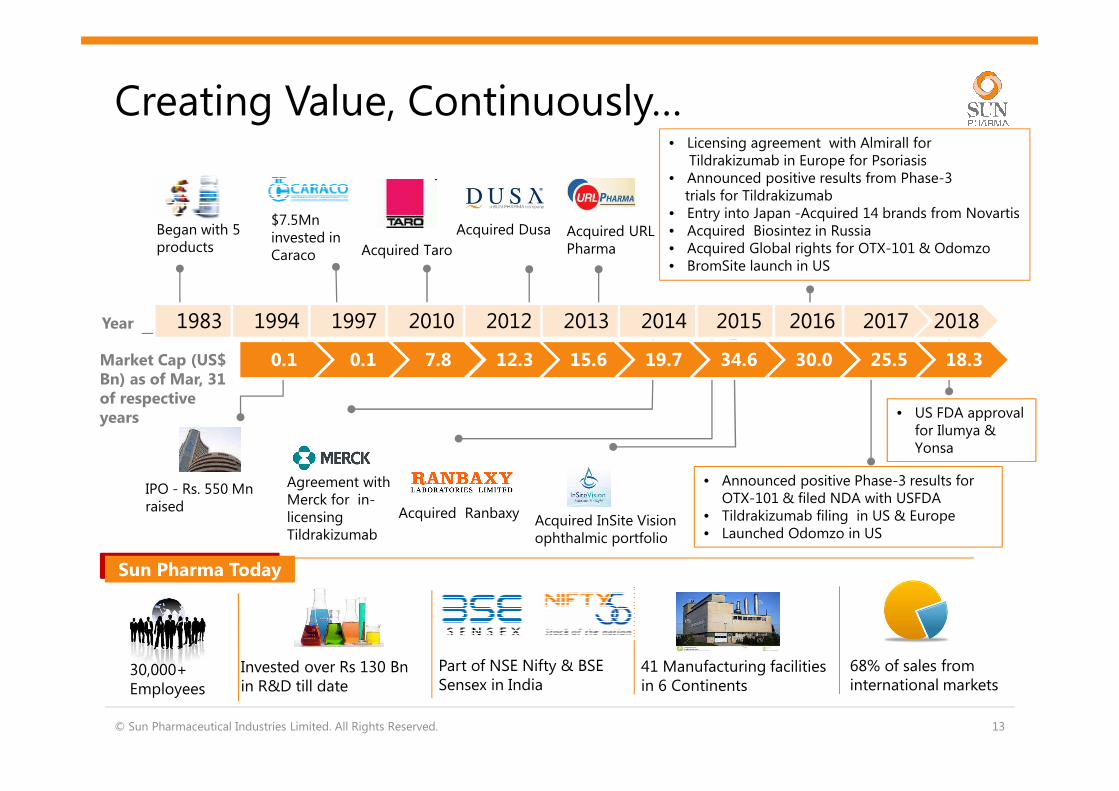
Market Cap (US$ Bn) as of Mar, 31 of respective years
Began with 5 products Acquired Taro
Acquired Dusa Acquired URL Pharma
Creating Value, Continuously…
© Sun Pharmaceutical Industries Limited. All Rights Reserved. 13
IPO - Rs. 550 Mn raised
$7.5Mn invested in Caraco
Acquired Ranbaxy
30,000+ Employees
Sun Pharma Today
Invested over Rs 130 Bnin R&D till date
Part of NSE Nifty & BSE Sensex in India
41 Manufacturing facilities in 6 Continents
68% of sales from international markets
Year
Agreement with Merck for in-licensing Tildrakizumab
Acquired InSite Vision ophthalmic portfolio
• Licensing agreement with Almirall forTildrakizumab in Europe for Psoriasis
• Announced positive results from Phase-3trials for Tildrakizumab
• Entry into Japan -Acquired 14 brands from Novartis• Acquired Biosintez in Russia• Acquired Global rights for OTX-101 & Odomzo• BromSite launch in US
• Announced positive Phase-3 results for OTX-101 & filed NDA with USFDA
• Tildrakizumab filing in US & Europe• Launched Odomzo in US
• US FDA approval for Ilumya & Yonsa
1983 1994 1997 2010 2012 2013 2014 2015 2016 2017 2018
0.1 0.1 7.8 12.3 15.6 19.7 34.6 30.0 25.5 18.3
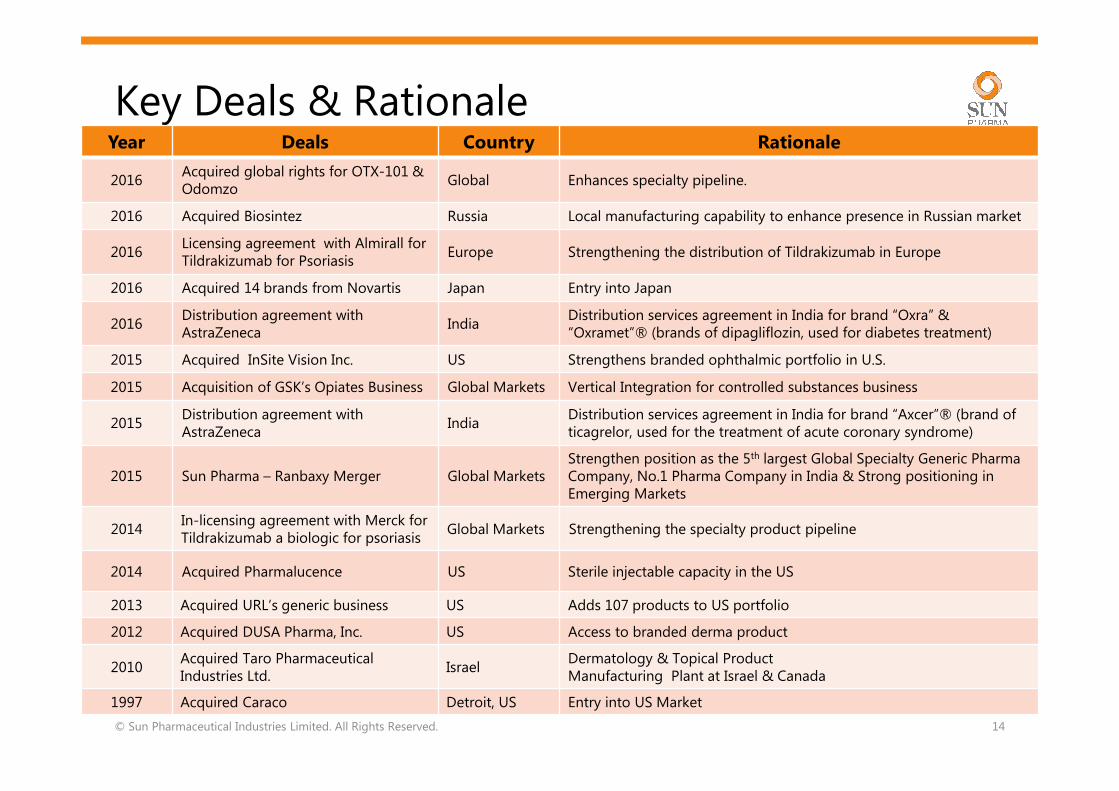
Key Deals & Rationale
© Sun Pharmaceutical Industries Limited. All Rights Reserved. 14
Year Deals Country Rationale
2016Acquired global rights for OTX-101 & Odomzo
Global Enhances specialty pipeline.
2016 Acquired Biosintez Russia Local manufacturing capability to enhance presence in Russian market
2016Licensing agreement with Almirall for Tildrakizumab for Psoriasis
Europe Strengthening the distribution of Tildrakizumab in Europe
2016 Acquired 14 brands from Novartis Japan Entry into Japan
2016Distribution agreement with AstraZeneca
IndiaDistribution services agreement in India for brand “Oxra” & “Oxramet”® (brands of dipagliflozin, used for diabetes treatment)
2015 Acquired InSite Vision Inc. US Strengthens branded ophthalmic portfolio in U.S.
2015 Acquisition of GSK’s Opiates Business Global Markets Vertical Integration for controlled substances business
2015Distribution agreement with AstraZeneca
IndiaDistribution services agreement in India for brand “Axcer”® (brand of ticagrelor, used for the treatment of acute coronary syndrome)
2015 Sun Pharma – Ranbaxy Merger Global MarketsStrengthen position as the 5th largest Global Specialty Generic Pharma Company, No.1 Pharma Company in India & Strong positioning in Emerging Markets
2014In-licensing agreement with Merck for Tildrakizumab a biologic for psoriasis
Global Markets Strengthening the specialty product pipeline
2014 Acquired Pharmalucence US Sterile injectable capacity in the US
2013 Acquired URL’s generic business US Adds 107 products to US portfolio
2012 Acquired DUSA Pharma, Inc. US Access to branded derma product
2010Acquired Taro Pharmaceutical Industries Ltd.
IsraelDermatology & Topical ProductManufacturing Plant at Israel & Canada
1997 Acquired Caraco Detroit, US Entry into US Market

-
50
100
150
200
250
300
350
FY94
FY95
FY96
FY97
FY98
FY99
FY00
FY01
FY02
FY03
FY04
FY05
FY06
FY07
FY08
FY09
FY10
FY11
FY12
FY13
FY14
FY15
FY16
FY17
FY18
Sales (Rs Bn) EBITDA (Rs Bn)
Successful track record of turning around acquisitions
© Sun Pharmaceutical Industries Limited. All Rights Reserved. 15
8 Early Acquisitions 4 Acquisitions Recent Acquisitions
TaroDusa URLRanbaxyInSite VisionOcular TechOdomzoYonsa
Assets of: BryanHungary Able LabsChattem
ROCE 14%27%20%30%22%19%41%35%23%26%27% 16% 8%

US Business
© Sun Pharmaceutical Industries Limited. All Rights Reserved. 16
34% of Revenues
© Sun Pharmaceutical Industries Limited. All Rights Reserved. 17
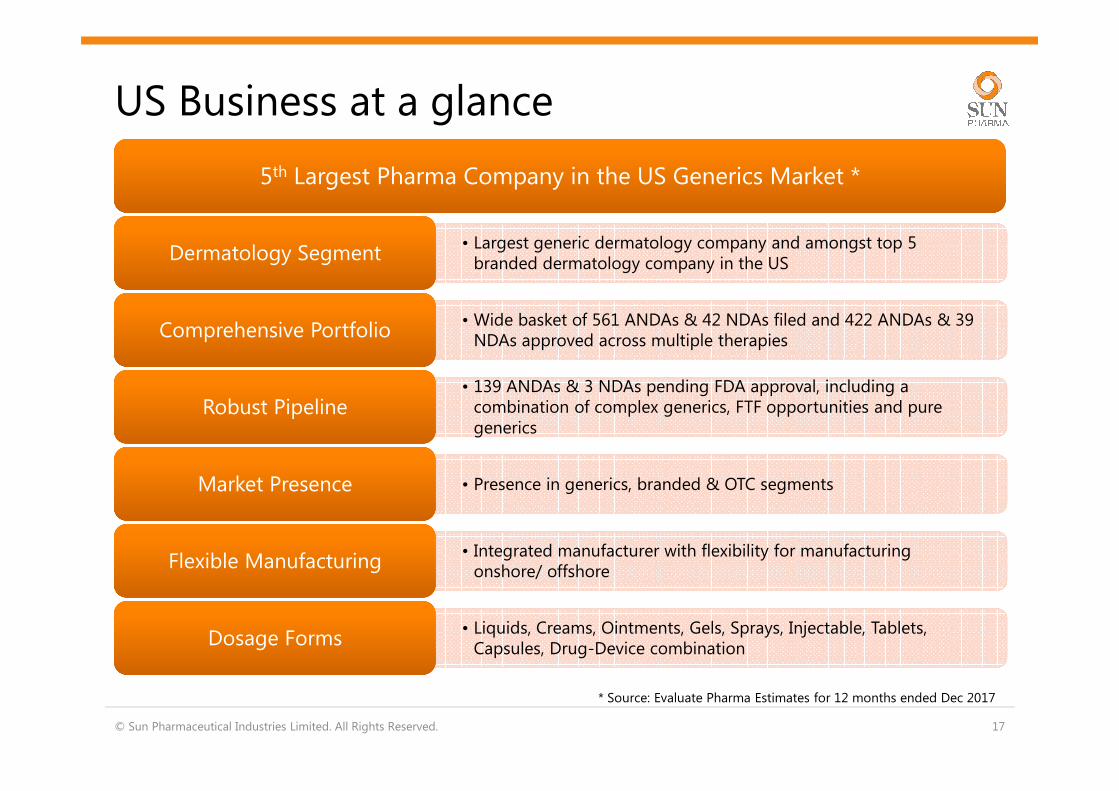
US Business at a glance
5th Largest Pharma Company in the US Generics Market *5th Largest Pharma Company in the US Generics Market *
• Largest generic dermatology company and amongst top 5 branded dermatology company in the US
Dermatology Segment Dermatology Segment
• Wide basket of 561 ANDAs & 42 NDAs filed and 422 ANDAs & 39 NDAs approved across multiple therapies
Comprehensive PortfolioComprehensive Portfolio
• 139 ANDAs & 3 NDAs pending FDA approval, including a combination of complex generics, FTF opportunities and pure generics
Robust Pipeline Robust Pipeline
• Presence in generics, branded & OTC segmentsMarket PresenceMarket Presence
• Integrated manufacturer with flexibility for manufacturing onshore/ offshore
Flexible Manufacturing Flexible Manufacturing
• Liquids, Creams, Ointments, Gels, Sprays, Injectable, Tablets, Capsules, Drug-Device combination
Dosage Forms Dosage Forms
* Source: Evaluate Pharma Estimates for 12 months ended Dec 2017

US Business - Significant Ramp-up in Sales
© Sun Pharmaceutical Industries Limited. All Rights Reserved. 18
14 15 11 23
35
62
98
137 135 138
87
FY08
FY09
FY10
FY11
FY12
FY13
FY14
FY15
FY16
FY17
FY18
Sales in Rs billion
10 year CAGR 20%
Key Milestones in US
• Entry in US through Caraco acquisitionFY98
• Acquired Taro Pharma – Entry into US dermatology market
FY10
• Acquired DUSA - Entry in branded specialty market
FY13
• Acquired URL’s generic businessFY13
• Acquired Pharmalucence -access to sterile injectable capacity
FY14
• Acquired InSite Vision – Strengthen ophthalmic portfolio
FY16
• Tildrakizumab filing in US & Europe market
• Acquired Ocular Technologies giving access to OTX-101, a product for treating dry eyes.
• Launched BromSite in US
• Acquired Odomzo- branded oncology product from Novartis
FY17
• Launched Odomzo in US
• Settlement of Patent Litigation for Generic Linzess® in US
• US FDA approval for Ilumya
FY18

ANDA Pipeline - Significant ramp up
397
449478
597572 584
561
250
311344
438413 427 422
FY12 FY13 FY14 FY15 FY16 FY17 FY18
Cumulative Products Filed Cumulative Products Approved
© Sun Pharmaceutical Industries Limited. All Rights Reserved. 19
(Cumulative no’s for FY16 are lower than FY15 due to Bryan facility divestment.Taro numbers added since Mar 2011, URL numbers added since Mar 2013 & Ranbaxy numbers added for March’15)
110
97
60
46
30
1915
127
26
Ski
n
CN
S
CV
S
Pai
n
Alle
rgy
On
colo
gy
Meta
bo
lism
An
tib
ioti
c
Gas
tro
Oth
er
ANDAs Filed and Approved 422 ANDA Approvals by Therapeutic Area
(As of March’18)

India Branded Generic Business
© Sun Pharmaceutical Industries Limited. All Rights Reserved. 20
31% of Revenues

© Sun Pharmaceutical Industries Limited. All Rights Reserved. 21
India Business at a glance
No. 1 in IndiaNo. 1 in India
• No. 1 ranked with 8.5% market share
• Growth of 6% equal to average industry growth of 6% Market Position** Market Position**
• No. 1 ranked by prescriptions with 13 different classes of doctorsPrescription Ranking##Prescription Ranking##
• Market leader in the chronic segmentChronic Segment Chronic Segment
• Strong positioning in the acute segmentAcute Segment Acute Segment
• Specializes in technically complex products and offers a complete therapy basket
Product OfferingProduct Offering
• 30 brands in the country’s top 300 pharmaceutical brandsStrong Brand Positioning** Strong Brand Positioning**
• Top 10 Brands contribute approx. 18% of India revenues
• Growth driven by a basket of brands – low product concentration De-risked Growth**De-risked Growth**
• 9,200+ strong field force covering over 600,000* doctorsExtensive Sales Force Extensive Sales Force
** - As per AIOCD AWACS data for 12 months ended March’18## - As per SMSRC data for Feb’18 * Does not exclude overlaps

Largest Pharma Company in India
475
518
527
557
586
641
669
672
770
850
1,155
Emcure+Zuventus 2.6%
Intas 2.8%
Macleods 2.8%
Glaxo 3.0%
Torrent 3.2%
Alkem + Cachet + Indchemie 3.5%
Lupin 3.6
Mankind 3.6%
Zydus + Biochem 4.2%
Cipla 4.6%
Abbott + Abbott HC + Novo 6.2%
Sun Pharma 8.5% 1,572
© Sun Pharmaceutical Industries Limited. All Rights Reserved. 22
Market Share Branded Generic Sales in India as of 12 Months ended Mar 2018 (US$ in mn)
Source: AIOCD AWACS MAT Mar 2018 data converted at average of Rs. 64.46/US$

Cardiology
18%
Neuro-Psychiatry
18%
Gastroenterology
12%Anti-Infectives
10%
Diabetology, 9%
Pain / Analgesics
7%
Dermatology, 6%
Gynaecology, 4%
Vitamins /
Minerals /
Nutrients, 4%
Respiratory 4%
Opthalmology 2%Others
6%
Market Share 8.5%
India Business – Sales ramp-up
© Sun Pharmaceutical Industries Limited. All Rights Reserved. 23
15
20 17
24
29 30
37
67
71
77 80
FY08
FY09
FY10
FY11
FY12
FY13
FY14
FY15
FY16
FY17
FY18
• As per AIOCD AWACS – March ‘18
Leadership in chronic segment; Strong positioning in acute segment32 brands in top 300 brands of country
Sales in Rs Billion
10 year CAGR 18%Therapeutic Revenue Break-up

• Sun pharma market share has consistently increased from 2.4% in 2000 to 8.0% in 2017 (IMS Data for March’18)
• 9,200+ sales representatives
• Covering over 600,000* doctors
© Sun Pharmaceutical Industries Limited. All Rights Reserved. 24
Strong Customer Focus Drives Market Share Gains
Therapy focused marketing Strong increase in market share
* Does not exclude overlaps
Year Year Year Year ----2000200020002000 %%%%
Sun PharmaSun PharmaSun PharmaSun Pharma 2.42.42.42.4
Cipla 4.7
Lupin 2.0
Cadila 3.8
DRL 2.6
Torrent 1.8
Glenmark 1.0
Wockhardt 2.2
Ipca 1.1
Ranbaxy 4.8
Market Share (%) as per IMS Dec MAT
Year Year Year Year ----2005200520052005 %%%%
Sun PharmaSun PharmaSun PharmaSun Pharma 3.33.33.33.3
Cipla 5.1
Lupin 2.2
Cadila 3.7
DRL 2.3
Torrent 1.9
Glenmark 1.2
Wockhardt 1.9
Ipca 1.3
Ranbaxy 4.9
Year Year Year Year ----2010201020102010 %%%%
Sun PharmaSun PharmaSun PharmaSun Pharma 3.73.73.73.7
Cipla 5.4
Lupin 2.7
Cadila 3.7
DRL 2.3
Torrent 2.0
Glenmark 1.5
Wockhardt 2.0
Ipca 1.4
Ranbaxy 4.9
Year Year Year Year ----2015201520152015 %%%%
Sun PharmaSun PharmaSun PharmaSun Pharma 8.08.08.08.0
Cipla 5.2
Lupin 3.2
Cadila 3.4
DRL 2.4
Torrent 2.4
Glenmark 2.0
Wockhardt 1.6
Ipca 1.5
Unichem 1.0
Year Year Year Year ----2017201720172017 %%%%
Sun PharmaSun PharmaSun PharmaSun Pharma 8.08.08.08.0
Cipla 5.2
Lupin 3.5
Cadila 3.2
DRL 2.2
Torrent 3.3
Glenmark 2.2
Wockhardt 1.5
Ipca 1.5
FDC 1.0

Creating Lasting Value - Investor Presentation 25
*Ranks based on prescription shareSource-Strategic Marketing Solutions and Research Centre (SMSRC) Prescription Data
Number 1 Ranking with 13 Doctor Categories*
Leadership in key therapeutic areas*
Prescription RankingPrescription RankingPrescription RankingPrescription Ranking
SpecialistSpecialistSpecialistSpecialist Feb ’15Feb ’15Feb ’15Feb ’15 Feb ‘16Feb ‘16Feb ‘16Feb ‘16 Feb ‘17Feb ‘17Feb ‘17Feb ‘17 Feb ‘18Feb ‘18Feb ‘18Feb ‘18
Psychiatrists 1 1 1 1
Neurologists 1 1 1 1
Cardiologists 1 1 1 1
Orthopaedic 1 1 1 1
Gastroenterologists 1 1 1 1
Nephrologists 1 1 1 1
Diabetologists 1 1 1 1
Consulting Physicians 1 1 1 1
Dermatologists 1 1 1 1
Urologists 1 1 1 1
Oncologists 2 1 1 1
Ophthalmologists 1 1 2 1
Chest Physicians 1 1 2 1

11.1
10.1
11.0
7.47.8
7.58.6
FY12 FY13 FY14 FY15 FY16 FY17 FY18
Sales Per Representative (Rs. Mn)
Impact of Ranbaxy Acquisition
Best-in-class field force productivity
© Sun Pharmaceutical Industries Limited. All Rights Reserved. 26
Field Force Productivity
• Rs 8.6 Mn/ MRSun
Pharma
• Rs 5.2 Mn/ MRIndustry Average*
• Well trained and scientifically oriented sales representatives team with strong performance track record
• Field force with highest productivity amongst key players in India
Sales Per Representative (Rs. Mn)
* Approximation based on brokerage reports

Emerging Markets
© Sun Pharmaceutical Industries Limited. All Rights Reserved. 27
18% of Revenues

© Sun Pharmaceutical Industries Limited. All Rights Reserved. 28
Emerging Markets Business at a glance
Largest Indian Company in Emerging MarketsLargest Indian Company in Emerging Markets
• Presence in over 100 marketsGlobal footprintGlobal footprint
• Brazil, Mexico, Russia, Romania, South Africa and complementary & affiliated markets
Focus MarketsFocus Markets
• Extensive basket of branded productsProduct PortfolioProduct Portfolio
• Strong relationships with doctors and medical practitionersCustomer FocusCustomer Focus
• Approximately 2,300 Sales RepresentativesSales ForceSales Force
• To cross-sell products between Sun Pharma and Ranbaxy marketing infrastructure
OpportunityOpportunity
• Across 7 countriesLocal ManufacturingLocal Manufacturing
• Acquired Biosintez to enhance presence in Russian market in Nov’ 16 – Gives access to local manufacturing facility.
Russia AcquisitionRussia Acquisition

Western Europe, Canada, Japan, ANZ & Other Markets
© Sun Pharmaceutical Industries Limited. All Rights Reserved. 29
11% of Revenues

© Sun Pharmaceutical Industries Limited. All Rights Reserved. 30
Western Europe & Other Markets at a glance
Amongst the leading Indian CompaniesAmongst the leading Indian Companies
• Across all major markets in Western Europe, Canada, A&NZ, Japan and few other markets
Market PresenceMarket Presence
• Expanding basket of products including injectables and hospital products as well as products for retail market
Product PortfolioProduct Portfolio
• Development and commercialization of complex generics and differentiated products to drive sustainable and profitable growth
Focus Focus
• Distribution led modelSales Force Sales Force
• At Canada, Israel and Hungary + Servicing from India facilitiesLocal ManufacturingLocal Manufacturing
• Acquired 14 established prescription brands from Novartis in March’16
Japan EntryJapan Entry

Global Consumer Healthcare Business
© Sun Pharmaceutical Industries Limited. All Rights Reserved. 31

© Sun Pharmaceutical Industries Limited. All Rights Reserved. 32
Global Consumer Healthcare Businessat a glance
An Attractive OpportunityAn Attractive Opportunity
• Amongst the top 10 consumer healthcare companiesIndiaIndia
• Operates in about 20+ countriesGlobal PresenceGlobal Presence
• Core markets include. India, Russia, Romania, Nigeria, South Africa & Myanmar
• Growth markets include Ukraine, Poland, Kazakhstan, Thailand & UAE
Market FocusMarket Focus
• Enjoy strong brand equity in 4 countriesStrong Brand EquityStrong Brand Equity
• Promoted through dedicated sales force in each marketSales Force Sales Force
• Amongst top 10 consumer healthcare companies in India, Romania, Nigeria & Myanmar
Strong PositioningStrong Positioning

Active Pharmaceutical Ingredients (API) Business
© Sun Pharmaceutical Industries Limited. All Rights Reserved. 33
6% of Revenues

API Business
© Sun Pharmaceutical Industries Limited. All Rights Reserved. 34
Backward Integration – Strategic ImportanceBackward Integration – Strategic Importance
• Backward integration provides cost competitiveness and supply reliability
Strategic ImportanceStrategic Importance
• Large generic and innovator companiesCustomersCustomers
• Approximately 300 APIsProduct PortfolioProduct Portfolio
• Approx. 20 APIs scaled up annuallyPipeline DevelopmentPipeline Development
• 291 DMF/CEP approvals to date
• 396 DMF/CEP Filings to dateRegulatory approvalsRegulatory approvals
• Across 14 facilitiesManufacturingManufacturing
• Acquired GSK’s Opiates business in Australia in Sept’15Opiates BusinessOpiates Business

Research & Development
© Sun Pharmaceutical Industries Limited. All Rights Reserved. 35

© Sun Pharmaceutical Industries Limited. All Rights Reserved. 36
Research & Development
Cumulative R&D Spend of over Rs 130 billion to dateCumulative R&D Spend of over Rs 130 billion to date
• R&D spend at 8.6% of Net Sales for FY18
• Strong cash flows & large scale to support R&D investments R&D Spend R&D Spend
• Strong research teams in generics, finished dosage development, biological support, chemistry
CapabilitiesCapabilities
• 2,000 scientists globally with capabilities across dosage forms like orals, liquids, ointments, gels, sprays, injectables
OrganizationOrganization
• Strong team of intellectual property experts supporting R&D (internal and external lawyers)
IPR SupportIPR Support
• Developing non infringing formulations and development of specialty/complex products
FocusFocus

4.4
7.0
10.4
19.6
23.0 23.1 22.5
FY12 FY13 FY14 FY15 FY16 FY17 FY18
R&D Investments (Rs Bn) R&D Investments (% of Sales)
Filed Approved
R&D Investments
© Sun Pharmaceutical Industries Limited. All Rights Reserved. 37
As of Mar 31, 2018
5.6% 6.5% 7.2% 8.3% 7.6% 8.6%6.3%
Filed Approved Filed Granted
ANDA DMF/CEP Patents
R&D Investments Filings and Approvals
561
422
396
291
1106
1065
Filed Approved
NDA/BLA
42
39

Global Manufacturing Presence
© Sun Pharmaceutical Industries Limited. All Rights Reserved. 38

© Sun Pharmaceutical Industries Limited. All Rights Reserved. 39
Global Manufacturing Presence
World Class Manufacturing InfrastructureWorld Class Manufacturing Infrastructure
• 41 manufacturing facilities across India, the Americas, Asia, Africa, Australia and Europe
Extensive Global FootprintExtensive Global Footprint
• Vertically integrated network across six continents enabling high quality, low cost and a quick market entry across the geographies
Integrated Network Integrated Network
• One of the few companies that has set up completely integrated manufacturing capability for the production of oncology, hormones, peptides, controlled substances and steroidal drugs
CapabilitiesCapabilities
• High quality manufacturing facilities. Many of the plants have received approvals from US FDA, UK MHRA and various other regulatory authorities
High Quality High Quality
• Ability to manufacture a variety of dosage forms – Orals, Creams, Ointments, Injectables, Sprays, Liquids
Dosage FormsDosage Forms

Formulation Plant API Plant Formulation & API Plant
© Sun Pharmaceutical Industries Limited. All Rights Reserved. 40
Global Manufacturing Footprint
Ahmednagar
Maduranthakam
Jammu
Bangladesh Plant
Sikkim (2 units)
HalolKarkhadi
AnkleshwarPanoli
Silvassa
Dadra
Ontario (Canada)
Tennessee
Wilmington M.A.
Cranbury
Tiszavasvari(Hungary)
Haifa (Israel)
Toansa
Malanpur
Dewas
Paonta
Goa
Mohali
Baddi
New Jersey(US) Lagos (Nigeria)
Be-Tabs,South Africa)
Kuala Lumpur(Malaysia)
Cluj (Romania)
Giza, (Egypt)
(US)(US)(US)(US)
(India)(India)(India)(India)(India)(India)(India)(India)
Billerica, MA
Dahej
Port Fairy (Australia)
Latrobe, (Australia)
Penza (Russia)
Guwahati

• India : 13, US : 4
• Canada, Hungary , Israel, Bangladesh, South Africa, Malaysia, Romania, Egypt, Nigeria
and Russia : 1 each
• Capacities available for a variety of finished dosages
© Sun Pharmaceutical Industries Limited. All Rights Reserved.
41
Finished Dosage Manufacturing
27 Finished dosage manufacturing sites
� Tablets / Capsules
� Semisolids
� Liquids
� Suppository
� Vials
� Ampoules
� Pre-filled Syringes
� Gels
� Lyophilized Units
� Dry powder
� Eye drops
� MDI
� Aerosols
� Creams
� Ointments
Injectables / Sterile Orals Topicals

• Controlled substances
manufacture
• India : 9, Australia : 2, Israel : 1, US : 1, Hungary : 1
© Sun Pharmaceutical Industries Limited. All Rights Reserved.
42
API Manufacturing
14 API manufacturing locations
• International regulatory
approvals: USFDA,
European
• Stand alone units for
peptides, anti-cancer,
steroids, sex hormones
Panoli & Ahmednagar (both India)
APIKey Plants
Australia, Hungary &
Tennessee (US)

Vivek C. Sehgal
Chairman, Samvardhana
Motherson Group &
Motherson Sumi
Systems Ltd.
. © Sun Pharmaceutical Industries Limited. All Rights Reserved. 43
Corporate Governance
Our philosophy on corporate governance envisages
working towards high levels of transparency,
accountability and consistent value systems across
all facets of operations
Chairman
Israel Makov
Former President
& CEO of Teva
Pharma. Industries Ltd.
Independent Director
Ashwin Dani
Non-Executive Vice
Chairman,
Asian Paints Ltd..
Rekha Sethi
Director General
All India Management
Association (AIMA)
Independent Directors
Keki Mistry
Vice Chairman
& CEO, HDFC Ltd.
.
S. Mohanchand
Dadha
Former Chairman &
Managing Director, TDPL
.
Independent Directors
Independent Director
Independent Director
Gautam B. Doshi
Independent Director
A professional with expertise
in M&A, Taxation, Accounting and
Corporate and Commercial Laws.

Financials
© Sun Pharmaceutical Industries Limited. All Rights Reserved. 44

FY14FY14FY14FY14 YoYYoYYoYYoY FY15FY15FY15FY15 YoYYoYYoYYoY FY16FY16FY16FY16 YoYYoYYoYYoY FY17FY17FY17FY17 YoYYoYYoYYoY FY18FY18FY18FY18 YoYYoYYoYYoY
P&L SummaryP&L SummaryP&L SummaryP&L Summary
Sales 1,60,044 42% 2,72,451 70% 2,78,881 2% 3,02,642 9% 2,60,659 -14%
Gross Profit 1,32,250 44% 2,05,059 55% 2,15,577 5% 2,21,335 3% 1,86,413 -16%
EBITDA 71,141 45% 77,208 9% 75,594 -2% 87,751 16% 51,846 -41%
Net Profit 31,415 5% 45,394 44% 45,457 0% 69,644 53% 21,616 -69%
Net Profit (Adjusted) 56,589 59% 47,771 -16% 52,309 9% 69,644 33% 33,665 -52%
R&D Spend 10,418 48% 19,550 88% 23,025 18% 23,138 0% 22,489 -3%
BS SummaryBS SummaryBS SummaryBS Summary Mar'14Mar'14Mar'14Mar'14 YoYYoYYoYYoY Mar'15Mar'15Mar'15Mar'15 YoYYoYYoYYoY Mar'16 Mar'16 Mar'16 Mar'16 YoYYoYYoYYoY Mar'17 Mar'17 Mar'17 Mar'17 YoYYoYYoYYoY Mar'18 Mar'18 Mar'18 Mar'18 YoYYoYYoYYoY
Shareholders Funds 1,85,250 24% 2,80,415 51% 3,29,825 18% 3,66,397 11% 3,81,006 4%
Loan Funds 24,890 75,724 204% 83,164 10% 80,910 -3% 97,518 21%
Net Fixed Assets 58,242 15% 96,848 66% 1,24,130 28% 1,49,404 20% 1,57,110 5%
Investments 27,860 16% 35,028 26% 18,298 -48% 11,919 -35% 71,430 499%
Cash and Bank Balances 75,902 87% 1,09,771 45% 1,31,817 20% 1,51,408 15% 99,290 -34%
Inventory 31,230 21% 56,669 81% 64,225 13% 68,328 6% 68,810 1%
Sundry Debtors 22,004 -9% 50,928 131% 67,757 33% 72,026 6% 78,150 9%
Sundry Creditors 13,283 26% 32,430 144% 35,830 10% 43,954 23% 47,660 8%
© Sun Pharmaceutical Industries Limited. All Rights Reserved. 45
FinancialsMarket Capitalisation Rs. 1,170 billion / US$ 17 billion
Exchange Rate : For Market Capitalisation US$1 = Rs 67.62(As on 31 May 2017)
# Adjusted for Rs 25.17 bn provision related to generic Protonix settlement for the year FY14 and adjusted for Rs 2.4 bn for settlement provision for Texas Medicaid Program litigation for FY15 and adjusted for Rs 6.9 bn of exceptional items related to Ranbaxy integration for FY16 and adjusted for Rs 12.1 bn provision related to Modafinil settlement & deferred tax adjustment for the year FY18.
# #
( All Figures in Rs. Mn )
##

© Sun Pharmaceutical Industries Limited. All Rights Reserved. 46
Sales Break-up
71 77 80
135138
87
3645
48
22
26
30
15
16
15
FY16 FY17 FY18
India Formulations US Formulations
Emerging Markets Rest of World
API+Others
1093 1155 1246
2066 2051
1357
548675
751
330385
461
225245
229
FY16 FY17 FY18
279 303 261 4,262 4,511Sales
#Exchange Rate : US$1 = Rs 65.43 (for FY16)US$1 = Rs 67.07 (for FY17)US$1 = Rs 64.46 (for FY18)
4,044
In INR Billion In USD Million

© Sun Pharmaceutical Industries Limited. All Rights Reserved. 47
EBITDA Trend
44% 44%
29% 27% 29%20%
24% 25%
30% 33% 28%
31%
14% 13%
16% 17%16%
21%
19% 17%25% 23%
27% 28%
FY13 FY14 FY15 FY16 FY17 FY18
EBITDA Other Expenditure Personnel Costs Material Costs
% of Sales
112 160 272 279 303 261Sales
In INR Billion

© Sun Pharmaceutical Industries Limited. All Rights Reserved. 48
Cash Flow
22
34
40
56
67
71
FY12 FY13 FY14 FY15 FY16 FY17
15
25
31
33 33 34
FY12 FY13 FY14 FY15 FY16 FY17
Net Cash From Operating Activities (Rs Bn) Free Cash Flow (Rs Bn)

FY14FY14FY14FY14 FY15FY15FY15FY15 FY16FY16FY16FY16 FY17FY17FY17FY17 FY18FY18FY18FY18
Growth (%)Growth (%)Growth (%)Growth (%)
Sales 42.4 70.2 2.4 8.5 (13.9)
Gross Profit 44.4 55.1 5.1 2.7 (15.8)
EBITDA 45.0 8.5 (2.1) 16.1 (40.9)
Net Profit 5.3 44.5 0.1 53.2 (69.0)
Net Profit (Adjusted) 58.7 (15.6) 9.5 33.1 (51.7)
Margins (%)Margins (%)Margins (%)Margins (%)
Gross Margin 82.6 75.3 77.3 73.1 71.5
EBITDA Margin (%) 44.5 28.3 27.1 29.0 19.9
Net Margin 19.6 16.7 16.3 23.0 8.3
Net Margin (Adjusted) 35.4 17.5 18.8 23.0 12.9
Return (%)Return (%)Return (%)Return (%)
ROCE 26.9 14.3 14.6 16.1 7.8
ROE 30.9 18.5 17.6 19.8 8.9
OthersOthersOthersOthers
Debt / Equity 0.13 0.27 0.25 0.22 0.26
Fully Diluted (USD) EPS 15.2 18.9 18.9 28.9 9.0
Fully Diluted EPS (USD) (Adjusted) 27.3 19.9 21.7 28.9 14.0
R&D Spend % of Net SalesR&D Spend % of Net SalesR&D Spend % of Net SalesR&D Spend % of Net Sales 6.5 7.2 8.3 7.6 8.6
Revenue 6.2 6.7 8.0 7.1 7.9
Capital 0.3 0.4 0.3 0.6 0.7
© Sun Pharmaceutical Industries Limited. All Rights Reserved. 49
Financial Ratios
# # Adjusted for Rs 25.17 bn provision related to generic Protonix settlement for the year FY14 and adjusted for Rs 2.4 bn for settlement provision for Texas Medicaid Program litigation for FY15 and adjusted for Rs 6.9 bn of exceptional items related to Ranbaxy integration for FY16 and adjusted for Rs 12.1 bn provision related to Modafinil settlement & deferred tax adjustment for the year FY18.
#
#
# # #
# #
# ##
#
#

Q4 FY18Q4 FY18Q4 FY18Q4 FY18 Q4 FY17Q4 FY17Q4 FY17Q4 FY17 CHANGECHANGECHANGECHANGE FY18FY18FY18FY18 FY17FY17FY17FY17 CHANGECHANGECHANGECHANGE
Gross SalesGross SalesGross SalesGross Sales 67,11067,11067,11067,110 68,25268,25268,25268,252 -2%-2%-2%-2% 2,60,6602,60,6602,60,6602,60,660 3,02,6423,02,6423,02,6423,02,642 -14%-14%-14%-14%
Gross Profit 49,410 46,300 7% 1,86,413 2,21,335 -16%
Gross Margin 74% 68% 72% 73%
EBITDA 14,174 12,357 15% 51,846 75,394 -31%
EBITDA Margin 21% 18% 20% 25%
Net Profit 13,090 12,237 7% 21,616 69,644 -69%
Net margin 20% 18% 8% 23%
Net Profit (Adjusted)Net Profit (Adjusted)Net Profit (Adjusted)Net Profit (Adjusted) 10,50410,50410,50410,504 12,23712,23712,23712,237 -14%-14%-14%-14% 33,66533,66533,66533,665 69,64469,64469,64469,644 -52%-52%-52%-52%
Net margin (Adjusted) 16% 18% 13% 23%
R&D 7,428 6,002 24% 22,489 23,138 -3%
R&D as % of Net Sales 11.1% 8.8% 8.6% 7.6%
EPS (Diluted) INR 5.5 5.1 7% 9.0 29.0 -69%
EPS (Diluted) INR (Adjusted) 4.4 5.1 -14% 14.0 29.0 -52%
© Sun Pharmaceutical Industries Limited. All Rights Reserved. 50
Key Financials Q4 & FY18( All Figures in Rs. Mn )
# #
##
# : Adjusted for tax for Q4FY18 includes one-time benefits of Rs. 259 crores related to deferred tax.# : Adjusted for Rs 12.1 bn provision related to Modafinil settlement & deferred tax adjustment for the year FY18

36%
29%19%
11%
5%
© Sun Pharmaceutical Industries Limited. All Rights Reserved. 51
Sales Breakup Q4 & FY18( All Figures in Rs. Mn )
US Formulations
India Branded Generics
Emerging Markets
Western Europe & Other Markets #
API & Others 37%
28%18%
11%
6%
Q4 FY18
Q4 FY17
# Includes Western Europe, Canada, Japan, Australia, New Zealand and other markets
Q4 FY18Q4 FY18Q4 FY18Q4 FY18 Q4 FY17Q4 FY17Q4 FY17Q4 FY17 CHANGECHANGECHANGECHANGE FY18FY18FY18FY18 FY17FY17FY17FY17 CHANGECHANGECHANGECHANGE
FormulationFormulationFormulationFormulation
India 19,626 19,164 2% 80,293 77,491 4%
US 23,716 25,545 -7% 87,466 1,37,588 -36%
Emerging Markets 12,794 12,127 5% 48,392 45,299 7%
ROW 7,437 7,323 2% 29,740 25,832 15%
Sub-totalSub-totalSub-totalSub-total 63,57363,57363,57363,573 64,15964,15964,15964,159 -1%-1%-1%-1% 2,45,8912,45,8912,45,8912,45,891 2,86,2102,86,2102,86,2102,86,210 -14%-14%-14%-14%
Bulk 3,324 3,955 -16% 13,993 15,979 -12%
Others 213 138 54% 775 454 71%
Gross SalesGross SalesGross SalesGross Sales 67,11067,11067,11067,110 68,25268,25268,25268,252 -2%-2%-2%-2% 2,60,6602,60,6602,60,6602,60,660 3,02,6423,02,6423,02,6423,02,642 -14%-14%-14%-14%

Key Milestones targeted for future
© Sun Pharmaceutical Industries Limited. All Rights Reserved. 52
• Enhance share of specialty/branded business
• Continue to focus on complex generics and high entry barrier segments
• Ensure broad product offering to customers across multiple dosage forms
• Gain critical mass in key therapeutic segments
US Business
US Business
• Improve productivity of India business
• Maintain leadership position in a fiercely competitive market
• Continuously innovate to ensure high brand equity with doctors
India Business
India Business
• Gain critical mass in key emerging markets
• Enhance product basket in emerging markets
• Improve profitability in developed European markets
RoW Business
RoW Business

Key Milestones targeted for future
© Sun Pharmaceutical Industries Limited. All Rights Reserved. 53
• Maintain leadership in existing markets through focus on innovative solutions
• Enhance presence in high growth markets
Global Consumer
Healthcare
Global Consumer
Healthcare
• Develop more products through expanded R&D team for global markets
• Focus on developing complex products across multiple dosage forms
• Invest to further build on specialty pipeline
R&DR&D
• Ensuring 24x7 compliance to cGMP is imperative for a global business
• Continuously enhance systems, processes, human capabilities to ensure compliance with global regulatory standards
• Ensure resolution of consent decree at Ranbaxy’s facilities & Warning Letter at Halol
Regulatory/ Quality
Regulatory/ Quality
• Target sustainable and profitable growth
• Focus on ROCEFinancialFinancial

© Sun Pharmaceutical Industries Limited. All Rights Reserved. 54
FY19 Guidance
• Low double digit growth over FY18Consolidated RevenuesConsolidated Revenues
• Approximately 8%-9% of revenues to be invested in R&DR&D InvestmentsR&D Investments
• Invest in R&D and in building the specialty businessInvesting for FutureInvesting for Future

© Sun Pharmaceutical Industries Limited. All Rights Reserved. 55
Sun Pharma at a glance5th Largest Global Specialty Generic Company5th Largest Global Specialty Generic Company
• Ranked 5th in US* / Largest Indian Pharma Company in USUSUS
• No. 1 Pharma Company in IndiaIndiaIndia
• Amongst the largest Indian Pharma Company in Emerging Markets
Emerging MarketsEmerging Markets
• Expanding presence in EuropeEurope Europe
• 41 manufacturing sites across the worldManufacturing FootprintManufacturing Footprint
• Presence in more than 150 countries across branded and generic markets
Market PresenceMarket Presence
• Portfolio of more than 2,000 products across the worldProduct PortfolioProduct Portfolio
• 30,000+ global employee baseEmployeesEmployees
• Multiple facilities approved by various regulatory authorities across the world including USFDA
Quality ComplianceQuality Compliance
• Capabilities across dosage forms like injectables, sprays, ointments, creams, liquids, tablets and capsules
R&D and ManufacturingR&D and Manufacturing
• Specialty products, branded generics, complex generics, pure generics & APIs
Addressable SegmentsAddressable Segments
* Source: Evaluate Pharma Estimates for 12 months ended Dec 2017

Thank YouInvestors:
Nimish Desai
Tel : +91 22 4324 4324, Ext 2778
Tel Direct +91 22 43242778
Thank You! For more information please contact:
© Sun Pharmaceutical Industries Limited. All Rights Reserved. 56
© 2017 Sun Pharmaceutical Industries Limited., All Rights Reserved.“SUN Pharma”, The Sun Pharmaceutical Industries Logo are trademarks of Sun Pharmaceutical Industries Limited.
This material was used during an oral presentation; it is not a complete record of the discussion. This work may not be used, sold, transferred, adapted, abridged, copied or reproduced in whole on or in part in any manner or form or in any media without the prior written consent. All product names and company names and logos mentioned herein are the trademarks or registered trademarks of their respective owners.
Corporate Address:
SUN HOUSE, CTS No. 201 B/1, Western Express Highway, Goregaon (E), Mumbai 400063
NSE:SUNPHARMA, BSE: 524715, Reuters: SUN.BO, Bloomberg: SUNP INCIN: L24230GJ1993PLC019050www.sunpharma.com