
Corporate Presentation March 14 Final for Magna.pptx … · HK F&F CPL Aroma Flavourkey ...
30
Company Overview March 2014
Transcript of Corporate Presentation March 14 Final for Magna.pptx … · HK F&F CPL Aroma Flavourkey ...

Company OverviewMarch 2014
DISCLAIMERThis presentation includes statements data, forecasts, goals and Company plans that are "forward‐looking statements“, as defined in the Securities Law ‐ 1968, whose occurrence is not certain and which are not solely in the Company's control. These forward‐looking statements are included, inter alia, in discussions of strategy, objectives, goals, plans, events, future intentions or other information relating to future events or issues whose occurrence is not certain.
By their nature, forward‐looking statements involve risk and uncertainty. Whether the forward looking information occurs or not is affected, inter alia, by risk factors characteristic to the Company's operations and developments in the general environment and external factors which impact the Frutarom Group and its area of activities.
This forward looking information could include facts and data based on the Company's subjective assessment, including with regards to the current status of the Company and its business, the current situation in the industry in which the Frutarom Group operates, macro‐financial facts and information, all as are known to the Company on the date on which this presentation was prepared, some of which were given to the Company by external sources, the content of which was not independently examined by the Company, and therefore the Company is not responsible for their verity.
This presentation must be read together with the Company's periodic and immediate reports, and was not meant to replace the need for study of reports the Company has published, including, inter alia, the Company's periodic report for 2012, published on March 2013, and the Company's periodic reports subsequently published. These reports could include, inter alia, updates to the information regarding the Company's activities or of the forward looking statements appearing in this presentation.
Subject to the requirements of applicable law, the Company does not intend to update any industry information or forward‐looking statements appearing in this presentation, and is not required to publish any additional presentations for its shareholders in future.
It is to be emphasized that the financial estimations included in this presentation are based on figures which were not audited or reviewed by an auditor and therefore the actual results may differ from these financial estimations.
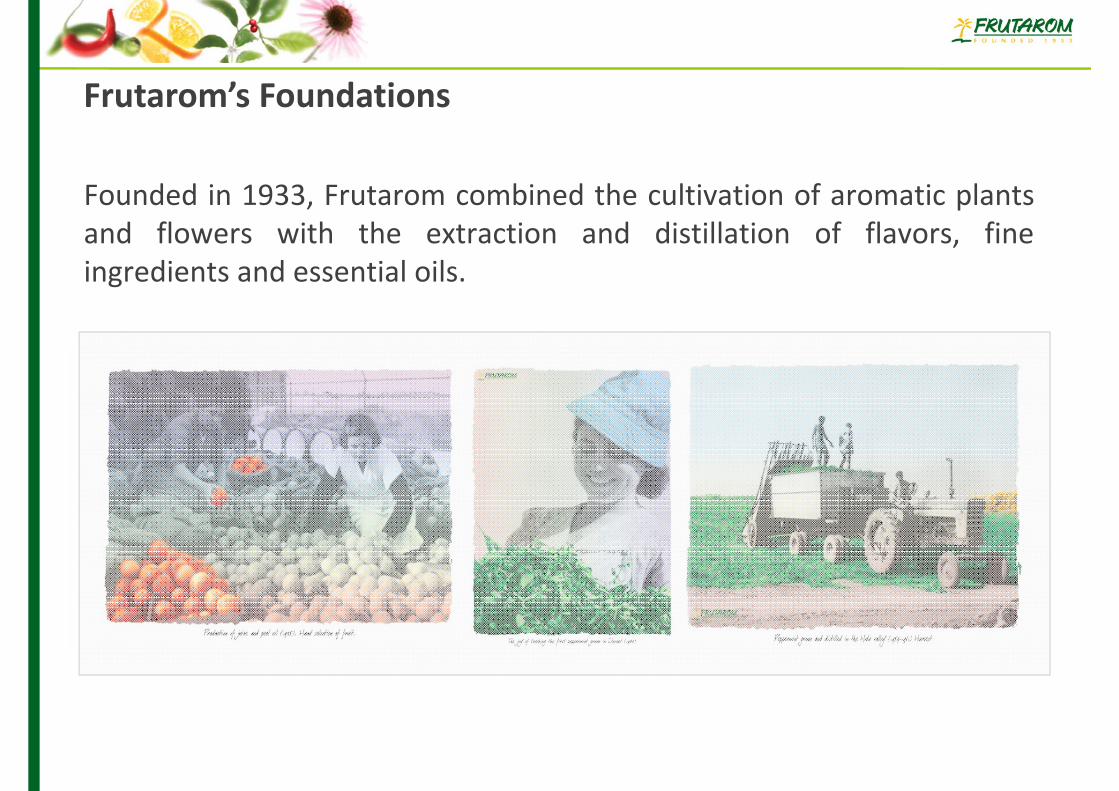
Frutarom’s Foundations
Founded in 1933, Frutarom combined the cultivation of aromatic plantsand flowers with the extraction and distillation of flavors, fineingredients and essential oils.
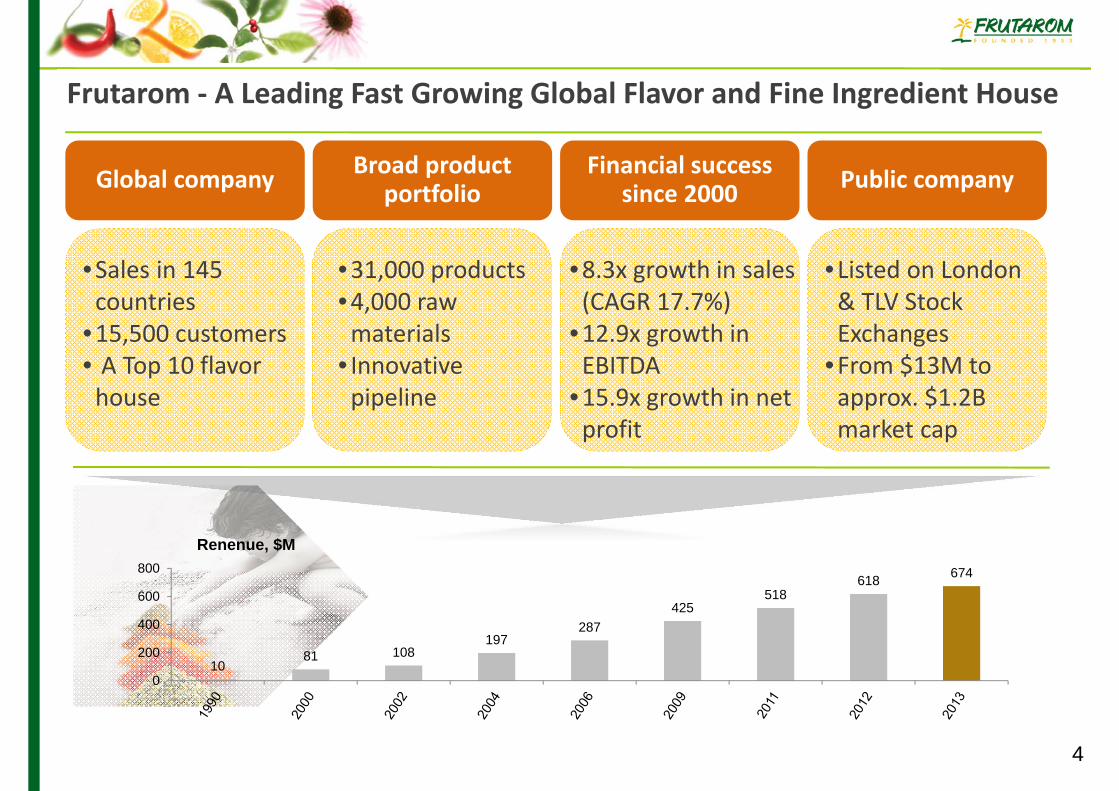
Frutarom ‐ A Leading Fast Growing Global Flavor and Fine Ingredient House
4
Global company Broad product portfolio Public companyFinancial success
since 2000
•Sales in 145 countries
•15,500 customers • A Top 10 flavor house
•31,000 products•4,000 raw materials
• Innovative pipeline
•Listed on London & TLV Stock Exchanges
•From $13M to approx. $1.2B market cap
•8.3x growth in sales (CAGR 17.7%)
•12.9x growth in EBITDA
•15.9x growth in net profit
1081 108
197287
425518
618 674
0
200
400
600
800
Renenue, $M
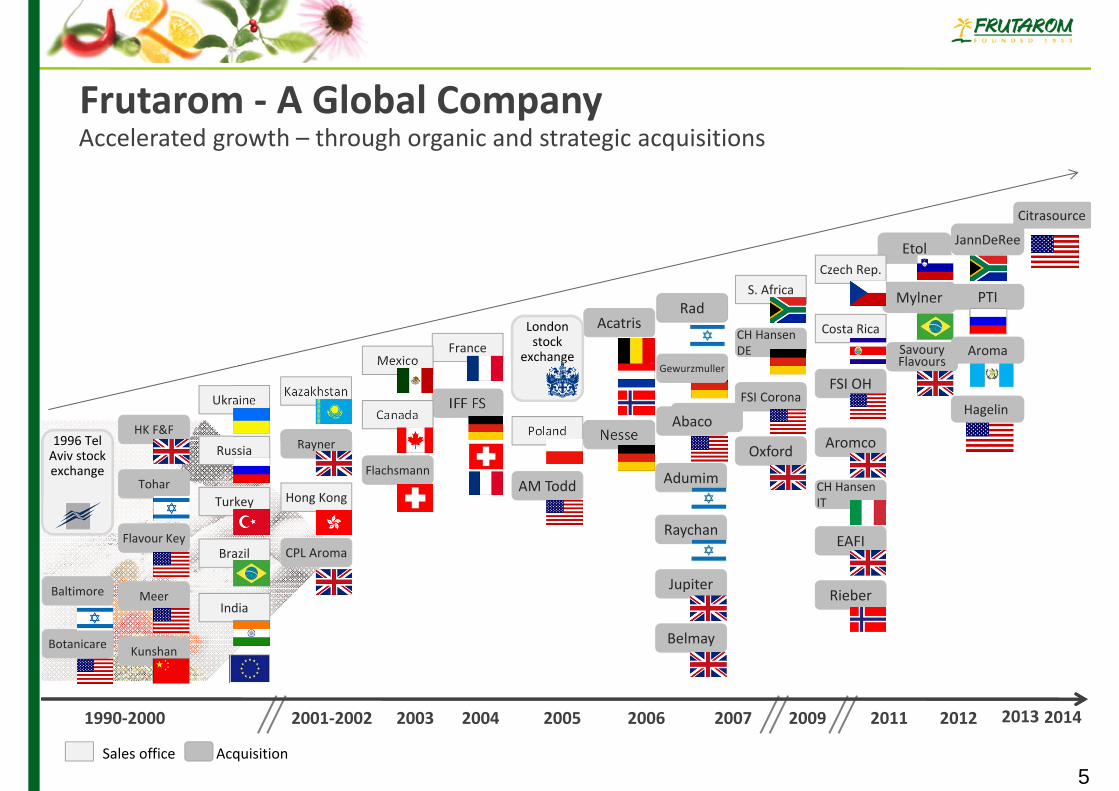
Frutarom ‐ A Global Company
5
Accelerated growth – through organic and strategic acquisitions
Sales office Acquisition
2006 2007 2009 20121990‐2000 2003 2004 20112001‐2002 2005 2013
1996 Tel Aviv stock exchange
IFF FS
Adumim
Raychan
Rieber
EAFI
SavouryFlavours
Oxford
Belmay
Jupiter
FSI Corona
Nesse
CH Hansen DE
CH Hansen IT
Etol
Mylner
Aromco
FSI OH
Acatris
Flachsmann
Abaco
Tohar
Meer
RaynerHK F&F
CPL Aroma Flavour Key
Baltimore
Botanicare Kunshan
AM Todd
London stock
exchange
Russia
Canada
Turkey
France Mexico
Ukraine
Poland
Kazakhstan
Hong Kong
Costa Rica
Czech Rep.S. Africa
India
Brazil
Gewurzmuller
Abaco
Rad
JannDeRee
PTI
Aroma
Hagelin
2014
Citrasource
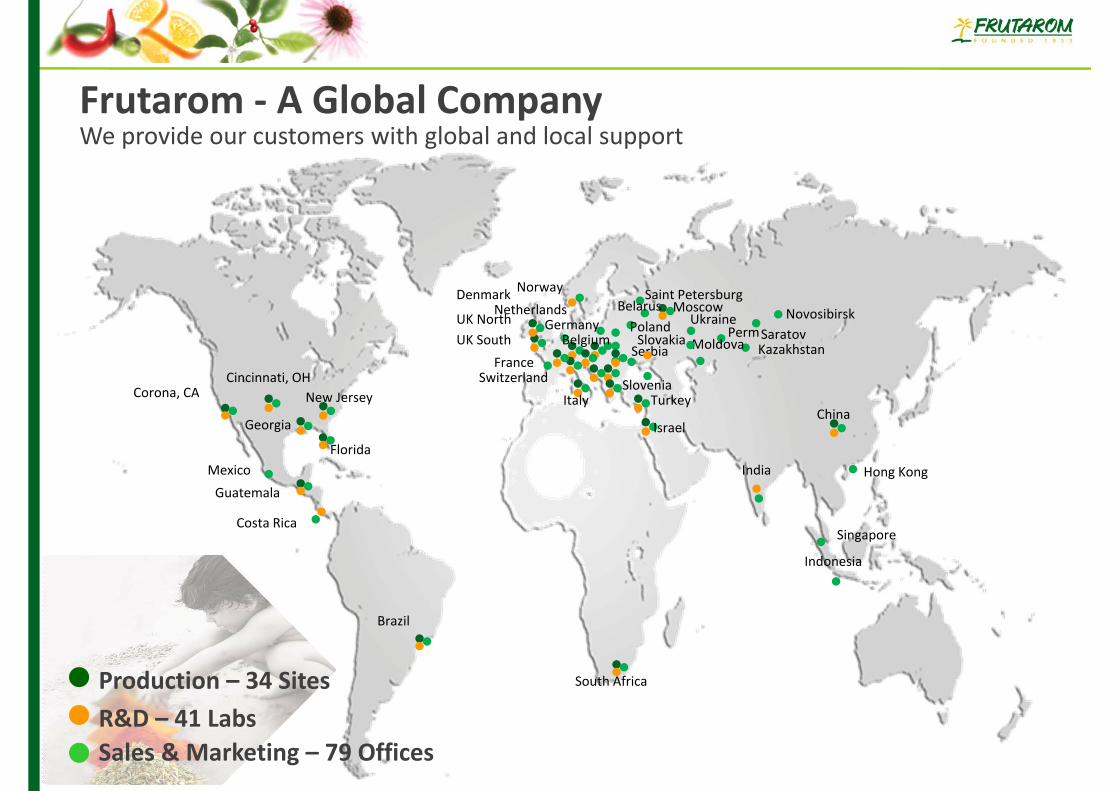
Sales & Marketing – 79 Offices
Production – 34 SitesR&D – 41 Labs
Frutarom ‐ A Global CompanyWe provide our customers with global and local support
Belgium
Brazil
China
Denmark
France
Germany
India
Indonesia
Israel
Italy
Kazakhstan
Mexico
NetherlandsNorway
Poland
Serbia
Singapore
Slovakia
Slovenia
South Africa
Turkey
UkraineUK SouthUK North
Corona, CA New JerseyCincinnati, OH Switzerland
Moscow Saint Petersburg
Perm Saratov
Hong Kong
Costa Rica
Georgia
Guatemala
NovosibirskBelarus
Moldova
Florida
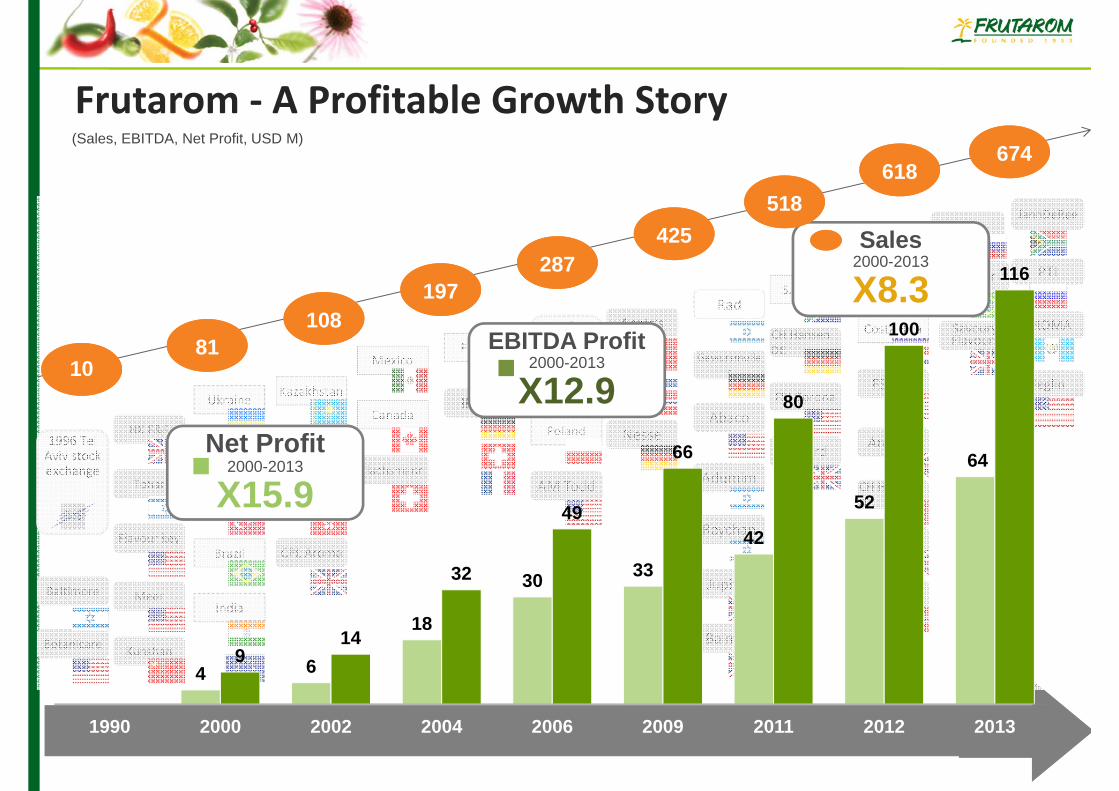
Frutarom ‐ A Profitable Growth Story(Sales, EBITDA, Net Profit, USD M)
1996 Tel Aviv stock exchange
IFF FS
Gewurzmuller
Adumim
Raychan
Rieber
EAFI
SavouryFlavours
Oxford
Balmey
Jupiter
FSI Corona
Nesse
CH Hansen DE
CH Hansen IT
Etol
Mylner
Aromco
FSI OH
Acatris
Flachsmann
Abaco
Tohar
Meer
RaynerHK F&F
CPL Aroma Flavour key
Baltimore
Botanicare Kunshan
AM Todd
Rad London stock
exchange
Russia
Canada
Turkey
France Mexico
Ukraine
Poland
Kazakhstan
Hong Kong
Costa Rica
Czech Rep.S. Africa
India
Brazil
JannDeRee
PTI
AROMA
Heglin
Net Profit2000-2013
X15.9
EBITDA Profit2000-2013
X12.9
Sales2000-2013
X8.3108
8110
197287
425518
618674
4 6
18
30 3342
52
64
914
32
49
66
80
100
116
1990 2000 2002 2004 2006 2009 2011 2012 2013
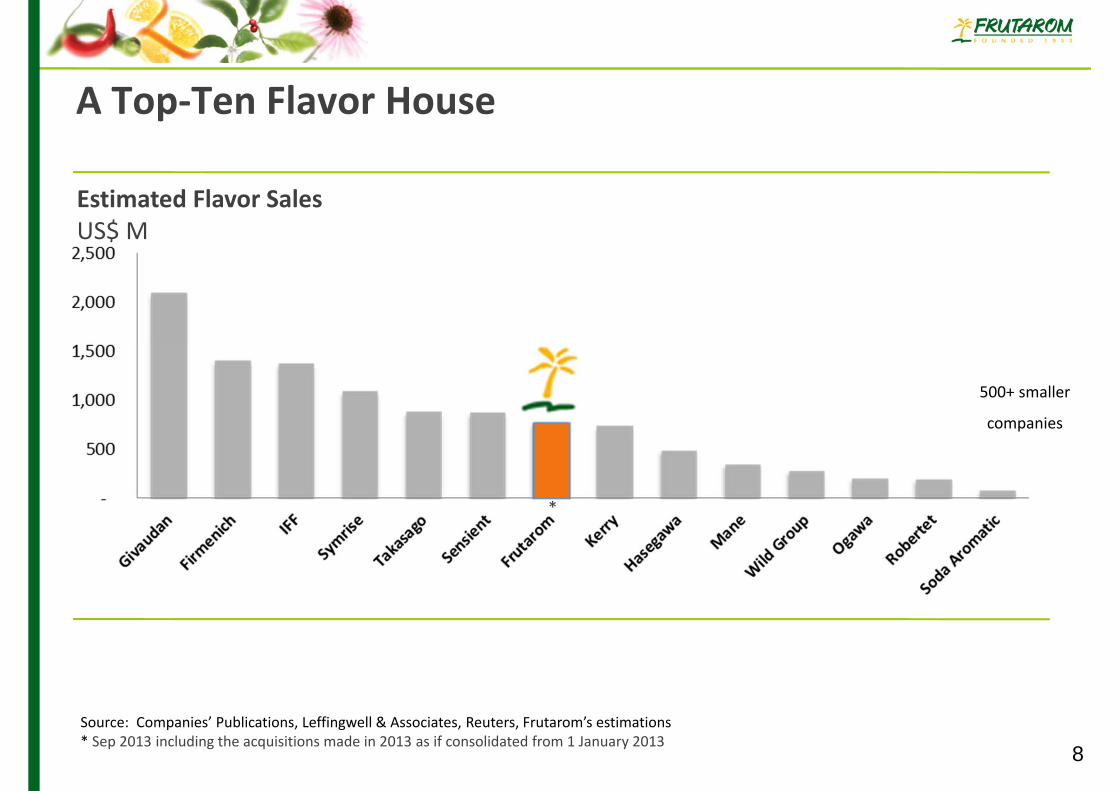
Estimated Flavor Sales US$ M
A Top‐Ten Flavor House
Source: Companies’ Publications, Leffingwell & Associates, Reuters, Frutarom’s estimations * Sep 2013 including the acquisitions made in 2013 as if consolidated from 1 January 2013
8
500+ smaller
companies
*

From Vision to RealityStrategic Milestones Accomplished
Sales Grew From $10M at 1990 to $674M at 2013
Accelerating GrowthIn Emerging Markets.Fastest growing markets
Unique, diversified products portfolio.
Improved mix towards more profitable segments
Expanding Market Share In The US.
World’s biggest flavor market
Supply Chain Optimization. Supported also by
acquisitions
Innovation.Novel, natural, higher added
value health & taste solutions
Focus on:‐Mid Sized Local & Private
Label ‐MNCs with niche‐added‐
value solutions
Accelerated Profitable Growth
Solid Cash Flow EBITDA Grew From $1M at 1990 to $116M at 2013
9

Accelerated Growth and Market Share in Emerging Markets
Asia
Central & South America Africa
Central and Eastern Europe
• Acquired Etol in Slovenia and PTI in Russia• One of the only global players with major
production sites in Russia• Market leadership in Central and East Europe• Cross selling and optimization opportunities
• Fast growing operation in South Africa, reinforced by JannDeRee Acquisition
• Enhance R&D and sales force in fast growing markets (Kenya, Nigeria and others)
• Building State of the Art manufacturing facility
• Expanded R&D and sales force in China, Indonesia, Philippines, Thailand, Vietnam, Sri Lanka
• Setting up flavor operation in India• Building a state‐of‐the‐art plant in China with
both savory and sweet flavors capabilities• Evaluating strategic acquisition opportunities
• Acquired Mylner in Brazil and Aroma in Guatemala
• Set up an independent operation in Costa Rica and Mexico
• Evaluating strategic acquisition opportunities
10
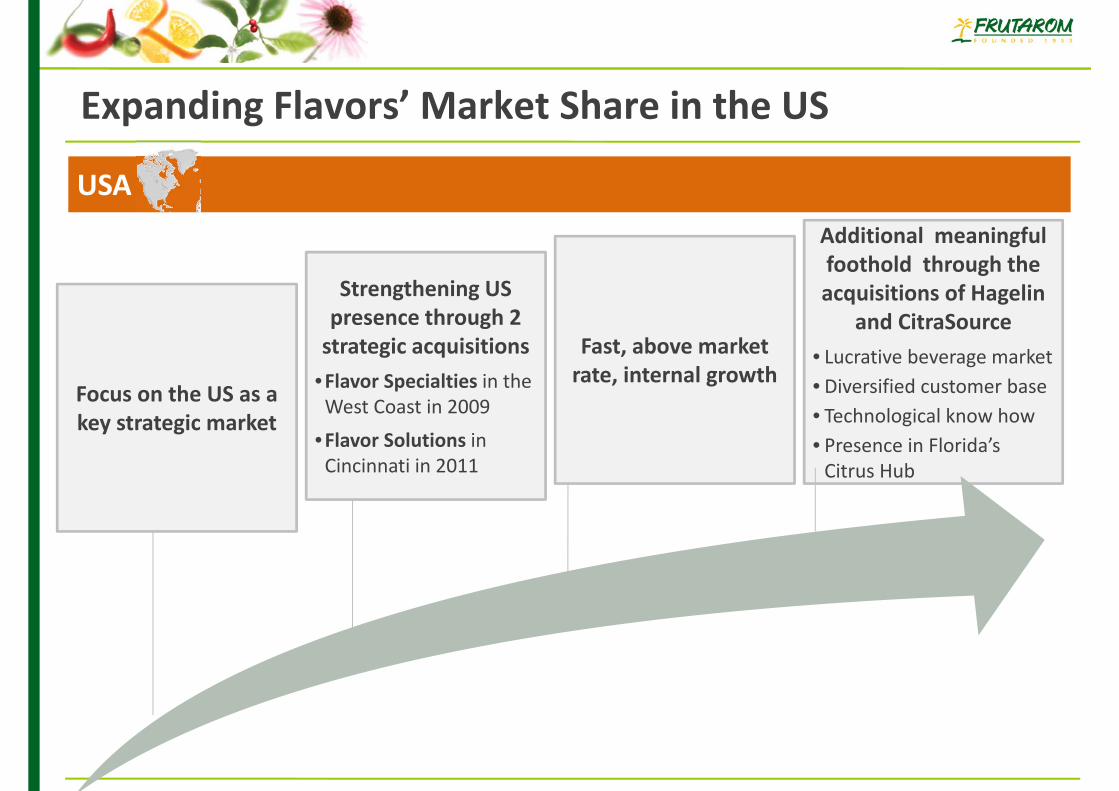
Expanding Flavors’ Market Share in the US
USA
Focus on the US as a key strategic market
Fast, above market rate, internal growth
Additional meaningful foothold through the acquisitions of Hagelin
and CitraSource• Lucrative beverage market• Diversified customer base • Technological know how • Presence in Florida’s Citrus Hub
Strengthening US presence through 2 strategic acquisitions
•Flavor Specialties in the West Coast in 2009
•Flavor Solutions in Cincinnati in 2011
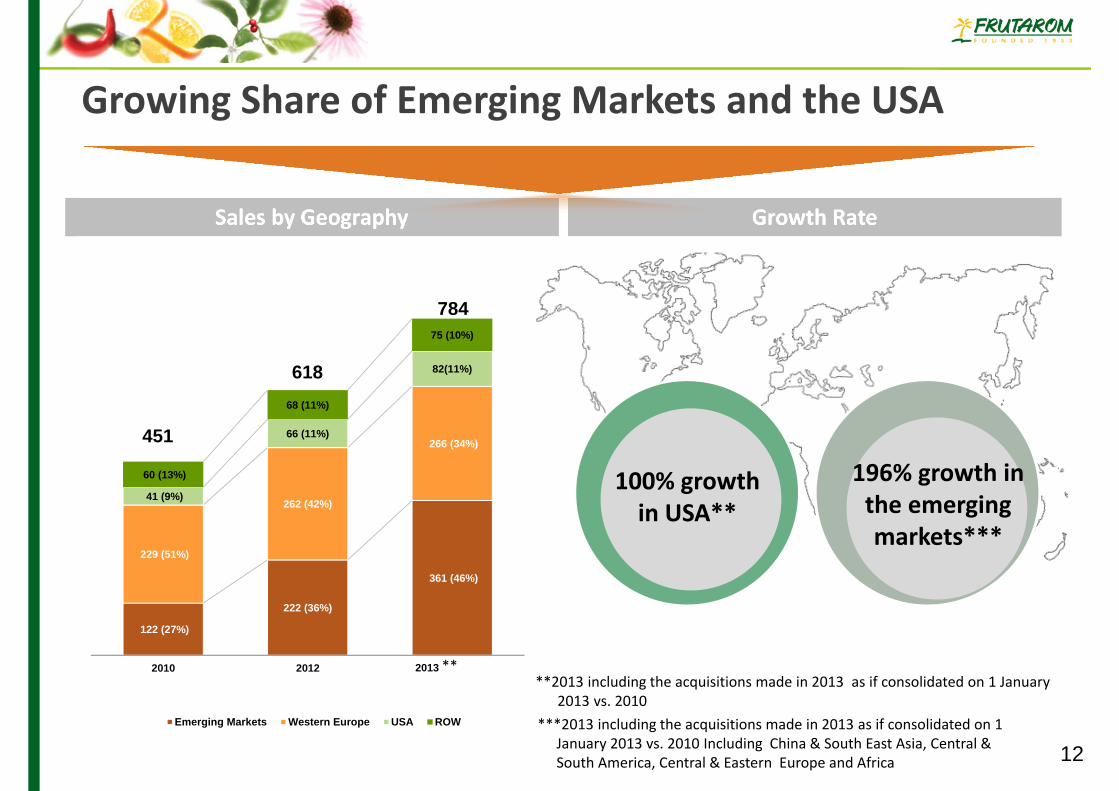
122 (27%)
222 (36%)
361 (46%)
229 (51%)
262 (42%)
266 (34%)
41 (9%)
66 (11%)
82(11%)
60 (13%)
68 (11%)
75 (10%)
2010 2012 2013 Proforma
Emerging Markets Western Europe USA ROW
12
196% growth in the emerging markets***
31% growth in the BRIC countries*
100% growth in USA**
451
618
784
Growth Rate
Growing Share of Emerging Markets and the USA
Sales by Geography
***2013 including the acquisitions made in 2013 as if consolidated on 1 January 2013 vs. 2010 Including China & South East Asia, Central & South America, Central & Eastern Europe and Africa
**2013 including the acquisitions made in 2013 as if consolidated on 1 January 2013 vs. 2010
**
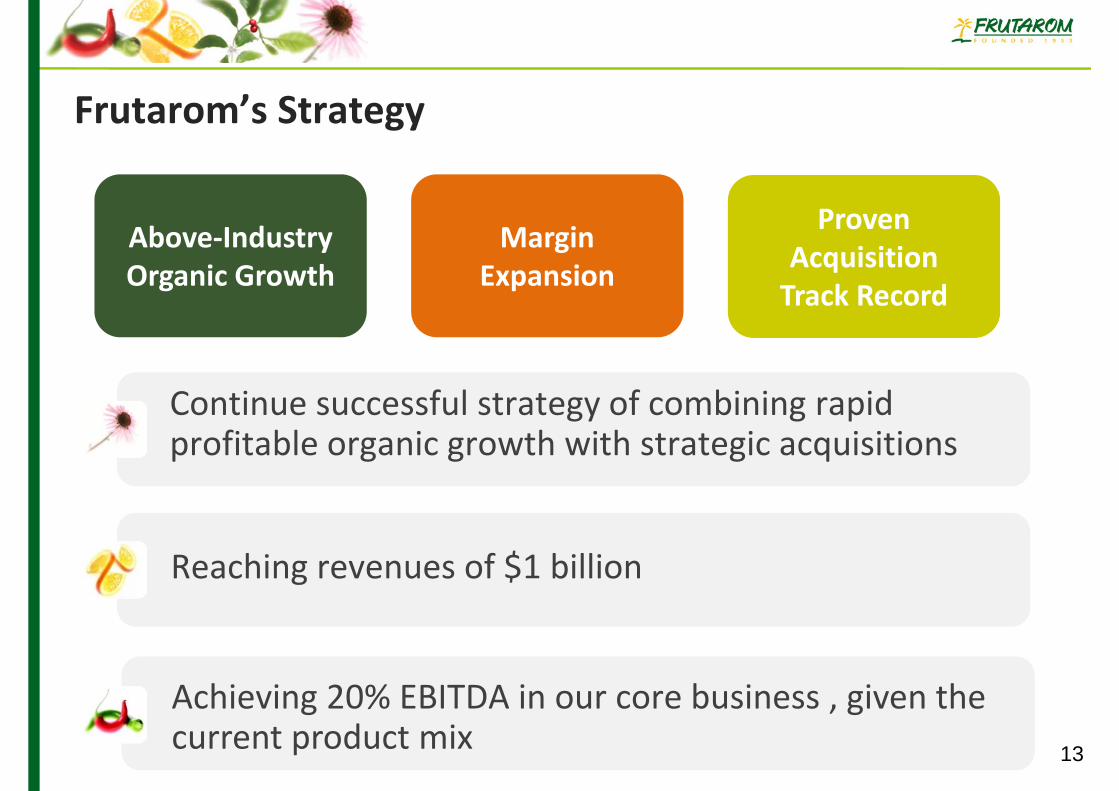
Above‐Industry Organic Growth
Frutarom’s Strategy
Proven Acquisition Track Record
Margin Expansion
13
Reaching revenues of $1 billion
Continue successful strategy of combining rapid profitable organic growth with strategic acquisitions
Achieving 20% EBITDA in our core business , given the current product mix
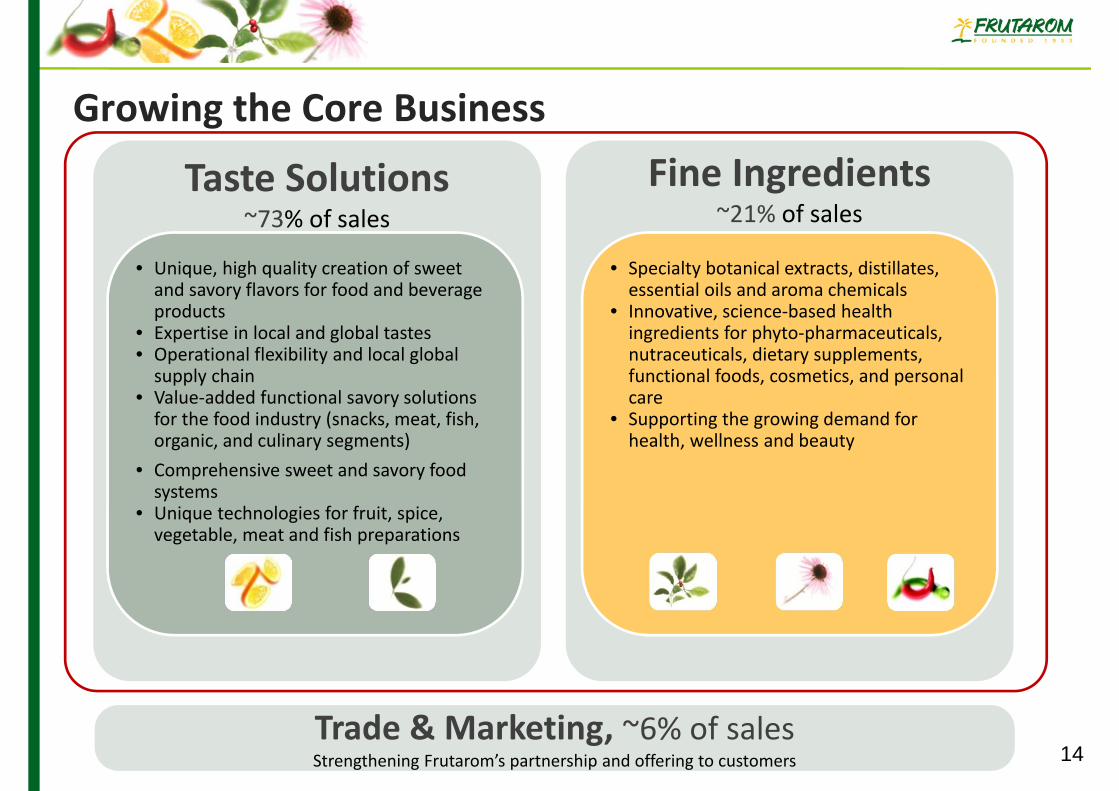
Fine Ingredients~21% of sales
Taste Solutions~73% of sales
• Unique, high quality creation of sweet and savory flavors for food and beverage products
• Expertise in local and global tastes• Operational flexibility and local global supply chain
• Value‐added functional savory solutions for the food industry (snacks, meat, fish, organic, and culinary segments)
• Comprehensive sweet and savory food systems
• Unique technologies for fruit, spice, vegetable, meat and fish preparations
• Specialty botanical extracts, distillates, essential oils and aroma chemicals
• Innovative, science‐based health ingredients for phyto‐pharmaceuticals, nutraceuticals, dietary supplements, functional foods, cosmetics, and personal care
• Supporting the growing demand forhealth, wellness and beauty
14Trade & Marketing, ~6% of salesStrengthening Frutarom’s partnership and offering to customers
Growing the Core Business

3847
5969
2009 2011 2012 2013
27 45
187
297370
457 494
2000 2002 2006 2009 2011 2012 2013
Flavors ‐Most Profitable Activity Growing Fast
15
Revenues
(US$ M)
• Above average market growth rates
• USA, Latin America, Asia, Central and eastern Europe, Africa
• North America flavor sales grew by X4 times since 2010**
33%
Operating Profit
Growth was driven by
(US$ M)
14.7%
73%
** based on Dec 2013 including the acquisitions made in 2013 as if consolidated from 1 January 2013
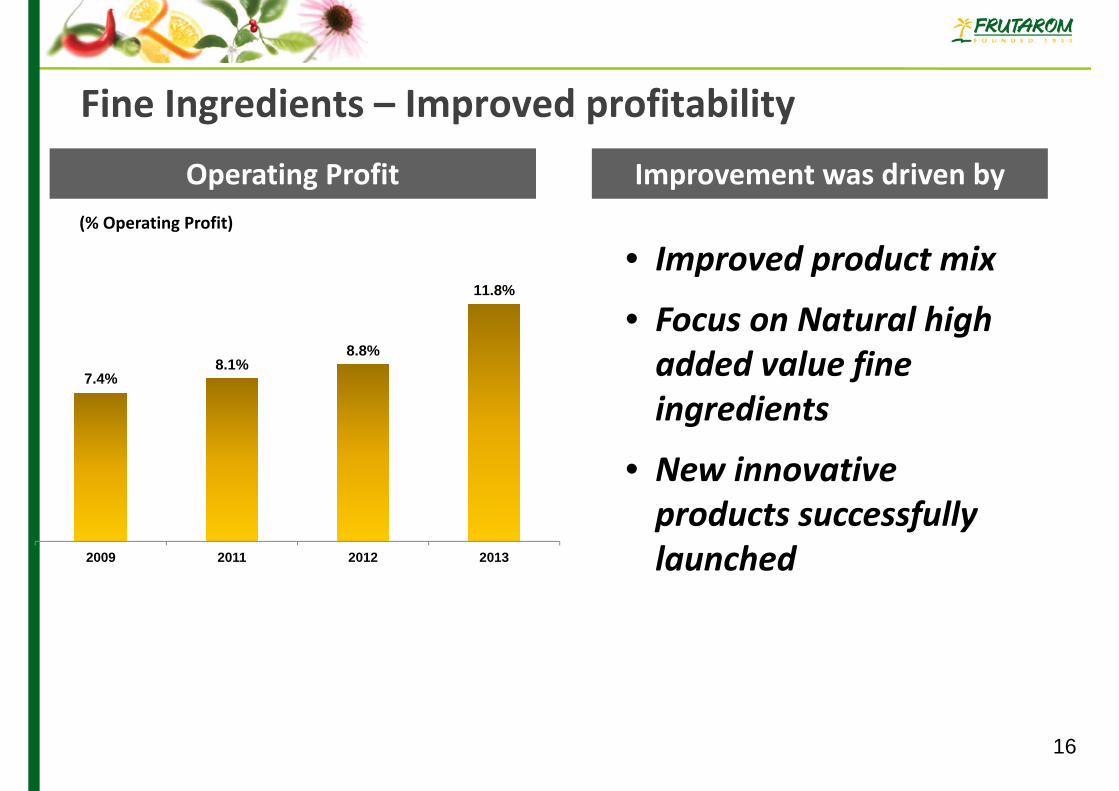
Fine Ingredients – Improved profitability
16
Operating Profit
• Improved product mix
• Focus on Natural high added value fine ingredients
• New innovative products successfully launched
Improvement was driven by(% Operating Profit)
14.7%
7.4%8.1%
8.8%
11.8%
2009 2011 2012 2013
We share the…
Passion for Taste & Health
Flavors Fine Ingredients
We develop tailored solutions combining excellent taste with health and functionality all under one roof
17
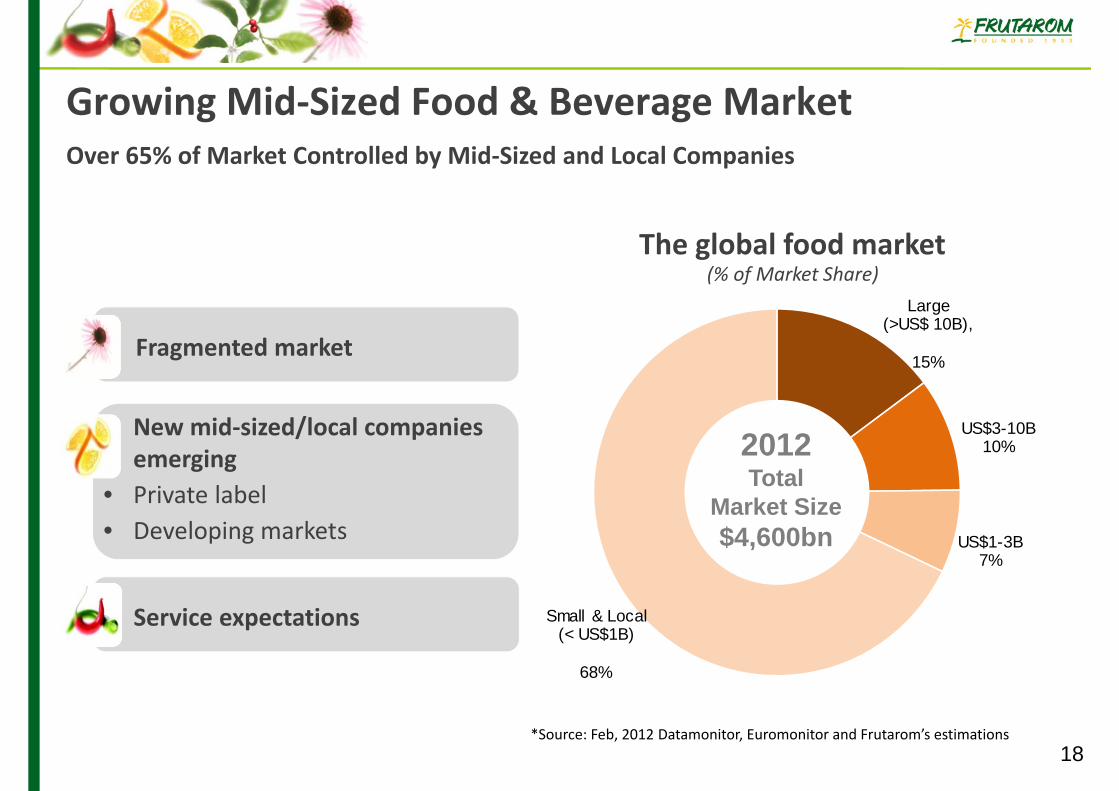
Growing Mid‐Sized Food & Beverage MarketOver 65% of Market Controlled by Mid‐Sized and Local Companies
18
• New mid‐sized/local companies emerging
• Private label• Developing markets
• Service expectations
• Fragmented market
Large (>US$ 10B),
15%
US$3-10B10%
US$1-3B7%
Small & Local (< US$1B)
68%
2012 Total
Market Size$4,600bn
(% of Market Share) The global food market
*Source: Feb, 2012 Datamonitor, Euromonitor and Frutarom’s estimations
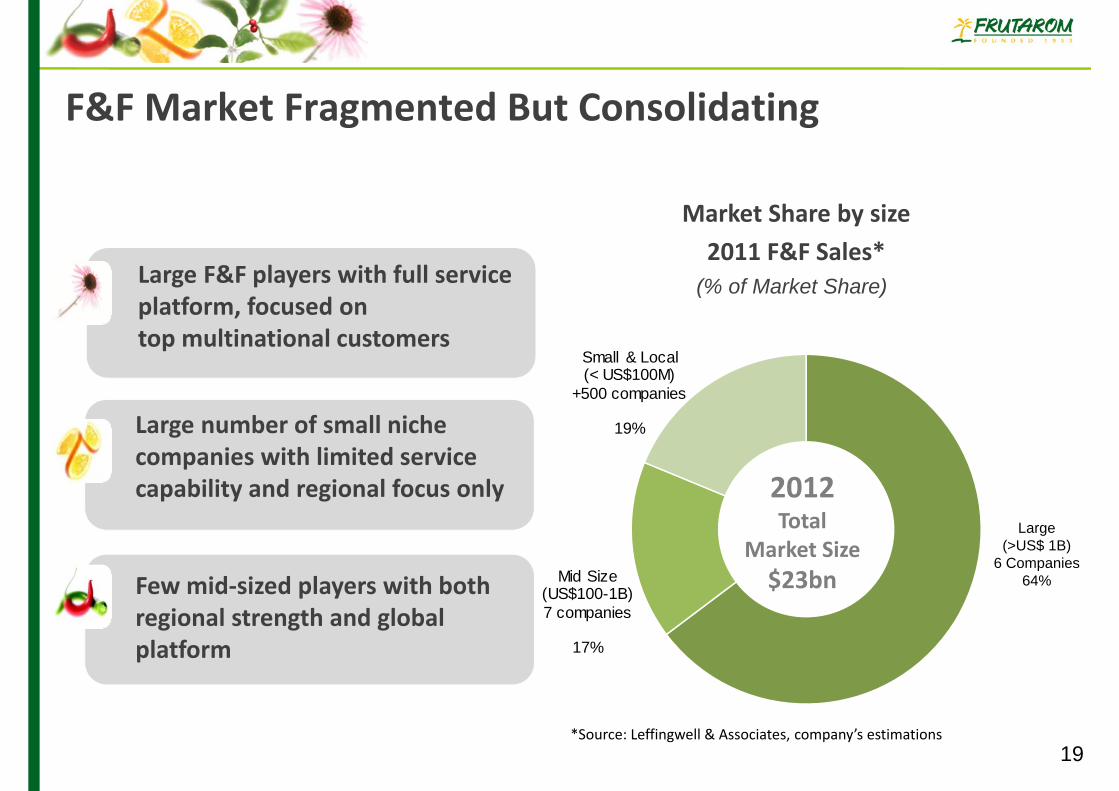
F&F Market Fragmented But Consolidating
*Source: Leffingwell & Associates, company’s estimations
(% of Market Share)
Market Share by size2011 F&F Sales*
19
Large (>US$ 1B),
6 Companies65%Mid Size
(US$100-1B)7 companies
17%
Small & Local (< US$100M)
+500 companies
19%
2012 Total
Market Size$23bn
• Large number of small niche companies with limited service capability and regional focus only
• Few mid‐sized players with both regional strength and global platform
• Large F&F players with full service platform, focused ontop multinational customers
Large(>US$ 1B)
6 Companies 64%
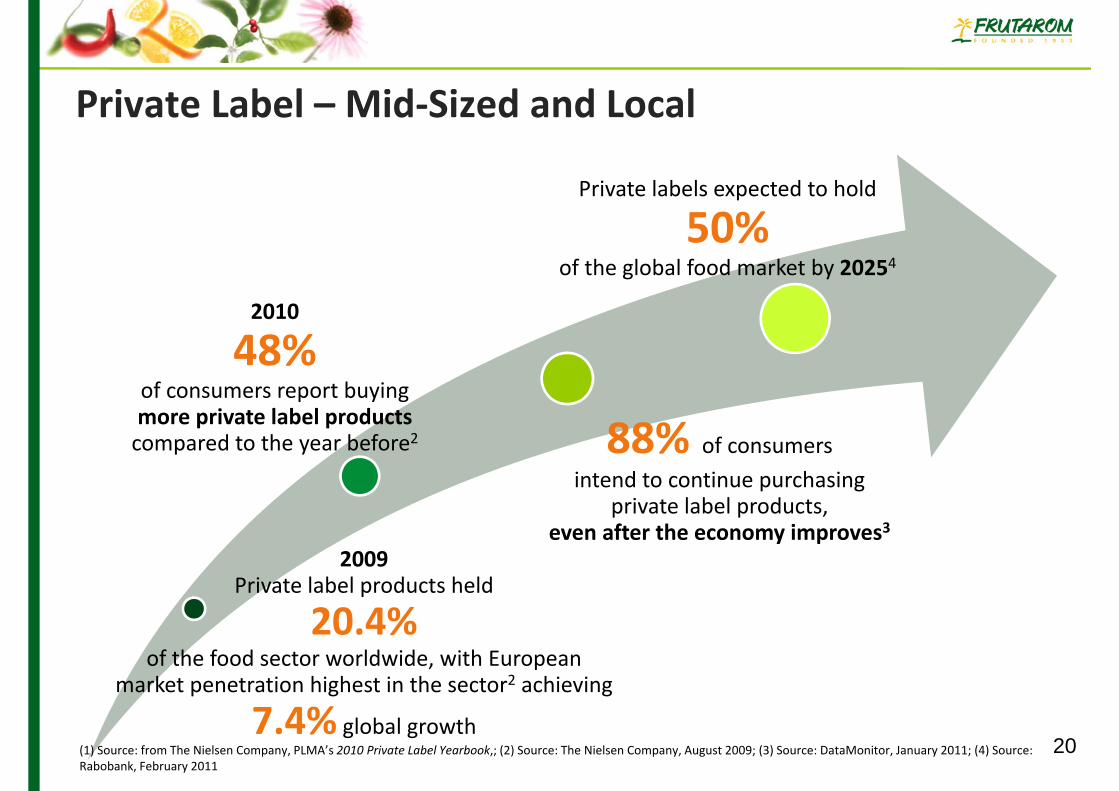
Private Label – Mid‐Sized and Local
2009 Private label products held
20.4% of the food sector worldwide, with European
market penetration highest in the sector2 achieving
7.4% global growth
2010
48%of consumers report buying more private label products compared to the year before2 88% of consumers
intend to continue purchasing private label products,
even after the economy improves3
Private labels expected to hold
50%of the global food market by 20254
20(1) Source: from The Nielsen Company, PLMA’s 2010 Private Label Yearbook,; (2) Source: The Nielsen Company, August 2009; (3) Source: DataMonitor, January 2011; (4) Source: Rabobank, February 2011
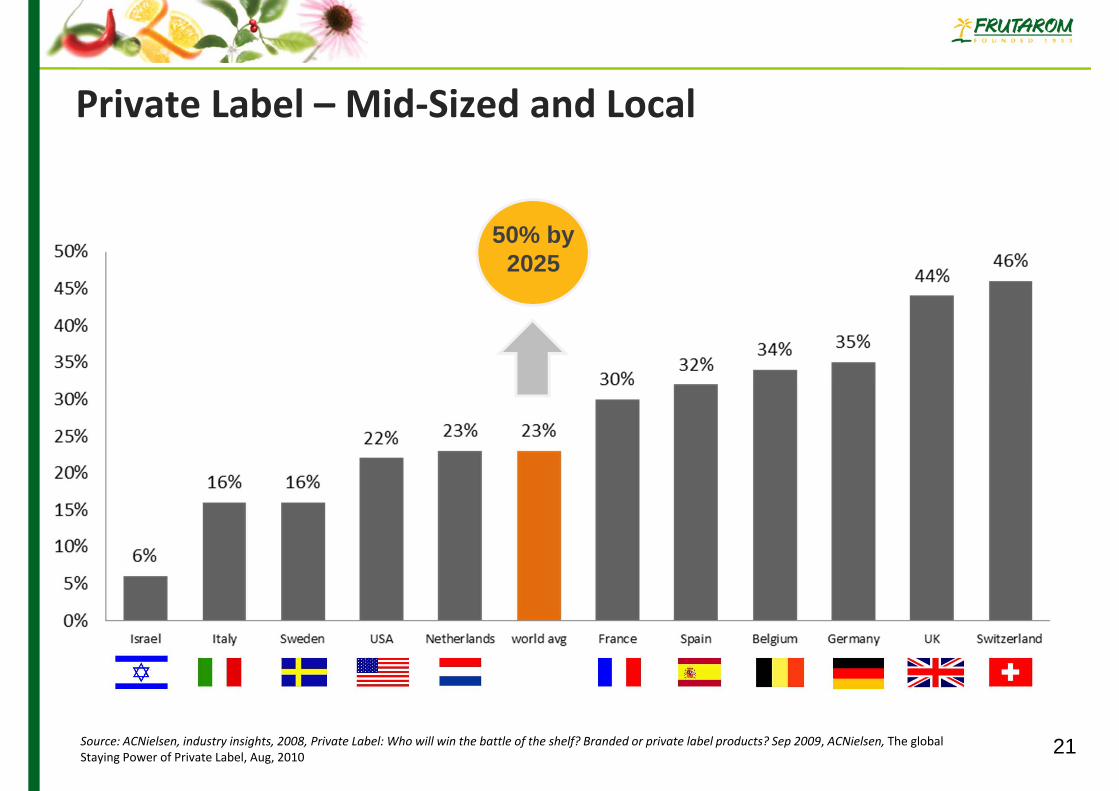
Source: ACNielsen, industry insights, 2008, Private Label: Who will win the battle of the shelf? Branded or private label products? Sep 2009, ACNielsen, The global Staying Power of Private Label, Aug, 2010 21
50% by 2025
Private Label – Mid‐Sized and Local
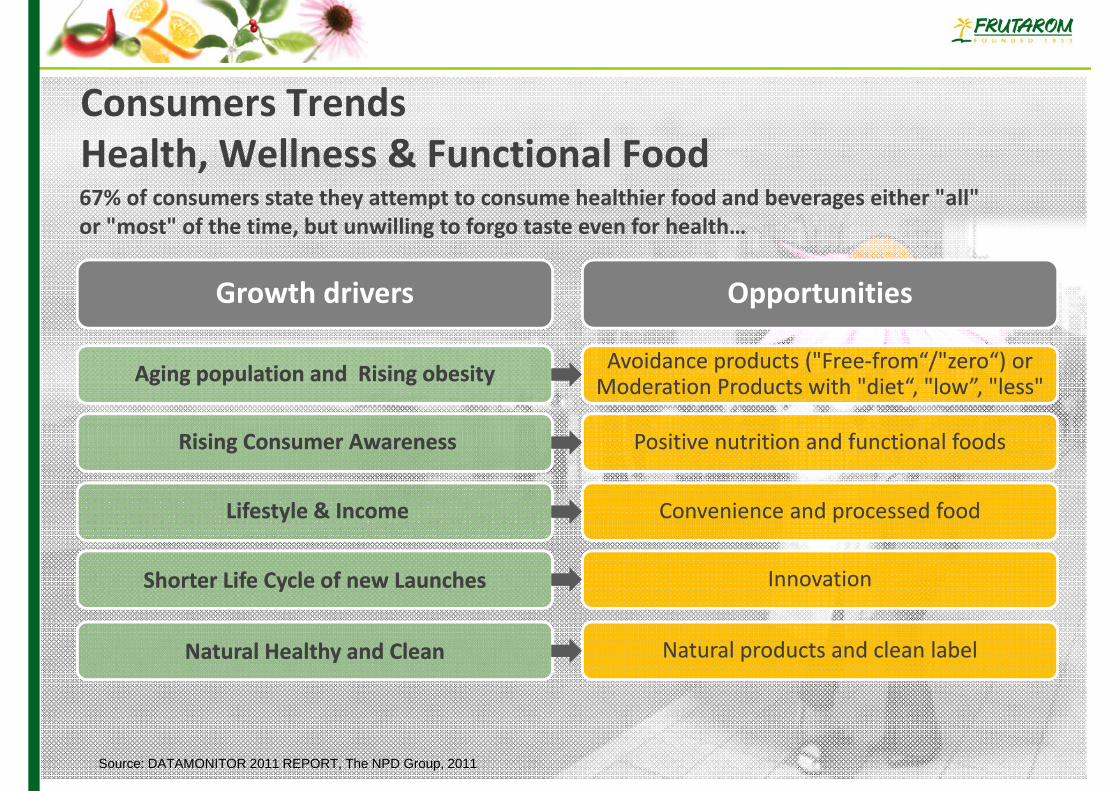
Consumers TrendsHealth, Wellness & Functional Food67% of consumers state they attempt to consume healthier food and beverages either "all" or "most" of the time, but unwilling to forgo taste even for health…
Source: DATAMONITOR 2011 REPORT, The NPD Group, 2011
Growth drivers
Aging population and Rising obesityAging population and Rising obesity
Rising Consumer Awareness Rising Consumer Awareness
Lifestyle & IncomeLifestyle & Income
Opportunities
Positive nutrition and functional foodsPositive nutrition and functional foods
Convenience and processed foodConvenience and processed food
Avoidance products ("Free‐from“/"zero“) or Moderation Products with "diet“, "low”, "less"Avoidance products ("Free‐from“/"zero“) or Moderation Products with "diet“, "low”, "less"
Shorter Life Cycle of new LaunchesShorter Life Cycle of new Launches InnovationInnovation
Natural Healthy and Clean Natural Healthy and Clean Natural products and clean labelNatural products and clean label

Frutarom provides Novel and Natural Health & Taste solutions
Natural and clean label Health/Wellness
• Reduced fat, calories and salt
Functional food• Products with illness -
preventative properties
Innovation
Convenience food
Speed• Timeline to deliver
results – hypermarkets
Cost Reduction
Unique combinations• Traveling created
willingness to explore new tastes
23
Key Market Drivers
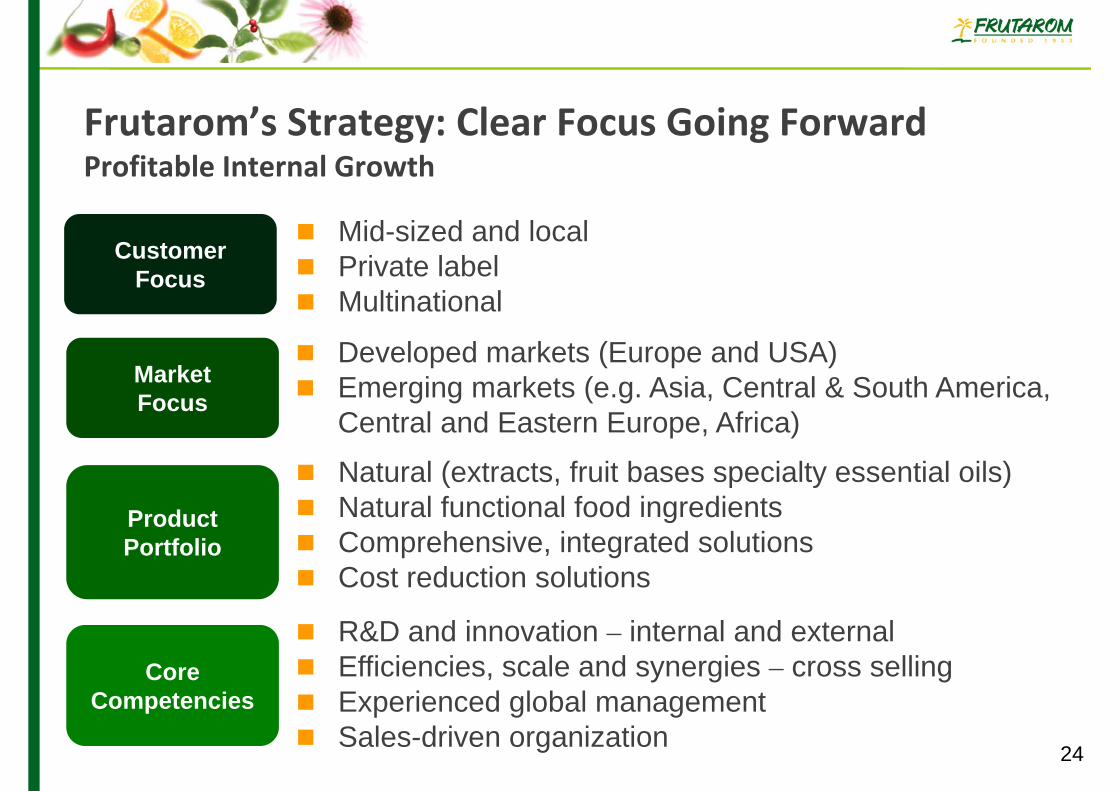
Frutarom’s Strategy: Clear Focus Going Forward Profitable Internal Growth
CustomerFocus
Mid-sized and local Private label Multinational
Market Focus
Developed markets (Europe and USA) Emerging markets (e.g. Asia, Central & South America,
Central and Eastern Europe, Africa)
Product Portfolio
Natural (extracts, fruit bases specialty essential oils) Natural functional food ingredients Comprehensive, integrated solutions Cost reduction solutions
Core Competencies
R&D and innovation – internal and external Efficiencies, scale and synergies – cross selling Experienced global management Sales-driven organization
24
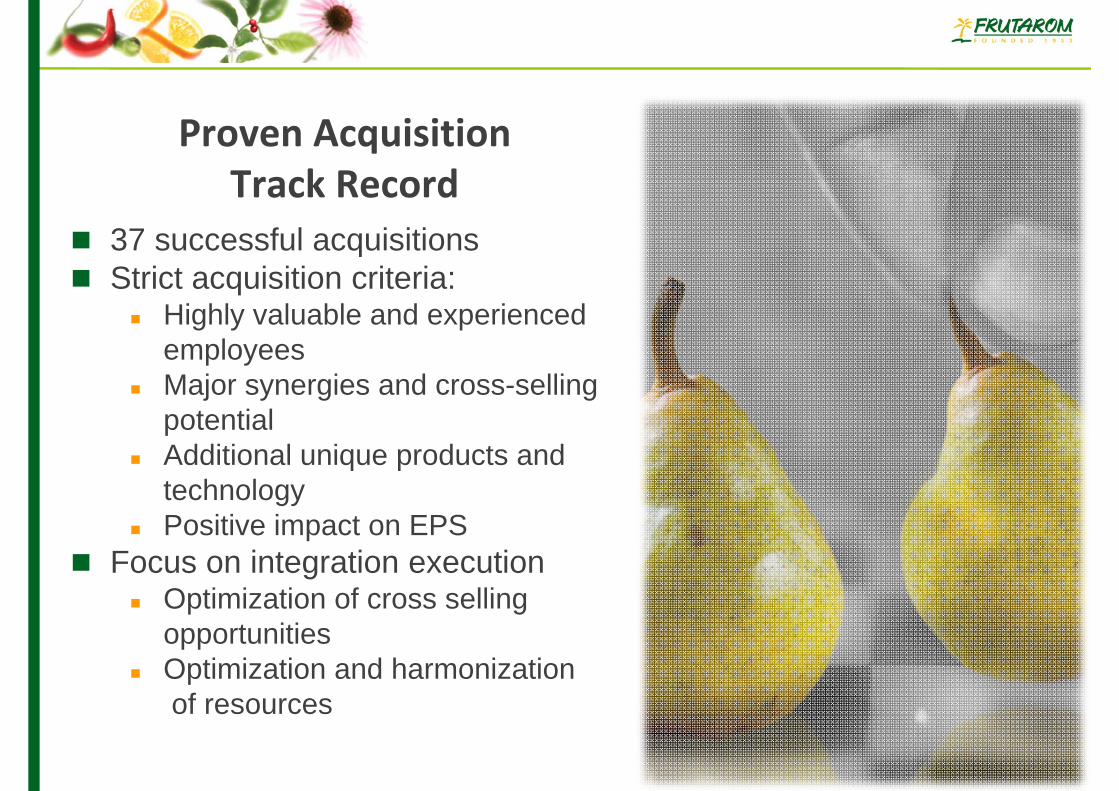
37 successful acquisitions Strict acquisition criteria:
Highly valuable and experienced employees
Major synergies and cross-selling potential
Additional unique products and technology
Positive impact on EPS Focus on integration execution
Optimization of cross selling opportunities
Optimization and harmonizationof resources
Proven Acquisition Track Record

26
5 Acquisitions in Emerging Markets and the US
• Strengthening market position in South Africa and Africa.
• Complementary Savory activity
JannDeReeSouth Africa
PTIRussia & CIS
• Strengthening Leadership in East Europe
• Savory Solutions leadership
Aroma Guatemala
• Strengthening market position in Central America.
HagelinUSA
• Strengthening market position in the US & EM
• Expertise in beverages
Strong management, R&D, sales and operational force. Leverage operational efficiencies. Opportunities for additional rationalization plans and improved margins.
Continued implementation of rapid profitable growth strategy
CitraSourceUSA
• Strengthening Citrus capabilities and leadership
• Presence in Florida – world center for citrus
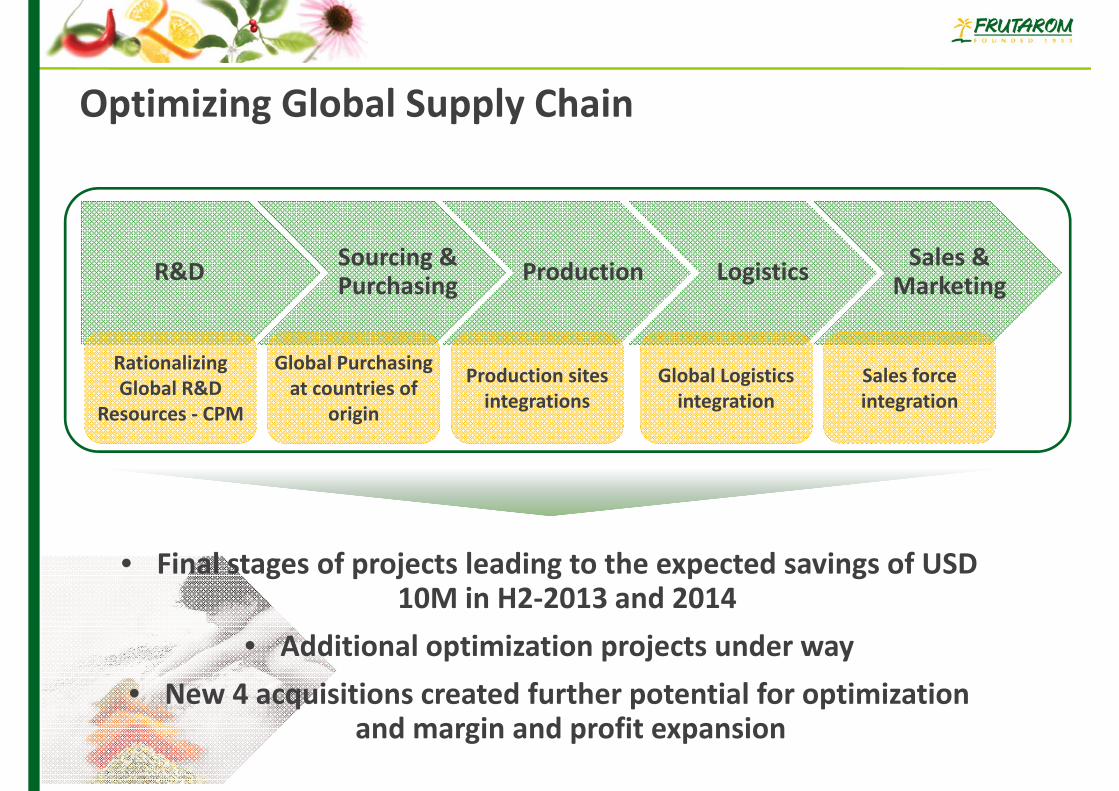
Optimizing Global Supply Chain
ProductionSourcing & Purchasing Logistics Sales &
Marketing R&D
Rationalizing Global R&D
Resources ‐ CPM
Global Purchasing at countries of
origin
Production sites integrations
Global Logistics integration
Sales force integration
• Final stages of projects leading to the expected savings of USD 10M in H2‐2013 and 2014
• Additional optimization projects under way • New 4 acquisitions created further potential for optimization
and margin and profit expansion
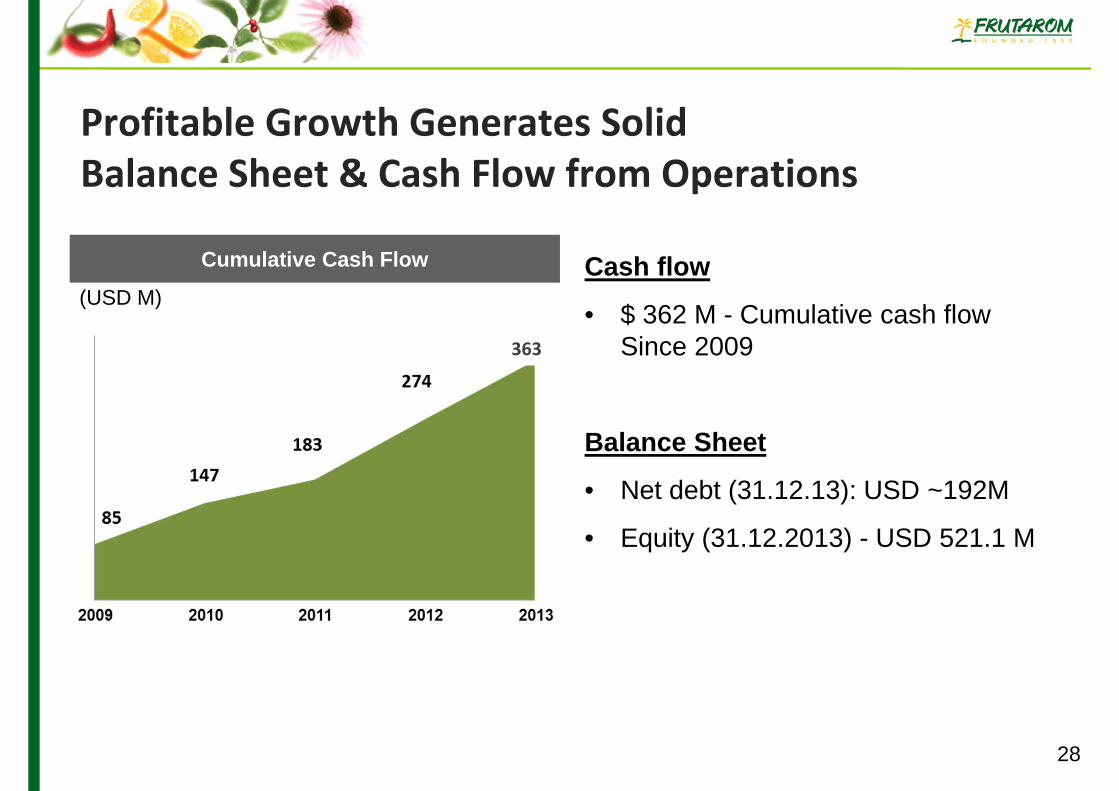
Profitable Growth Generates Solid Balance Sheet & Cash Flow from Operations
(USD M)Cash flow
• $ 362 M - Cumulative cash flow Since 2009
Balance Sheet
• Net debt (31.12.13): USD ~192M
• Equity (31.12.2013) - USD 521.1 M
Cumulative Cash Flow
28
363

Positive Outlook for 2014
Profitable internal growth
Focus on innovative natural healthy product mix
Successful integration of the acquisitions
Additional projects to improve efficiency and merge activities and operations
Strengthening & leveraging global purchasing
Strong acquisitions pipeline
29
Frutarom’s Vision
30
To Be The Preferred Partner For Tasty And Healthy Success