Copyright © 2014, 2010, 2006 Pearson Education, Inc. 1 Chapter 3 Quadratic Functions and Equations.
25
Copyright © 2014, 2010, 2006 Pearson Education, Inc. 1 Chapter 3 Quadratic Functions and Equations
Transcript of Copyright © 2014, 2010, 2006 Pearson Education, Inc. 1 Chapter 3 Quadratic Functions and Equations.
Copyright © 2014, 2010, 2006 Pearson Education, Inc. 1
Chapter 3
Quadratic Functions and
Equations
2Copyright © 2014, 2010, 2006 Pearson Education, Inc.
Quadratic Functions and
Models♦ Learn basic concepts about quadratic functions
and their graphs.♦ Complete the square and apply the vertex
formula.♦ Graph a quadratic function by hand.♦ Solve applications and model data.♦ Use quadratic regression to model data
(optional)
3.1
Copyright © 2014, 2010, 2006 Pearson Education, Inc. 3
Basic Concepts
Recall that a linear function can be written as f(x) = ax + b (or f(x) = mx + b). The formula for a quadratic function is different from that of a linear function because it contains an x2 term.
f(x) = 3x2 + 3x + 5
g(x) = 5 x2
Copyright © 2014, 2010, 2006 Pearson Education, Inc. 4
Quadratic Function
Let a, b, and c be constants with a ≠ 0. A function represented by
f(x) = ax2 + bx + cis a quadratic function.
Copyright © 2014, 2010, 2006 Pearson Education, Inc. 5
Quadratic Function
The graph of a quadratic function is a parabola—a U shaped graph that opens either upward or downward.
A parabola opens upward if a is positive and opens downward if a is negative.
The highest point on a parabola that opens downward and the lowest point on a parabola that opens upward is called the vertex.
Copyright © 2014, 2010, 2006 Pearson Education, Inc. 6
Quadratic Function
The vertical line passing through the vertex is called the axis of symmetry.
The leading coefficient a controls the width of the parabola. Larger values of |a| result in a narrower parabola, and smaller values of |a| result in a wider parabola.
Copyright © 2014, 2010, 2006 Pearson Education, Inc. 7
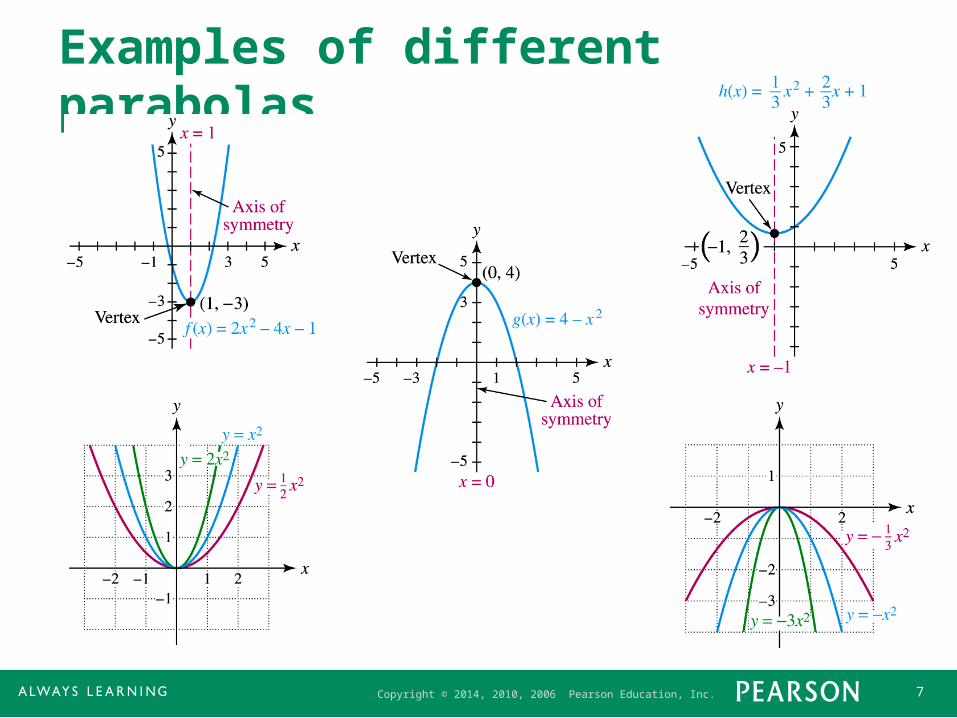
Examples of different parabolas
Copyright © 2014, 2010, 2006 Pearson Education, Inc. 8
Example: Analyzing graphs of quadratic functions
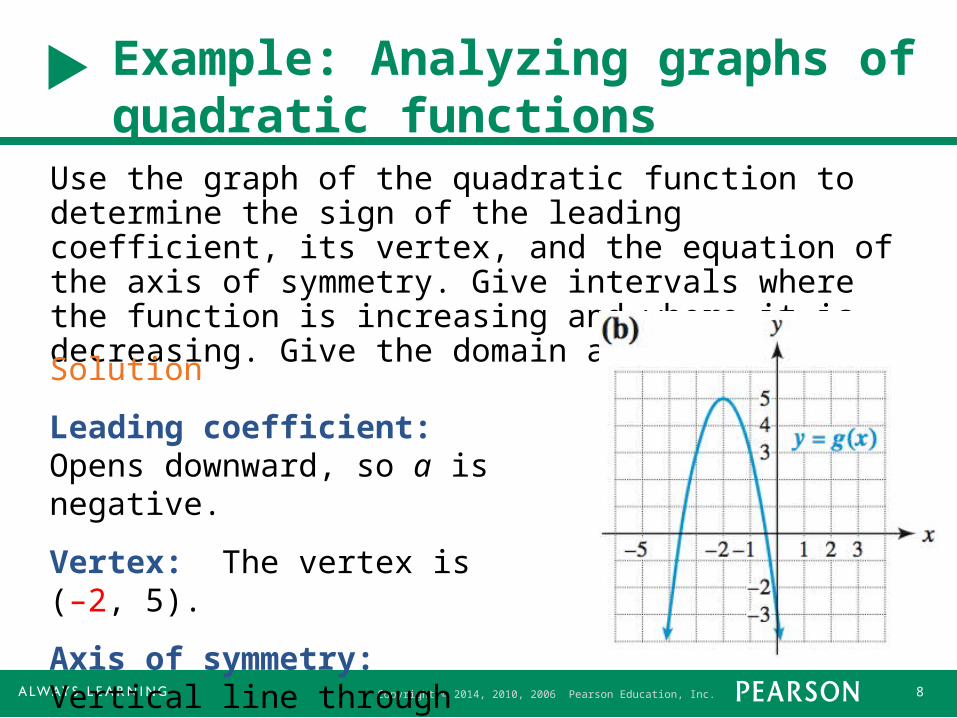
Use the graph of the quadratic function to determine the sign of the leading coefficient, its vertex, and the equation of the axis of symmetry. Give intervals where the function is increasing and where it is decreasing. Give the domain and range.
Solution
Leading coefficient: Opens downward, so a is negative.
Vertex: The vertex is (–2, 5).
Axis of symmetry: Vertical line through the vertex with equation x = –2.
Copyright © 2014, 2010, 2006 Pearson Education, Inc. 9
Example: Analyzing graphs of quadratic functions
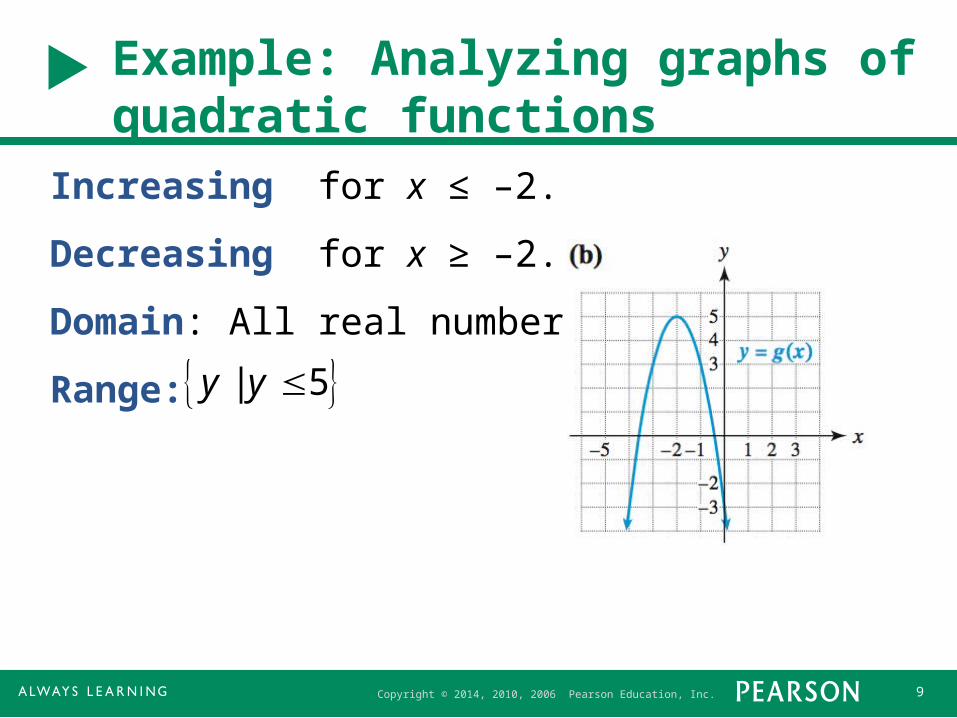
Increasing for x ≤ –2.
Decreasing for x ≥ –2.
Domain: All real numbers.
Range: | 5y y
Copyright © 2014, 2010, 2006 Pearson Education, Inc. 10
Vertex Form
The parabolic graph of f(x) = a(x – h)2 + kwith a ≠ 0 has vertex (h, k).Its graph opens upward when a > 0 and opens downward when a < 0.
Copyright © 2014, 2010, 2006 Pearson Education, Inc. 11
Completing the Square
We can convert the general formf(x) = ax2 + bx + c to vertex form by completing the square. If a quadratic expression can be written as
then it is a perfect square trinomial and can be factored as
x2 kx
k
2
2
,
x2 kx
k
2
2
x k
2
2
.
Copyright © 2014, 2010, 2006 Pearson Education, Inc. 12
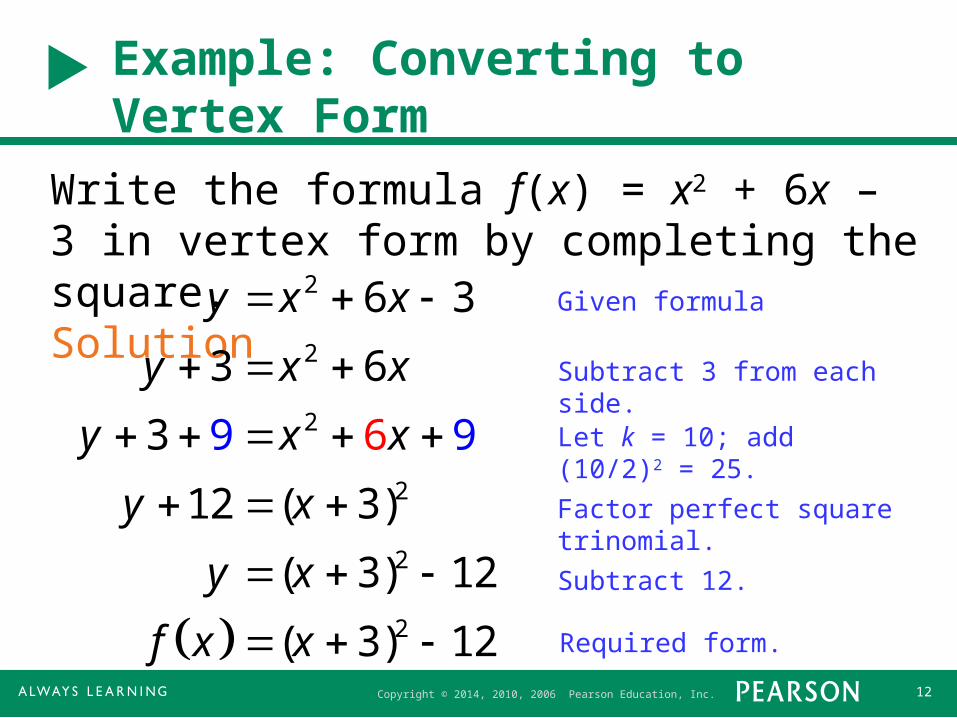
Example: Converting to Vertex Form
Write the formula f(x) = x2 + 6x – 3 in vertex form by completing the square.Solution Given formula
Subtract 3 from each side.
Let k = 10; add (10/2)2 = 25.
Factor perfect square trinomial.
Subtract 12.
2
2
2
2
2
2
6 3
3 6
3
12 ( 3
9
)
( 3) 12
( 3
9
1
6
) 2
y x x
y x x
y x x
y x
y x
f x x Required form.
Copyright © 2014, 2010, 2006 Pearson Education, Inc. 13
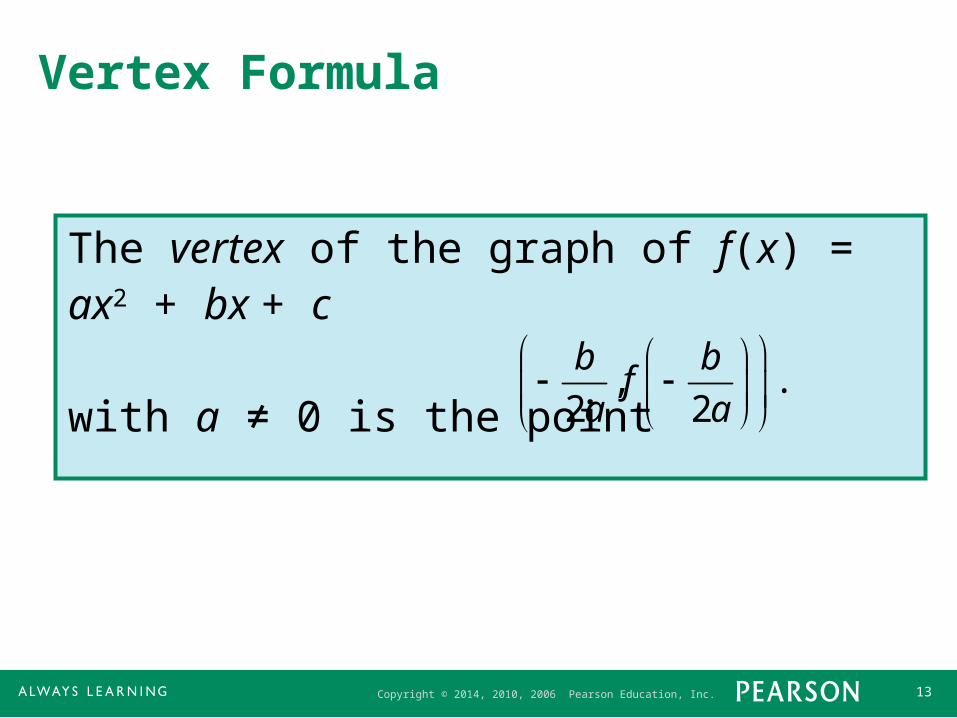
Vertex Formula
The vertex of the graph of f(x) = ax2 + bx + c
with a ≠ 0 is the point , .2 2
b bf
a a
Copyright © 2014, 2010, 2006 Pearson Education, Inc. 14
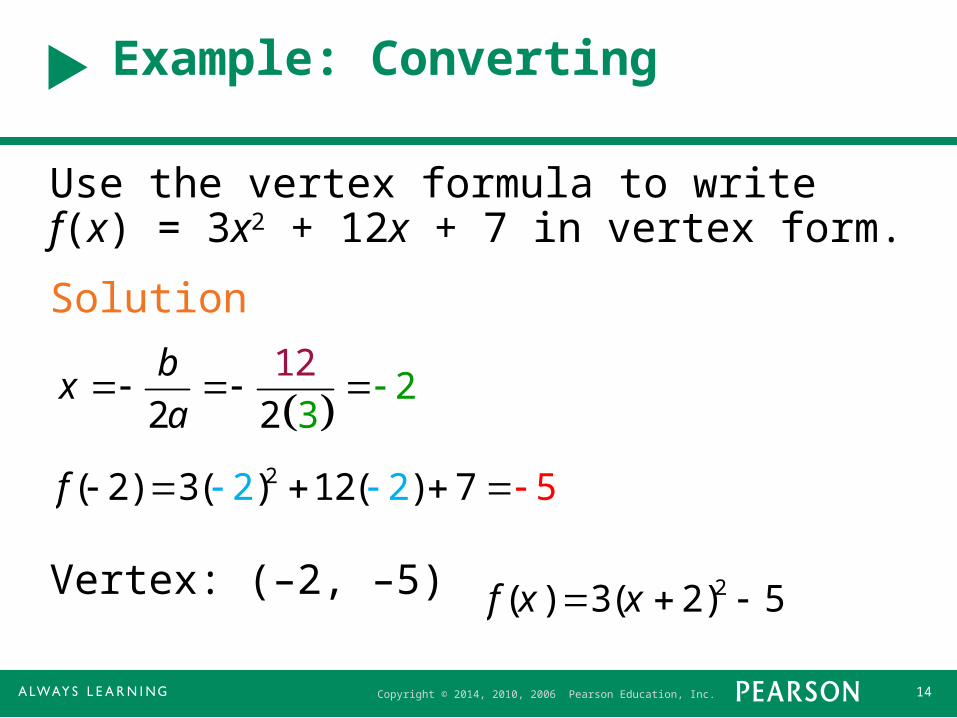
Example: Converting
Use the vertex formula to write f(x) = 3x2 + 12x + 7 in vertex form.
Solution
Vertex: (–2, –5)
1
2
22
2 3
bx
a
22( 2) 3( ) 1 5722( )f
2( ) 3( 2) 5f x x
Copyright © 2014, 2010, 2006 Pearson Education, Inc. 15
Graphing Quadratic Functions
When sketching a parabola, it is important to determine the vertex, the axis of symmetry, and whether the parabola opens upward or downward.

Copyright © 2014, 2010, 2006 Pearson Education, Inc. 16
Example: Graphing quadratic functions by hand
Graph the quadratic functionSolutionThe formula is not in vertex form, but we can find the vertex.
The y-coordinate of the vertex is:
The vertex is at (–1, 5/2). The axis of symmetry is x = –1, and the parabola opens downward because a = –1/2 is negative
21– 2
2h x x x
x b
2a
1
2 12
1
211 1
21
2– 2
5h

Copyright © 2014, 2010, 2006 Pearson Education, Inc. 17
Example: Graphing quadratic functions by hand
Table of Values Graph: 21– 2
2h x x x
Copyright © 2014, 2010, 2006 Pearson Education, Inc. 18
Applications and Models
Sometimes when a quadratic function f is used in applications, the vertex provides important information. The reason is that the y-coordinate of the vertex is the minimum value of f(x) when its graph opens upward and is the maximum value of f(x) when its graph opens downward.
Copyright © 2014, 2010, 2006 Pearson Education, Inc. 19
Example: Maximizing area
A rancher is fencing a rectangular area for cattle using the straight portion of a river as one side of the rectangle. If the rancher has 2400 feet of fence, find the dimensions of the rectangle that give the maximum area for the cattle.SolutionLet W be the width and L be the length of the rectangle. Because the 2400-foot fence does not go along the river, it follows thatW + L + W = 2400 or L = 2400 – 2W
Copyright © 2014, 2010, 2006 Pearson Education, Inc. 20
Example: Maximizing area
Area of the rectangle equals length times width.
This is a parabola that opens downward, and by the vertex formula, the maximum area occurs when
A LW (2400 2W )W 2400W 2W 2
A 2W 2 2400W
W
b
2a
2400
2( 2)600 feet

Copyright © 2014, 2010, 2006 Pearson Education, Inc. 21
Example: Maximizing area
The corresponding length is
L = 2400 – 2W = 2400 – 2(600) = 1200 feet.
The dimensions are 600 feet by 1200 feet.

Copyright © 2014, 2010, 2006 Pearson Education, Inc. 22
Applications and Models
Another application of quadratic functions occurs in projectile motion, such as when a baseball is hit up in the air. If air resistance is ignored, then the formula
s(t) = –16t2 + v0t + h0 calculates the height s of the object above the ground in feet after t seconds. In this formula h0 represents the initial height of the object in feet and v0 represents its initial vertical velocity in feet per second. If the initial velocity is upward, then v0 > 0 and if the initial velocity is downward, then v0 < 0.
Copyright © 2014, 2010, 2006 Pearson Education, Inc. 23
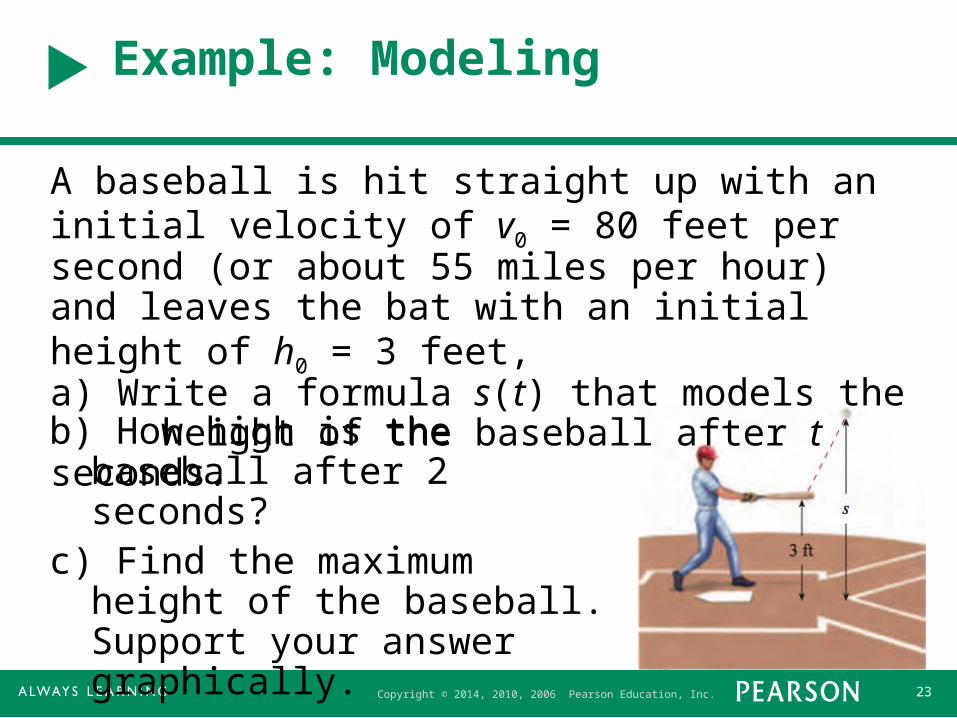
Example: Modeling
A baseball is hit straight up with an initial velocity of v0 = 80 feet per second (or about 55 miles per hour) and leaves the bat with an initial height of h0 = 3 feet, a) Write a formula s(t) that models the height of the baseball after t seconds.b) How high is the baseball after
2 seconds?c) Find the maximum height of
the baseball. Support your answer graphically.
Copyright © 2014, 2010, 2006 Pearson Education, Inc. 24
Example: Modeling
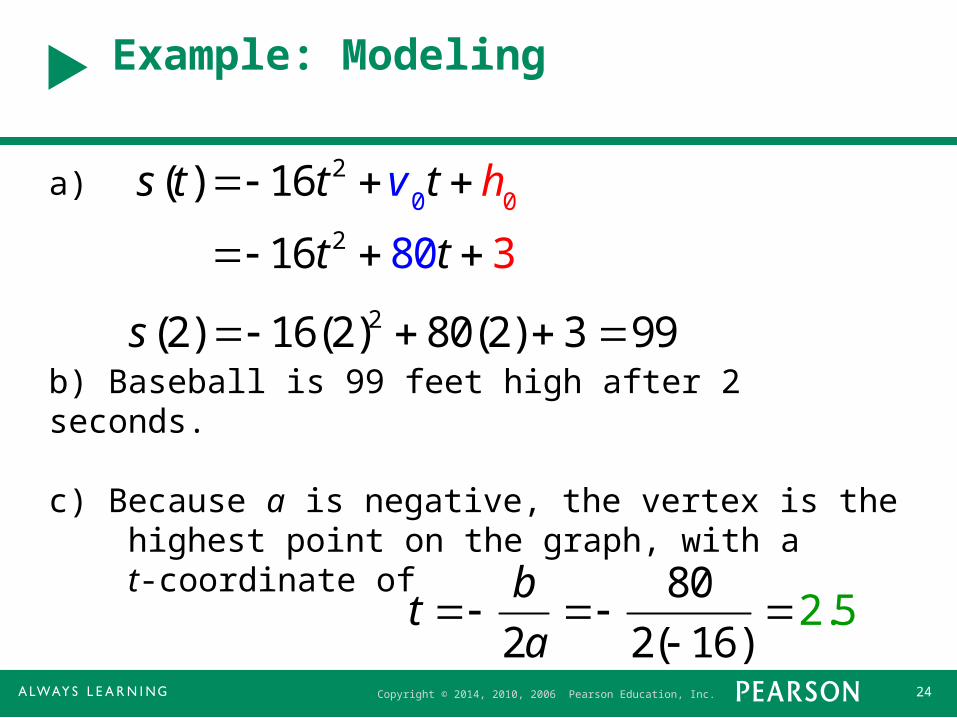
a)
b) Baseball is 99 feet high after 2 seconds.
c) Because a is negative, the vertex is the highest point on the graph, with a t-coordinate of
s(t) 16t 2 v0t h
0
16t 2 80t 3
s(2) 16(2)2 80(2) 3 99
t
b
2a
80
2( 16)2.5
Copyright © 2014, 2010, 2006 Pearson Education, Inc. 25
Example: Modeling
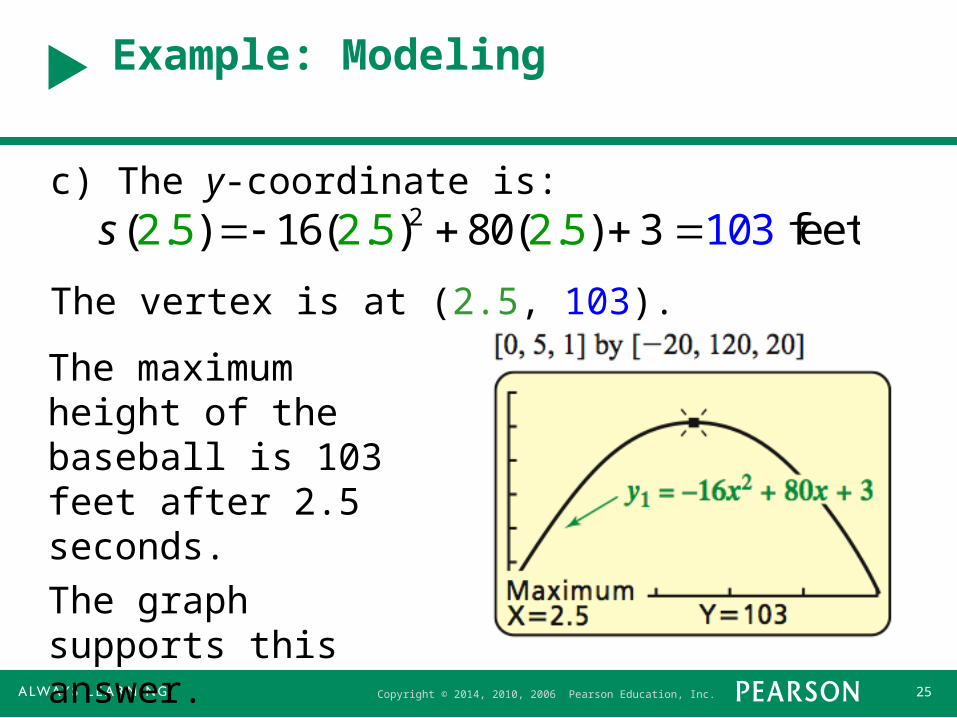
c) The y-coordinate is:
The vertex is at (2.5, 103).
s(2.5) 16(2.5)2 80(2.5) 3 103 feet
The maximum height of the baseball is 103 feet after 2.5 seconds.
The graph supports this answer.