インド経済は高成長でも、雇用が増えない可能性...-Ð æ 1. 近年のインドでは、経済が成長しても雇用は伸び悩み、特に04~07 年度は「雇用なき
世界のなかのインド経済
佐藤隆広
(神戸大学)
1
The First Conference on GIS-Based Global History from Asian Perspectives 2014年3月31日
東京大学
The first conference: GIS-based Global History from Asian Perspectives (29-31 March 2014)
アウトライン
自己紹介
はじめに
1 長期経済成長からみたインド経済
2 制度と長期経済成長
おわりに
2
The first conference: GIS-based Global History from Asian Perspectives (29-31 March 2014)
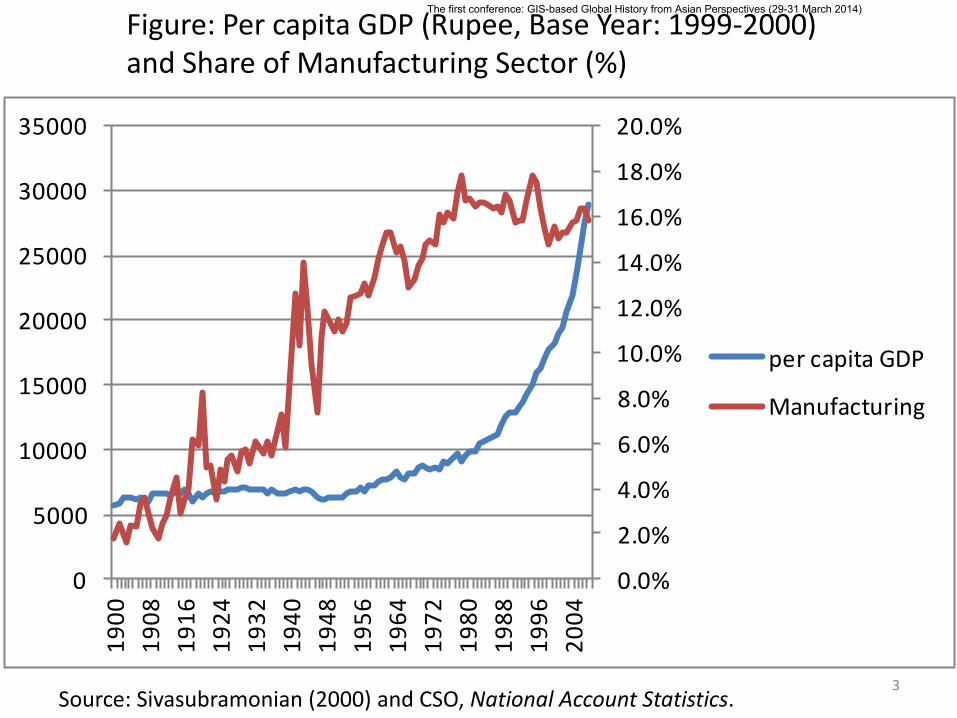
3
0.0%
2.0%
4.0%
6.0%
8.0%
10.0%
12.0%
14.0%
16.0%
18.0%
20.0%
0
5000
10000
15000
20000
25000
30000
350001
90
0
19
08
19
16
19
24
19
32
19
40
19
48
19
56
19
64
19
72
19
80
19
88
19
96
20
04
per capita GDP
Manufacturing
Figure: Per capita GDP (Rupee, Base Year: 1999-2000) and Share of Manufacturing Sector (%)
Source: Sivasubramonian (2000) and CSO, National Account Statistics.
The first conference: GIS-based Global History from Asian Perspectives (29-31 March 2014)
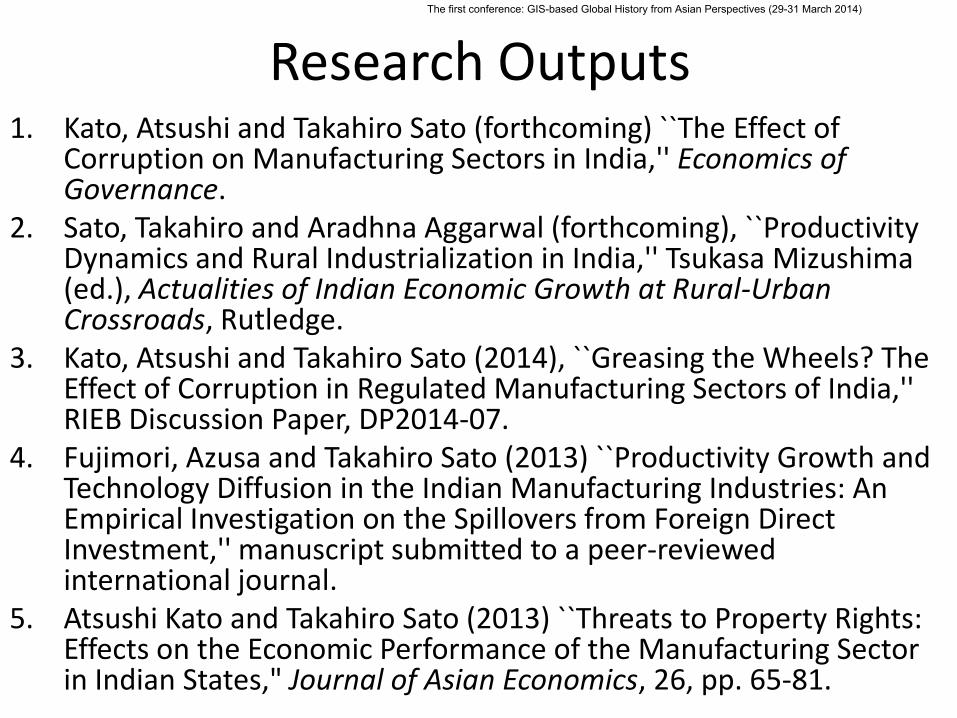
Research Outputs 1. Kato, Atsushi and Takahiro Sato (forthcoming) ``The Effect of
Corruption on Manufacturing Sectors in India,'' Economics of Governance.
2. Sato, Takahiro and Aradhna Aggarwal (forthcoming), ``Productivity Dynamics and Rural Industrialization in India,'' Tsukasa Mizushima (ed.), Actualities of Indian Economic Growth at Rural-Urban Crossroads, Rutledge.
3. Kato, Atsushi and Takahiro Sato (2014), ``Greasing the Wheels? The Effect of Corruption in Regulated Manufacturing Sectors of India,'' RIEB Discussion Paper, DP2014-07.
4. Fujimori, Azusa and Takahiro Sato (2013) ``Productivity Growth and Technology Diffusion in the Indian Manufacturing Industries: An Empirical Investigation on the Spillovers from Foreign Direct Investment,'' manuscript submitted to a peer-reviewed international journal.
5. Atsushi Kato and Takahiro Sato (2013) ``Threats to Property Rights: Effects on the Economic Performance of the Manufacturing Sector in Indian States," Journal of Asian Economics, 26, pp. 65-81.
The first conference: GIS-based Global History from Asian Perspectives (29-31 March 2014)
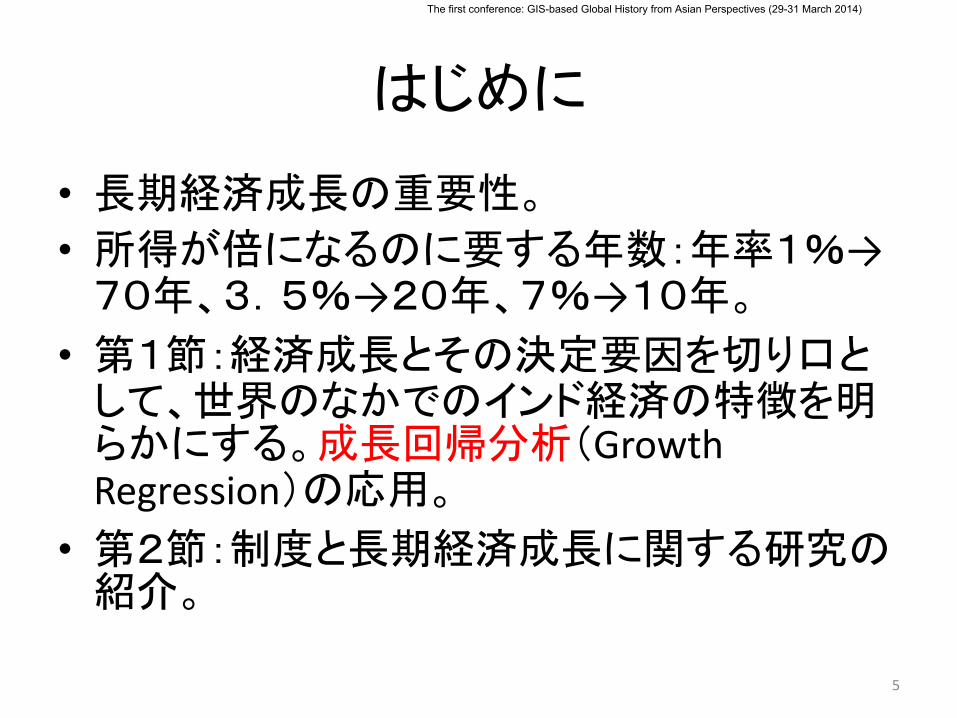
はじめに
• 長期経済成長の重要性。
• 所得が倍になるのに要する年数:年率1%→70年、3.5%→20年、7%→10年。
• 第1節:経済成長とその決定要因を切り口として、世界のなかでのインド経済の特徴を明らかにする。成長回帰分析(Growth Regression)の応用。
• 第2節:制度と長期経済成長に関する研究の紹介。
5
The first conference: GIS-based Global History from Asian Perspectives (29-31 March 2014)
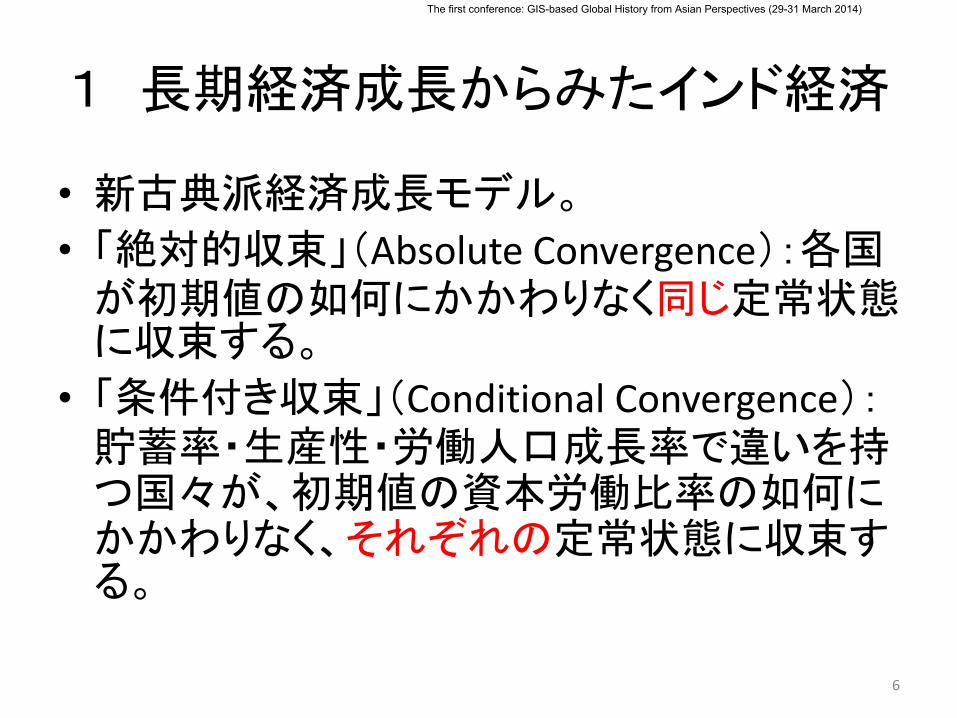
1 長期経済成長からみたインド経済
• 新古典派経済成長モデル。
• 「絶対的収束」(Absolute Convergence):各国が初期値の如何にかかわりなく同じ定常状態に収束する。
• 「条件付き収束」(Conditional Convergence):貯蓄率・生産性・労働人口成長率で違いを持つ国々が、初期値の資本労働比率の如何にかかわりなく、それぞれの定常状態に収束する。
6
The first conference: GIS-based Global History from Asian Perspectives (29-31 March 2014)
7
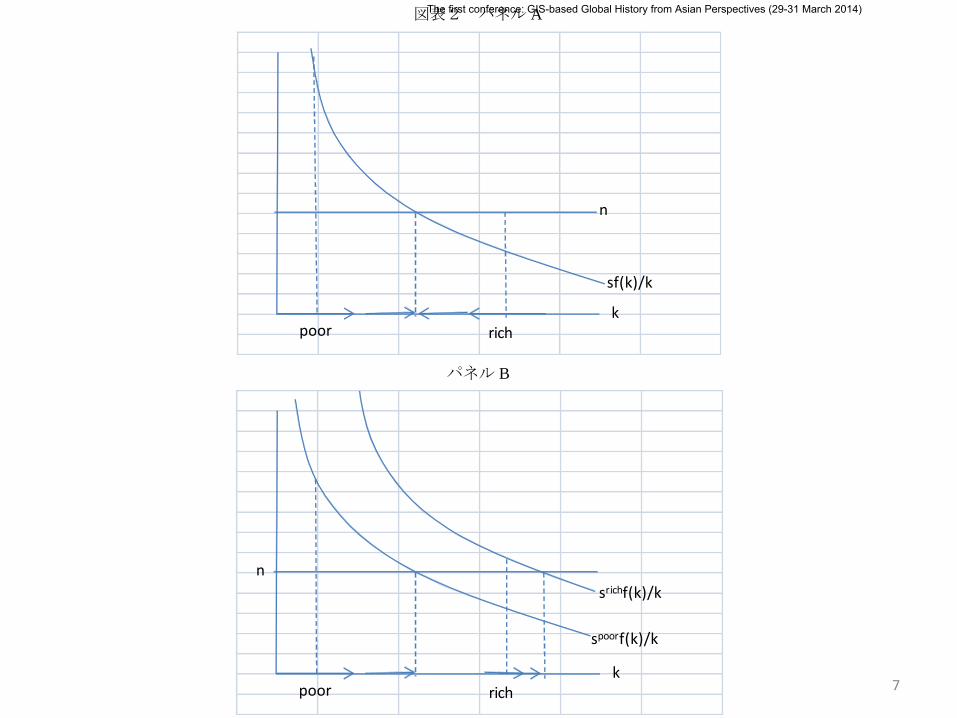
図表2 パネル A
パネル B
sf(k)/k
n
kpoor rich
spoorf(k)/k
n
kpoor rich
srichf(k)/k
The first conference: GIS-based Global History from Asian Perspectives (29-31 March 2014)

実証分析戦略(Empirical Strategy):
1.クロスカントリー(パネル)データを用いた成長回帰分析(Growth Regression)を行う。
2.成長回帰分析で示唆される経済成長率と経済成長要因との関係(散布図)のなかに、インドの軌跡をプロットする。
3.視覚的に、世界のなかのインド経済の特徴をチェックする。比較の対象として、中国も取り上げる。
8
The first conference: GIS-based Global History from Asian Perspectives (29-31 March 2014)
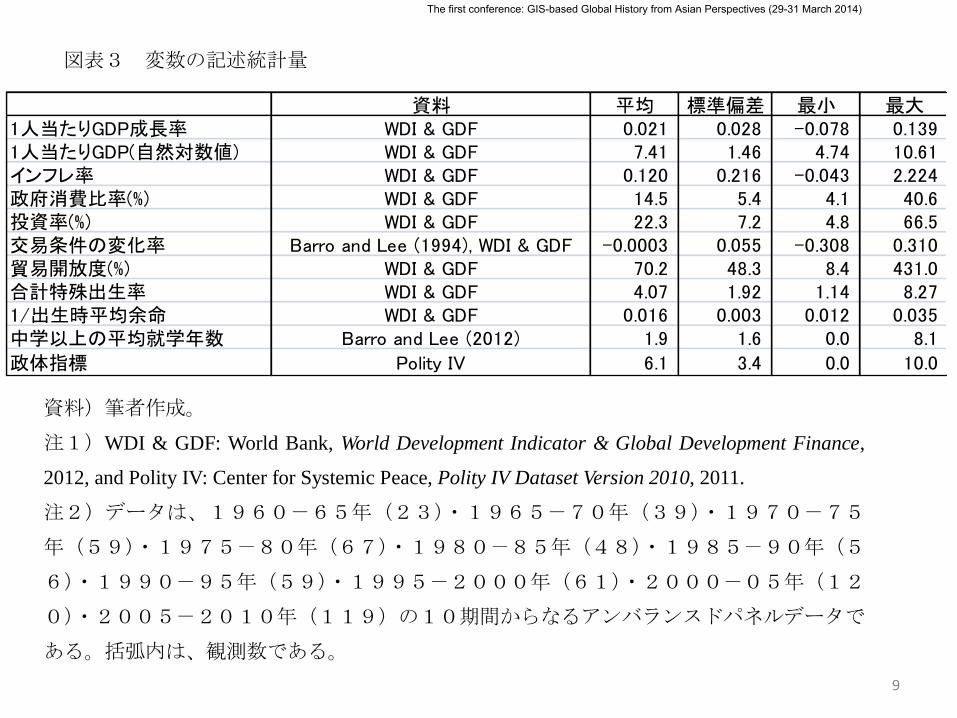
図表3 変数の記述統計量
資料)筆者作成。
注1)WDI & GDF: World Bank, World Development Indicator & Global Development Finance,
2012, and Polity IV: Center for Systemic Peace, Polity IV Dataset Version 2010, 2011.
注2)データは、1960-65年(23)・1965-70年(39)・1970-75
年(59)・1975-80年(67)・1980-85年(48)・1985-90年(5
6)・1990-95年(59)・1995-2000年(61)・2000-05年(12
0)・2005-2010年(119)の10期間からなるアンバランスドパネルデータで
ある。括弧内は、観測数である。
資料 平均 標準偏差 最小 最大1人当たりGDP成長率 WDI & GDF 0.021 0.028 -0.078 0.1391人当たりGDP(自然対数値) WDI & GDF 7.41 1.46 4.74 10.61インフレ率 WDI & GDF 0.120 0.216 -0.043 2.224政府消費比率(%) WDI & GDF 14.5 5.4 4.1 40.6投資率(%) WDI & GDF 22.3 7.2 4.8 66.5交易条件の変化率 Barro and Lee (1994), WDI & GDF -0.0003 0.055 -0.308 0.310貿易開放度(%) WDI & GDF 70.2 48.3 8.4 431.0合計特殊出生率 WDI & GDF 4.07 1.92 1.14 8.271/出生時平均余命 WDI & GDF 0.016 0.003 0.012 0.035中学以上の平均就学年数 Barro and Lee (2012) 1.9 1.6 0.0 8.1
政体指標 Polity IV 6.1 3.4 0.0 10.0
9
The first conference: GIS-based Global History from Asian Perspectives (29-31 March 2014)
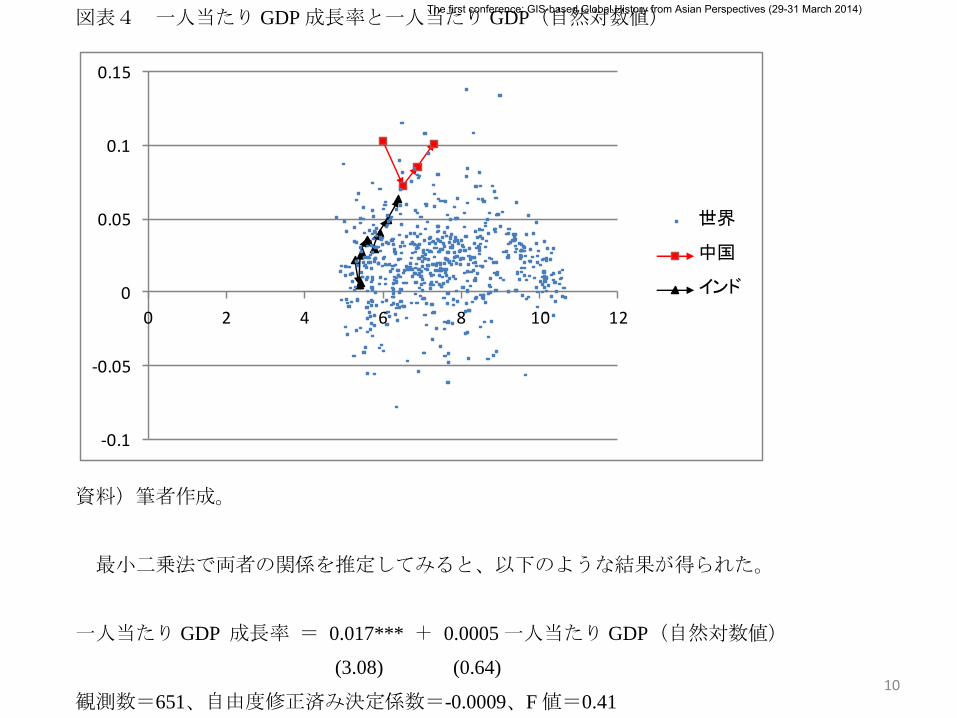
図表4 一人当たり GDP成長率と一人当たり GDP(自然対数値)
資料)筆者作成。
最小二乗法で両者の関係を推定してみると、以下のような結果が得られた。
一人当たり GDP 成長率 = 0.017*** + 0.0005一人当たり GDP(自然対数値)
(3.08) (0.64)
観測数=651、自由度修正済み決定係数=-0.0009、F値=0.41
-0.1
-0.05
0
0.05
0.1
0.15
0 2 4 6 8 10 12
世界
中国
インド
10
The first conference: GIS-based Global History from Asian Perspectives (29-31 March 2014)

11
図表5 成長回帰分析の結果(被説明変数:1人当たり GDP 成長率)
資料)筆者作成。
注1)時間ダミーのレファレンスは、1960-65年ダミーである。1965年ダミー
は1965-70年ダミーを簡略化した表現である。時間ダミーの表記については、以下
同様である。
係数 t値1人当たりGDP(自然対数値) -0.0099864 -8.92 ***
インフレ率 -0.0146363 -3.32 ***政府消費比率(%) -0.0006852 -3.61 ***投資率(%) 0.0008134 5.50 ***
交易条件の変化率(%) 0.1063879 6.28 ***貿易開放度(%) 0.0000580 2.68 ***合計特殊出生率 -0.0062061 -5.88 ***1/出生時平均余命 -2.3585640 -4.16 ***
中学以上の平均就学年数 -0.0047676 -1.76 *
(中学以上の平均就学年数)2 0.0008224 2.21 **
政体指標 -0.0025725 -1.75 *
(政体指標)2 0.0002269 1.68 *
1965年ダミー 0.0049519 0.841970年ダミー -0.0024577 -0.441975年ダミー -0.0044683 -0.801980年ダミー -0.0294873 -5.05 ***1985年ダミー -0.0183362 -3.16 ***1990年ダミー -0.0239336 -4.15 ***1995年ダミー -0.0212395 -3.66 ***2000年ダミー -0.0164464 -2.88 ***2005年ダミー -0.0246789 -4.31 ***定数項 0.1725384 9.68 ***観測数 651
自由度修正済み決定係数 0.37F値 18.86 ***
The first conference: GIS-based Global History from Asian Perspectives (29-31 March 2014)

12
図表6 説明されない一人当たり GDP 成長率と一人当たり GDP(自然対数値)
資料)筆者作成。
-0.05
0
0.05
0.1
0.15
0.2
0.25
0 2 4 6 8 10 12
世界
中国
インド
The first conference: GIS-based Global History from Asian Perspectives (29-31 March 2014)
13
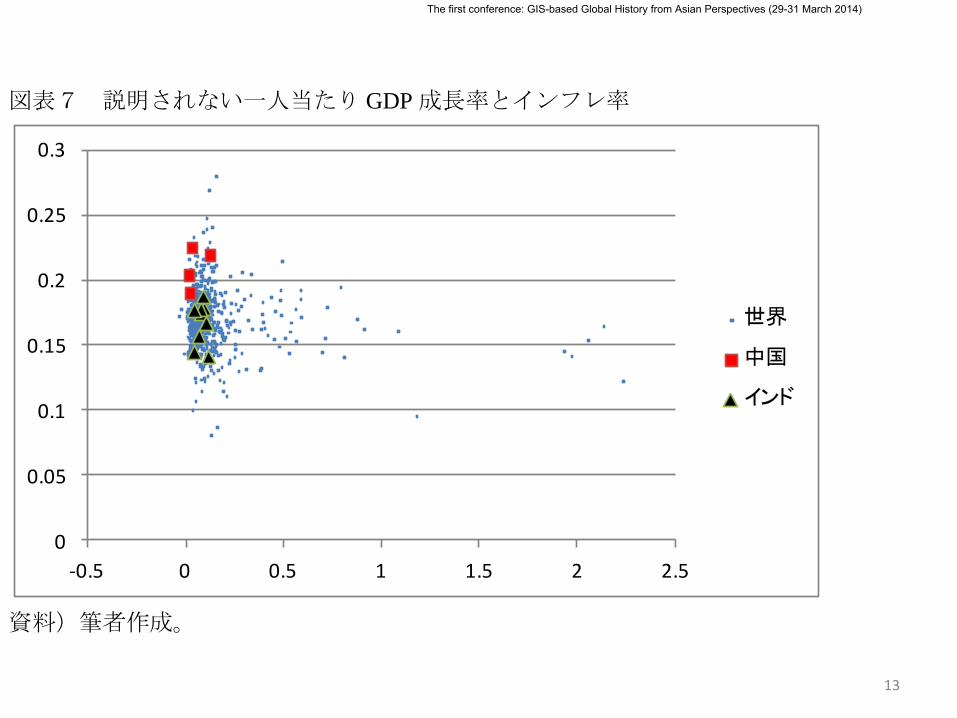
図表7 説明されない一人当たり GDP 成長率とインフレ率
資料)筆者作成。
0
0.05
0.1
0.15
0.2
0.25
0.3
-0.5 0 0.5 1 1.5 2 2.5
世界
中国
インド
The first conference: GIS-based Global History from Asian Perspectives (29-31 March 2014)
14
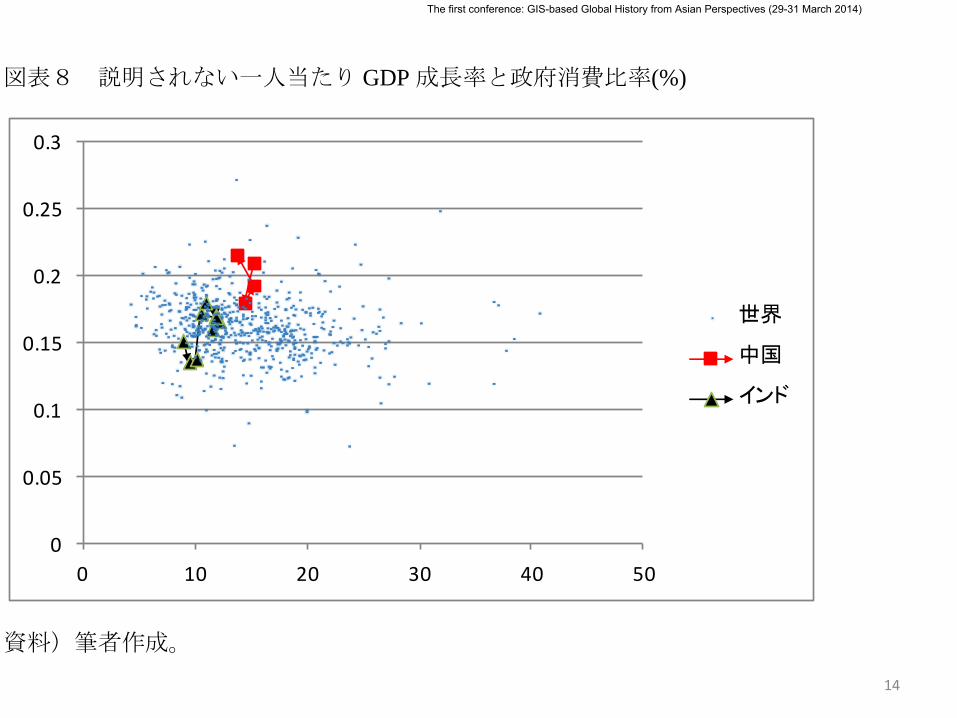
図表8 説明されない一人当たり GDP 成長率と政府消費比率(%)
資料)筆者作成。
0
0.05
0.1
0.15
0.2
0.25
0.3
0 10 20 30 40 50
世界
中国
インド
The first conference: GIS-based Global History from Asian Perspectives (29-31 March 2014)
15
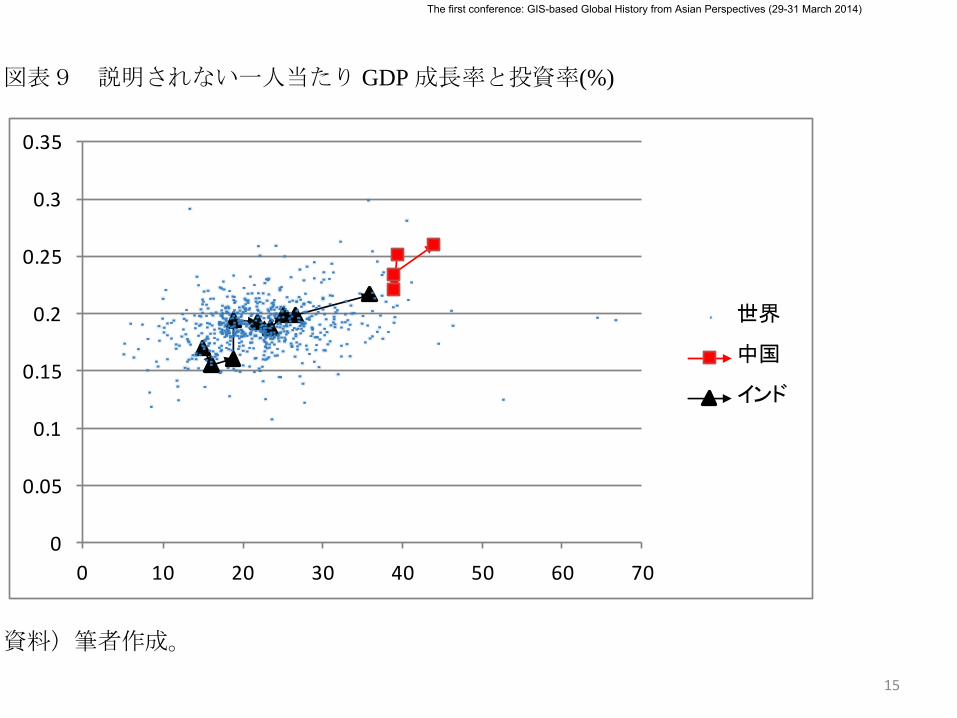
図表9 説明されない一人当たり GDP 成長率と投資率(%)
資料)筆者作成。
0
0.05
0.1
0.15
0.2
0.25
0.3
0.35
0 10 20 30 40 50 60 70
世界
中国
インド
The first conference: GIS-based Global History from Asian Perspectives (29-31 March 2014)
16
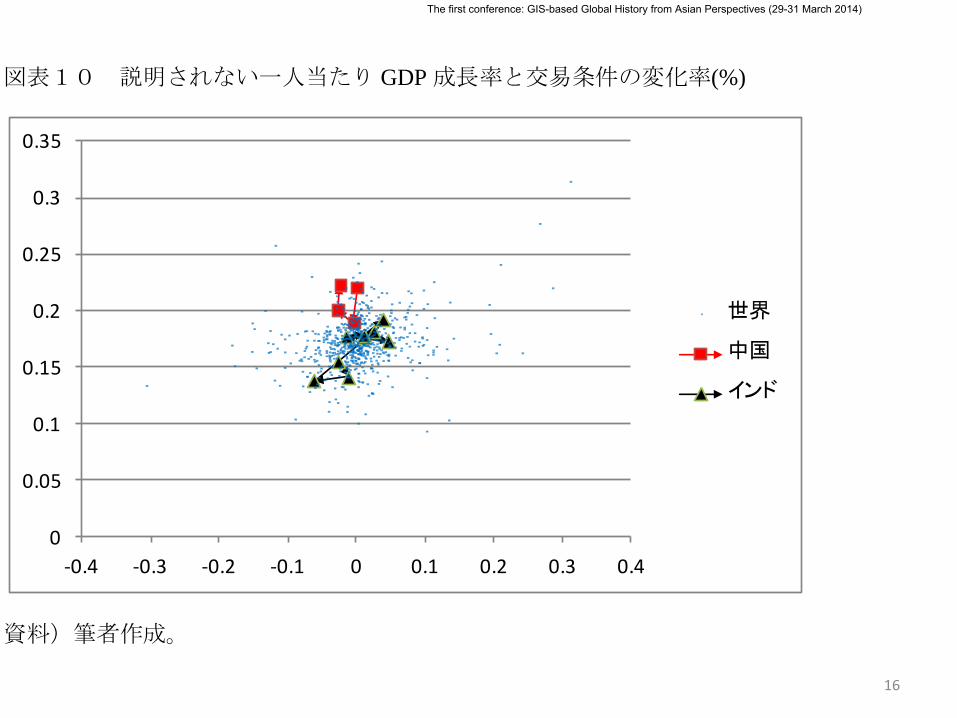
図表10 説明されない一人当たり GDP 成長率と交易条件の変化率(%)
資料)筆者作成。
0
0.05
0.1
0.15
0.2
0.25
0.3
0.35
-0.4 -0.3 -0.2 -0.1 0 0.1 0.2 0.3 0.4
世界
中国
インド
The first conference: GIS-based Global History from Asian Perspectives (29-31 March 2014)

17
図表11 説明されない一人当たり GDP 成長率と貿易開放度(%)
資料)筆者作成。
0
0.05
0.1
0.15
0.2
0.25
0.3
0.35
0 100 200 300 400 500
世界
中国
インド
The first conference: GIS-based Global History from Asian Perspectives (29-31 March 2014)
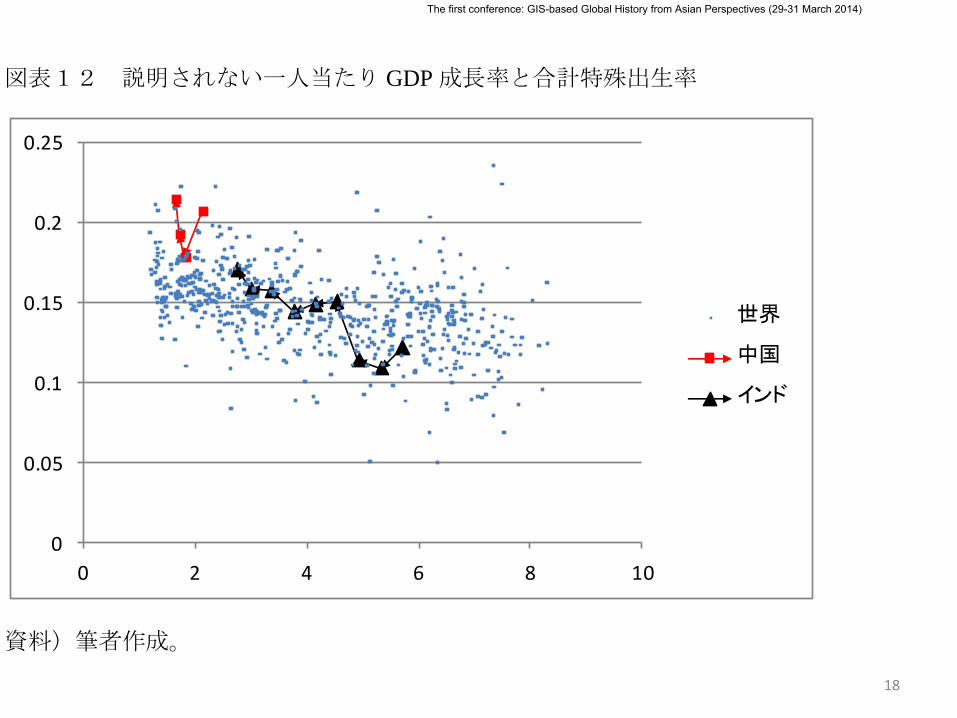
18
図表12 説明されない一人当たり GDP 成長率と合計特殊出生率
資料)筆者作成。
0
0.05
0.1
0.15
0.2
0.25
0 2 4 6 8 10
世界
中国
インド
The first conference: GIS-based Global History from Asian Perspectives (29-31 March 2014)

19
図表13 説明されない一人当たり GDP 成長率と出生時平均余命の逆数
資料)筆者作成。
0
0.05
0.1
0.15
0.2
0.25
0.3
0 0.01 0.02 0.03 0.04
世界
中国
インド
The first conference: GIS-based Global History from Asian Perspectives (29-31 March 2014)
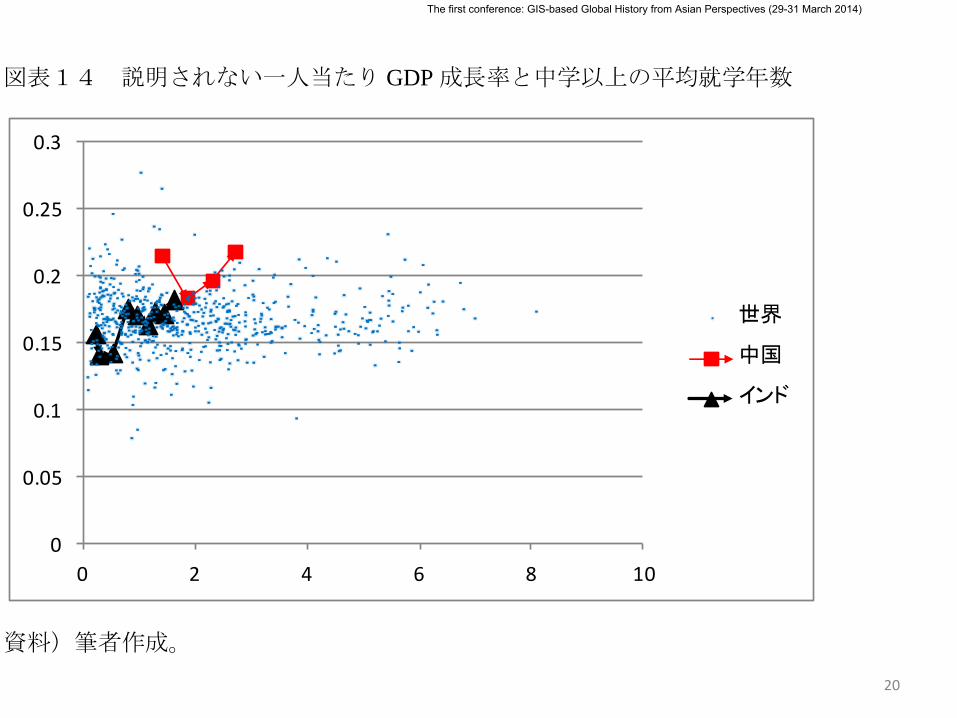
20
図表14 説明されない一人当たり GDP 成長率と中学以上の平均就学年数
資料)筆者作成。
0
0.05
0.1
0.15
0.2
0.25
0.3
0 2 4 6 8 10
世界
中国
インド
The first conference: GIS-based Global History from Asian Perspectives (29-31 March 2014)
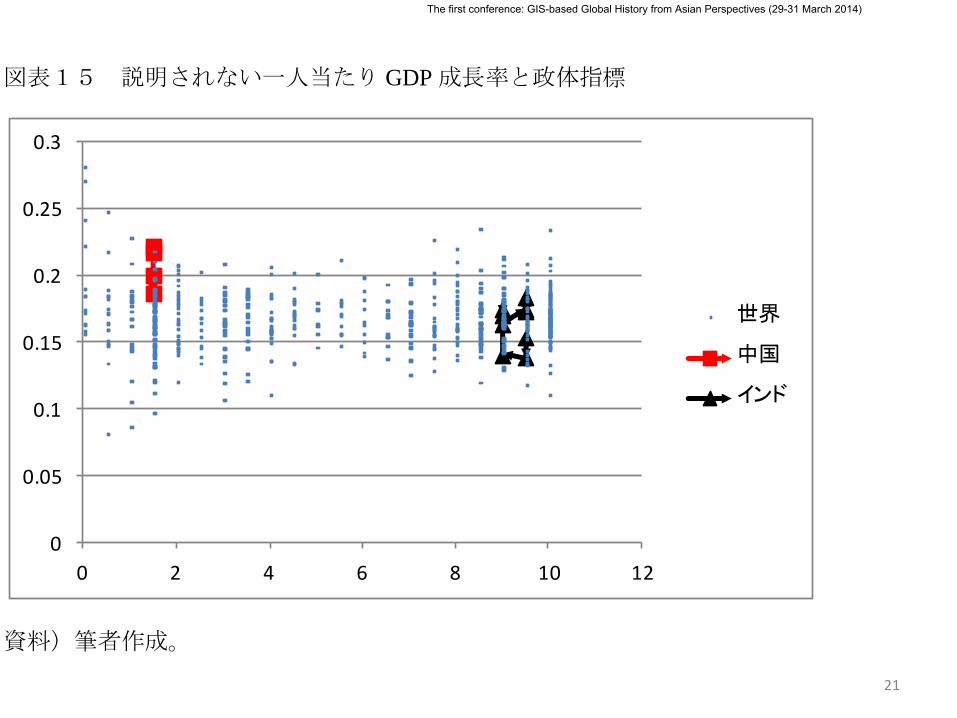
21
図表15 説明されない一人当たり GDP 成長率と政体指標
資料)筆者作成。
0
0.05
0.1
0.15
0.2
0.25
0.3
0 2 4 6 8 10 12
世界
中国
インド
The first conference: GIS-based Global History from Asian Perspectives (29-31 March 2014)
2 制度と長期経済成長
22
The first conference: GIS-based Global History from Asian Perspectives (29-31 March 2014)
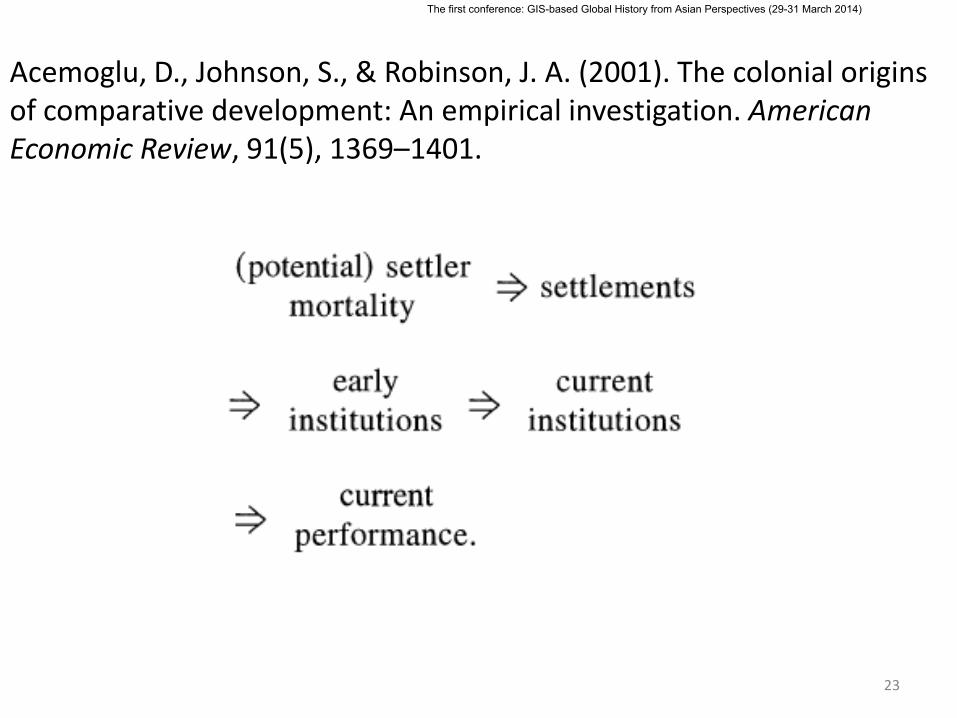
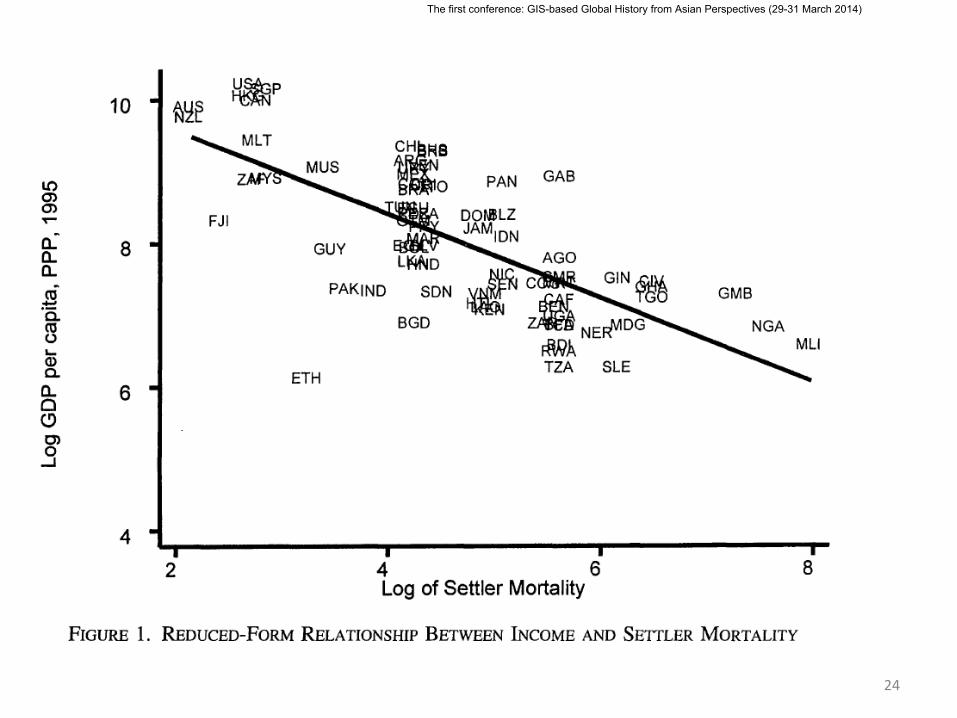
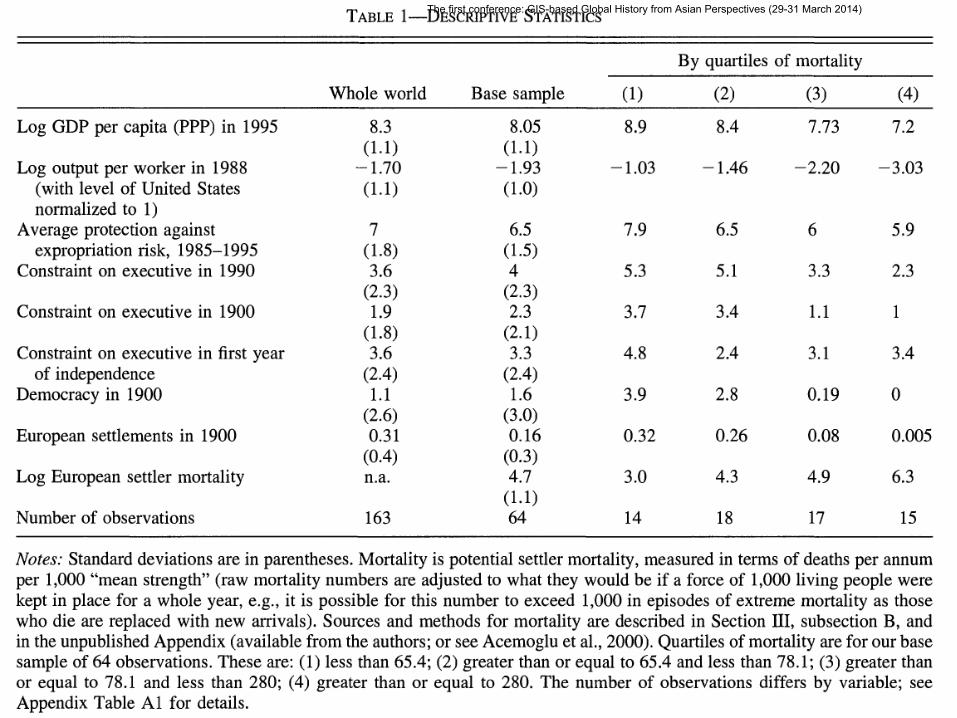
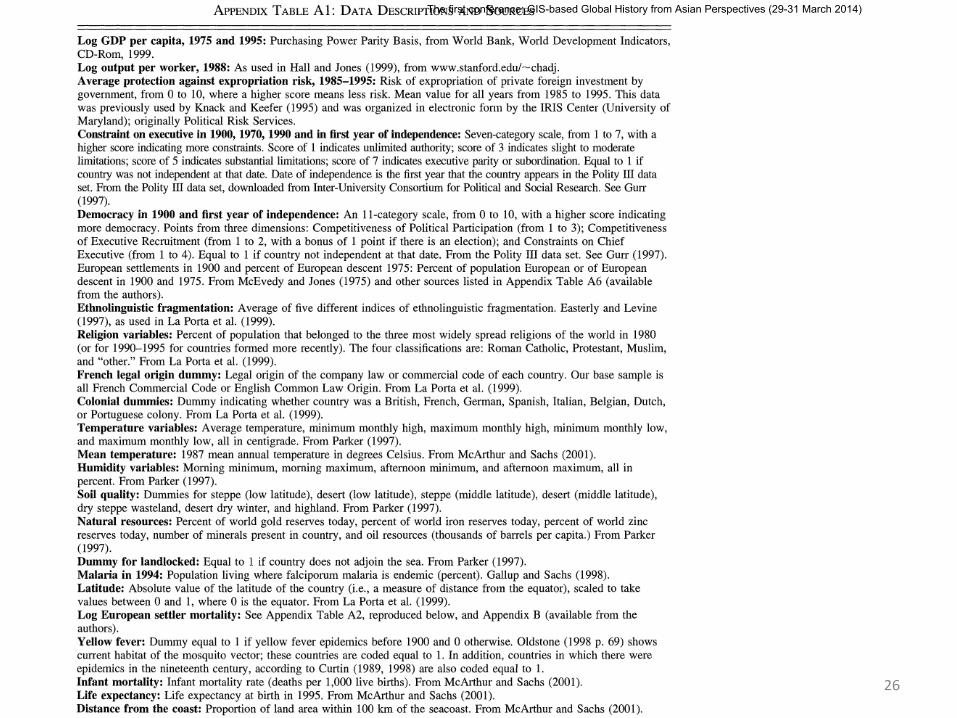
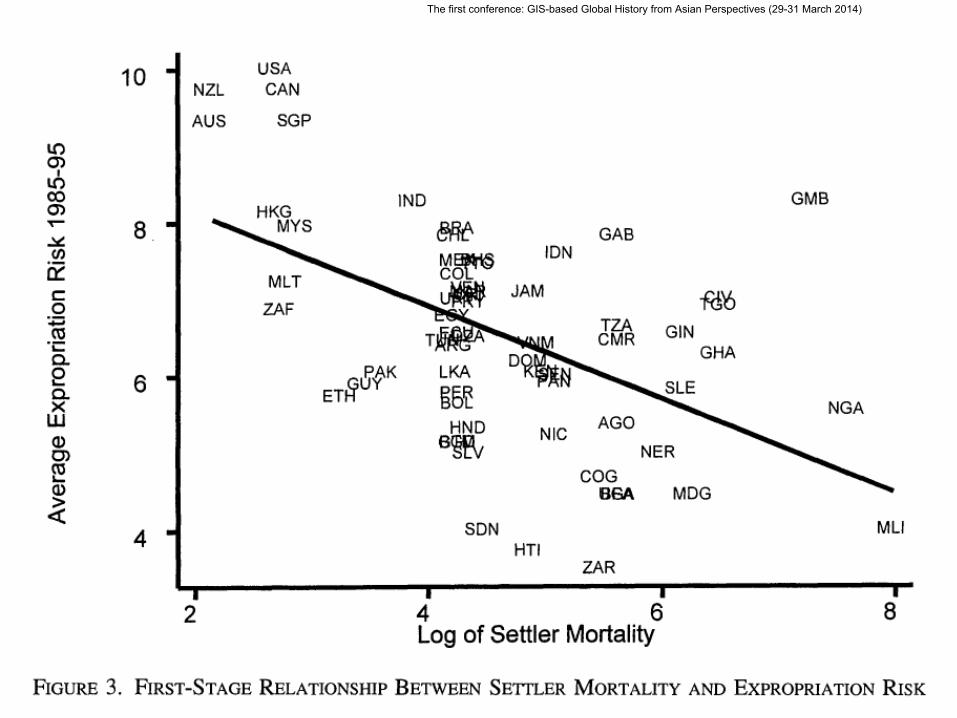
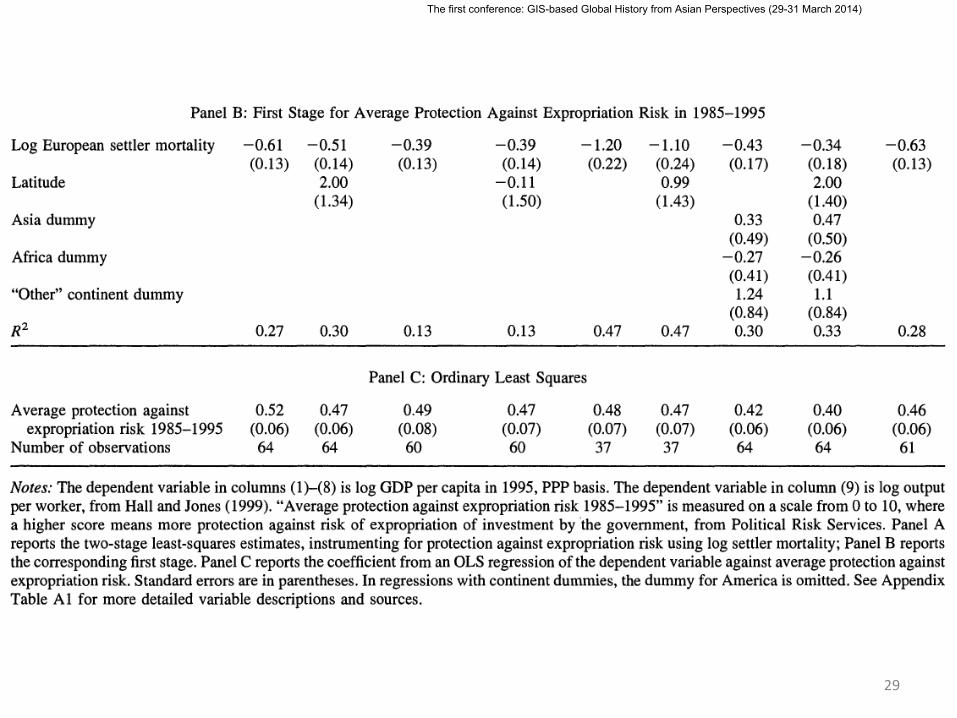
Acemoglu, D., Johnson, S., & Robinson, J. A. (2001). The colonial origins of comparative development: An empirical investigation. American Economic Review, 91(5), 1369–1401.
23
The first conference: GIS-based Global History from Asian Perspectives (29-31 March 2014)
24
The first conference: GIS-based Global History from Asian Perspectives (29-31 March 2014)
25
The first conference: GIS-based Global History from Asian Perspectives (29-31 March 2014)
26
The first conference: GIS-based Global History from Asian Perspectives (29-31 March 2014)
27
The first conference: GIS-based Global History from Asian Perspectives (29-31 March 2014)

28
The first conference: GIS-based Global History from Asian Perspectives (29-31 March 2014)
29
The first conference: GIS-based Global History from Asian Perspectives (29-31 March 2014)

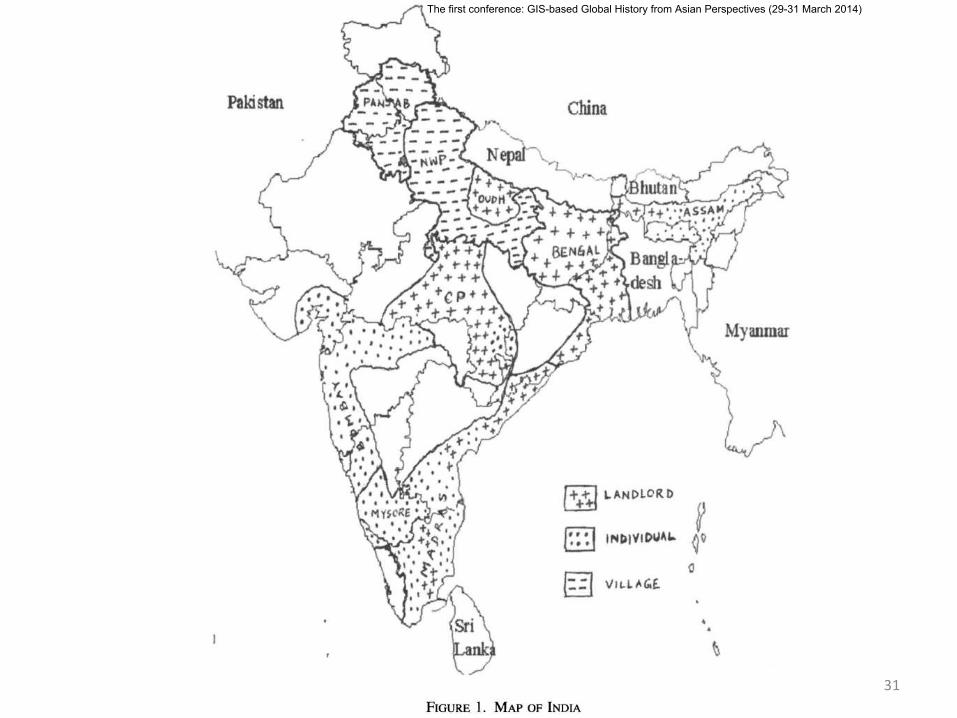
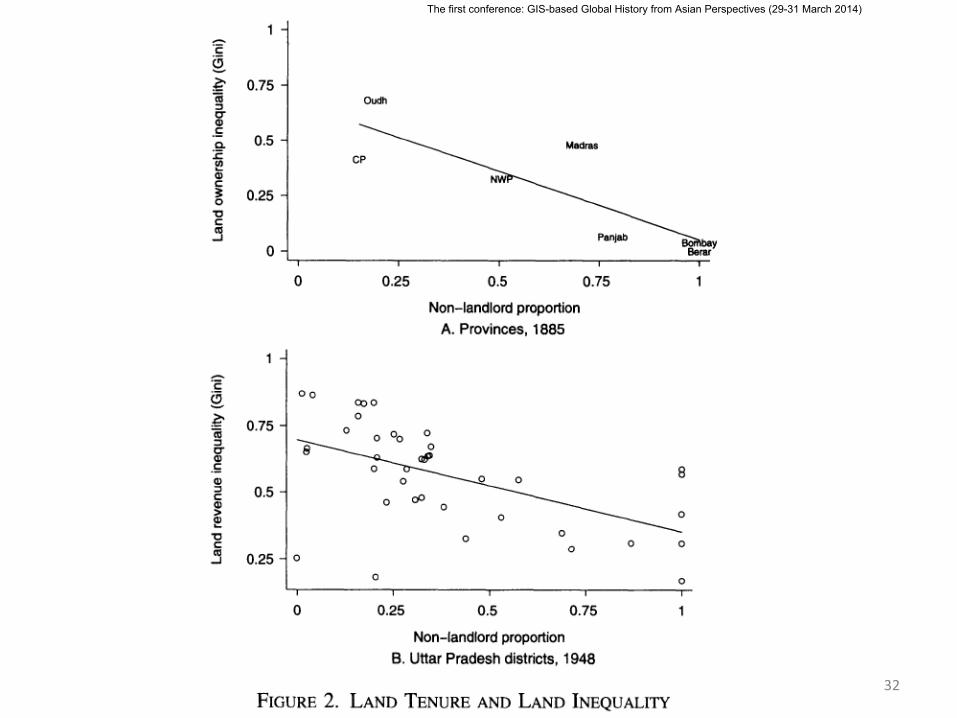
Abhijit Banerjee and Lakshmi Iyer (2005), History, Institutions, and Economic Performance: The Legacy of Colonial Land Tenure Systems in India, The American Economic Review, Vol. 95, No. 4 (Sep., 2005), pp.
1190-1213
30
The first conference: GIS-based Global History from Asian Perspectives (29-31 March 2014)
31
The first conference: GIS-based Global History from Asian Perspectives (29-31 March 2014)
32
The first conference: GIS-based Global History from Asian Perspectives (29-31 March 2014)

33
The first conference: GIS-based Global History from Asian Perspectives (29-31 March 2014)

34
The first conference: GIS-based Global History from Asian Perspectives (29-31 March 2014)

35
The first conference: GIS-based Global History from Asian Perspectives (29-31 March 2014)
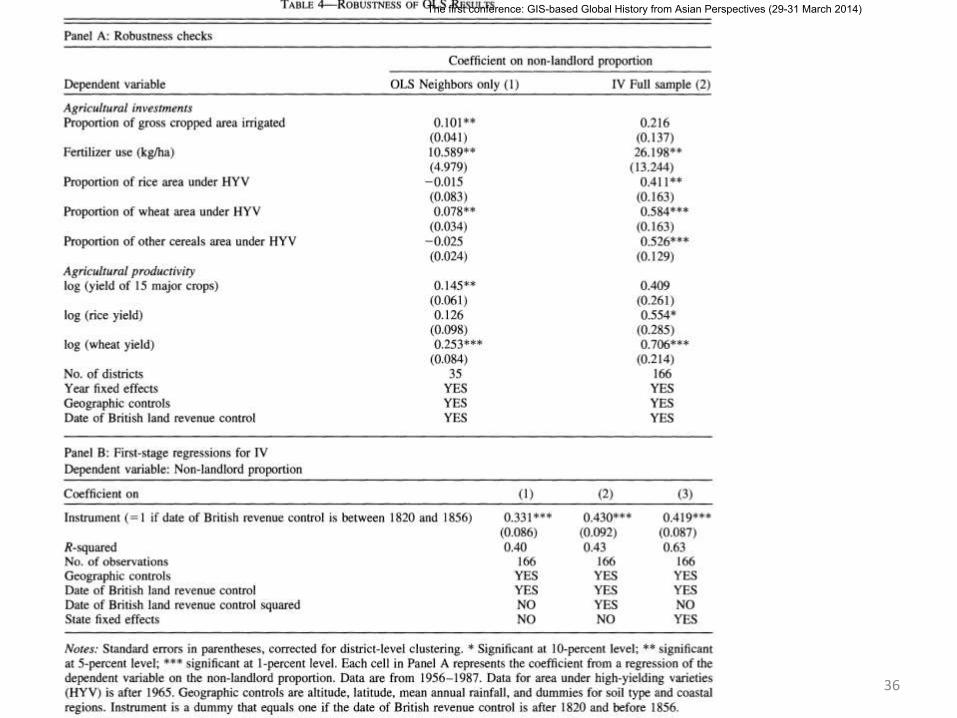
36
The first conference: GIS-based Global History from Asian Perspectives (29-31 March 2014)

37
The first conference: GIS-based Global History from Asian Perspectives (29-31 March 2014)
おわりに
• ベンチマークとしての新古典派経済成長モデル
• 条件付き収束と総要素生産性(TFP)
• 制度と長期経済成長→空間と歴史の重要性
38
The first conference: GIS-based Global History from Asian Perspectives (29-31 March 2014)
ご清聴有難うございました
Email: [email protected]
39
The first conference: GIS-based Global History from Asian Perspectives (29-31 March 2014)