Climate Variability, Extremes and Change in the Western ... 1.3). Wind-waves around Vanuatu do not...
22
319 Chapter 16 Vanuatu
Transcript of Climate Variability, Extremes and Change in the Western ... 1.3). Wind-waves around Vanuatu do not...

319
Chapter 16 Vanuatu
320 Climate Variability, Extremes and Change in the Western Tropical Pacific: New Science and Updated Country Reports
16.1.1 Current Climate• Maximum and minimum air
temperatures increased at Bauerfield Airport (Port Vila) from 1948–2011 as did November–April and May–October maximum temperatures at Aneityum. This is consistent with global warming.
• Annual and half-year rainfall trends show little change at Bauerfield Airport since 1907 and Aneityum since 1949. Extreme daily rainfall trends also show little change at Aneityum and Bauerfield Airport since 1945.
• Tropical cyclones affect Vanuatu mainly between November and April. An average of 24 cyclones per decade developed within or crossed the Vanuatu Exclusive Economic Zone (EEZ) between the 1969/70 to 2010/11 seasons. Twenty-nine of the 71 tropical cyclones (41%) between the 1981/82 and 2010/11 seasons were severe events (Category 3 or stronger) in the Vanuatu EEZ. Available data are not suitable for assessing long-term trends (see Section 1.3).
Wind-waves around Vanuatu do not vary significantly throughout the year, having fairly constant wave heights and periods, and being typically directed from the south-east. Waves are influenced by the southern trade winds and movement of the South Pacific Convergence Zone (SPCZ), and display some variability on interannual time scales with the El Niño–Southern Oscillation (ENSO) and Southern Annular Mode (SAM). Available data are not suitable for assessing long-term trends.
16.1.2 Climate Projections• For the period to 2100, the latest
global climate model (GCM) projections and climate science findings indicate:
• El Niño and La Niña events will continue to occur in the future (very high confidence), but there is little consensus on whether these events will change in intensity or frequency;
• Annual mean temperatures and extremely high daily temperatures will continue to rise (very high confidence);
• Mean annual rainfall could increase or decrease with the model average indicating little change (low confidence), with more extreme rain events (high confidence);
• Incidence of drought is projected to decrease slightly under the high emission scenario and stay approximately the same under the other emissions scenarios (low confidence);
• Ocean acidification is expected to continue (very high confidence);
• The risk of coral bleaching will increase in the future (very high confidence);
• Sea level will continue to rise (very high confidence); and
• Wet season wave heights and periods are projected to decrease slightly (low confidence), with no significant changes projected in the dry season (low confidence).
16.1 Climate Summary
321Chapter 16: Vanuatu
Information on temperature and rainfall seasonal cycles can be found in Australian Bureau of Meteorology and CSIRO (2011).
16.3.1 Wind-driven WavesSurface wind-wave driven processes can impact on many aspects of Pacific Island coastal environments, including: coastal flooding during storm wave events; coastal erosion, both during episodic storm events and due to long-term changes in integrated wave climate; characterisation of reef morphology and marine habitat/species distribution; flushing and circulation of lagoons; and potential shipping and renewable wave energy
solutions. The surface offshore wind-wave climate can be described by characteristic wave heights, lengths or periods, and directions.
The wind-wave climate of Vanuatu shows little spatial variability across the region.
Near the capital Port Vila, waves are characterised by the Southern Hemisphere trade winds. At this location, waves from the north and east are blocked by the island. Mean wave properties do not vary significantly through the year (Table 16.1). During June–September, waves come mainly from the southeast, consisting of trade wind generated waves from the south-east, and a component of swell propagated
from storm events in the Southern Ocean. During December–March, mean waves are slightly smaller than in June–September due to reduced local winds under the South Pacific Convergence Zone (SPCZ), with more variable wave direction (Figure 16.1) due to westerly waves associated with storms and tropical cyclones. Waves larger than 2.8 m (99th percentile) at Port Vila are directed from the south-east year-round, and from various directions from south through to north-west during the wet season. During the dry season, large westerly waves are seen occasionally. The height of a 1-in-50 year wave event near Port Vila is calculated to be 7.8 m.
16.2 Data Availability
There are currently 47 operational meteorological stations in Vanuatu. Multiple observations within a 24-hour period are taken at Sola, Pekoa, Saratamata, Lamap, Bauerfield, Whitegrass and Analguahat (Aneityum). At three climate stations (Lambubu, Lamap and Aneityum) and at 39 rainfall stations across the country, a single observation is taken at 9.00 am local time. The primary climate stations are located at Port Vila and Bauerfield Airport on the island of Efate. Several stations, including Iririki
(Port Vila), have rainfall data from the early 1900s. Iririki also has the earliest air temperature observations which began in the late 1940s.
An Iririki-PortVila-Bauerfield composite has been created and named Bauerfield Airport. Bauerfield Airport monthly rainfall from 1907 (daily values from 1949) and air temperature from 1949, and Aneityum rainfall and air temperature from 1948 have been used in this report. The Bauerfield Airport composite and Aneityum records are homogeneous.
Wind-wave data from buoys are particularly sparse in the Pacific region, with very short records. Model and reanalysis data are therefore required to detail the wind-wave climate of the region. Reanalysis surface wind data have been used to drive a wave model over the period 1979–2009 to generate a hindcast of the historical wind-wave climate.
16.3 Seasonal Cycles

322 Climate Variability, Extremes and Change in the Western Tropical Pacific: New Science and Updated Country Reports
Table 16.1: Mean wave height, period and direction from which the waves are travelling around Vanuatu in December–March and June–September. Observation (hindcast) and climate model simulation mean values are given with the 5–95th percentile range (in brackets). Historical model simulation values are given for comparison with projections (see Section 16.5.6 – Wind-driven waves, and Table 16.7). A compass relating number of degrees to cardinal points (direction) is shown.
Hindcast Reference Data (1979–2009) – Port Vila
Hindcast Reference Data (1979–2009) – Aneityum
Climate Model Simulations (1986–2005) –
Vanuatu
Wave Height(metres)
December–March 1.1 (0.5–2.1) 1.9 (1.2–3.0) 1.5 (1.2–1.8)
June–September 1.3 (0.6–2.2) 2.1 (1.3–3.2) 1.6 (1.2–2.0)
Wave Period(second)
December–March 7.4 (5.5–9.8) 9.0 (7.2–11.3) 7.7 (7.0–8.3)
June–September 7.2 (5.5–9.9) 9.6 (7.4–12.4) 7.1 (6.5–7.8)
Wave Direction(degrees clockwise
from North)
December–March 150 (120–280) 150 (110–200) 90 (60–110)
June–September 140 (120–180) 160 (110–200) 120 (110–130)
In the south at Aneityum, waves are also characterised by the Southern Hemisphere trade winds, with swell propagating from the south-southwest from extra-tropical storms in the Southern Ocean. Wave properties do not change significantly throughout the year (Figure 16.2). During June–September, waves to the south of Aneityum are locally generated by south-easterly trade winds with south-westerly swell from Southern Ocean storms, and a slightly greater mean wave height and period (seasonal mean height around 2.1 m and period 9.6 s) in June–September than in December–March (Table 16.1). During December–March, waves
are mostly generated locally in the south-east by trade winds, with some south-easterly and south-westerly swell. Waves larger than 4.0 m (99th percentile) are directed predominantly from the south-east, with some waves from other directions observed in the wet season due to tropical cyclones. The height of a 1-in-50 year wave event at Aneityum is calculated to be 8.7 m.
No suitable dataset is available to assess long-term historical trends in the Vanuatu wave climate. However, interannual variability may be assessed in the hindcast record. The wind-wave climate displays interannual variability
at Port Vila and Aneityum, varying with the El Niño–Southern Oscillation (ENSO), and changing slightly with the Southern Annualar Mode (SAM) at Aneityum. During La Niña years waves are slightly more strongly directed from the east in June–September due to enhanced trade winds, with a reduction in wave power and southerly rotation in December–March due to position and strength of the SPCZ over Vanuatu reducing local winds. When the SAM index is negative, westerlies blow further north in the higher latitudes, resulting in a southerly rotation of waves at Aneityum with more westerly swell.
323Chapter 16: Vanuatu
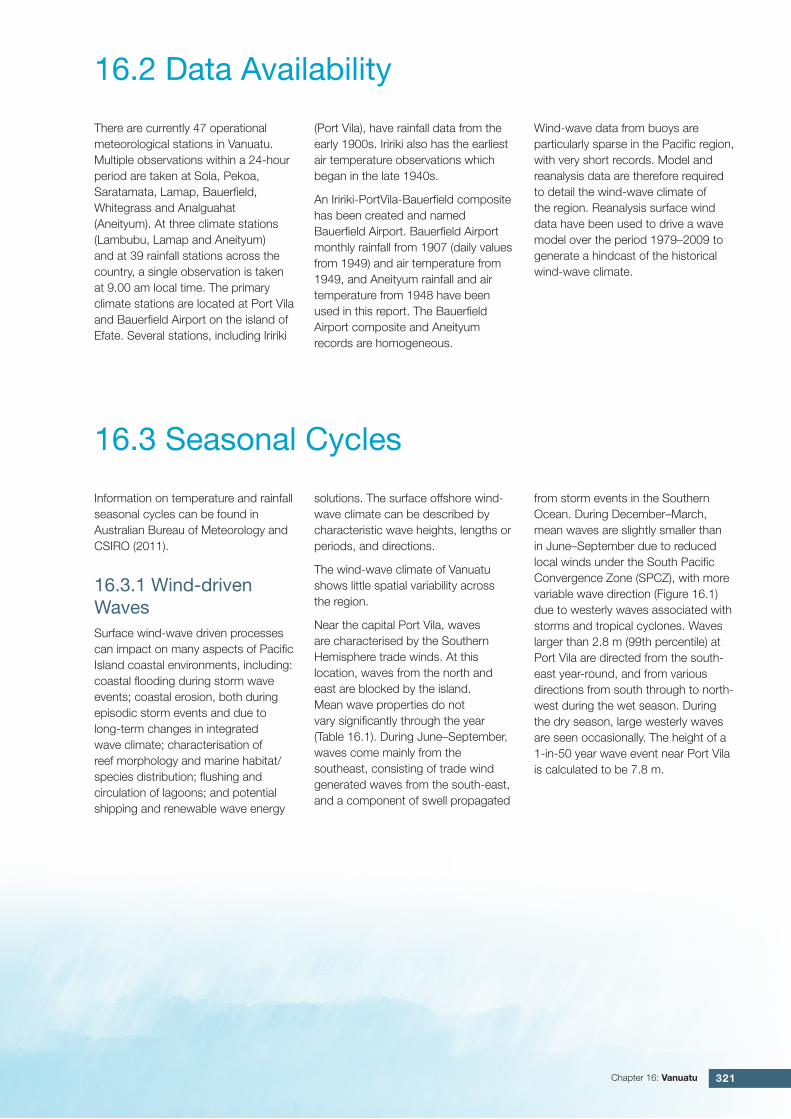
Figure 16.1: Mean annual cycle of wave height (grey) and mean wave direction (blue) at Port Vila in hindcast data (1979–2009). To give an indication of interannual variability of the monthly means of the hindcast data, shaded boxes show 1 standard deviation around the monthly means, and error bars show the 5–95% range. The direction from which the waves are travelling is shown (not the direction towards which they are travelling).
Figure 16.2: Mean annual cycle of wave height (grey) and mean wave direction (blue) at Aneityum in hindcast data (1979–2009). To give an indication of interannual variability of the monthly means of the hindcast data, shaded boxes show 1 standard deviation around the monthly means, and error bars show the 5–95% range. The direction from which the waves are travelling is shown (not the direction towards which they are travelling).
324 Climate Variability, Extremes and Change in the Western Tropical Pacific: New Science and Updated Country Reports
16.4.1 Air Temperature
Annual and Half-year Mean Air Temperature
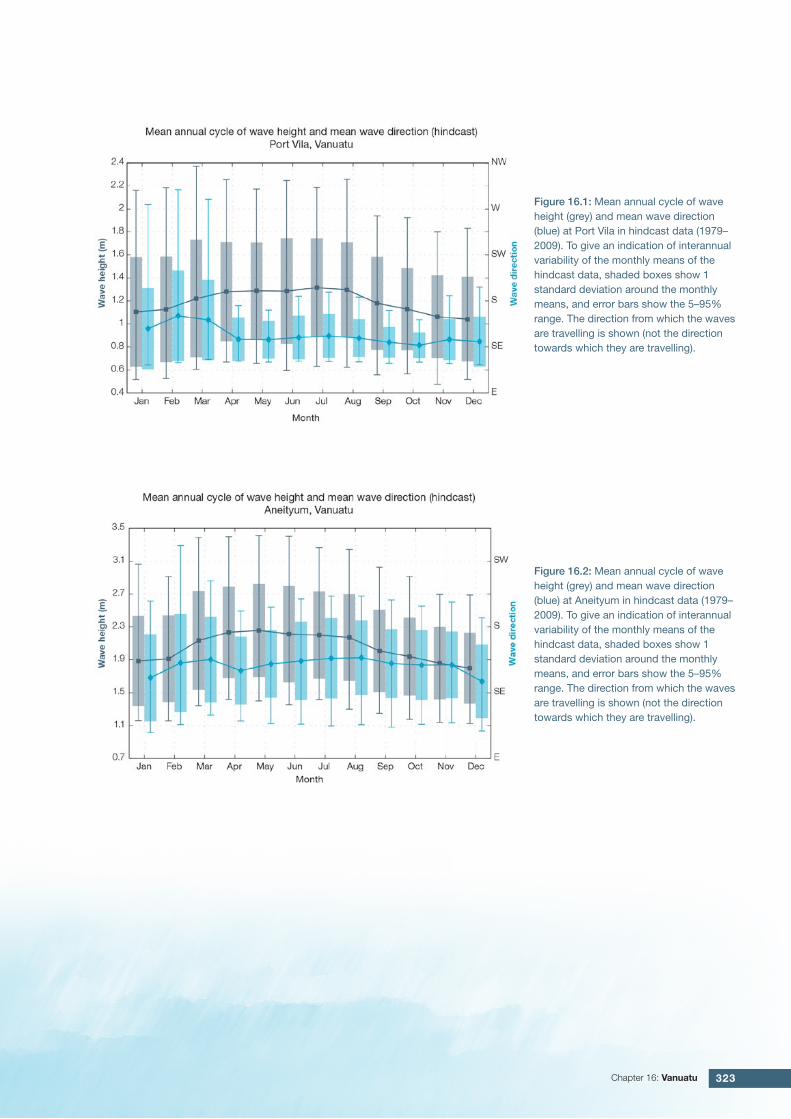
Over the period 1948–2011, maximum and minimum temperatures at Bauerfield Airport (Port Vila) increased as did November–April and May–October maximum temperatures at Aneityum (Figure 16.3, Figure 16.4 and Table 16.2). These temperature trends are statistically significant at the 5% level. Half-year Aneityum minimum temperature trends show little change.
16.4 Observed Trends
Figure 16.3: Observed time series of annual average values of mean air temperature (red dots and line) and total rainfall (bars) at Bauerfield Airport (Port Vila). Light blue, dark blue and grey bars denote El Niño, La Niña and neutral years respectively. Solid black trend lines indicate a least squares fit.
Table 16.2: Annual and half-year trends in air temperature (Tmax, Tmin, Tmean) and rainfall at Bauerfield Airport (top) and Aneityum (bottom). The 95% confidence intervals are shown in brackets. Values for trends significant at the 5% level are shown in boldface. A dash (-) indicates insufficient data for calculating trends.
Bauerfield Airport
Tmax(°C/10yrs)
Tmin(°C/10yrs)
Tmean(°C/10yrs)
Total Rain(mm/10yrs)
1948–2011 1907–2011
Annual +0.11(+0.06, +0.16)
+0.16(+0.07, +0.22)
+0.14(+0.08, +0.19)
+25.9 (-24.7, +76.8)
Nov-Apr +0.12(+0.02, +0.19)
+0.15(+0.05, +0.23)
+0.14(+0.07, +0.21)
+17.1 (-15.0, +53.3)
May-Oct +0.11(+0.05, +0.18)
+0.17(+0.08, +0.25)
+0.14(+0.07, +0.20)
+8.2 (-12.5, +30.6)
AneityumTmax
(°C /10yrs)Tmin
(°C/10yrs)Tmean
(°C/10yrs)Total Rain
(mm/10yrs)
1948–2011
Annual - - - -40.9 (-111.9, +45.6)
Nov–Apr +0.14(+0.02, +0.27)
+0.06(-0.06, +0.17)
+0.10(+0.01, +0.18)
+15.6 (-66.0, +82.5)
May–Oct +0.12(+0.06, +0.20)
+0.04(-0.09, +0.17)
+0.09(0.00, +0.16)
-26.6 (-72.0, +13.4)
325Chapter 16: Vanuatu
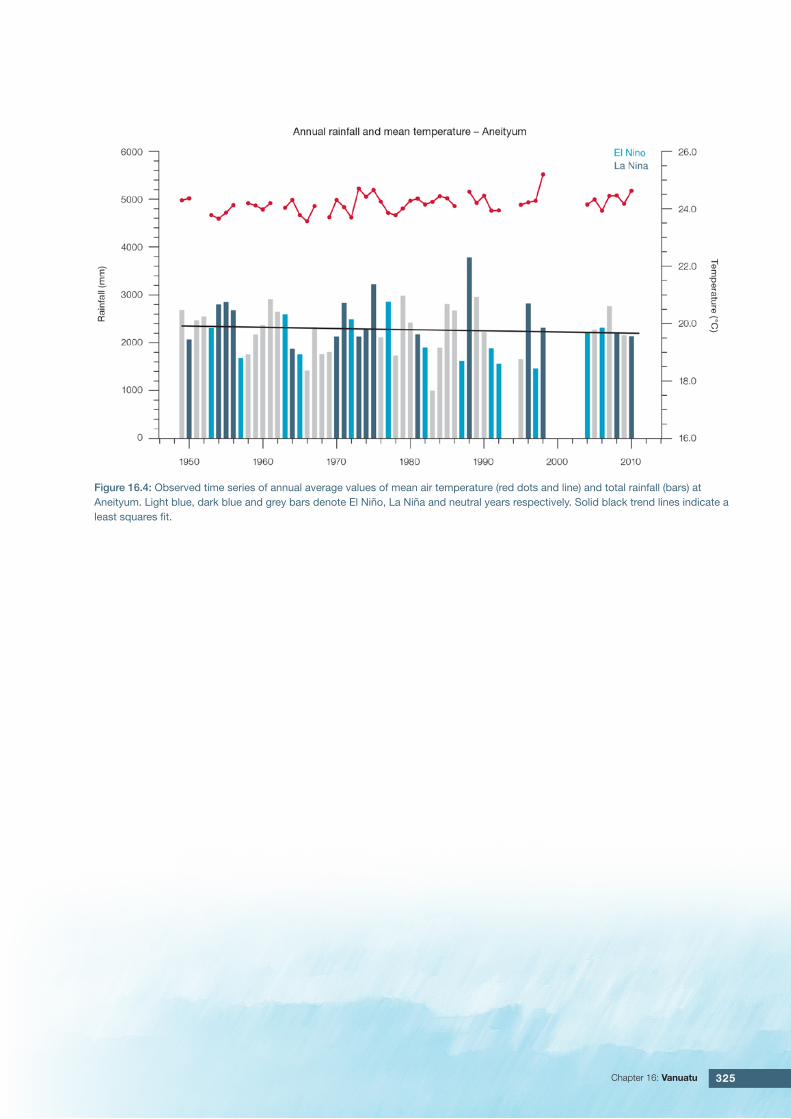
Figure 16.4: Observed time series of annual average values of mean air temperature (red dots and line) and total rainfall (bars) at Aneityum. Light blue, dark blue and grey bars denote El Niño, La Niña and neutral years respectively. Solid black trend lines indicate a least squares fit.
326 Climate Variability, Extremes and Change in the Western Tropical Pacific: New Science and Updated Country Reports
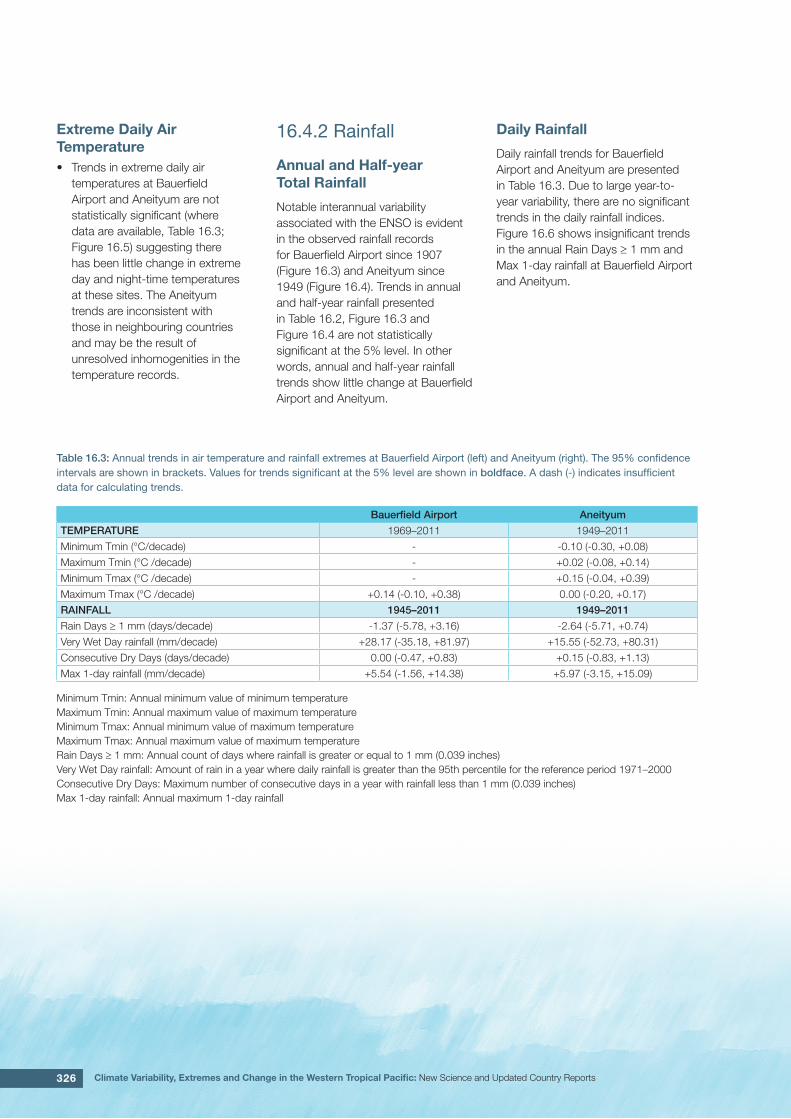
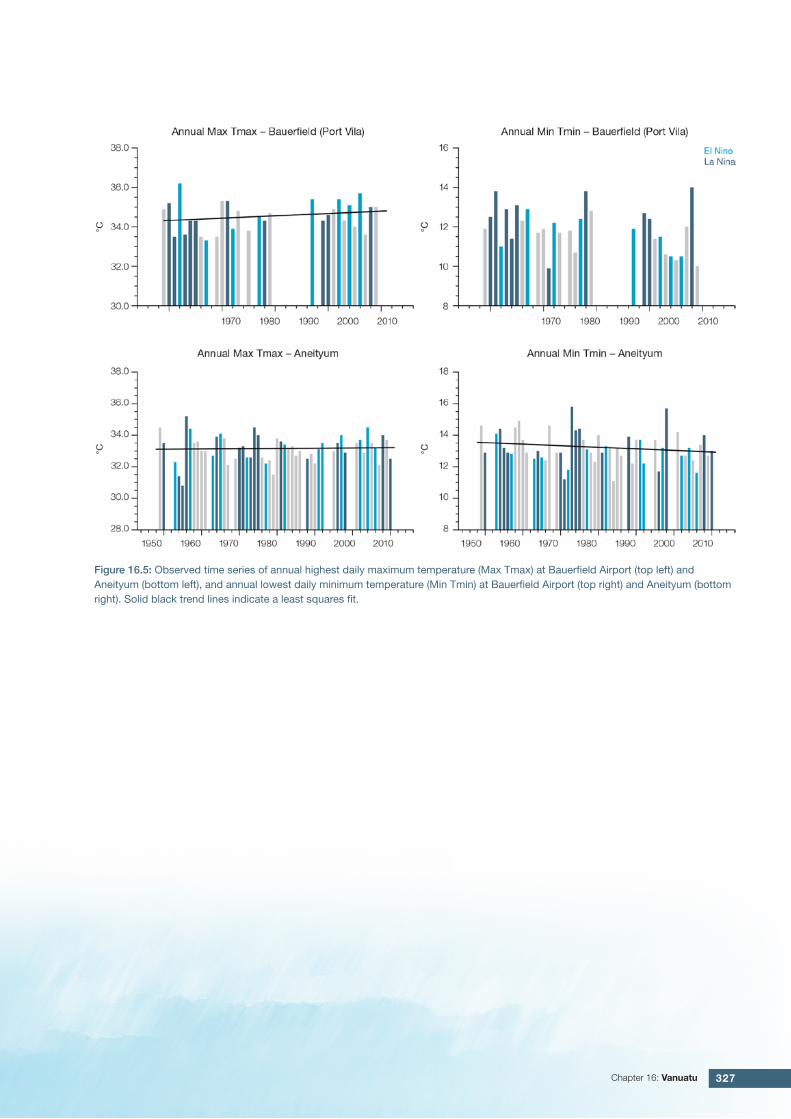
Extreme Daily Air Temperature• Trends in extreme daily air
temperatures at Bauerfield Airport and Aneityum are not statistically significant (where data are available, Table 16.3; Figure 16.5) suggesting there has been little change in extreme day and night-time temperatures at these sites. The Aneityum trends are inconsistent with those in neighbouring countries and may be the result of unresolved inhomogenities in the temperature records.
Table 16.3: Annual trends in air temperature and rainfall extremes at Bauerfield Airport (left) and Aneityum (right). The 95% confidence intervals are shown in brackets. Values for trends significant at the 5% level are shown in boldface. A dash (-) indicates insufficient data for calculating trends.
Bauerfield Airport Aneityum
TEMPERATURE 1969–2011 1949–2011
Minimum Tmin (°C/decade) - -0.10 (-0.30, +0.08)
Maximum Tmin (°C /decade) - +0.02 (-0.08, +0.14)
Minimum Tmax (°C /decade) - +0.15 (-0.04, +0.39)
Maximum Tmax (°C /decade) +0.14 (-0.10, +0.38) 0.00 (-0.20, +0.17)
RAINFALL 1945–2011 1949–2011
Rain Days ≥ 1 mm (days/decade) -1.37 (-5.78, +3.16) -2.64 (-5.71, +0.74)
Very Wet Day rainfall (mm/decade) +28.17 (-35.18, +81.97) +15.55 (-52.73, +80.31)
Consecutive Dry Days (days/decade) 0.00 (-0.47, +0.83) +0.15 (-0.83, +1.13)
Max 1-day rainfall (mm/decade) +5.54 (-1.56, +14.38) +5.97 (-3.15, +15.09)
Minimum Tmin: Annual minimum value of minimum temperature Maximum Tmin: Annual maximum value of maximum temperature Minimum Tmax: Annual minimum value of maximum temperature Maximum Tmax: Annual maximum value of maximum temperatureRain Days ≥ 1 mm: Annual count of days where rainfall is greater or equal to 1 mm (0.039 inches)Very Wet Day rainfall: Amount of rain in a year where daily rainfall is greater than the 95th percentile for the reference period 1971–2000Consecutive Dry Days: Maximum number of consecutive days in a year with rainfall less than 1 mm (0.039 inches)Max 1-day rainfall: Annual maximum 1-day rainfall
16.4.2 Rainfall
Annual and Half-year Total Rainfall
Notable interannual variability associated with the ENSO is evident in the observed rainfall records for Bauerfield Airport since 1907 (Figure 16.3) and Aneityum since 1949 (Figure 16.4). Trends in annual and half-year rainfall presented in Table 16.2, Figure 16.3 and Figure 16.4 are not statistically significant at the 5% level. In other words, annual and half-year rainfall trends show little change at Bauerfield Airport and Aneityum.
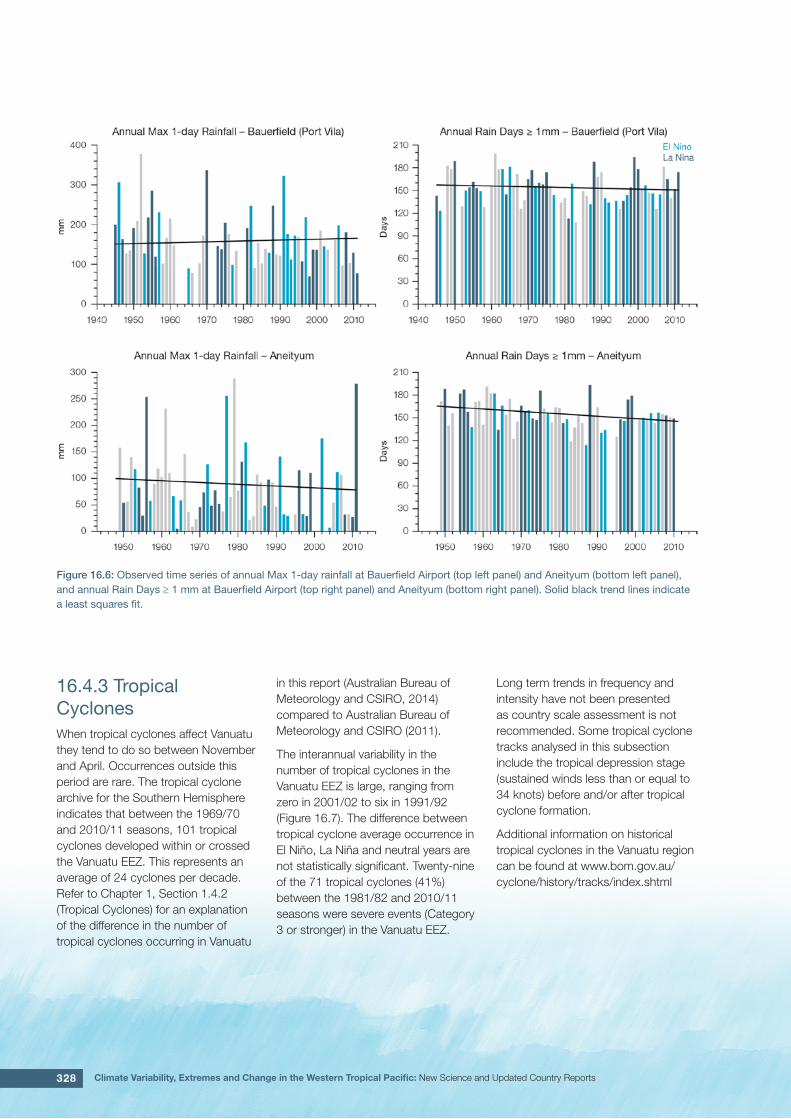
Daily Rainfall
Daily rainfall trends for Bauerfield Airport and Aneityum are presented in Table 16.3. Due to large year-to-year variability, there are no significant trends in the daily rainfall indices. Figure 16.6 shows insignificant trends in the annual Rain Days ≥ 1 mm and Max 1-day rainfall at Bauerfield Airport and Aneityum.
327Chapter 16: Vanuatu
Figure 16.5: Observed time series of annual highest daily maximum temperature (Max Tmax) at Bauerfield Airport (top left) and Aneityum (bottom left), and annual lowest daily minimum temperature (Min Tmin) at Bauerfield Airport (top right) and Aneityum (bottom right). Solid black trend lines indicate a least squares fit.
328 Climate Variability, Extremes and Change in the Western Tropical Pacific: New Science and Updated Country Reports
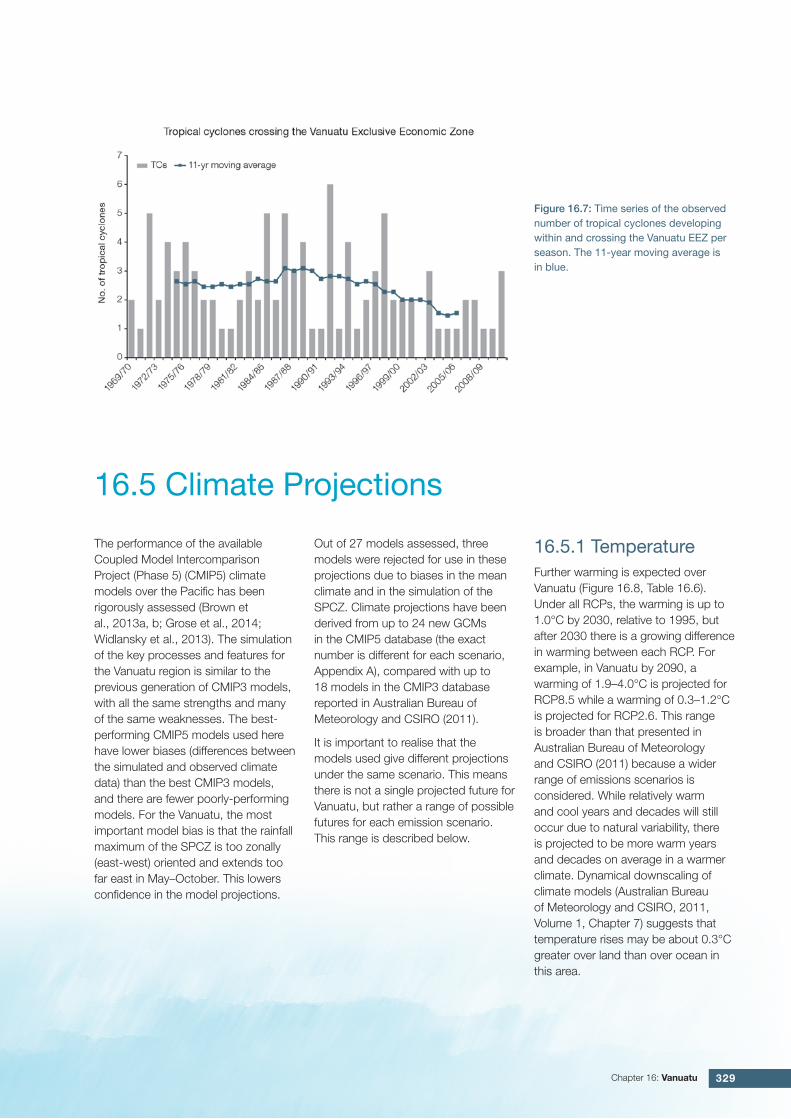
16.4.3 Tropical CyclonesWhen tropical cyclones affect Vanuatu they tend to do so between November and April. Occurrences outside this period are rare. The tropical cyclone archive for the Southern Hemisphere indicates that between the 1969/70 and 2010/11 seasons, 101 tropical cyclones developed within or crossed the Vanuatu EEZ. This represents an average of 24 cyclones per decade. Refer to Chapter 1, Section 1.4.2 (Tropical Cyclones) for an explanation of the difference in the number of tropical cyclones occurring in Vanuatu
in this report (Australian Bureau of Meteorology and CSIRO, 2014) compared to Australian Bureau of Meteorology and CSIRO (2011).
The interannual variability in the number of tropical cyclones in the Vanuatu EEZ is large, ranging from zero in 2001/02 to six in 1991/92 (Figure 16.7). The difference between tropical cyclone average occurrence in El Niño, La Niña and neutral years are not statistically significant. Twenty-nine of the 71 tropical cyclones (41%) between the 1981/82 and 2010/11 seasons were severe events (Category 3 or stronger) in the Vanuatu EEZ.
Figure 16.6: Observed time series of annual Max 1-day rainfall at Bauerfield Airport (top left panel) and Aneityum (bottom left panel), and annual Rain Days ≥ 1 mm at Bauerfield Airport (top right panel) and Aneityum (bottom right panel). Solid black trend lines indicate a least squares fit.
Long term trends in frequency and intensity have not been presented as country scale assessment is not recommended. Some tropical cyclone tracks analysed in this subsection include the tropical depression stage (sustained winds less than or equal to 34 knots) before and/or after tropical cyclone formation.
Additional information on historical tropical cyclones in the Vanuatu region can be found at www.bom.gov.au/cyclone/history/tracks/index.shtml
329Chapter 16: Vanuatu
Figure 16.7: Time series of the observed number of tropical cyclones developing within and crossing the Vanuatu EEZ per season. The 11-year moving average is in blue.
The performance of the available Coupled Model Intercomparison Project (Phase 5) (CMIP5) climate models over the Pacific has been rigorously assessed (Brown et al., 2013a, b; Grose et al., 2014; Widlansky et al., 2013). The simulation of the key processes and features for the Vanuatu region is similar to the previous generation of CMIP3 models, with all the same strengths and many of the same weaknesses. The best-performing CMIP5 models used here have lower biases (differences between the simulated and observed climate data) than the best CMIP3 models, and there are fewer poorly-performing models. For the Vanuatu, the most important model bias is that the rainfall maximum of the SPCZ is too zonally (east-west) oriented and extends too far east in May–October. This lowers confidence in the model projections.
Out of 27 models assessed, three models were rejected for use in these projections due to biases in the mean climate and in the simulation of the SPCZ. Climate projections have been derived from up to 24 new GCMs in the CMIP5 database (the exact number is different for each scenario, Appendix A), compared with up to 18 models in the CMIP3 database reported in Australian Bureau of Meteorology and CSIRO (2011).
It is important to realise that the models used give different projections under the same scenario. This means there is not a single projected future for Vanuatu, but rather a range of possible futures for each emission scenario. This range is described below.
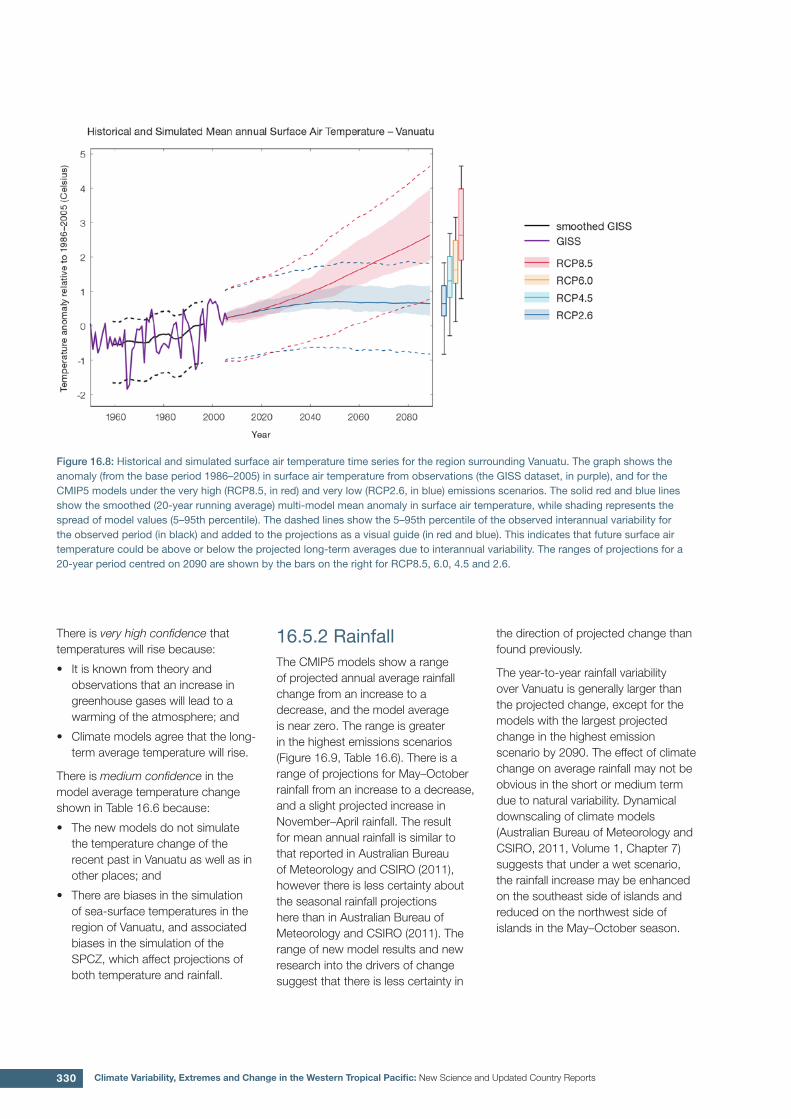
16.5.1 TemperatureFurther warming is expected over Vanuatu (Figure 16.8, Table 16.6). Under all RCPs, the warming is up to 1.0°C by 2030, relative to 1995, but after 2030 there is a growing difference in warming between each RCP. For example, in Vanuatu by 2090, a warming of 1.9–4.0°C is projected for RCP8.5 while a warming of 0.3–1.2°C is projected for RCP2.6. This range is broader than that presented in Australian Bureau of Meteorology and CSIRO (2011) because a wider range of emissions scenarios is considered. While relatively warm and cool years and decades will still occur due to natural variability, there is projected to be more warm years and decades on average in a warmer climate. Dynamical downscaling of climate models (Australian Bureau of Meteorology and CSIRO, 2011, Volume 1, Chapter 7) suggests that temperature rises may be about 0.3°C greater over land than over ocean in this area.
16.5 Climate Projections
330 Climate Variability, Extremes and Change in the Western Tropical Pacific: New Science and Updated Country Reports
Figure 16.8: Historical and simulated surface air temperature time series for the region surrounding Vanuatu. The graph shows the anomaly (from the base period 1986–2005) in surface air temperature from observations (the GISS dataset, in purple), and for the CMIP5 models under the very high (RCP8.5, in red) and very low (RCP2.6, in blue) emissions scenarios. The solid red and blue lines show the smoothed (20-year running average) multi-model mean anomaly in surface air temperature, while shading represents the spread of model values (5–95th percentile). The dashed lines show the 5–95th percentile of the observed interannual variability for the observed period (in black) and added to the projections as a visual guide (in red and blue). This indicates that future surface air temperature could be above or below the projected long-term averages due to interannual variability. The ranges of projections for a 20-year period centred on 2090 are shown by the bars on the right for RCP8.5, 6.0, 4.5 and 2.6.
There is very high confidence that temperatures will rise because:
• It is known from theory and observations that an increase in greenhouse gases will lead to a warming of the atmosphere; and
• Climate models agree that the long-term average temperature will rise.
There is medium confidence in the model average temperature change shown in Table 16.6 because:
• The new models do not simulate the temperature change of the recent past in Vanuatu as well as in other places; and
• There are biases in the simulation of sea-surface temperatures in the region of Vanuatu, and associated biases in the simulation of the SPCZ, which affect projections of both temperature and rainfall.
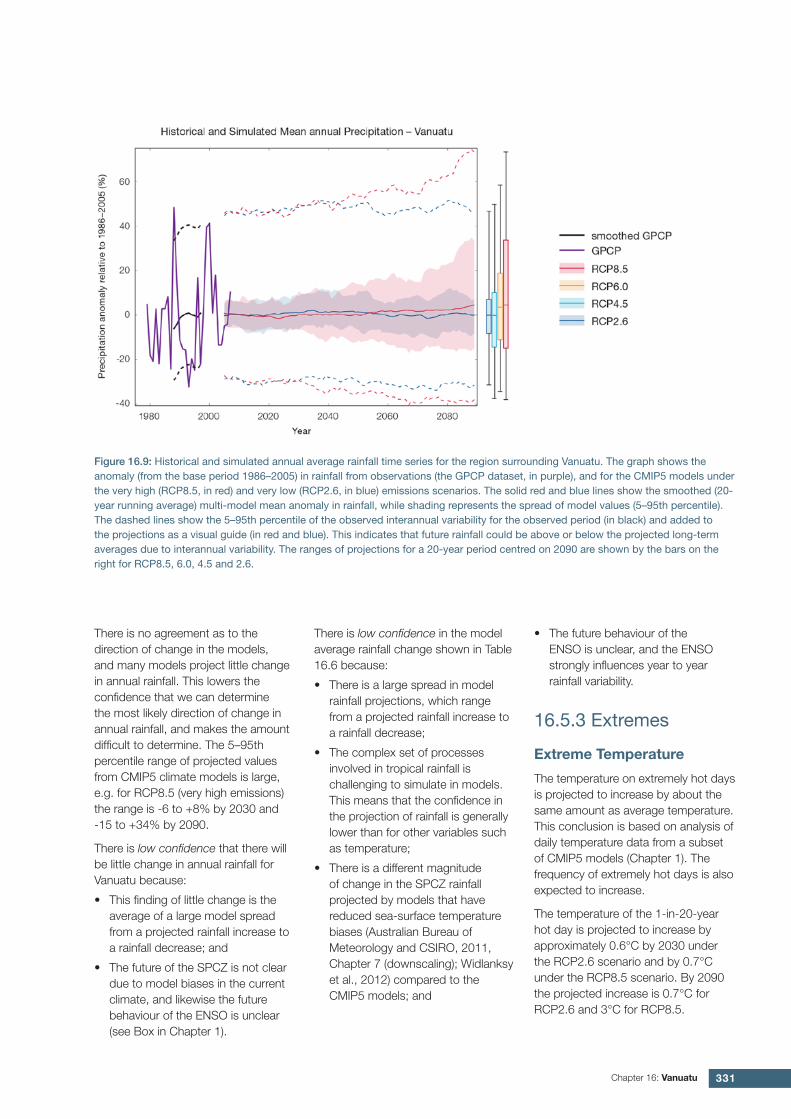
16.5.2 RainfallThe CMIP5 models show a range of projected annual average rainfall change from an increase to a decrease, and the model average is near zero. The range is greater in the highest emissions scenarios (Figure 16.9, Table 16.6). There is a range of projections for May–October rainfall from an increase to a decrease, and a slight projected increase in November–April rainfall. The result for mean annual rainfall is similar to that reported in Australian Bureau of Meteorology and CSIRO (2011), however there is less certainty about the seasonal rainfall projections here than in Australian Bureau of Meteorology and CSIRO (2011). The range of new model results and new research into the drivers of change suggest that there is less certainty in
the direction of projected change than found previously.
The year-to-year rainfall variability over Vanuatu is generally larger than the projected change, except for the models with the largest projected change in the highest emission scenario by 2090. The effect of climate change on average rainfall may not be obvious in the short or medium term due to natural variability. Dynamical downscaling of climate models (Australian Bureau of Meteorology and CSIRO, 2011, Volume 1, Chapter 7) suggests that under a wet scenario, the rainfall increase may be enhanced on the southeast side of islands and reduced on the northwest side of islands in the May–October season.
331Chapter 16: Vanuatu
There is no agreement as to the direction of change in the models, and many models project little change in annual rainfall. This lowers the confidence that we can determine the most likely direction of change in annual rainfall, and makes the amount difficult to determine. The 5–95th percentile range of projected values from CMIP5 climate models is large, e.g. for RCP8.5 (very high emissions) the range is -6 to +8% by 2030 and -15 to +34% by 2090.
There is low confidence that there will be little change in annual rainfall for Vanuatu because:
• This finding of little change is the average of a large model spread from a projected rainfall increase to a rainfall decrease; and
• The future of the SPCZ is not clear due to model biases in the current climate, and likewise the future behaviour of the ENSO is unclear (see Box in Chapter 1).
There is low confidence in the model average rainfall change shown in Table 16.6 because:
• There is a large spread in model rainfall projections, which range from a projected rainfall increase to a rainfall decrease;
• The complex set of processes involved in tropical rainfall is challenging to simulate in models. This means that the confidence in the projection of rainfall is generally lower than for other variables such as temperature;
• There is a different magnitude of change in the SPCZ rainfall projected by models that have reduced sea-surface temperature biases (Australian Bureau of Meteorology and CSIRO, 2011, Chapter 7 (downscaling); Widlanksy et al., 2012) compared to the CMIP5 models; and
• The future behaviour of the ENSO is unclear, and the ENSO strongly influences year to year rainfall variability.
16.5.3 Extremes
Extreme Temperature
The temperature on extremely hot days is projected to increase by about the same amount as average temperature. This conclusion is based on analysis of daily temperature data from a subset of CMIP5 models (Chapter 1). The frequency of extremely hot days is also expected to increase.
The temperature of the 1-in-20-year hot day is projected to increase by approximately 0.6°C by 2030 under the RCP2.6 scenario and by 0.7°C under the RCP8.5 scenario. By 2090 the projected increase is 0.7°C for RCP2.6 and 3°C for RCP8.5.
Figure 16.9: Historical and simulated annual average rainfall time series for the region surrounding Vanuatu. The graph shows the anomaly (from the base period 1986–2005) in rainfall from observations (the GPCP dataset, in purple), and for the CMIP5 models under the very high (RCP8.5, in red) and very low (RCP2.6, in blue) emissions scenarios. The solid red and blue lines show the smoothed (20-year running average) multi-model mean anomaly in rainfall, while shading represents the spread of model values (5–95th percentile). The dashed lines show the 5–95th percentile of the observed interannual variability for the observed period (in black) and added to the projections as a visual guide (in red and blue). This indicates that future rainfall could be above or below the projected long-term averages due to interannual variability. The ranges of projections for a 20-year period centred on 2090 are shown by the bars on the right for RCP8.5, 6.0, 4.5 and 2.6.
332 Climate Variability, Extremes and Change in the Western Tropical Pacific: New Science and Updated Country Reports
There is very high confidence that the temperature of extremely hot days and the temperature of extremely cool days will increase, because:
• A change in the range of temperatures, including the extremes, is physically consistent with rising greenhouse gas concentrations;
• This is consistent with observed changes in extreme temperatures around the world over recent decades (IPCC, 2012); and
• All the CMIP5 models agree on an increase in the frequency and intensity of extremely hot days and a decrease in the frequency and intensity of cool days.
There is low confidence in the magnitude of projected change in extreme temperature because models generally underestimate the current intensity and frequency of extreme events. Changes to the particular driver of extreme temperatures affect whether the change to extremes is more or less than the change in the average temperature, and the changes to the drivers of extreme temperatures in Vanuatu are currently unclear. Also, while all models project the same direction of change there is a wide range in the projected magnitude of change among the models.
Extreme Rainfall
The frequency and intensity of extreme rainfall events are projected to increase. This conclusion is based on analysis of daily rainfall data from a subset of CMIP5 models using a similar method to that in Australian Bureau of Meteorology and CSIRO (2011) with some improvements (Chapter 1), so the results are slightly different to those in Australian Bureau of Meteorology and CSIRO (2011). The current 1-in-20-year daily rainfall amount is projected to increase by approximately 9 mm by 2030 for RCP2.6 and by 8 mm by 2030 for RCP8.5. By 2090, it is projected to increase by approximately 1 mm
for RCP2.6 and by 40 mm for RCP8.5.The majority of models project the current 1-in-20-year daily rainfall event will become, on average, a 1-in-13-year event for RCP2.6 and a 1-in-5-year event for RCP8.5 by 2090. These results are different to those found in Australian Bureau of Meteorology and CSIRO (2011) because of different methods used (Chapter 1).
There is high confidence that the frequency and intensity of extreme rainfall events will increase because:
• A warmer atmosphere can hold more moisture, so there is greater potential for extreme rainfall (IPCC, 2012);
• Consistent with the mixed changes in mean and extreme rainfall indices, the pattern of change in the extreme rainfalls shows considerable variation from station to station. For the lower recurrence intervals (2 and 5 years) there is little systematic change in rainfall intensity. In some contrast the very most extreme rainfall being that occurring with an average recurrence interval of 20 years shows a mean increase of 3.5%, (significant at the 10% level);
• Increases in extreme rainfall in the Pacific are projected in all available climate models; and
• An increase in extreme rainfall events within the SPCZ region was found by an in-depth study of extreme rainfall events in the SPCZ (Cai et al., 2012).
There is low confidence in the magnitude of projected change in extreme rainfall because:
• Models generally underestimate the current intensity of local extreme events, especially in this area due to the ‘cold-tongue bias’ (Chapter 1);
• Changes in extreme rainfall projected by models may be underestimated because models seem to underestimate the observed increase in heavy rainfall with warming (Min et al., 2011);
• GCMs have a coarse spatial resolution, so they do not adequately capture some of the processes involved in extreme rainfall events; and
• The Conformal Cubic Atmospheric Model (CCAM) downscaling model has finer spatial resolution and the CCAM results presented in Australian Bureau of Meteorology and CSIRO (2011) indicates a smaller increase in the number of extreme rainfall days, and there is no clear reason to accept one set of models over another.
Drought
Drought projections (defined in Chapter 1) are described in terms of changes in proportion of time in drought, frequency and duration by 2090 for very low and very high emissions (RCP2.6 and 8.5).
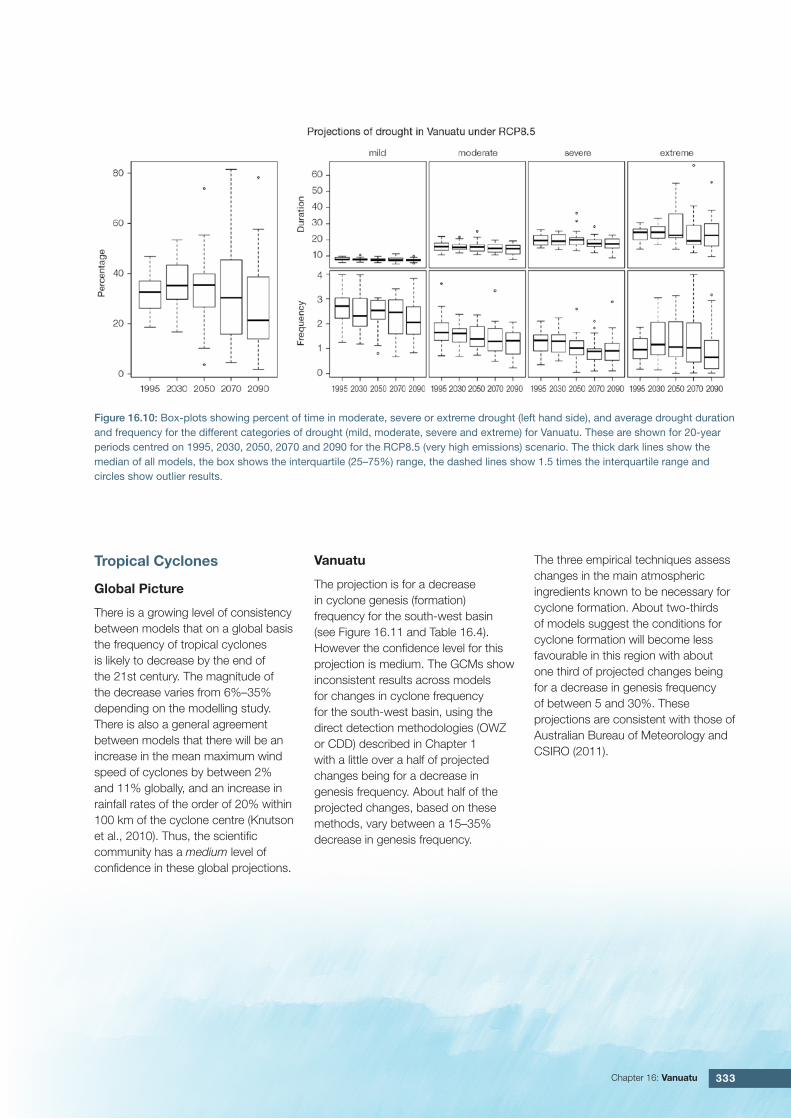
For Vanuatu the overall proportion of time spent in drought is expected to decrease slightly under RCP8.5 and stay approximately the same under all other scenarios. Under RCP8.5 the frequency of drought events in all categories is expected to decrease while the duration of drought events in all categories is expected to remain stable (Figure 16.10). Under RCP2.6 the frequency and duration of drought events in all categories is projected to remain stable.
There is low confidence in this direction of change because:
• There is only low confidence in the direction of mean rainfall change;
• These drought projections are based upon a subset of models; and
• Like the CMIP3 models, the majority of the CMIP5 models agree on this direction of change.
There is low confidence in the projections of drought duration and frequency because there is low confidence in the magnitude of rainfall projections, and no consensus about projected changes in the ENSO, which directly influence the projection of drought.
333Chapter 16: Vanuatu
Tropical Cyclones
Global Picture
There is a growing level of consistency between models that on a global basis the frequency of tropical cyclones is likely to decrease by the end of the 21st century. The magnitude of the decrease varies from 6%–35% depending on the modelling study. There is also a general agreement between models that there will be an increase in the mean maximum wind speed of cyclones by between 2% and 11% globally, and an increase in rainfall rates of the order of 20% within 100 km of the cyclone centre (Knutson et al., 2010). Thus, the scientific community has a medium level of confidence in these global projections.
Vanuatu
The projection is for a decrease in cyclone genesis (formation) frequency for the south-west basin (see Figure 16.11 and Table 16.4). However the confidence level for this projection is medium. The GCMs show inconsistent results across models for changes in cyclone frequency for the south-west basin, using the direct detection methodologies (OWZ or CDD) described in Chapter 1 with a little over a half of projected changes being for a decrease in genesis frequency. About half of the projected changes, based on these methods, vary between a 15–35% decrease in genesis frequency.
The three empirical techniques assess changes in the main atmospheric ingredients known to be necessary for cyclone formation. About two-thirds of models suggest the conditions for cyclone formation will become less favourable in this region with about one third of projected changes being for a decrease in genesis frequency of between 5 and 30%. These projections are consistent with those of Australian Bureau of Meteorology and CSIRO (2011).
Figure 16.10: Box-plots showing percent of time in moderate, severe or extreme drought (left hand side), and average drought duration and frequency for the different categories of drought (mild, moderate, severe and extreme) for Vanuatu. These are shown for 20-year periods centred on 1995, 2030, 2050, 2070 and 2090 for the RCP8.5 (very high emissions) scenario. The thick dark lines show the median of all models, the box shows the interquartile (25–75%) range, the dashed lines show 1.5 times the interquartile range and circles show outlier results.
334 Climate Variability, Extremes and Change in the Western Tropical Pacific: New Science and Updated Country Reports
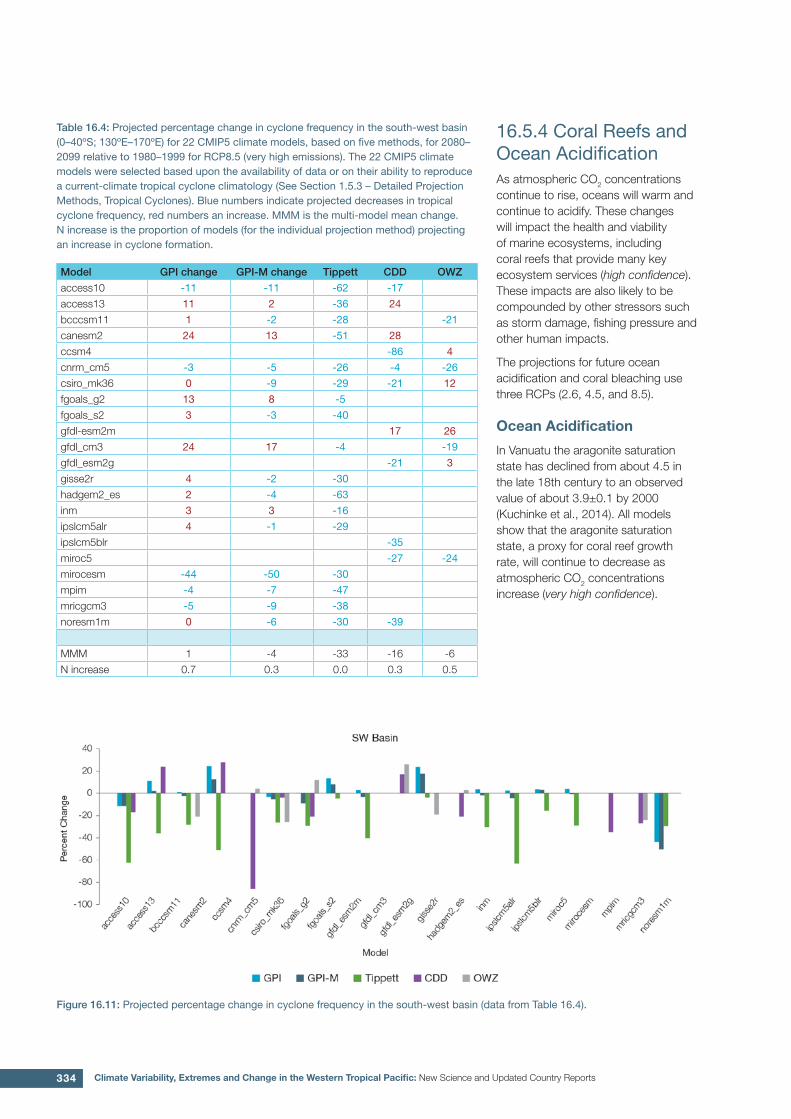
Table 16.4: Projected percentage change in cyclone frequency in the south-west basin (0–40ºS; 130ºE–170ºE) for 22 CMIP5 climate models, based on five methods, for 2080–2099 relative to 1980–1999 for RCP8.5 (very high emissions). The 22 CMIP5 climate models were selected based upon the availability of data or on their ability to reproduce a current-climate tropical cyclone climatology (See Section 1.5.3 – Detailed Projection Methods, Tropical Cyclones). Blue numbers indicate projected decreases in tropical cyclone frequency, red numbers an increase. MMM is the multi-model mean change. N increase is the proportion of models (for the individual projection method) projecting an increase in cyclone formation.
Model GPI change GPI-M change Tippett CDD OWZ
access10 -11 -11 -62 -17
access13 11 2 -36 24
bcccsm11 1 -2 -28 -21
canesm2 24 13 -51 28
ccsm4 -86 4
cnrm_cm5 -3 -5 -26 -4 -26
csiro_mk36 0 -9 -29 -21 12
fgoals_g2 13 8 -5
fgoals_s2 3 -3 -40
gfdl-esm2m 17 26
gfdl_cm3 24 17 -4 -19
gfdl_esm2g -21 3
gisse2r 4 -2 -30
hadgem2_es 2 -4 -63
inm 3 3 -16
ipslcm5alr 4 -1 -29
ipslcm5blr -35
miroc5 -27 -24
mirocesm -44 -50 -30
mpim -4 -7 -47
mricgcm3 -5 -9 -38
noresm1m 0 -6 -30 -39
MMM 1 -4 -33 -16 -6
N increase 0.7 0.3 0.0 0.3 0.5
16.5.4 Coral Reefs and Ocean AcidificationAs atmospheric CO2 concentrations continue to rise, oceans will warm and continue to acidify. These changes will impact the health and viability of marine ecosystems, including coral reefs that provide many key ecosystem services (high confidence). These impacts are also likely to be compounded by other stressors such as storm damage, fishing pressure and other human impacts.
The projections for future ocean acidification and coral bleaching use three RCPs (2.6, 4.5, and 8.5).
Ocean Acidification
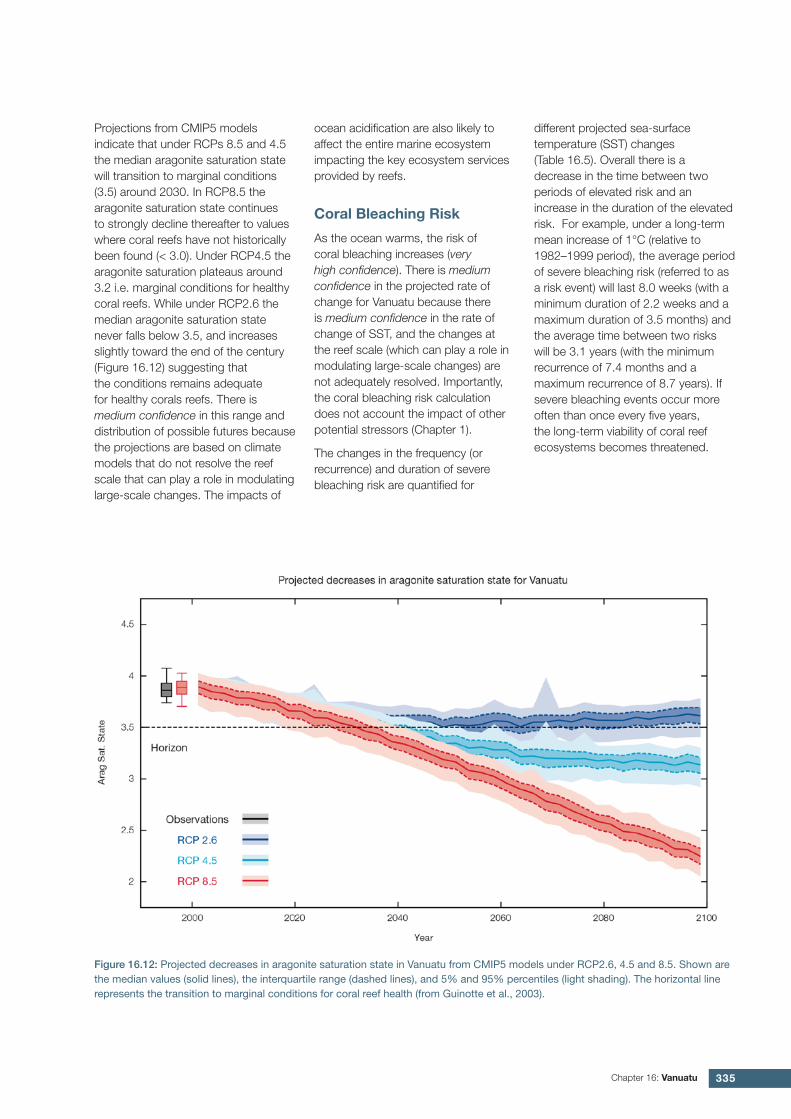
In Vanuatu the aragonite saturation state has declined from about 4.5 in the late 18th century to an observed value of about 3.9±0.1 by 2000 (Kuchinke et al., 2014). All models show that the aragonite saturation state, a proxy for coral reef growth rate, will continue to decrease as atmospheric CO2 concentrations increase (very high confidence).
Figure 16.11: Projected percentage change in cyclone frequency in the south-west basin (data from Table 16.4).
335Chapter 16: Vanuatu
Projections from CMIP5 models indicate that under RCPs 8.5 and 4.5 the median aragonite saturation state will transition to marginal conditions (3.5) around 2030. In RCP8.5 the aragonite saturation state continues to strongly decline thereafter to values where coral reefs have not historically been found (< 3.0). Under RCP4.5 the aragonite saturation plateaus around 3.2 i.e. marginal conditions for healthy coral reefs. While under RCP2.6 the median aragonite saturation state never falls below 3.5, and increases slightly toward the end of the century (Figure 16.12) suggesting that the conditions remains adequate for healthy corals reefs. There is medium confidence in this range and distribution of possible futures because the projections are based on climate models that do not resolve the reef scale that can play a role in modulating large-scale changes. The impacts of
Coral Bleaching Risk
As the ocean warms, the risk of coral bleaching increases (very high confidence). There is medium confidence in the projected rate of change for Vanuatu because there is medium confidence in the rate of change of SST, and the changes at the reef scale (which can play a role in modulating large-scale changes) are not adequately resolved. Importantly, the coral bleaching risk calculation does not account the impact of other potential stressors (Chapter 1).
The changes in the frequency (or recurrence) and duration of severe bleaching risk are quantified for
Figure 16.12: Projected decreases in aragonite saturation state in Vanuatu from CMIP5 models under RCP2.6, 4.5 and 8.5. Shown are the median values (solid lines), the interquartile range (dashed lines), and 5% and 95% percentiles (light shading). The horizontal line represents the transition to marginal conditions for coral reef health (from Guinotte et al., 2003).
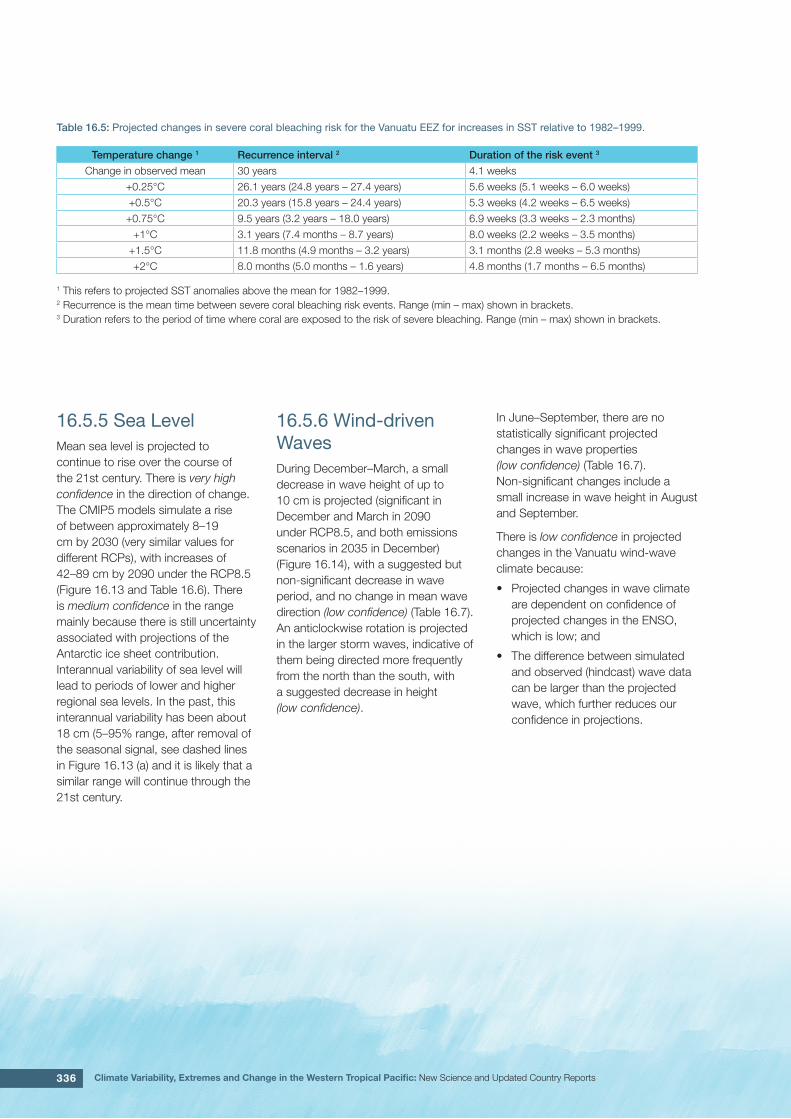
different projected sea-surface temperature (SST) changes (Table 16.5). Overall there is a decrease in the time between two periods of elevated risk and an increase in the duration of the elevated risk. For example, under a long-term mean increase of 1°C (relative to 1982–1999 period), the average period of severe bleaching risk (referred to as a risk event) will last 8.0 weeks (with a minimum duration of 2.2 weeks and a maximum duration of 3.5 months) and the average time between two risks will be 3.1 years (with the minimum recurrence of 7.4 months and a maximum recurrence of 8.7 years). If severe bleaching events occur more often than once every five years, the long-term viability of coral reef ecosystems becomes threatened.
ocean acidification are also likely to affect the entire marine ecosystem impacting the key ecosystem services provided by reefs.
336 Climate Variability, Extremes and Change in the Western Tropical Pacific: New Science and Updated Country Reports
Table 16.5: Projected changes in severe coral bleaching risk for the Vanuatu EEZ for increases in SST relative to 1982–1999.
Temperature change 1 Recurrence interval 2 Duration of the risk event 3
Change in observed mean 30 years 4.1 weeks
+0.25°C 26.1 years (24.8 years – 27.4 years) 5.6 weeks (5.1 weeks – 6.0 weeks)
+0.5°C 20.3 years (15.8 years – 24.4 years) 5.3 weeks (4.2 weeks – 6.5 weeks)
+0.75°C 9.5 years (3.2 years – 18.0 years) 6.9 weeks (3.3 weeks – 2.3 months)
+1°C 3.1 years (7.4 months – 8.7 years) 8.0 weeks (2.2 weeks – 3.5 months)
+1.5°C 11.8 months (4.9 months – 3.2 years) 3.1 months (2.8 weeks – 5.3 months)
+2°C 8.0 months (5.0 months – 1.6 years) 4.8 months (1.7 months – 6.5 months)
1 This refers to projected SST anomalies above the mean for 1982–1999. 2 Recurrence is the mean time between severe coral bleaching risk events. Range (min – max) shown in brackets.3 Duration refers to the period of time where coral are exposed to the risk of severe bleaching. Range (min – max) shown in brackets.
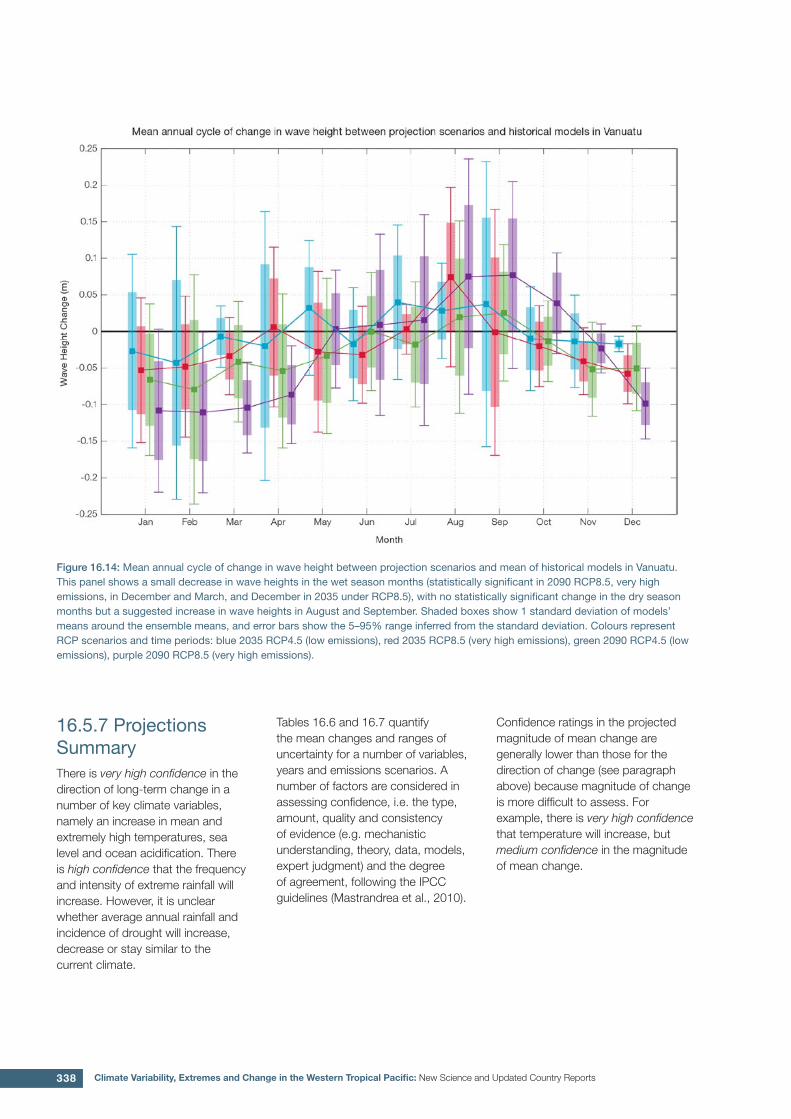
In June–September, there are no statistically significant projected changes in wave properties (low confidence) (Table 16.7). Non-significant changes include a small increase in wave height in August and September.
There is low confidence in projected changes in the Vanuatu wind-wave climate because:
• Projected changes in wave climate are dependent on confidence of projected changes in the ENSO, which is low; and
• The difference between simulated and observed (hindcast) wave data can be larger than the projected wave, which further reduces our confidence in projections.
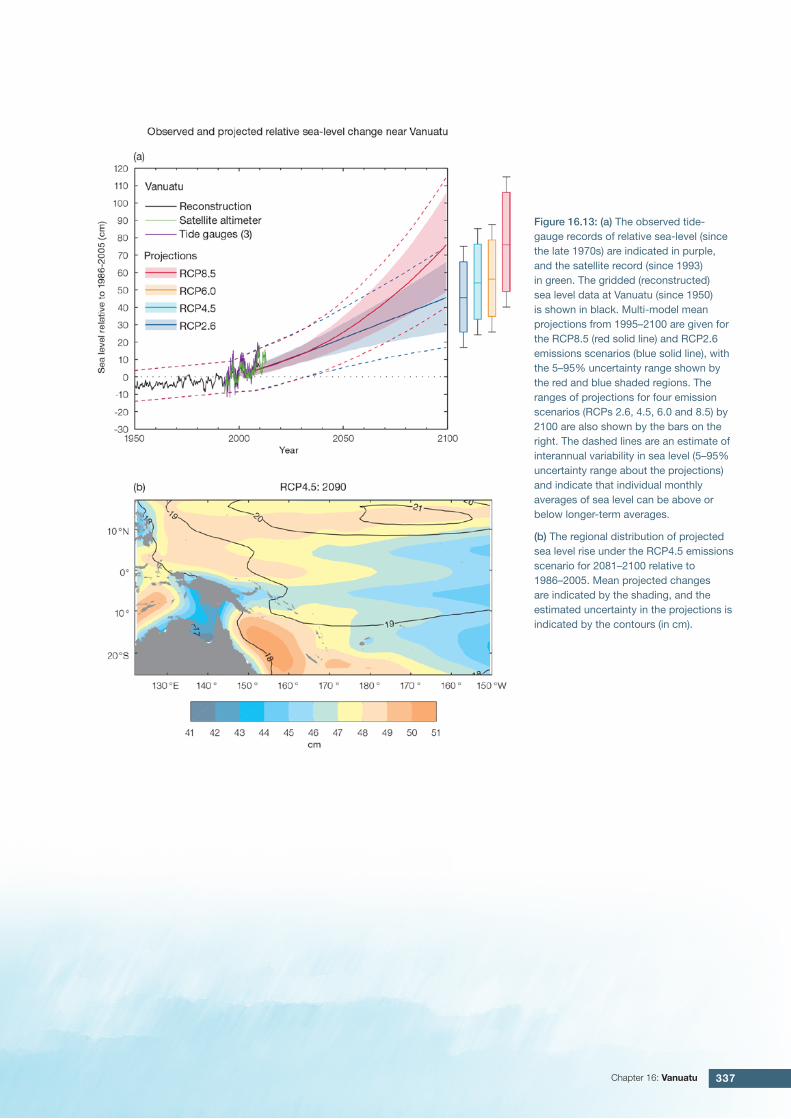
16.5.5 Sea LevelMean sea level is projected to continue to rise over the course of the 21st century. There is very high confidence in the direction of change. The CMIP5 models simulate a rise of between approximately 8–19 cm by 2030 (very similar values for different RCPs), with increases of 42–89 cm by 2090 under the RCP8.5 (Figure 16.13 and Table 16.6). There is medium confidence in the range mainly because there is still uncertainty associated with projections of the Antarctic ice sheet contribution. Interannual variability of sea level will lead to periods of lower and higher regional sea levels. In the past, this interannual variability has been about 18 cm (5–95% range, after removal of the seasonal signal, see dashed lines in Figure 16.13 (a) and it is likely that a similar range will continue through the 21st century.
16.5.6 Wind-driven WavesDuring December–March, a small decrease in wave height of up to 10 cm is projected (significant in December and March in 2090 under RCP8.5, and both emissions scenarios in 2035 in December) (Figure 16.14), with a suggested but non-significant decrease in wave period, and no change in mean wave direction (low confidence) (Table 16.7). An anticlockwise rotation is projected in the larger storm waves, indicative of them being directed more frequently from the north than the south, with a suggested decrease in height (low confidence).
337Chapter 16: Vanuatu
Figure 16.13: (a) The observed tide-gauge records of relative sea-level (since the late 1970s) are indicated in purple, and the satellite record (since 1993) in green. The gridded (reconstructed) sea level data at Vanuatu (since 1950) is shown in black. Multi-model mean projections from 1995–2100 are given for the RCP8.5 (red solid line) and RCP2.6 emissions scenarios (blue solid line), with the 5–95% uncertainty range shown by the red and blue shaded regions. The ranges of projections for four emission scenarios (RCPs 2.6, 4.5, 6.0 and 8.5) by 2100 are also shown by the bars on the right. The dashed lines are an estimate of interannual variability in sea level (5–95% uncertainty range about the projections) and indicate that individual monthly averages of sea level can be above or below longer-term averages.
(b) The regional distribution of projected sea level rise under the RCP4.5 emissions scenario for 2081–2100 relative to 1986–2005. Mean projected changes are indicated by the shading, and the estimated uncertainty in the projections is indicated by the contours (in cm).
338 Climate Variability, Extremes and Change in the Western Tropical Pacific: New Science and Updated Country Reports
16.5.7 Projections SummaryThere is very high confidence in the direction of long-term change in a number of key climate variables, namely an increase in mean and extremely high temperatures, sea level and ocean acidification. There is high confidence that the frequency and intensity of extreme rainfall will increase. However, it is unclear whether average annual rainfall and incidence of drought will increase, decrease or stay similar to the current climate.
Tables 16.6 and 16.7 quantify the mean changes and ranges of uncertainty for a number of variables, years and emissions scenarios. A number of factors are considered in assessing confidence, i.e. the type, amount, quality and consistency of evidence (e.g. mechanistic understanding, theory, data, models, expert judgment) and the degree of agreement, following the IPCC guidelines (Mastrandrea et al., 2010).
Figure 16.14: Mean annual cycle of change in wave height between projection scenarios and mean of historical models in Vanuatu. This panel shows a small decrease in wave heights in the wet season months (statistically significant in 2090 RCP8.5, very high emissions, in December and March, and December in 2035 under RCP8.5), with no statistically significant change in the dry season months but a suggested increase in wave heights in August and September. Shaded boxes show 1 standard deviation of models’ means around the ensemble means, and error bars show the 5–95% range inferred from the standard deviation. Colours represent RCP scenarios and time periods: blue 2035 RCP4.5 (low emissions), red 2035 RCP8.5 (very high emissions), green 2090 RCP4.5 (low emissions), purple 2090 RCP8.5 (very high emissions).
Confidence ratings in the projected magnitude of mean change are generally lower than those for the direction of change (see paragraph above) because magnitude of change is more difficult to assess. For example, there is very high confidence that temperature will increase, but medium confidence in the magnitude of mean change.
339Chapter 16: Vanuatu
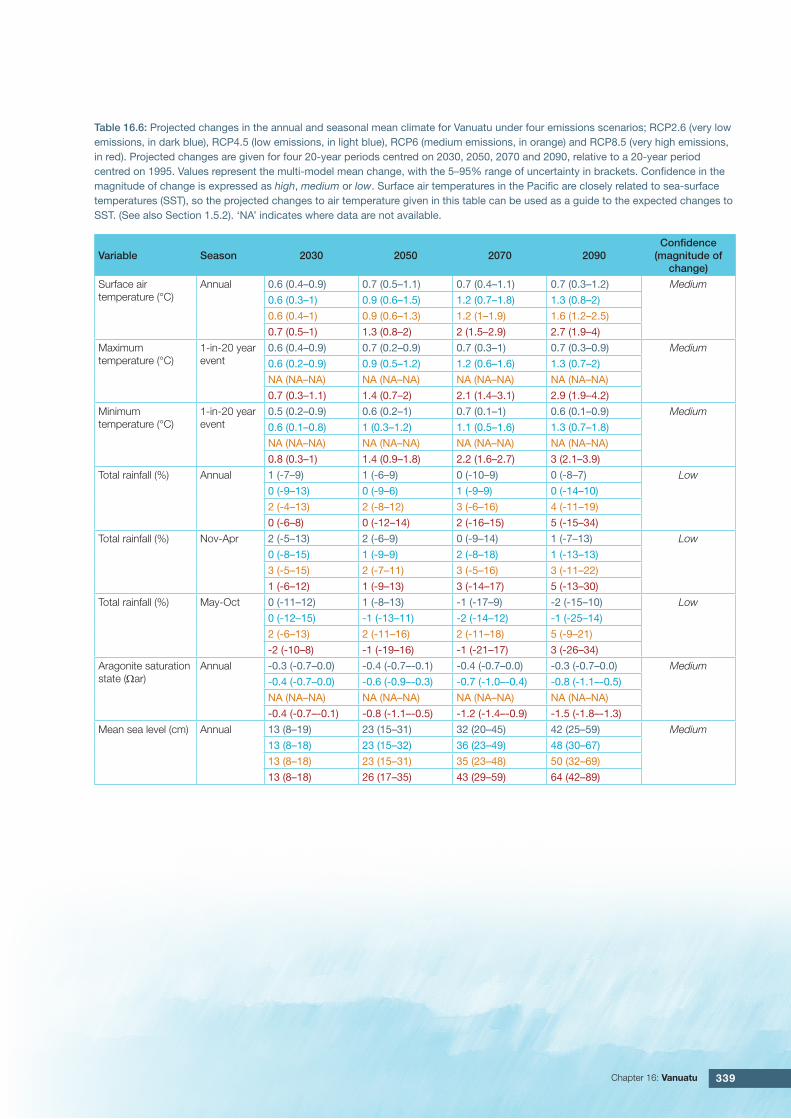
Table 16.6: Projected changes in the annual and seasonal mean climate for Vanuatu under four emissions scenarios; RCP2.6 (very low emissions, in dark blue), RCP4.5 (low emissions, in light blue), RCP6 (medium emissions, in orange) and RCP8.5 (very high emissions, in red). Projected changes are given for four 20-year periods centred on 2030, 2050, 2070 and 2090, relative to a 20-year period centred on 1995. Values represent the multi-model mean change, with the 5–95% range of uncertainty in brackets. Confidence in the magnitude of change is expressed as high, medium or low. Surface air temperatures in the Pacific are closely related to sea-surface temperatures (SST), so the projected changes to air temperature given in this table can be used as a guide to the expected changes to SST. (See also Section 1.5.2). ‘NA’ indicates where data are not available.
Variable Season 2030 2050 2070 2090Confidence
(magnitude of change)
Surface air temperature (°C)
Annual 0.6 (0.4–0.9) 0.7 (0.5–1.1) 0.7 (0.4–1.1) 0.7 (0.3–1.2) Medium
0.6 (0.3–1) 0.9 (0.6–1.5) 1.2 (0.7–1.8) 1.3 (0.8–2)
0.6 (0.4–1) 0.9 (0.6–1.3) 1.2 (1–1.9) 1.6 (1.2–2.5)
0.7 (0.5–1) 1.3 (0.8–2) 2 (1.5–2.9) 2.7 (1.9–4)
Maximum temperature (°C)
1-in-20 year event
0.6 (0.4–0.9) 0.7 (0.2–0.9) 0.7 (0.3–1) 0.7 (0.3–0.9) Medium
0.6 (0.2–0.9) 0.9 (0.5–1.2) 1.2 (0.6–1.6) 1.3 (0.7–2)
NA (NA–NA) NA (NA–NA) NA (NA–NA) NA (NA–NA)
0.7 (0.3–1.1) 1.4 (0.7–2) 2.1 (1.4–3.1) 2.9 (1.9–4.2)
Minimum temperature (°C)
1-in-20 year event
0.5 (0.2–0.9) 0.6 (0.2–1) 0.7 (0.1–1) 0.6 (0.1–0.9) Medium
0.6 (0.1–0.8) 1 (0.3–1.2) 1.1 (0.5–1.6) 1.3 (0.7–1.8)
NA (NA–NA) NA (NA–NA) NA (NA–NA) NA (NA–NA)
0.8 (0.3–1) 1.4 (0.9–1.8) 2.2 (1.6–2.7) 3 (2.1–3.9)
Total rainfall (%) Annual 1 (-7–9) 1 (-6–9) 0 (-10–9) 0 (-8–7) Low
0 (-9–13) 0 (-9–6) 1 (-9–9) 0 (-14–10)
2 (-4–13) 2 (-8–12) 3 (-6–16) 4 (-11–19)
0 (-6–8) 0 (-12–14) 2 (-16–15) 5 (-15–34)
Total rainfall (%) Nov-Apr 2 (-5–13) 2 (-6–9) 0 (-9–14) 1 (-7–13) Low
0 (-8–15) 1 (-9–9) 2 (-8–18) 1 (-13–13)
3 (-5–15) 2 (-7–11) 3 (-5–16) 3 (-11–22)
1 (-6–12) 1 (-9–13) 3 (-14–17) 5 (-13–30)
Total rainfall (%) May-Oct 0 (-11–12) 1 (-8–13) -1 (-17–9) -2 (-15–10) Low
0 (-12–15) -1 (-13–11) -2 (-14–12) -1 (-25–14)
2 (-6–13) 2 (-11–16) 2 (-11–18) 5 (-9–21)
-2 (-10–8) -1 (-19–16) -1 (-21–17) 3 (-26–34)
Aragonite saturation state (Ωar)
Annual -0.3 (-0.7–0.0) -0.4 (-0.7–-0.1) -0.4 (-0.7–0.0) -0.3 (-0.7–0.0) Medium
-0.4 (-0.7–0.0) -0.6 (-0.9–-0.3) -0.7 (-1.0–-0.4) -0.8 (-1.1–-0.5)
NA (NA–NA) NA (NA–NA) NA (NA–NA) NA (NA–NA)
-0.4 (-0.7–-0.1) -0.8 (-1.1–-0.5) -1.2 (-1.4–-0.9) -1.5 (-1.8–-1.3)
Mean sea level (cm) Annual 13 (8–19) 23 (15–31) 32 (20–45) 42 (25–59) Medium
13 (8–18) 23 (15–32) 36 (23–49) 48 (30–67)
13 (8–18) 23 (15–31) 35 (23–48) 50 (32–69)
13 (8–18) 26 (17–35) 43 (29–59) 64 (42–89)
340 Climate Variability, Extremes and Change in the Western Tropical Pacific: New Science and Updated Country Reports
Waves Projections Summary
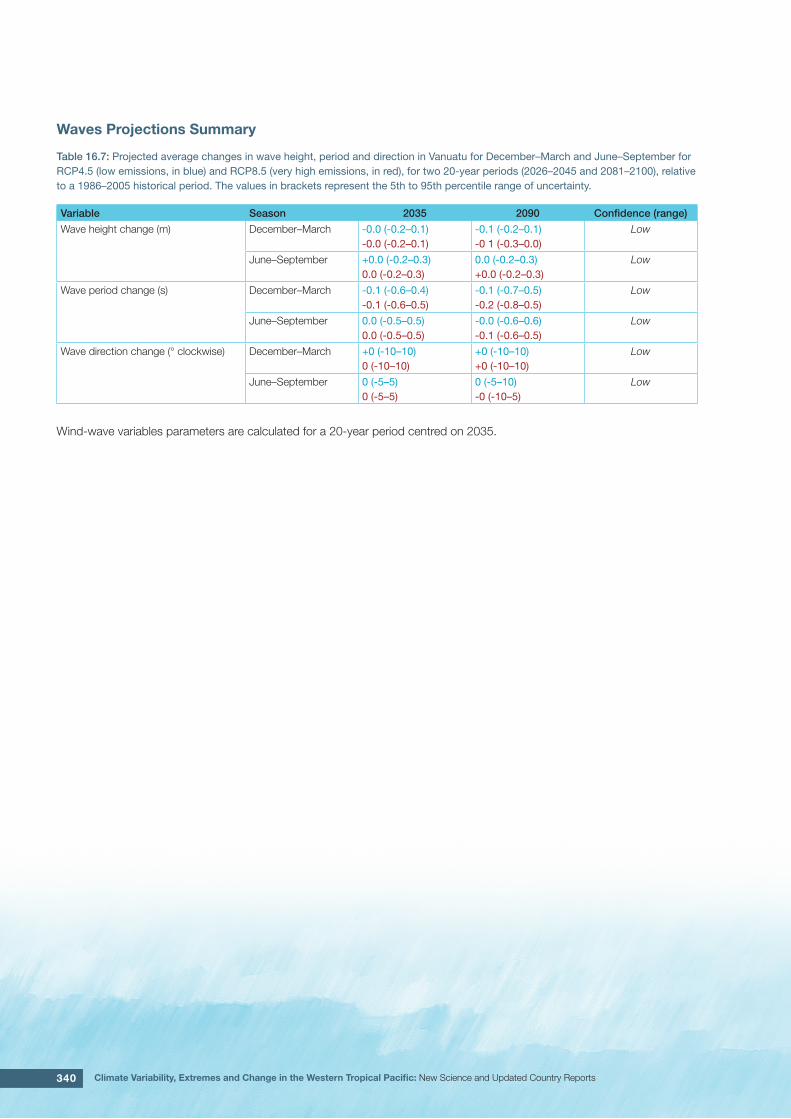
Table 16.7: Projected average changes in wave height, period and direction in Vanuatu for December–March and June–September for RCP4.5 (low emissions, in blue) and RCP8.5 (very high emissions, in red), for two 20-year periods (2026–2045 and 2081–2100), relative to a 1986–2005 historical period. The values in brackets represent the 5th to 95th percentile range of uncertainty.
Variable Season 2035 2090 Confidence (range)
Wave height change (m) December–March -0.0 (-0.2–0.1)-0.0 (-0.2–0.1)
-0.1 (-0.2–0.1)-0 1 (-0.3–0.0)
Low
June–September +0.0 (-0.2–0.3)0.0 (-0.2–0.3)
0.0 (-0.2–0.3)+0.0 (-0.2–0.3)
Low
Wave period change (s) December–March -0.1 (-0.6–0.4)-0.1 (-0.6–0.5)
-0.1 (-0.7–0.5)-0.2 (-0.8–0.5)
Low
June–September 0.0 (-0.5–0.5)0.0 (-0.5–0.5)
-0.0 (-0.6–0.6)-0.1 (-0.6–0.5)
Low
Wave direction change (° clockwise) December–March +0 (-10–10)0 (-10–10)
+0 (-10–10)+0 (-10–10)
Low
June–September 0 (-5–5)0 (-5–5)
0 (-5–10)-0 (-10–5)
Low
Wind-wave variables parameters are calculated for a 20-year period centred on 2035.